Hidden Springs, ID Map & Demographics
Hidden Springs Map
Hidden Springs Overview
$61,499
PER CAPITA INCOME
$133,264
AVG FAMILY INCOME
$152,328
AVG HOUSEHOLD INCOME
48.8%
WAGE / INCOME GAP [ % ]
51.2¢/ $1
WAGE / INCOME GAP [ $ ]
0.45
INEQUALITY / GINI INDEX
3,584
TOTAL POPULATION
1,970
MALE POPULATION
1,614
FEMALE POPULATION
122.06
MALES / 100 FEMALES
81.93
FEMALES / 100 MALES
38.1
MEDIAN AGE
3.4
AVG FAMILY SIZE
3.3
AVG HOUSEHOLD SIZE
1,578
LABOR FORCE [ PEOPLE ]
61.9%
PERCENT IN LABOR FORCE
1.6%
UNEMPLOYMENT RATE
Hidden Springs Area Codes
Income in Hidden Springs
Income Overview in Hidden Springs
Per Capita Income in Hidden Springs is $61,499, while median incomes of families and households are $133,264 and $152,328 respectively.
| Characteristic | Number | Measure |
| Per Capita Income | 3,584 | $61,499 |
| Median Family Income | 1,001 | $133,264 |
| Mean Family Income | 1,001 | $198,114 |
| Median Household Income | 1,072 | $152,328 |
| Mean Household Income | 1,072 | $200,967 |
| Income Deficit | 1,001 | $0 |
| Wage / Income Gap (%) | 3,584 | 48.82% |
| Wage / Income Gap ($) | 3,584 | 51.18¢ per $1 |
| Gini / Inequality Index | 3,584 | 0.45 |
Earnings by Sex in Hidden Springs
Average Earnings in Hidden Springs are $68,729, $91,964 for men and $47,063 for women, a difference of 48.8%.
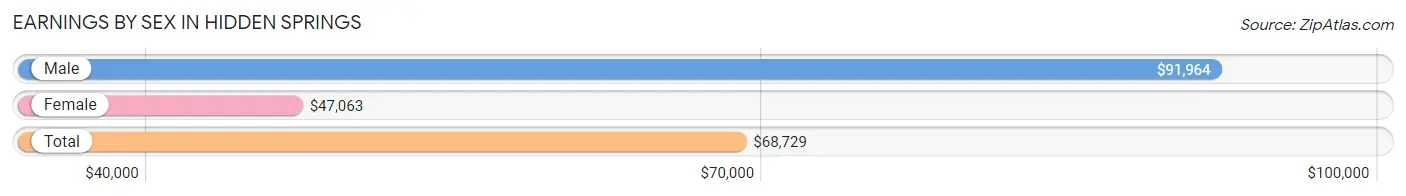
| Sex | Number | Average Earnings |
| Male | 1,076 (62.8%) | $91,964 |
| Female | 637 (37.2%) | $47,063 |
| Total | 1,713 (100.0%) | $68,729 |
Earnings by Sex by Income Bracket in Hidden Springs
The most common earnings brackets in Hidden Springs are $100,000+ for men (521 | 48.4%) and $100,000+ for women (119 | 18.7%).
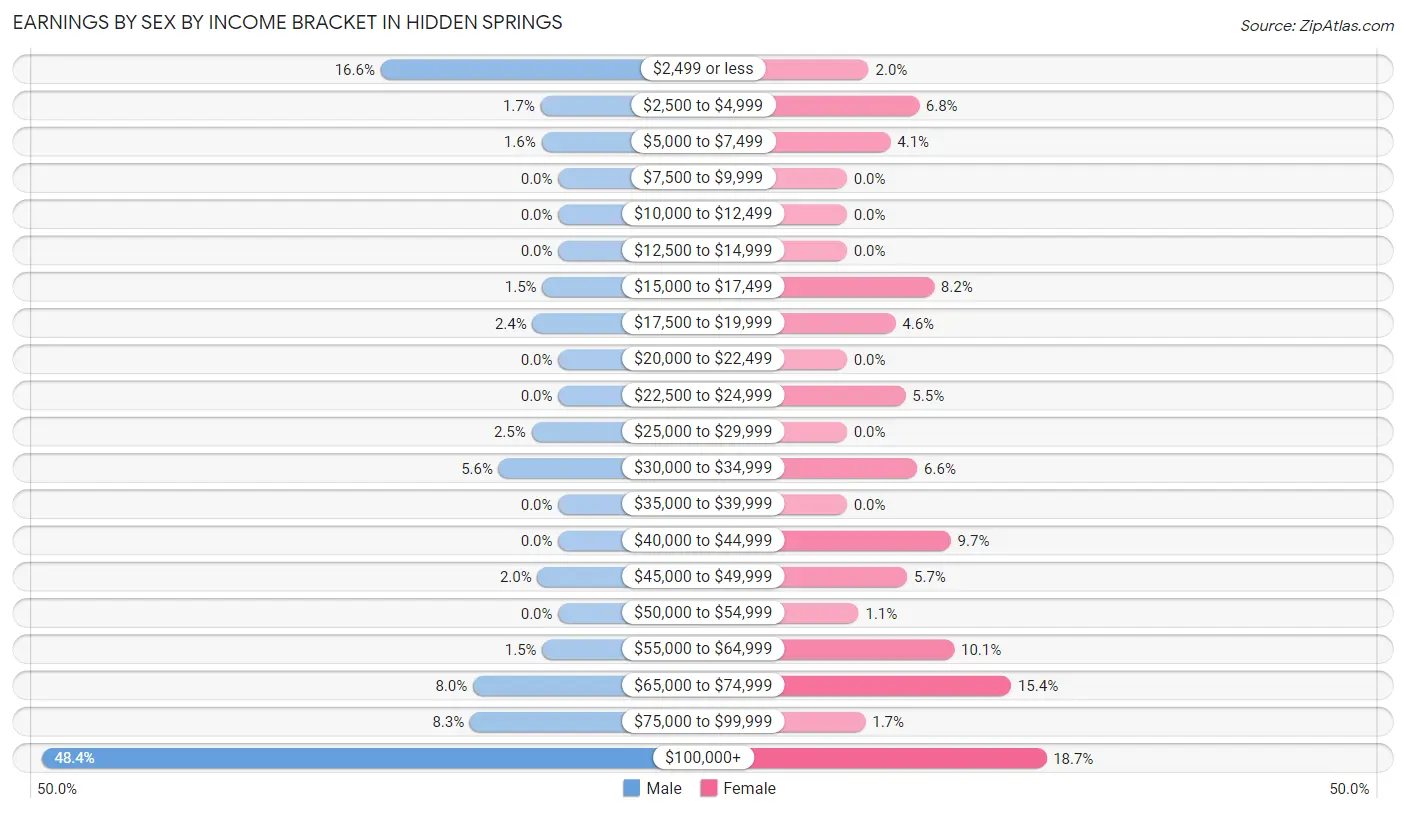
| Income | Male | Female |
| $2,499 or less | 179 (16.6%) | 13 (2.0%) |
| $2,500 to $4,999 | 18 (1.7%) | 43 (6.8%) |
| $5,000 to $7,499 | 17 (1.6%) | 26 (4.1%) |
| $7,500 to $9,999 | 0 (0.0%) | 0 (0.0%) |
| $10,000 to $12,499 | 0 (0.0%) | 0 (0.0%) |
| $12,500 to $14,999 | 0 (0.0%) | 0 (0.0%) |
| $15,000 to $17,499 | 16 (1.5%) | 52 (8.2%) |
| $17,500 to $19,999 | 26 (2.4%) | 29 (4.5%) |
| $20,000 to $22,499 | 0 (0.0%) | 0 (0.0%) |
| $22,500 to $24,999 | 0 (0.0%) | 35 (5.5%) |
| $25,000 to $29,999 | 27 (2.5%) | 0 (0.0%) |
| $30,000 to $34,999 | 60 (5.6%) | 42 (6.6%) |
| $35,000 to $39,999 | 0 (0.0%) | 0 (0.0%) |
| $40,000 to $44,999 | 0 (0.0%) | 62 (9.7%) |
| $45,000 to $49,999 | 21 (1.9%) | 36 (5.7%) |
| $50,000 to $54,999 | 0 (0.0%) | 7 (1.1%) |
| $55,000 to $64,999 | 16 (1.5%) | 64 (10.1%) |
| $65,000 to $74,999 | 86 (8.0%) | 98 (15.4%) |
| $75,000 to $99,999 | 89 (8.3%) | 11 (1.7%) |
| $100,000+ | 521 (48.4%) | 119 (18.7%) |
| Total | 1,076 (100.0%) | 637 (100.0%) |
Earnings by Sex by Educational Attainment in Hidden Springs
Average earnings in Hidden Springs are $118,100 for men and $53,214 for women, a difference of 54.9%. Men with an educational attainment of graduate degree enjoy the highest average annual earnings of $155,853, while those with college or associate's degree education earn the least with $73,214. Women with an educational attainment of bachelor's degree earn the most with the average annual earnings of $43,750, while those with bachelor's degree education have the smallest earnings of $43,750.
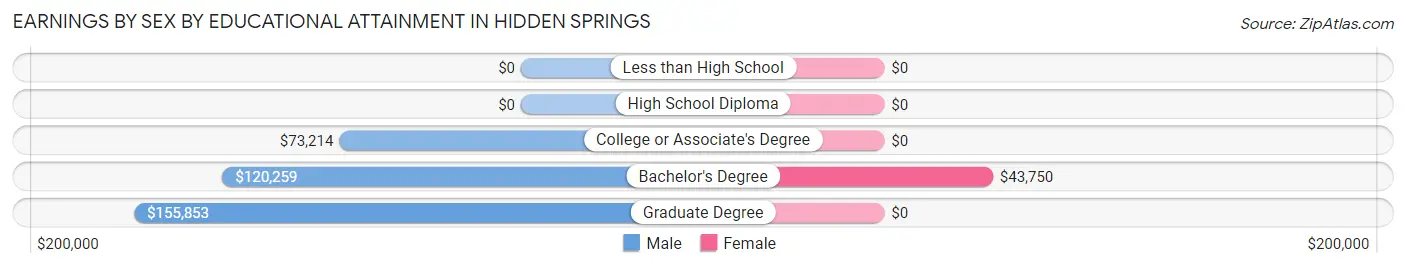
| Educational Attainment | Male Income | Female Income |
| Less than High School | - | - |
| High School Diploma | - | - |
| College or Associate's Degree | $73,214 | $0 |
| Bachelor's Degree | $120,259 | $43,750 |
| Graduate Degree | $155,853 | $0 |
| Total | $118,100 | $53,214 |
Family Income in Hidden Springs
Family Income Brackets in Hidden Springs
According to the Hidden Springs family income data, there are 355 families falling into the $200,000+ income range, which is the most common income bracket and makes up 35.5% of all families.
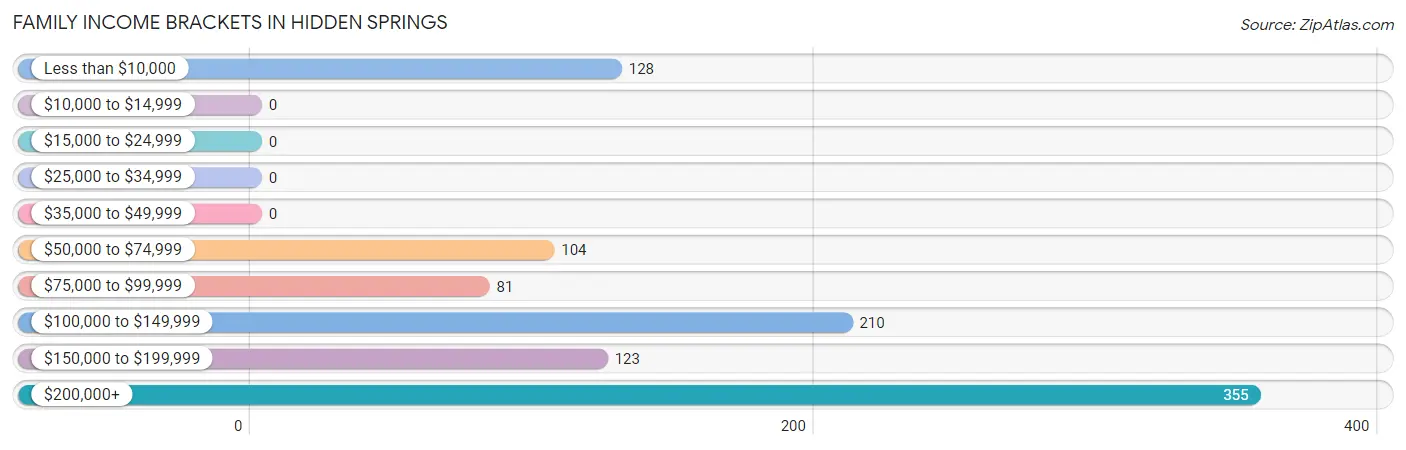
| Income Bracket | # Families | % Families |
| Less than $10,000 | 128 | 12.8% |
| $10,000 to $14,999 | 0 | 0.0% |
| $15,000 to $24,999 | 0 | 0.0% |
| $25,000 to $34,999 | 0 | 0.0% |
| $35,000 to $49,999 | 0 | 0.0% |
| $50,000 to $74,999 | 104 | 10.4% |
| $75,000 to $99,999 | 81 | 8.1% |
| $100,000 to $149,999 | 210 | 21.0% |
| $150,000 to $199,999 | 123 | 12.3% |
| $200,000+ | 355 | 35.5% |
Family Income by Famaliy Size in Hidden Springs
4-person families (303 | 30.3%) account for the highest median family income in Hidden Springs with $207,620 per family, while 4-person families (303 | 30.3%) have the highest median income of $51,905 per family member.
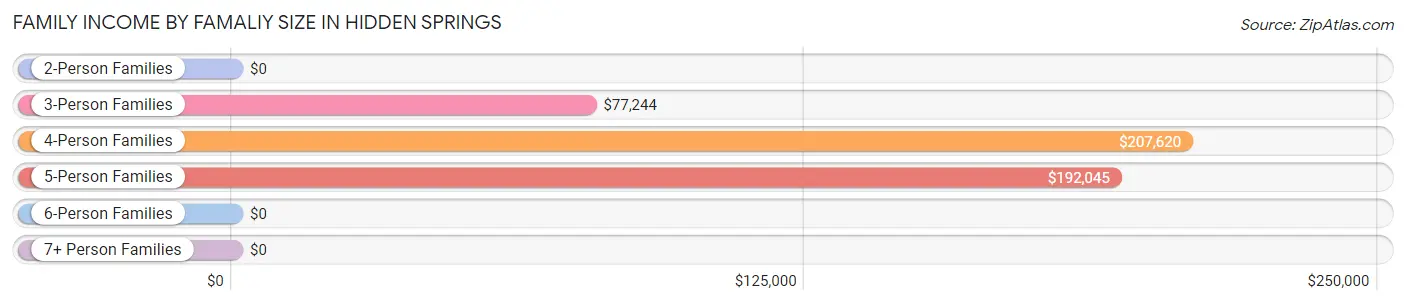
| Income Bracket | # Families | Median Income |
| 2-Person Families | 352 (35.2%) | $0 |
| 3-Person Families | 160 (16.0%) | $77,244 |
| 4-Person Families | 303 (30.3%) | $207,620 |
| 5-Person Families | 178 (17.8%) | $192,045 |
| 6-Person Families | 8 (0.8%) | $0 |
| 7+ Person Families | 0 (0.0%) | $0 |
| Total | 1,001 (100.0%) | $133,264 |
Family Income by Number of Earners in Hidden Springs
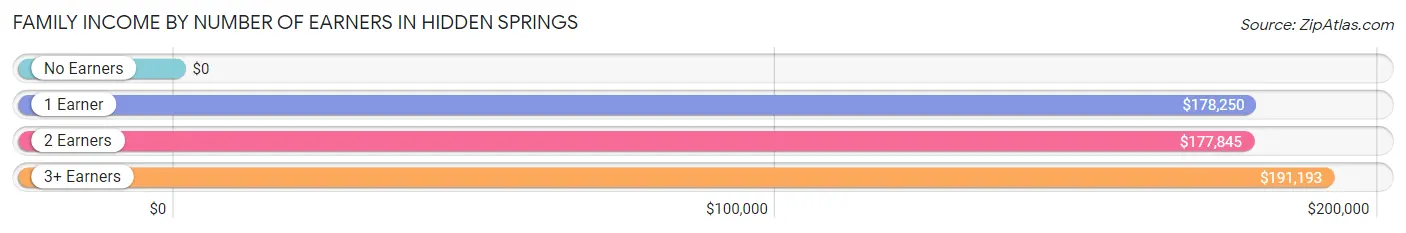
| Number of Earners | # Families | Median Income |
| No Earners | 197 (19.7%) | $0 |
| 1 Earner | 257 (25.7%) | $178,250 |
| 2 Earners | 406 (40.6%) | $177,845 |
| 3+ Earners | 141 (14.1%) | $191,193 |
| Total | 1,001 (100.0%) | $133,264 |
Household Income in Hidden Springs
Household Income Brackets in Hidden Springs
With 394 households falling in the category, the $200,000+ income range is the most frequent in Hidden Springs, accounting for 36.7% of all households.
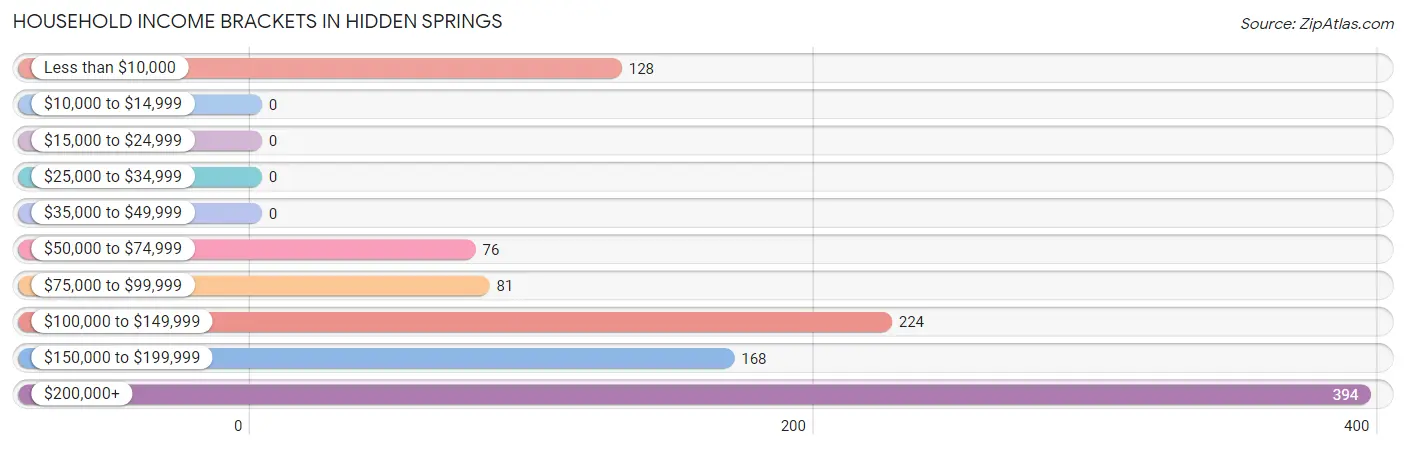
| Income Bracket | # Households | % Households |
| Less than $10,000 | 128 | 11.9% |
| $10,000 to $14,999 | 0 | 0.0% |
| $15,000 to $24,999 | 0 | 0.0% |
| $25,000 to $34,999 | 0 | 0.0% |
| $35,000 to $49,999 | 0 | 0.0% |
| $50,000 to $74,999 | 76 | 7.1% |
| $75,000 to $99,999 | 81 | 7.6% |
| $100,000 to $149,999 | 224 | 20.9% |
| $150,000 to $199,999 | 168 | 15.7% |
| $200,000+ | 394 | 36.8% |
Household Income by Householder Age in Hidden Springs
The median household income in Hidden Springs is $152,328, with the highest median household income of $250,001 found in the 25 to 44 years age bracket for the primary householder. A total of 358 households (33.4%) fall into this category.
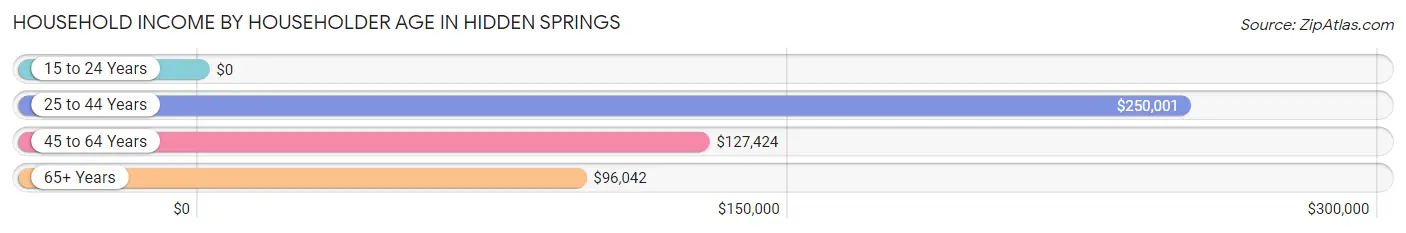
| Income Bracket | # Households | Median Income |
| 15 to 24 Years | 0 (0.0%) | $0 |
| 25 to 44 Years | 358 (33.4%) | $250,001 |
| 45 to 64 Years | 566 (52.8%) | $127,424 |
| 65+ Years | 148 (13.8%) | $96,042 |
| Total | 1,072 (100.0%) | $152,328 |
Poverty in Hidden Springs
Income Below Poverty by Sex and Age in Hidden Springs
With 6.4% poverty level for males and 7.9% for females among the residents of Hidden Springs, 55 to 64 year old males and 55 to 64 year old females are the most vulnerable to poverty, with 106 males (46.7%) and 128 females (53.8%) in their respective age groups living below the poverty level.
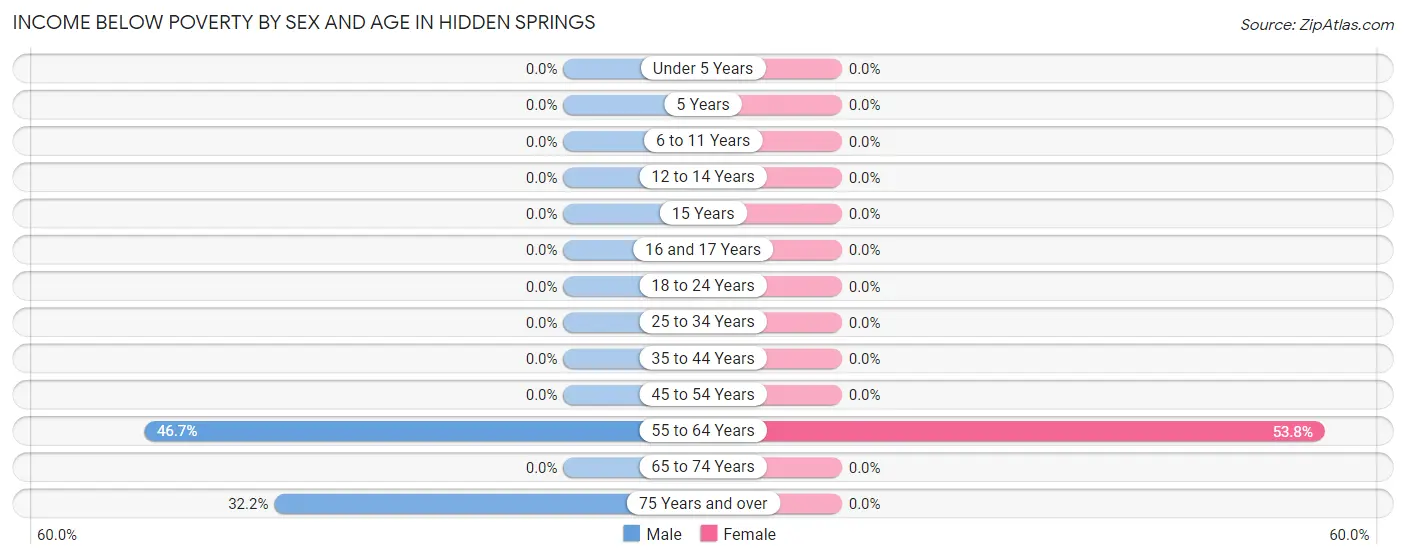
| Age Bracket | Male | Female |
| Under 5 Years | 0 (0.0%) | 0 (0.0%) |
| 5 Years | 0 (0.0%) | 0 (0.0%) |
| 6 to 11 Years | 0 (0.0%) | 0 (0.0%) |
| 12 to 14 Years | 0 (0.0%) | 0 (0.0%) |
| 15 Years | 0 (0.0%) | 0 (0.0%) |
| 16 and 17 Years | 0 (0.0%) | 0 (0.0%) |
| 18 to 24 Years | 0 (0.0%) | 0 (0.0%) |
| 25 to 34 Years | 0 (0.0%) | 0 (0.0%) |
| 35 to 44 Years | 0 (0.0%) | 0 (0.0%) |
| 45 to 54 Years | 0 (0.0%) | 0 (0.0%) |
| 55 to 64 Years | 106 (46.7%) | 128 (53.8%) |
| 65 to 74 Years | 0 (0.0%) | 0 (0.0%) |
| 75 Years and over | 19 (32.2%) | 0 (0.0%) |
| Total | 125 (6.4%) | 128 (7.9%) |
Income Above Poverty by Sex and Age in Hidden Springs
According to the poverty statistics in Hidden Springs, males aged under 5 years and females aged under 5 years are the age groups that are most secure financially, with 100.0% of males and 100.0% of females in these age groups living above the poverty line.
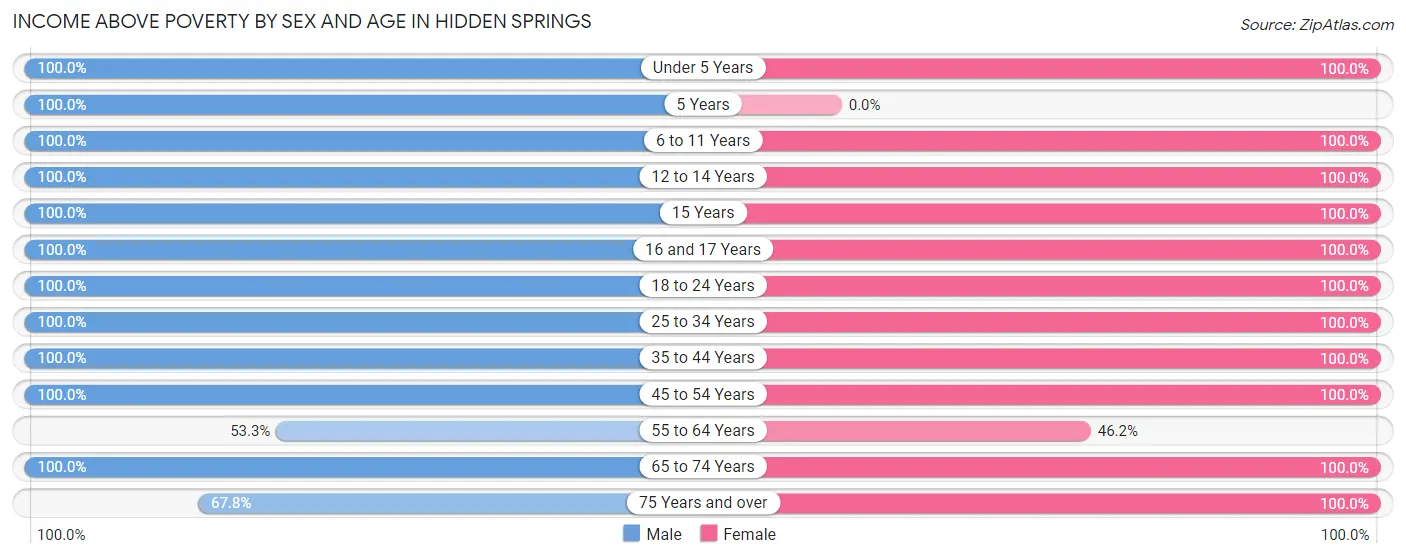
| Age Bracket | Male | Female |
| Under 5 Years | 186 (100.0%) | 61 (100.0%) |
| 5 Years | 12 (100.0%) | 0 (0.0%) |
| 6 to 11 Years | 111 (100.0%) | 159 (100.0%) |
| 12 to 14 Years | 163 (100.0%) | 165 (100.0%) |
| 15 Years | 44 (100.0%) | 134 (100.0%) |
| 16 and 17 Years | 250 (100.0%) | 23 (100.0%) |
| 18 to 24 Years | 70 (100.0%) | 29 (100.0%) |
| 25 to 34 Years | 131 (100.0%) | 81 (100.0%) |
| 35 to 44 Years | 227 (100.0%) | 324 (100.0%) |
| 45 to 54 Years | 379 (100.0%) | 278 (100.0%) |
| 55 to 64 Years | 121 (53.3%) | 110 (46.2%) |
| 65 to 74 Years | 111 (100.0%) | 95 (100.0%) |
| 75 Years and over | 40 (67.8%) | 27 (100.0%) |
| Total | 1,845 (93.6%) | 1,486 (92.1%) |
Income Below Poverty Among Married-Couple Families in Hidden Springs
The poverty statistics for married-couple families in Hidden Springs show that 13.5% or 128 of the total 949 families live below the poverty line. Families with no children have the highest poverty rate of 34.9%, comprising of 128 families. On the other hand, families with 1 or 2 children have the lowest poverty rate of 0.0%, which includes 0 families.
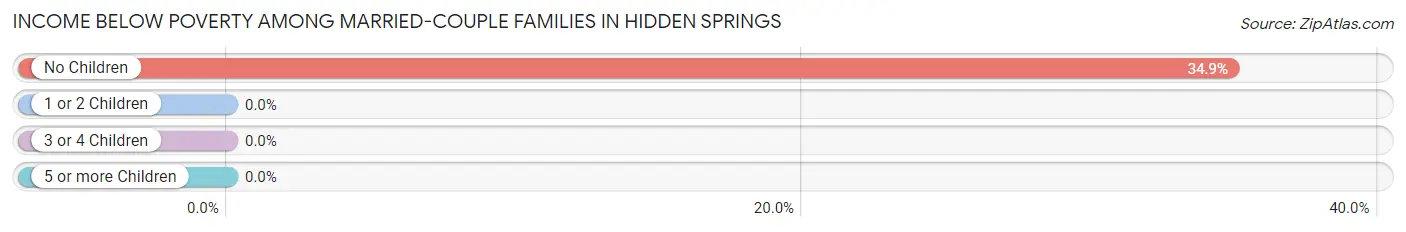
| Children | Above Poverty | Below Poverty |
| No Children | 239 (65.1%) | 128 (34.9%) |
| 1 or 2 Children | 436 (100.0%) | 0 (0.0%) |
| 3 or 4 Children | 146 (100.0%) | 0 (0.0%) |
| 5 or more Children | 0 (0.0%) | 0 (0.0%) |
| Total | 821 (86.5%) | 128 (13.5%) |
Income Below Poverty Among Single-Parent Households in Hidden Springs
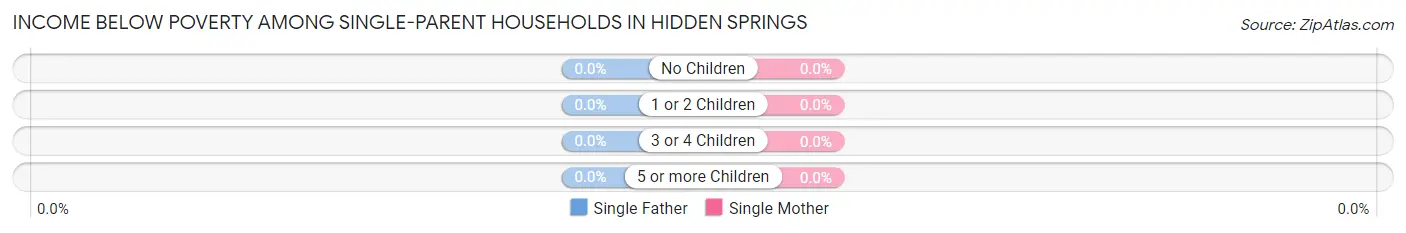
| Children | Single Father | Single Mother |
| No Children | 0 (0.0%) | 0 (0.0%) |
| 1 or 2 Children | 0 (0.0%) | 0 (0.0%) |
| 3 or 4 Children | 0 (0.0%) | 0 (0.0%) |
| 5 or more Children | 0 (0.0%) | 0 (0.0%) |
| Total | 0 (0.0%) | 0 (0.0%) |
Income Below Poverty Among Married-Couple vs Single-Parent Households in Hidden Springs
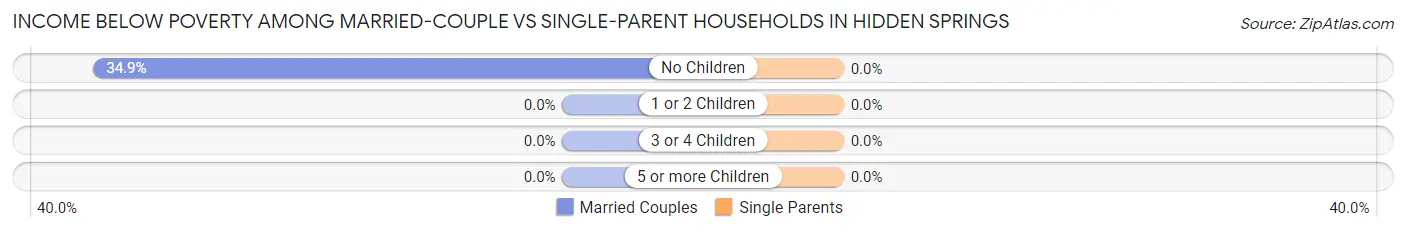
| Children | Married-Couple Families | Single-Parent Households |
| No Children | 128 (34.9%) | 0 (0.0%) |
| 1 or 2 Children | 0 (0.0%) | 0 (0.0%) |
| 3 or 4 Children | 0 (0.0%) | 0 (0.0%) |
| 5 or more Children | 0 (0.0%) | 0 (0.0%) |
| Total | 128 (13.5%) | 0 (0.0%) |
Race in Hidden Springs
The most populous races in Hidden Springs are White / Caucasian (3,385 | 94.5%), Hispanic or Latino (222 | 6.2%), and Two or more Races (177 | 4.9%).
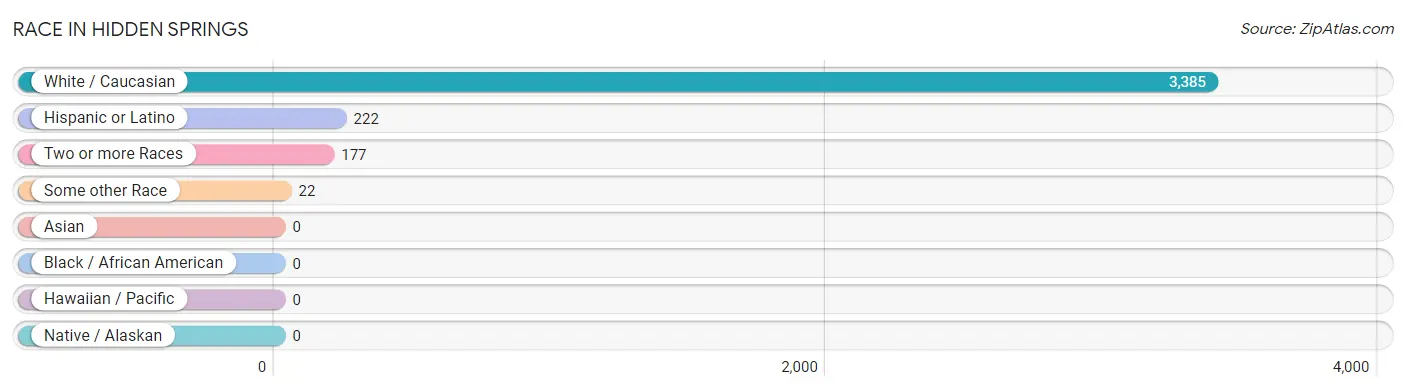
| Race | # Population | % Population |
| Asian | 0 | 0.0% |
| Black / African American | 0 | 0.0% |
| Hawaiian / Pacific | 0 | 0.0% |
| Hispanic or Latino | 222 | 6.2% |
| Native / Alaskan | 0 | 0.0% |
| White / Caucasian | 3,385 | 94.5% |
| Two or more Races | 177 | 4.9% |
| Some other Race | 22 | 0.6% |
| Total | 3,584 | 100.0% |
Ancestry in Hidden Springs
The most populous ancestries reported in Hidden Springs are German (866 | 24.2%), American (519 | 14.5%), English (442 | 12.3%), Irish (393 | 11.0%), and Scottish (228 | 6.4%), together accounting for 68.3% of all Hidden Springs residents.
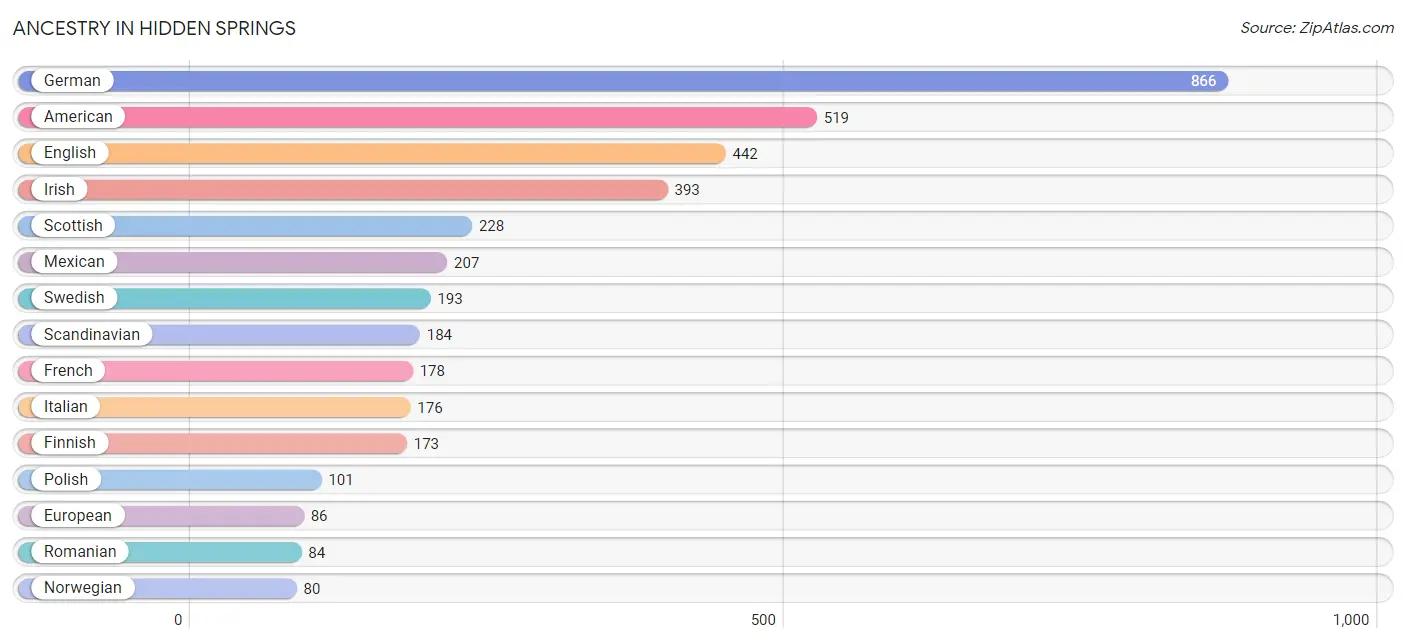
| Ancestry | # Population | % Population |
| American | 519 | 14.5% |
| Argentinean | 15 | 0.4% |
| Armenian | 51 | 1.4% |
| Australian | 21 | 0.6% |
| Bhutanese | 69 | 1.9% |
| British | 53 | 1.5% |
| Cherokee | 14 | 0.4% |
| Czech | 20 | 0.6% |
| Danish | 33 | 0.9% |
| Dutch | 21 | 0.6% |
| English | 442 | 12.3% |
| European | 86 | 2.4% |
| Finnish | 173 | 4.8% |
| French | 178 | 5.0% |
| German | 866 | 24.2% |
| Hungarian | 13 | 0.4% |
| Irish | 393 | 11.0% |
| Italian | 176 | 4.9% |
| Mexican | 207 | 5.8% |
| Norwegian | 80 | 2.2% |
| Polish | 101 | 2.8% |
| Romanian | 84 | 2.3% |
| Scandinavian | 184 | 5.1% |
| Scottish | 228 | 6.4% |
| South American | 15 | 0.4% |
| Swedish | 193 | 5.4% |
| Welsh | 18 | 0.5% | View All 27 Rows |
Immigrants in Hidden Springs
The most numerous immigrant groups reported in Hidden Springs came from Australia (21 | 0.6%), Oceania (21 | 0.6%), Argentina (15 | 0.4%), Latin America (15 | 0.4%), and South America (15 | 0.4%), together accounting for 2.4% of all Hidden Springs residents.
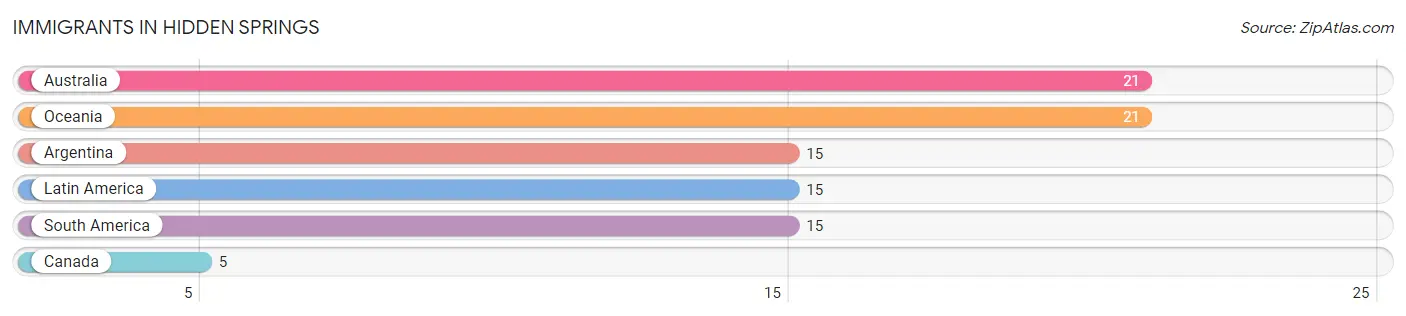
| Immigration Origin | # Population | % Population |
| Argentina | 15 | 0.4% |
| Australia | 21 | 0.6% |
| Canada | 5 | 0.1% |
| Latin America | 15 | 0.4% |
| Oceania | 21 | 0.6% |
| South America | 15 | 0.4% | View All 6 Rows |
Sex and Age in Hidden Springs
Sex and Age in Hidden Springs
The most populous age groups in Hidden Springs are 15 to 19 Years (364 | 18.5%) for men and 10 to 14 Years (280 | 17.3%) for women.
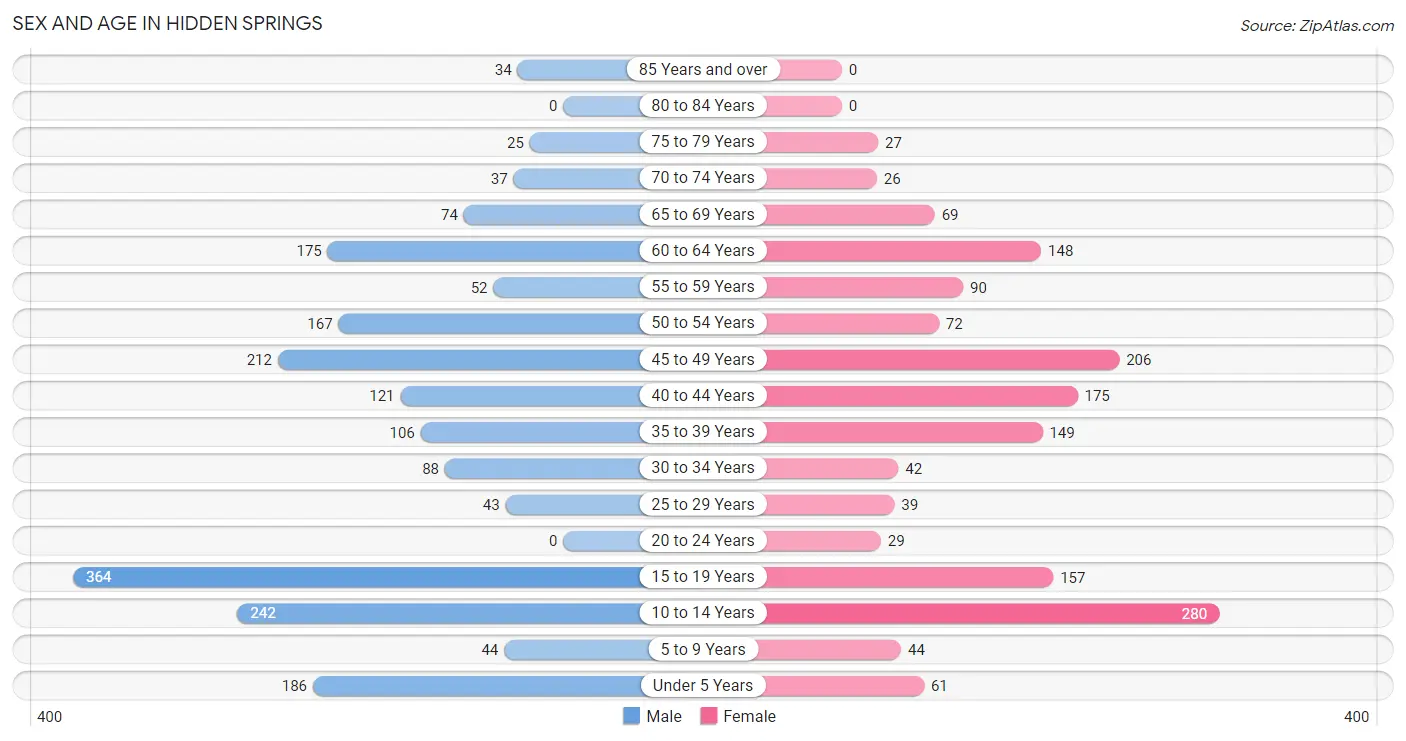
| Age Bracket | Male | Female |
| Under 5 Years | 186 (9.4%) | 61 (3.8%) |
| 5 to 9 Years | 44 (2.2%) | 44 (2.7%) |
| 10 to 14 Years | 242 (12.3%) | 280 (17.3%) |
| 15 to 19 Years | 364 (18.5%) | 157 (9.7%) |
| 20 to 24 Years | 0 (0.0%) | 29 (1.8%) |
| 25 to 29 Years | 43 (2.2%) | 39 (2.4%) |
| 30 to 34 Years | 88 (4.5%) | 42 (2.6%) |
| 35 to 39 Years | 106 (5.4%) | 149 (9.2%) |
| 40 to 44 Years | 121 (6.1%) | 175 (10.8%) |
| 45 to 49 Years | 212 (10.8%) | 206 (12.8%) |
| 50 to 54 Years | 167 (8.5%) | 72 (4.5%) |
| 55 to 59 Years | 52 (2.6%) | 90 (5.6%) |
| 60 to 64 Years | 175 (8.9%) | 148 (9.2%) |
| 65 to 69 Years | 74 (3.8%) | 69 (4.3%) |
| 70 to 74 Years | 37 (1.9%) | 26 (1.6%) |
| 75 to 79 Years | 25 (1.3%) | 27 (1.7%) |
| 80 to 84 Years | 0 (0.0%) | 0 (0.0%) |
| 85 Years and over | 34 (1.7%) | 0 (0.0%) |
| Total | 1,970 (100.0%) | 1,614 (100.0%) |
Families and Households in Hidden Springs
Median Family Size in Hidden Springs
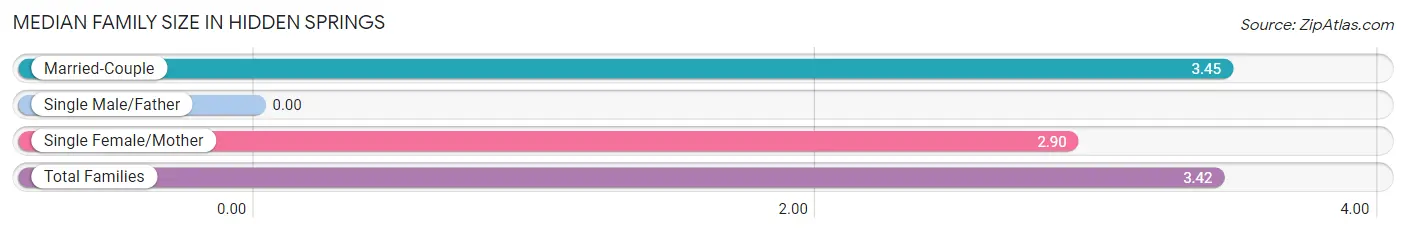
| Family Type | # Families | Family Size |
| Married-Couple | 949 (94.8%) | 3.45 |
| Single Male/Father | 0 (0.0%) | - |
| Single Female/Mother | 52 (5.2%) | 2.90 |
| Total Families | 1,001 (100.0%) | 3.42 |
Median Household Size in Hidden Springs
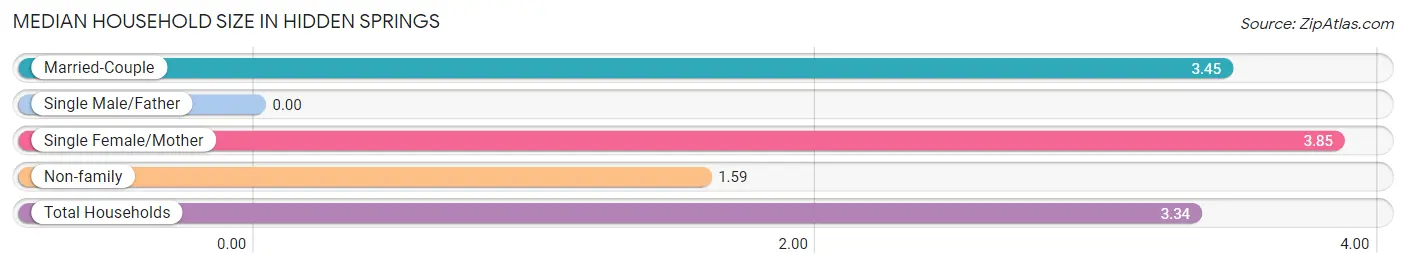
| Household Type | # Households | Household Size |
| Married-Couple | 949 (88.5%) | 3.45 |
| Single Male/Father | 0 (0.0%) | - |
| Single Female/Mother | 52 (4.9%) | 3.85 |
| Non-family | 71 (6.6%) | 1.59 |
| Total Households | 1,072 (100.0%) | 3.34 |
Household Size by Marriage Status in Hidden Springs
Out of a total of 1,072 households in Hidden Springs, 1,001 (93.4%) are family households, while 71 (6.6%) are nonfamily households. The most numerous type of family households are 2-person households, comprising 352, and the most common type of nonfamily households are 2-person households, comprising 40.
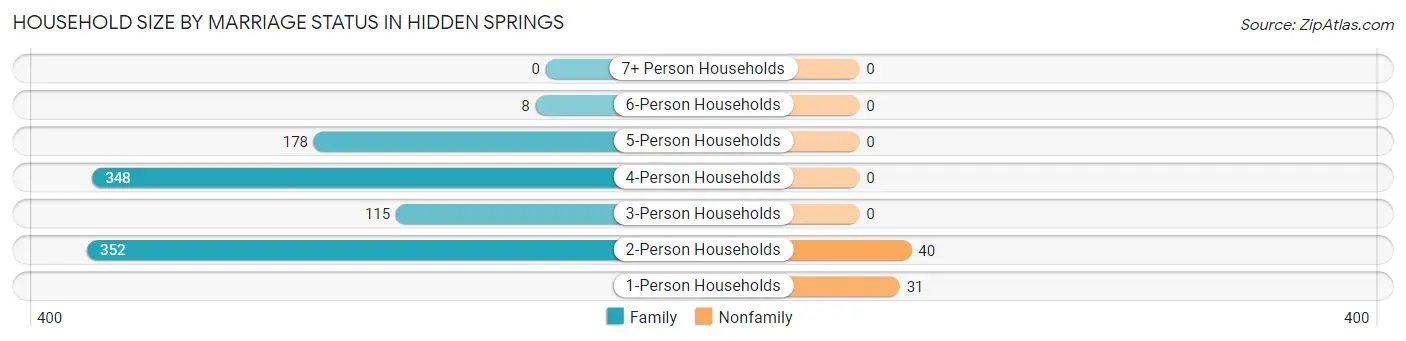
| Household Size | Family Households | Nonfamily Households |
| 1-Person Households | - | 31 (2.9%) |
| 2-Person Households | 352 (32.8%) | 40 (3.7%) |
| 3-Person Households | 115 (10.7%) | 0 (0.0%) |
| 4-Person Households | 348 (32.5%) | 0 (0.0%) |
| 5-Person Households | 178 (16.6%) | 0 (0.0%) |
| 6-Person Households | 8 (0.7%) | 0 (0.0%) |
| 7+ Person Households | 0 (0.0%) | 0 (0.0%) |
| Total | 1,001 (93.4%) | 71 (6.6%) |
Female Fertility in Hidden Springs
Fertility by Age in Hidden Springs
Average fertility rate in Hidden Springs is 71.0 births per 1,000 women. Women in the age bracket of 35 to 50 years have the highest fertility rate with 105.0 births per 1,000 women. Women in the age bracket of 35 to 50 years acount for 100.0% of all women with births.
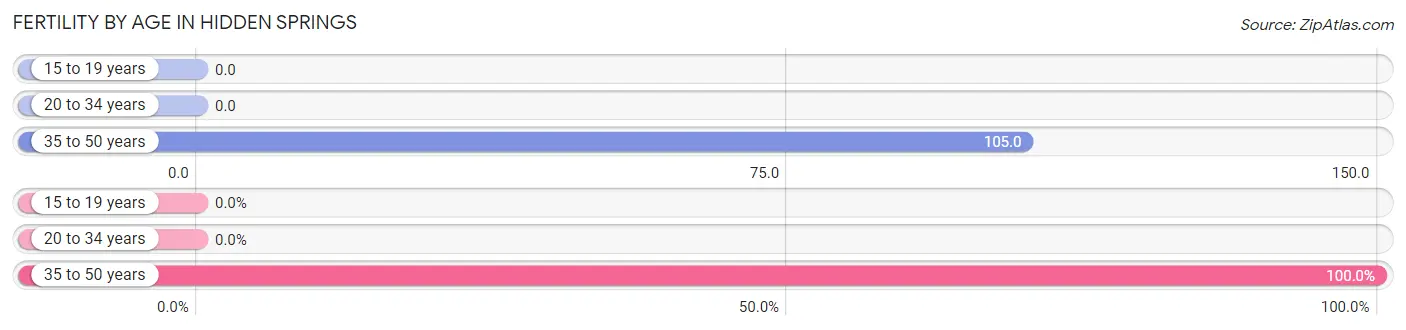
| Age Bracket | Women with Births | Births / 1,000 Women |
| 15 to 19 years | 0 (0.0%) | 0.0 |
| 20 to 34 years | 0 (0.0%) | 0.0 |
| 35 to 50 years | 58 (100.0%) | 105.0 |
| Total | 58 (100.0%) | 71.0 |
Fertility by Age by Marriage Status in Hidden Springs
22.4% of women with births (58) in Hidden Springs are married. The highest percentage of unmarried women with births falls into 35 to 50 years age bracket with 77.6% of them unmarried at the time of birth, while the lowest percentage of unmarried women with births belong to 35 to 50 years age bracket with 77.6% of them unmarried.
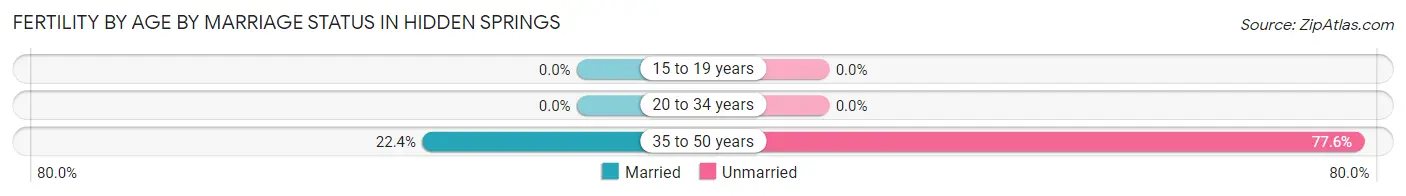
| Age Bracket | Married | Unmarried |
| 15 to 19 years | 0 (0.0%) | 0 (0.0%) |
| 20 to 34 years | 0 (0.0%) | 0 (0.0%) |
| 35 to 50 years | 13 (22.4%) | 45 (77.6%) |
| Total | 13 (22.4%) | 45 (77.6%) |
Fertility by Education in Hidden Springs
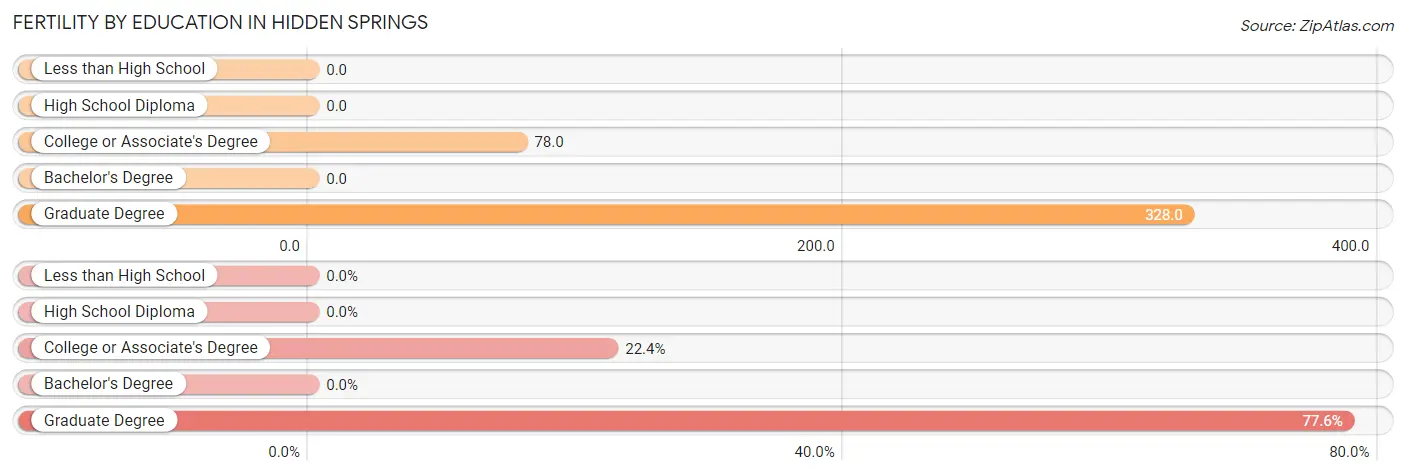
| Educational Attainment | Women with Births | Births / 1,000 Women |
| Less than High School | 0 (0.0%) | 0.0 |
| High School Diploma | 0 (0.0%) | 0.0 |
| College or Associate's Degree | 13 (22.4%) | 78.0 |
| Bachelor's Degree | 0 (0.0%) | 0.0 |
| Graduate Degree | 45 (77.6%) | 328.0 |
| Total | 58 (100.0%) | 71.0 |
Fertility by Education by Marriage Status in Hidden Springs
77.6% of women with births in Hidden Springs are unmarried. Women with the educational attainment of college or associate's degree are most likely to be married with 100.0% of them married at childbirth, while women with the educational attainment of graduate degree are least likely to be married with 100.0% of them unmarried at childbirth.
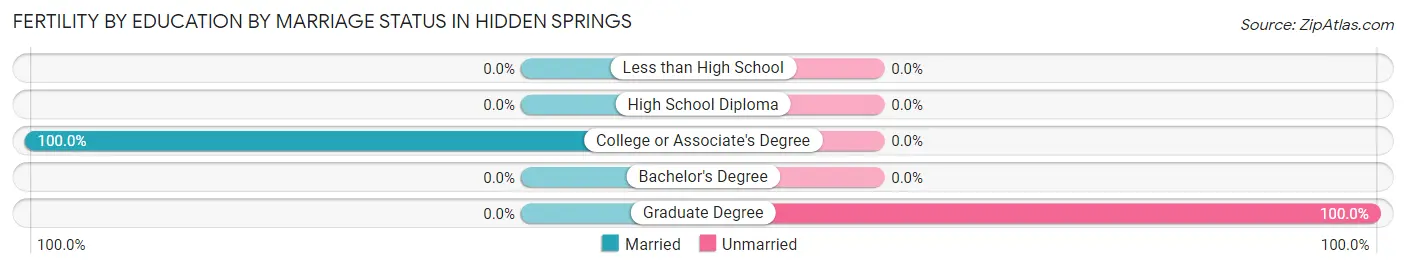
| Educational Attainment | Married | Unmarried |
| Less than High School | 0 (0.0%) | 0 (0.0%) |
| High School Diploma | 0 (0.0%) | 0 (0.0%) |
| College or Associate's Degree | 13 (100.0%) | 0 (0.0%) |
| Bachelor's Degree | 0 (0.0%) | 0 (0.0%) |
| Graduate Degree | 0 (0.0%) | 45 (100.0%) |
| Total | 13 (22.4%) | 45 (77.6%) |
Employment Characteristics in Hidden Springs
Employment by Class of Employer in Hidden Springs
Among the 1,529 employed individuals in Hidden Springs, private company employees (884 | 57.8%), not-for-profit organizations (192 | 12.6%), and self-employed (not incorporated) (146 | 9.6%) make up the most common classes of employment.
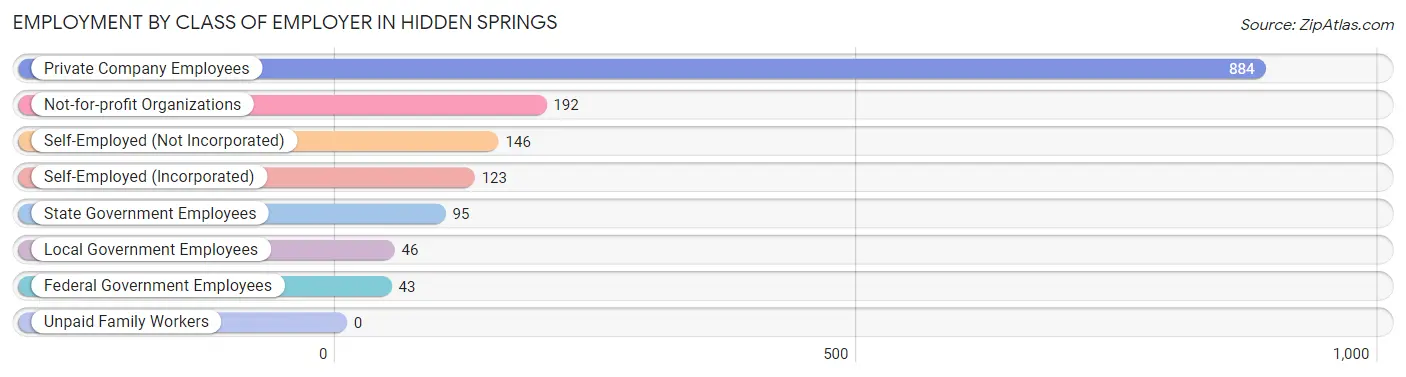
| Employer Class | # Employees | % Employees |
| Private Company Employees | 884 | 57.8% |
| Self-Employed (Incorporated) | 123 | 8.0% |
| Self-Employed (Not Incorporated) | 146 | 9.6% |
| Not-for-profit Organizations | 192 | 12.6% |
| Local Government Employees | 46 | 3.0% |
| State Government Employees | 95 | 6.2% |
| Federal Government Employees | 43 | 2.8% |
| Unpaid Family Workers | 0 | 0.0% |
| Total | 1,529 | 100.0% |
Employment Status by Age in Hidden Springs
According to the labor force statistics for Hidden Springs, out of the total population over 16 years of age (2,549), 61.9% or 1,578 individuals are in the labor force, with 1.6% or 25 of them unemployed. The age group with the highest labor force participation rate is 20 to 24 years, with 100.0% or 29 individuals in the labor force. Within the labor force, the 20 to 24 years age range has the highest percentage of unemployed individuals, with 24.1% or 7 of them being unemployed.
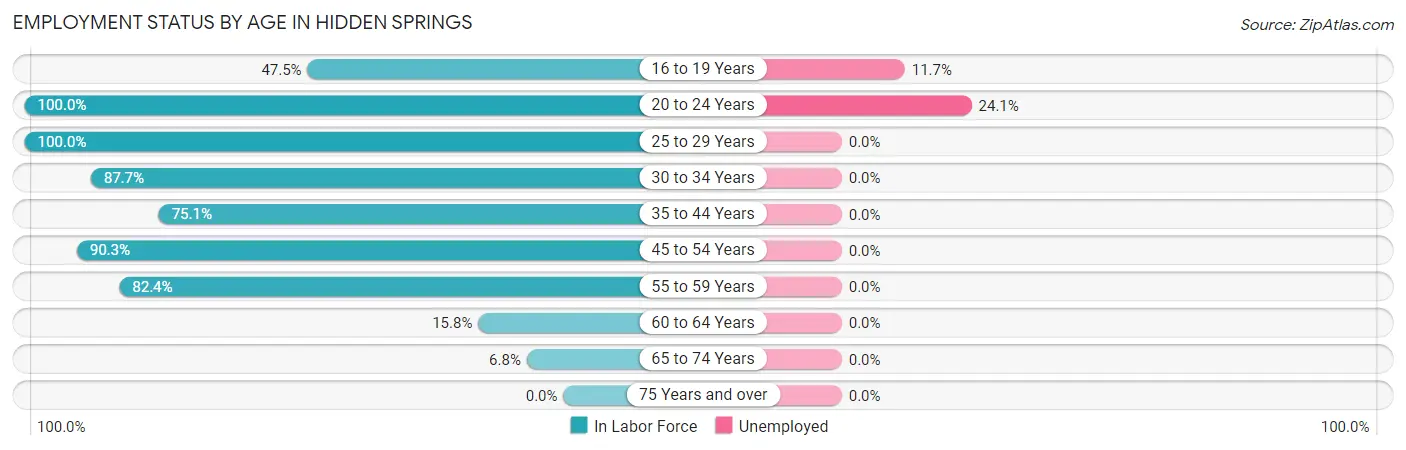
| Age Bracket | In Labor Force | Unemployed |
| 16 to 19 Years | 163 (47.5%) | 19 (11.7%) |
| 20 to 24 Years | 29 (100.0%) | 7 (24.1%) |
| 25 to 29 Years | 82 (100.0%) | 0 (0.0%) |
| 30 to 34 Years | 114 (87.7%) | 0 (0.0%) |
| 35 to 44 Years | 414 (75.1%) | 0 (0.0%) |
| 45 to 54 Years | 593 (90.3%) | 0 (0.0%) |
| 55 to 59 Years | 117 (82.4%) | 0 (0.0%) |
| 60 to 64 Years | 51 (15.8%) | 0 (0.0%) |
| 65 to 74 Years | 14 (6.8%) | 0 (0.0%) |
| 75 Years and over | 0 (0.0%) | 0 (0.0%) |
| Total | 1,578 (61.9%) | 25 (1.6%) |
Employment Status by Educational Attainment in Hidden Springs
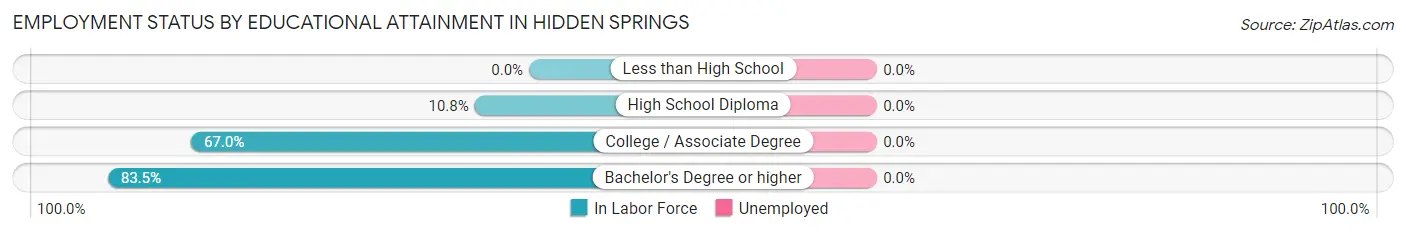
| Educational Attainment | In Labor Force | Unemployed |
| Less than High School | 0 (0.0%) | 0 (0.0%) |
| High School Diploma | 17 (10.8%) | 0 (0.0%) |
| College / Associate Degree | 360 (67.0%) | 0 (0.0%) |
| Bachelor's Degree or higher | 994 (83.5%) | 0 (0.0%) |
| Total | 1,370 (72.7%) | 0 (0.0%) |
Employment Occupations by Sex in Hidden Springs
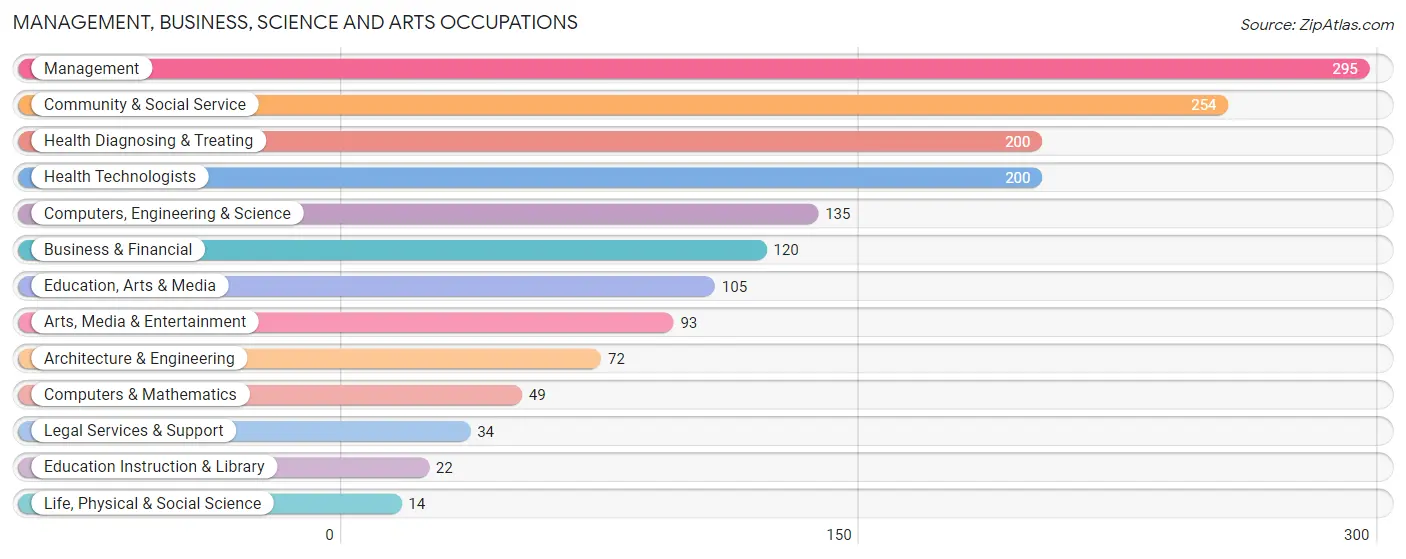
Management, Business, Science and Arts Occupations
The most common Management, Business, Science and Arts occupations in Hidden Springs are Management (295 | 19.0%), Community & Social Service (254 | 16.4%), Health Diagnosing & Treating (200 | 12.9%), Health Technologists (200 | 12.9%), and Computers, Engineering & Science (135 | 8.7%).
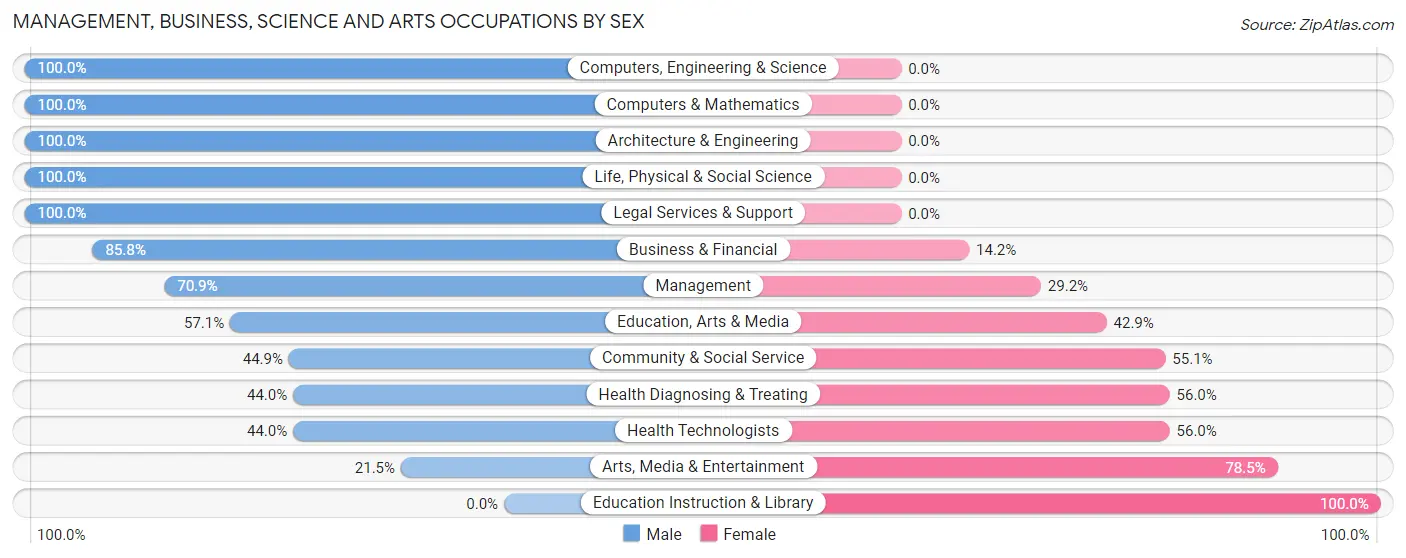
Management, Business, Science and Arts Occupations by Sex
Within the Management, Business, Science and Arts occupations in Hidden Springs, the most male-oriented occupations are Computers, Engineering & Science (100.0%), Computers & Mathematics (100.0%), and Architecture & Engineering (100.0%), while the most female-oriented occupations are Education Instruction & Library (100.0%), Arts, Media & Entertainment (78.5%), and Health Diagnosing & Treating (56.0%).
| Occupation | Male | Female |
| Management | 209 (70.9%) | 86 (29.1%) |
| Business & Financial | 103 (85.8%) | 17 (14.2%) |
| Computers, Engineering & Science | 135 (100.0%) | 0 (0.0%) |
| Computers & Mathematics | 49 (100.0%) | 0 (0.0%) |
| Architecture & Engineering | 72 (100.0%) | 0 (0.0%) |
| Life, Physical & Social Science | 14 (100.0%) | 0 (0.0%) |
| Community & Social Service | 114 (44.9%) | 140 (55.1%) |
| Education, Arts & Media | 60 (57.1%) | 45 (42.9%) |
| Legal Services & Support | 34 (100.0%) | 0 (0.0%) |
| Education Instruction & Library | 0 (0.0%) | 22 (100.0%) |
| Arts, Media & Entertainment | 20 (21.5%) | 73 (78.5%) |
| Health Diagnosing & Treating | 88 (44.0%) | 112 (56.0%) |
| Health Technologists | 88 (44.0%) | 112 (56.0%) |
| Total (Category) | 649 (64.6%) | 355 (35.4%) |
| Total (Overall) | 984 (63.4%) | 567 (36.6%) |
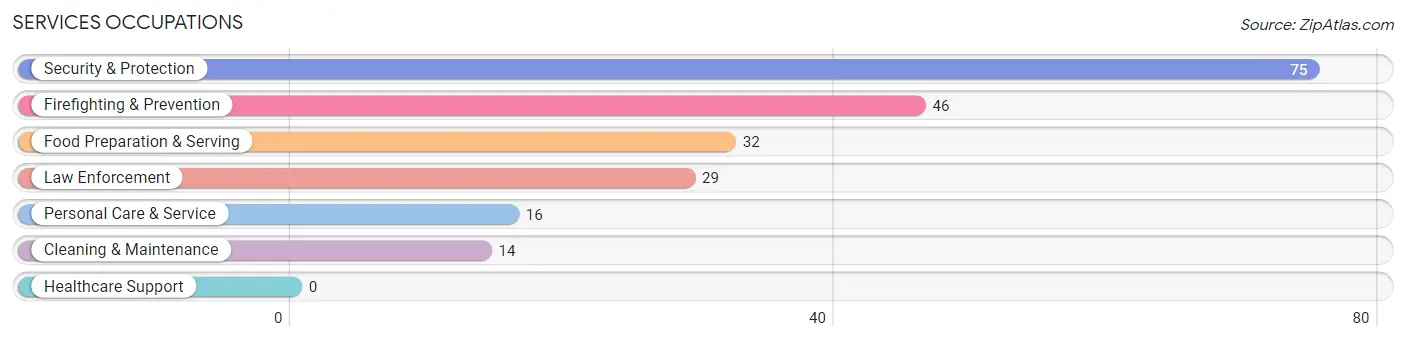
Services Occupations
The most common Services occupations in Hidden Springs are Security & Protection (75 | 4.8%), Firefighting & Prevention (46 | 3.0%), Food Preparation & Serving (32 | 2.1%), Law Enforcement (29 | 1.9%), and Personal Care & Service (16 | 1.0%).
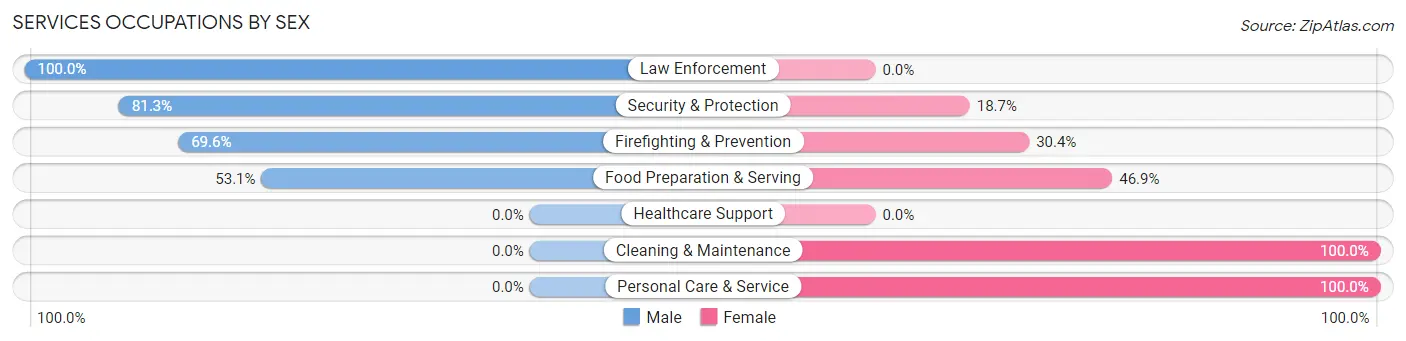
Services Occupations by Sex
Within the Services occupations in Hidden Springs, the most male-oriented occupations are Law Enforcement (100.0%), Security & Protection (81.3%), and Firefighting & Prevention (69.6%), while the most female-oriented occupations are Cleaning & Maintenance (100.0%), Personal Care & Service (100.0%), and Food Preparation & Serving (46.9%).
| Occupation | Male | Female |
| Healthcare Support | 0 (0.0%) | 0 (0.0%) |
| Security & Protection | 61 (81.3%) | 14 (18.7%) |
| Firefighting & Prevention | 32 (69.6%) | 14 (30.4%) |
| Law Enforcement | 29 (100.0%) | 0 (0.0%) |
| Food Preparation & Serving | 17 (53.1%) | 15 (46.9%) |
| Cleaning & Maintenance | 0 (0.0%) | 14 (100.0%) |
| Personal Care & Service | 0 (0.0%) | 16 (100.0%) |
| Total (Category) | 78 (56.9%) | 59 (43.1%) |
| Total (Overall) | 984 (63.4%) | 567 (36.6%) |
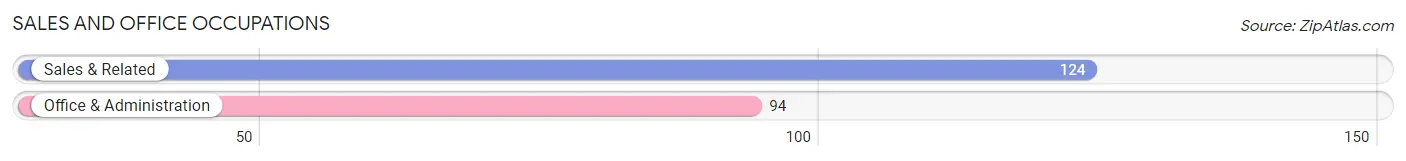
Sales and Office Occupations
The most common Sales and Office occupations in Hidden Springs are Sales & Related (124 | 8.0%), and Office & Administration (94 | 6.1%).
Sales and Office Occupations by Sex
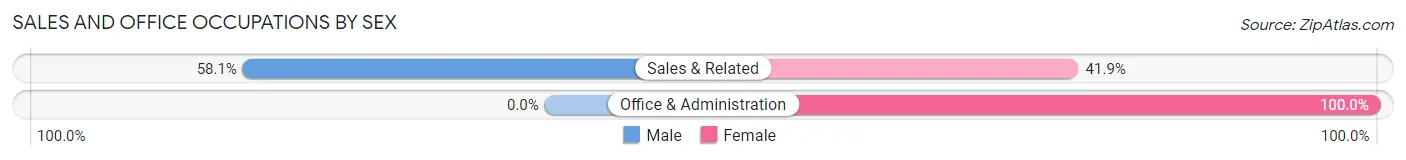
| Occupation | Male | Female |
| Sales & Related | 72 (58.1%) | 52 (41.9%) |
| Office & Administration | 0 (0.0%) | 94 (100.0%) |
| Total (Category) | 72 (33.0%) | 146 (67.0%) |
| Total (Overall) | 984 (63.4%) | 567 (36.6%) |
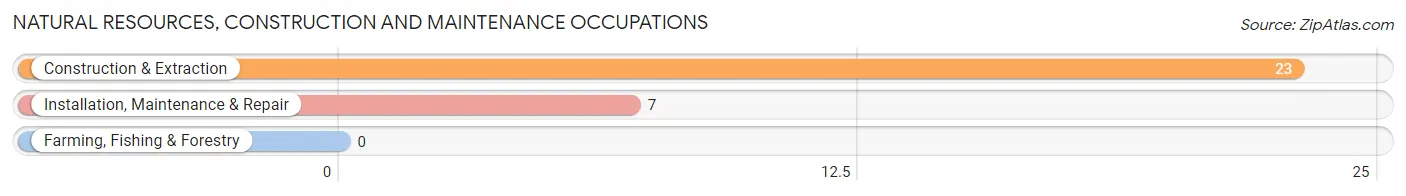
Natural Resources, Construction and Maintenance Occupations
The most common Natural Resources, Construction and Maintenance occupations in Hidden Springs are Construction & Extraction (23 | 1.5%), and Installation, Maintenance & Repair (7 | 0.4%).
Natural Resources, Construction and Maintenance Occupations by Sex
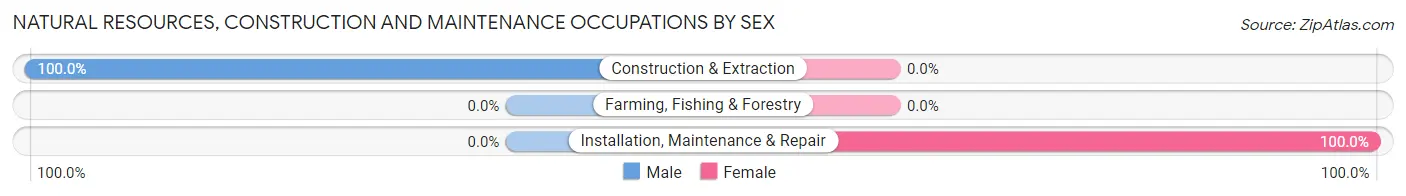
| Occupation | Male | Female |
| Farming, Fishing & Forestry | 0 (0.0%) | 0 (0.0%) |
| Construction & Extraction | 23 (100.0%) | 0 (0.0%) |
| Installation, Maintenance & Repair | 0 (0.0%) | 7 (100.0%) |
| Total (Category) | 23 (76.7%) | 7 (23.3%) |
| Total (Overall) | 984 (63.4%) | 567 (36.6%) |
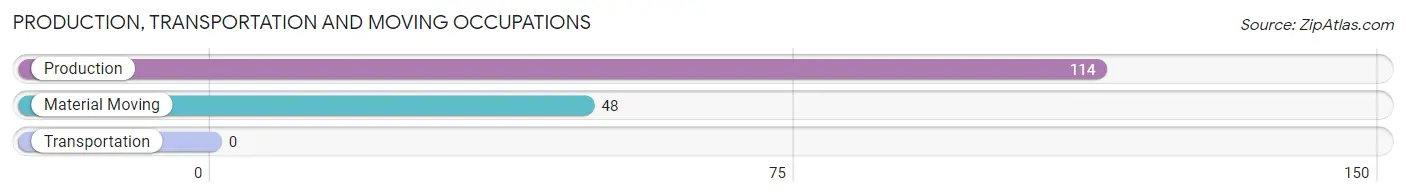
Production, Transportation and Moving Occupations
The most common Production, Transportation and Moving occupations in Hidden Springs are Production (114 | 7.3%), and Material Moving (48 | 3.1%).
Production, Transportation and Moving Occupations by Sex
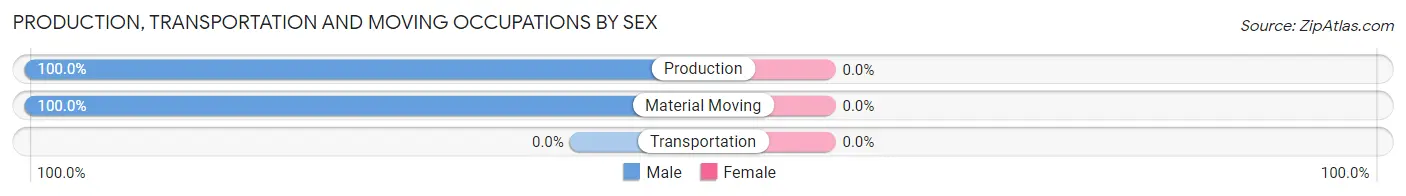
| Occupation | Male | Female |
| Production | 114 (100.0%) | 0 (0.0%) |
| Transportation | 0 (0.0%) | 0 (0.0%) |
| Material Moving | 48 (100.0%) | 0 (0.0%) |
| Total (Category) | 162 (100.0%) | 0 (0.0%) |
| Total (Overall) | 984 (63.4%) | 567 (36.6%) |
Employment Industries by Sex in Hidden Springs
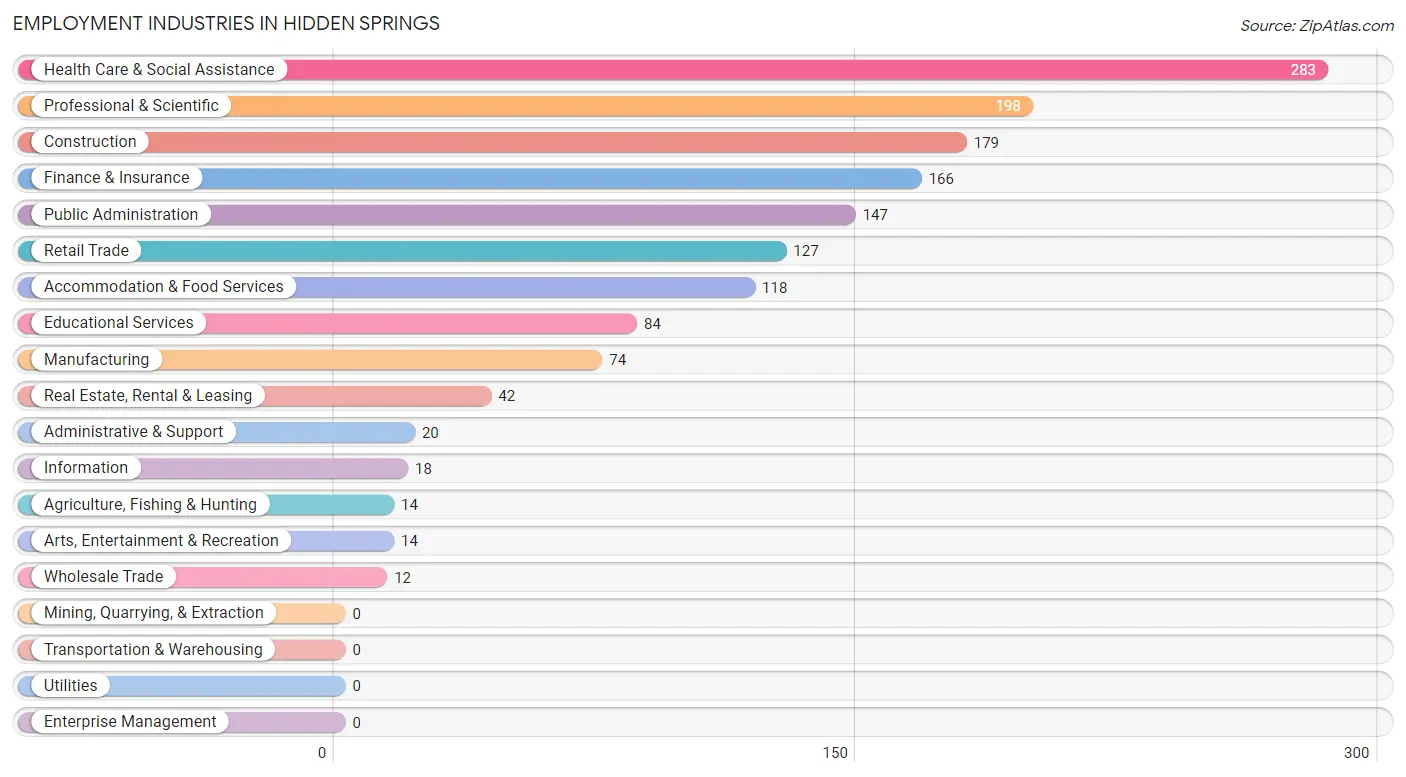
Employment Industries in Hidden Springs
The major employment industries in Hidden Springs include Health Care & Social Assistance (283 | 18.2%), Professional & Scientific (198 | 12.8%), Construction (179 | 11.5%), Finance & Insurance (166 | 10.7%), and Public Administration (147 | 9.5%).
Employment Industries by Sex in Hidden Springs
The Hidden Springs industries that see more men than women are Agriculture, Fishing & Hunting (100.0%), Manufacturing (100.0%), and Wholesale Trade (100.0%), whereas the industries that tend to have a higher number of women are Real Estate, Rental & Leasing (100.0%), Educational Services (100.0%), and Arts, Entertainment & Recreation (100.0%).
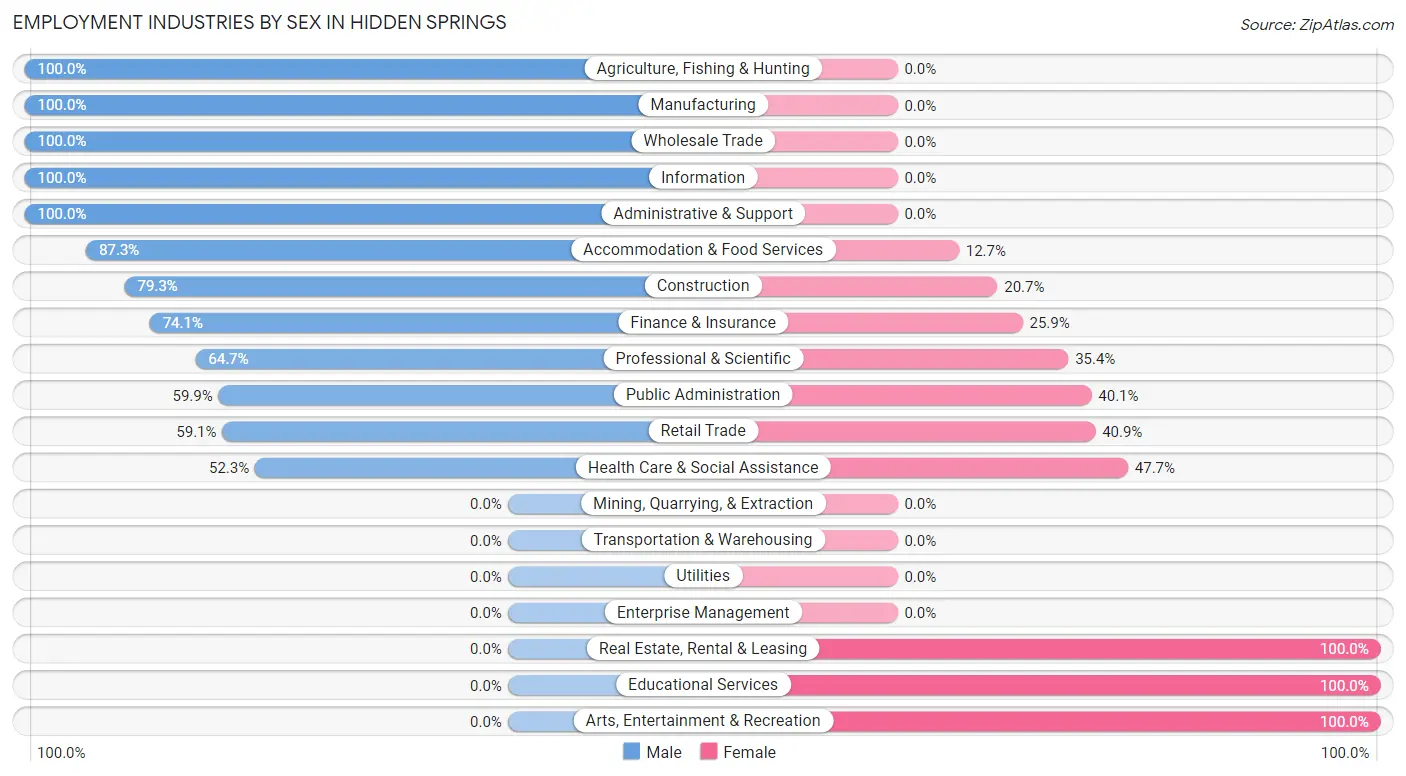
| Industry | Male | Female |
| Agriculture, Fishing & Hunting | 14 (100.0%) | 0 (0.0%) |
| Mining, Quarrying, & Extraction | 0 (0.0%) | 0 (0.0%) |
| Construction | 142 (79.3%) | 37 (20.7%) |
| Manufacturing | 74 (100.0%) | 0 (0.0%) |
| Wholesale Trade | 12 (100.0%) | 0 (0.0%) |
| Retail Trade | 75 (59.1%) | 52 (40.9%) |
| Transportation & Warehousing | 0 (0.0%) | 0 (0.0%) |
| Utilities | 0 (0.0%) | 0 (0.0%) |
| Information | 18 (100.0%) | 0 (0.0%) |
| Finance & Insurance | 123 (74.1%) | 43 (25.9%) |
| Real Estate, Rental & Leasing | 0 (0.0%) | 42 (100.0%) |
| Professional & Scientific | 128 (64.6%) | 70 (35.3%) |
| Enterprise Management | 0 (0.0%) | 0 (0.0%) |
| Administrative & Support | 20 (100.0%) | 0 (0.0%) |
| Educational Services | 0 (0.0%) | 84 (100.0%) |
| Health Care & Social Assistance | 148 (52.3%) | 135 (47.7%) |
| Arts, Entertainment & Recreation | 0 (0.0%) | 14 (100.0%) |
| Accommodation & Food Services | 103 (87.3%) | 15 (12.7%) |
| Public Administration | 88 (59.9%) | 59 (40.1%) |
| Total | 984 (63.4%) | 567 (36.6%) |
Education in Hidden Springs
School Enrollment in Hidden Springs
The most common levels of schooling among the 1,278 students in Hidden Springs are high school (589 | 46.1%), middle school (429 | 33.6%), and college / undergraduate (93 | 7.3%).
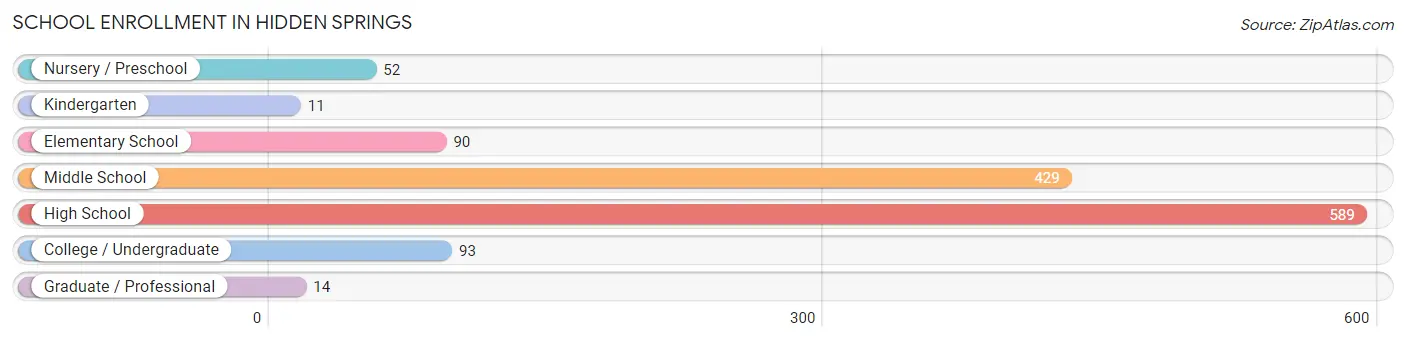
| School Level | # Students | % Students |
| Nursery / Preschool | 52 | 4.1% |
| Kindergarten | 11 | 0.9% |
| Elementary School | 90 | 7.0% |
| Middle School | 429 | 33.6% |
| High School | 589 | 46.1% |
| College / Undergraduate | 93 | 7.3% |
| Graduate / Professional | 14 | 1.1% |
| Total | 1,278 | 100.0% |
School Enrollment by Age by Funding Source in Hidden Springs
Out of a total of 1,278 students who are enrolled in schools in Hidden Springs, 318 (24.9%) attend a private institution, while the remaining 960 (75.1%) are enrolled in public schools. The age group of 3 to 4 year olds has the highest likelihood of being enrolled in private schools, with 30 (75.0% in the age bracket) enrolled. Conversely, the age group of 18 to 19 year olds has the lowest likelihood of being enrolled in a private school, with 70 (100.0% in the age bracket) attending a public institution.
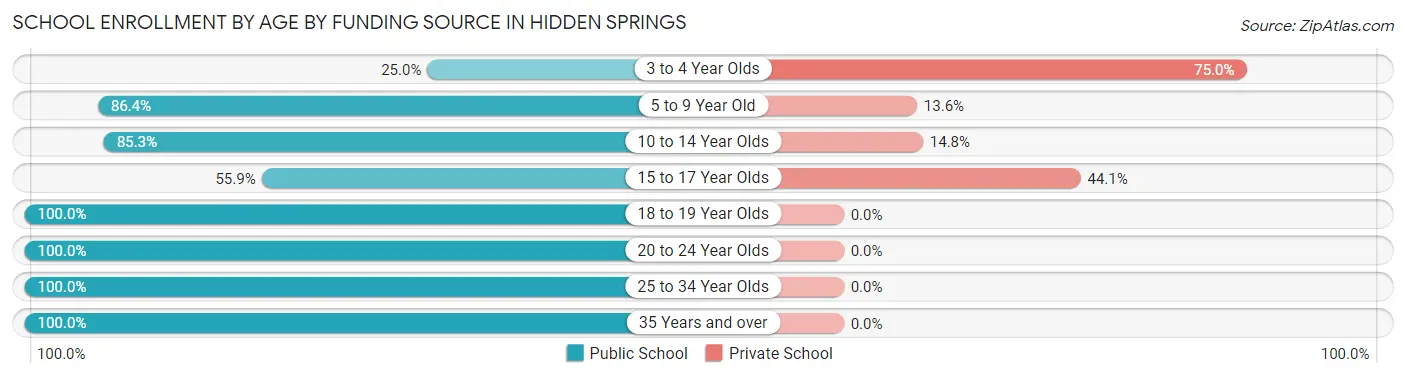
| Age Bracket | Public School | Private School |
| 3 to 4 Year Olds | 10 (25.0%) | 30 (75.0%) |
| 5 to 9 Year Old | 76 (86.4%) | 12 (13.6%) |
| 10 to 14 Year Olds | 445 (85.3%) | 77 (14.7%) |
| 15 to 17 Year Olds | 252 (55.9%) | 199 (44.1%) |
| 18 to 19 Year Olds | 70 (100.0%) | 0 (0.0%) |
| 20 to 24 Year Olds | 29 (100.0%) | 0 (0.0%) |
| 25 to 34 Year Olds | 27 (100.0%) | 0 (0.0%) |
| 35 Years and over | 51 (100.0%) | 0 (0.0%) |
| Total | 960 (75.1%) | 318 (24.9%) |
Educational Attainment by Field of Study in Hidden Springs
Social sciences (289 | 19.8%), business (262 | 18.0%), psychology (149 | 10.2%), science & technology (148 | 10.2%), and engineering (127 | 8.7%) are the most common fields of study among 1,457 individuals in Hidden Springs who have obtained a bachelor's degree or higher.
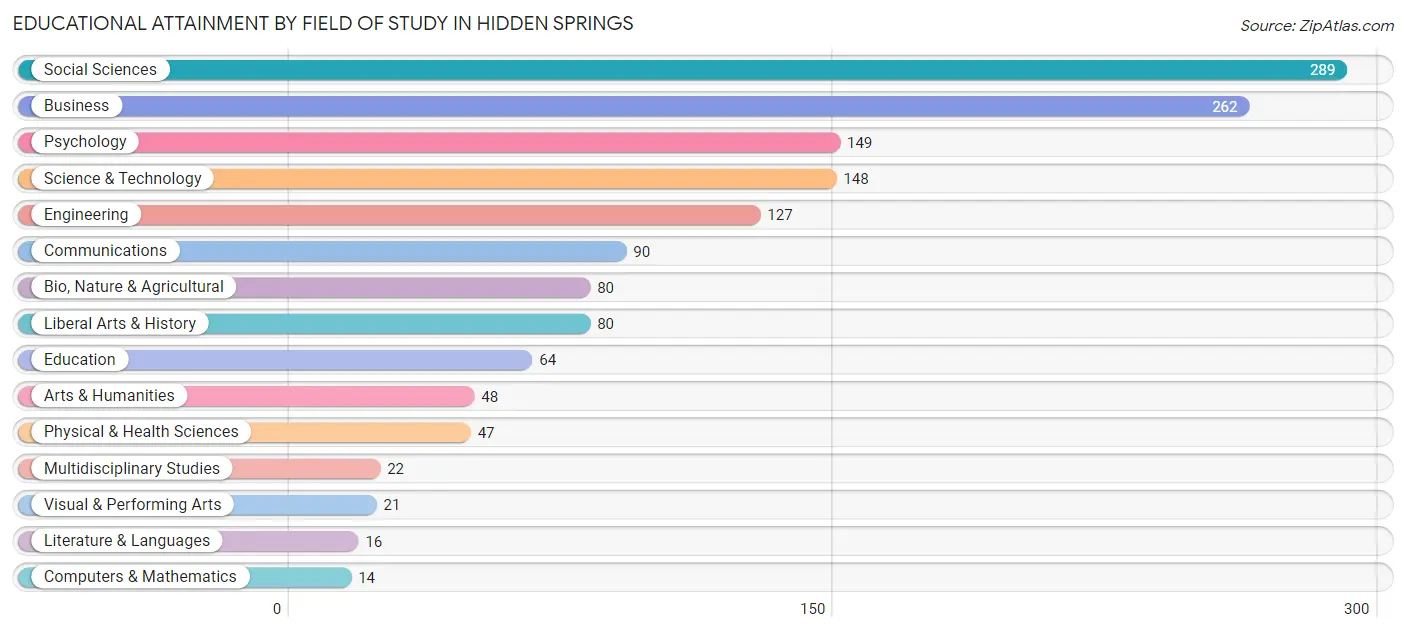
| Field of Study | # Graduates | % Graduates |
| Computers & Mathematics | 14 | 1.0% |
| Bio, Nature & Agricultural | 80 | 5.5% |
| Physical & Health Sciences | 47 | 3.2% |
| Psychology | 149 | 10.2% |
| Social Sciences | 289 | 19.8% |
| Engineering | 127 | 8.7% |
| Multidisciplinary Studies | 22 | 1.5% |
| Science & Technology | 148 | 10.2% |
| Business | 262 | 18.0% |
| Education | 64 | 4.4% |
| Literature & Languages | 16 | 1.1% |
| Liberal Arts & History | 80 | 5.5% |
| Visual & Performing Arts | 21 | 1.4% |
| Communications | 90 | 6.2% |
| Arts & Humanities | 48 | 3.3% |
| Total | 1,457 | 100.0% |
Transportation & Commute in Hidden Springs
Vehicle Availability by Sex in Hidden Springs
The most prevalent vehicle ownership categories in Hidden Springs are males with 2 vehicles (440, accounting for 44.7%) and females with 2 vehicles (276, making up 80.7%).
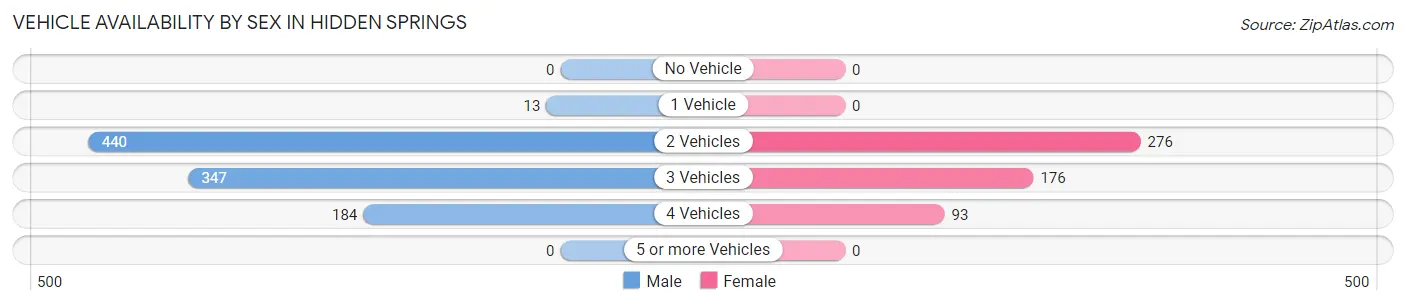
| Vehicles Available | Male | Female |
| No Vehicle | 0 (0.0%) | 0 (0.0%) |
| 1 Vehicle | 13 (1.3%) | 0 (0.0%) |
| 2 Vehicles | 440 (44.7%) | 276 (50.6%) |
| 3 Vehicles | 347 (35.3%) | 176 (32.3%) |
| 4 Vehicles | 184 (18.7%) | 93 (17.1%) |
| 5 or more Vehicles | 0 (0.0%) | 0 (0.0%) |
| Total | 984 (100.0%) | 545 (100.0%) |
Commute Time in Hidden Springs
The most frequently occuring commute durations in Hidden Springs are 30 to 34 minutes (405 commuters, 35.5%), 15 to 19 minutes (262 commuters, 23.0%), and 20 to 24 minutes (216 commuters, 18.9%).
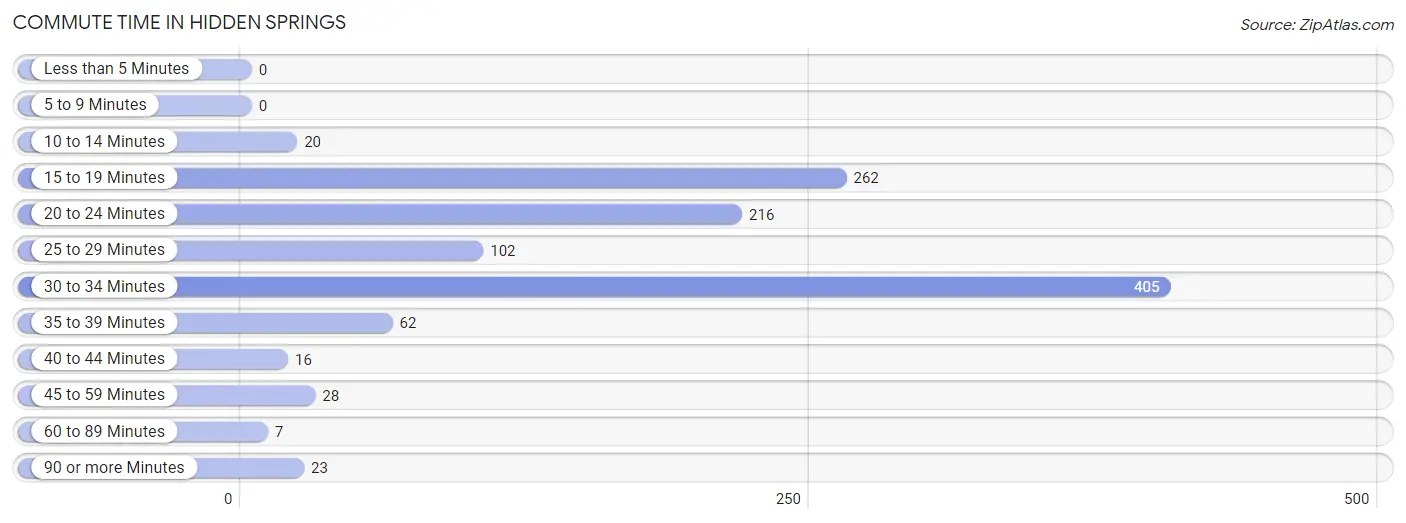
| Commute Time | # Commuters | % Commuters |
| Less than 5 Minutes | 0 | 0.0% |
| 5 to 9 Minutes | 0 | 0.0% |
| 10 to 14 Minutes | 20 | 1.8% |
| 15 to 19 Minutes | 262 | 23.0% |
| 20 to 24 Minutes | 216 | 18.9% |
| 25 to 29 Minutes | 102 | 8.9% |
| 30 to 34 Minutes | 405 | 35.5% |
| 35 to 39 Minutes | 62 | 5.4% |
| 40 to 44 Minutes | 16 | 1.4% |
| 45 to 59 Minutes | 28 | 2.5% |
| 60 to 89 Minutes | 7 | 0.6% |
| 90 or more Minutes | 23 | 2.0% |
Commute Time by Sex in Hidden Springs
The most common commute times in Hidden Springs are 30 to 34 minutes (350 commuters, 42.2%) for males and 15 to 19 minutes (70 commuters, 22.4%) for females.
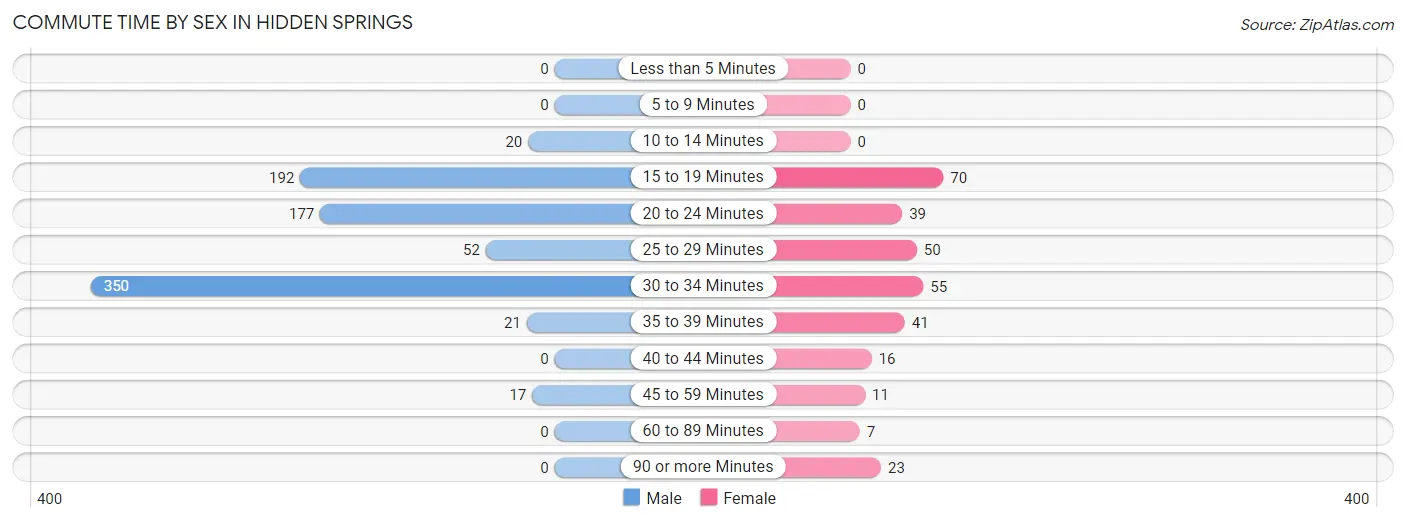
| Commute Time | Male | Female |
| Less than 5 Minutes | 0 (0.0%) | 0 (0.0%) |
| 5 to 9 Minutes | 0 (0.0%) | 0 (0.0%) |
| 10 to 14 Minutes | 20 (2.4%) | 0 (0.0%) |
| 15 to 19 Minutes | 192 (23.2%) | 70 (22.4%) |
| 20 to 24 Minutes | 177 (21.3%) | 39 (12.5%) |
| 25 to 29 Minutes | 52 (6.3%) | 50 (16.0%) |
| 30 to 34 Minutes | 350 (42.2%) | 55 (17.6%) |
| 35 to 39 Minutes | 21 (2.5%) | 41 (13.1%) |
| 40 to 44 Minutes | 0 (0.0%) | 16 (5.1%) |
| 45 to 59 Minutes | 17 (2.1%) | 11 (3.5%) |
| 60 to 89 Minutes | 0 (0.0%) | 7 (2.2%) |
| 90 or more Minutes | 0 (0.0%) | 23 (7.4%) |
Time of Departure to Work by Sex in Hidden Springs
The most frequent times of departure to work in Hidden Springs are 7:30 AM to 7:59 AM (179, 21.6%) for males and 8:30 AM to 8:59 AM (80, 25.6%) for females.
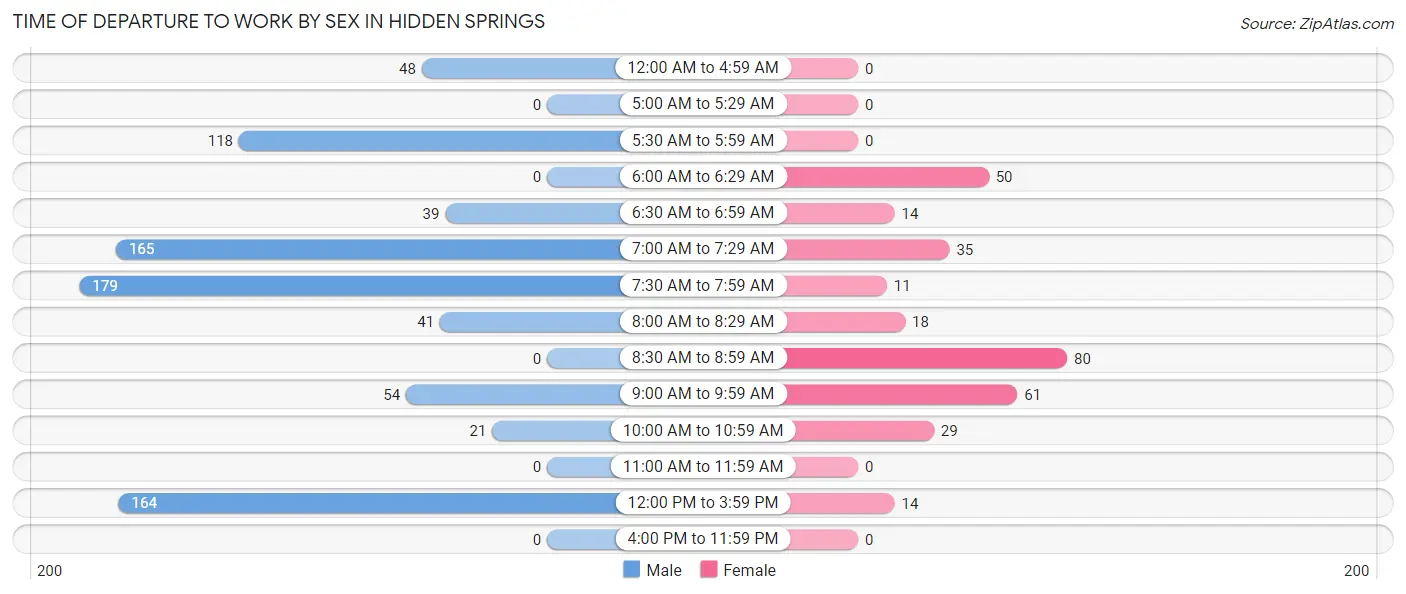
| Time of Departure | Male | Female |
| 12:00 AM to 4:59 AM | 48 (5.8%) | 0 (0.0%) |
| 5:00 AM to 5:29 AM | 0 (0.0%) | 0 (0.0%) |
| 5:30 AM to 5:59 AM | 118 (14.2%) | 0 (0.0%) |
| 6:00 AM to 6:29 AM | 0 (0.0%) | 50 (16.0%) |
| 6:30 AM to 6:59 AM | 39 (4.7%) | 14 (4.5%) |
| 7:00 AM to 7:29 AM | 165 (19.9%) | 35 (11.2%) |
| 7:30 AM to 7:59 AM | 179 (21.6%) | 11 (3.5%) |
| 8:00 AM to 8:29 AM | 41 (5.0%) | 18 (5.8%) |
| 8:30 AM to 8:59 AM | 0 (0.0%) | 80 (25.6%) |
| 9:00 AM to 9:59 AM | 54 (6.5%) | 61 (19.6%) |
| 10:00 AM to 10:59 AM | 21 (2.5%) | 29 (9.3%) |
| 11:00 AM to 11:59 AM | 0 (0.0%) | 0 (0.0%) |
| 12:00 PM to 3:59 PM | 164 (19.8%) | 14 (4.5%) |
| 4:00 PM to 11:59 PM | 0 (0.0%) | 0 (0.0%) |
| Total | 829 (100.0%) | 312 (100.0%) |
Housing Occupancy in Hidden Springs
Occupancy by Ownership in Hidden Springs
Of the total 1,072 dwellings in Hidden Springs, owner-occupied units account for 892 (83.2%), while renter-occupied units make up 180 (16.8%).
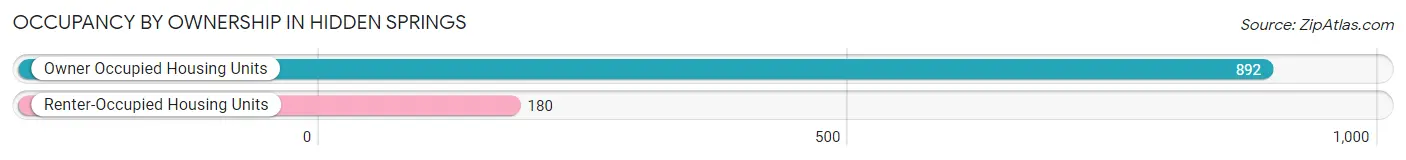
| Occupancy | # Housing Units | % Housing Units |
| Owner Occupied Housing Units | 892 | 83.2% |
| Renter-Occupied Housing Units | 180 | 16.8% |
| Total Occupied Housing Units | 1,072 | 100.0% |
Occupancy by Household Size in Hidden Springs
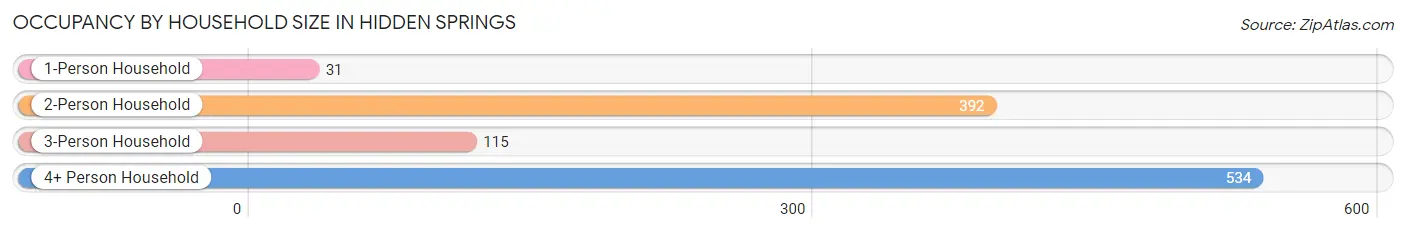
| Household Size | # Housing Units | % Housing Units |
| 1-Person Household | 31 | 2.9% |
| 2-Person Household | 392 | 36.6% |
| 3-Person Household | 115 | 10.7% |
| 4+ Person Household | 534 | 49.8% |
| Total Housing Units | 1,072 | 100.0% |
Occupancy by Ownership by Household Size in Hidden Springs
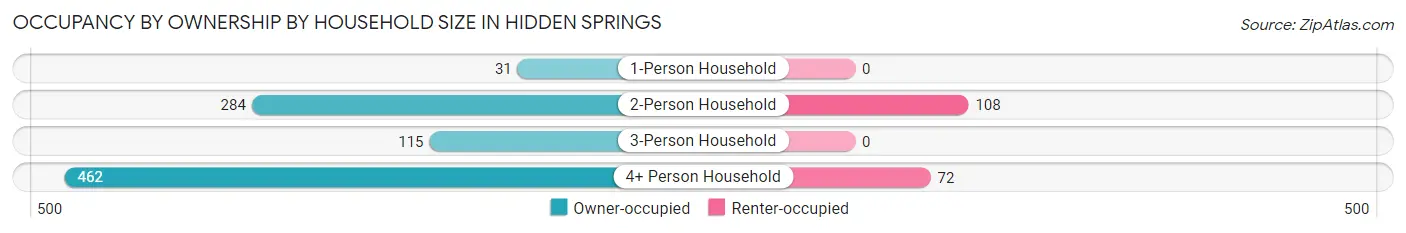
| Household Size | Owner-occupied | Renter-occupied |
| 1-Person Household | 31 (100.0%) | 0 (0.0%) |
| 2-Person Household | 284 (72.5%) | 108 (27.6%) |
| 3-Person Household | 115 (100.0%) | 0 (0.0%) |
| 4+ Person Household | 462 (86.5%) | 72 (13.5%) |
| Total Housing Units | 892 (83.2%) | 180 (16.8%) |
Occupancy by Educational Attainment in Hidden Springs
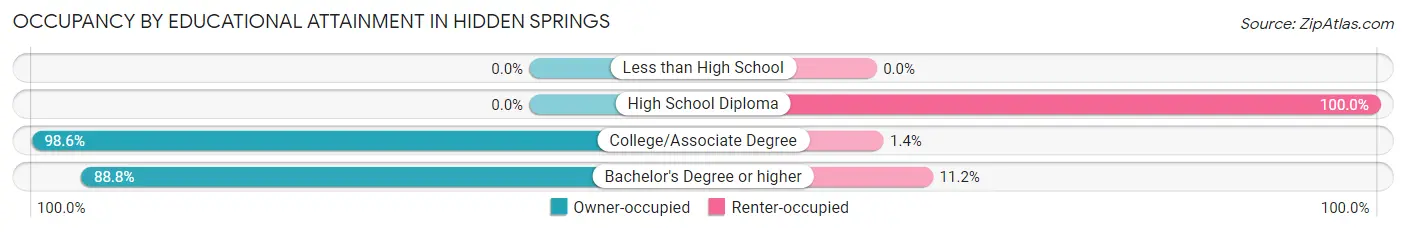
| Household Size | Owner-occupied | Renter-occupied |
| Less than High School | 0 (0.0%) | 0 (0.0%) |
| High School Diploma | 0 (0.0%) | 108 (100.0%) |
| College/Associate Degree | 361 (98.6%) | 5 (1.4%) |
| Bachelor's Degree or higher | 531 (88.8%) | 67 (11.2%) |
Occupancy by Age of Householder in Hidden Springs
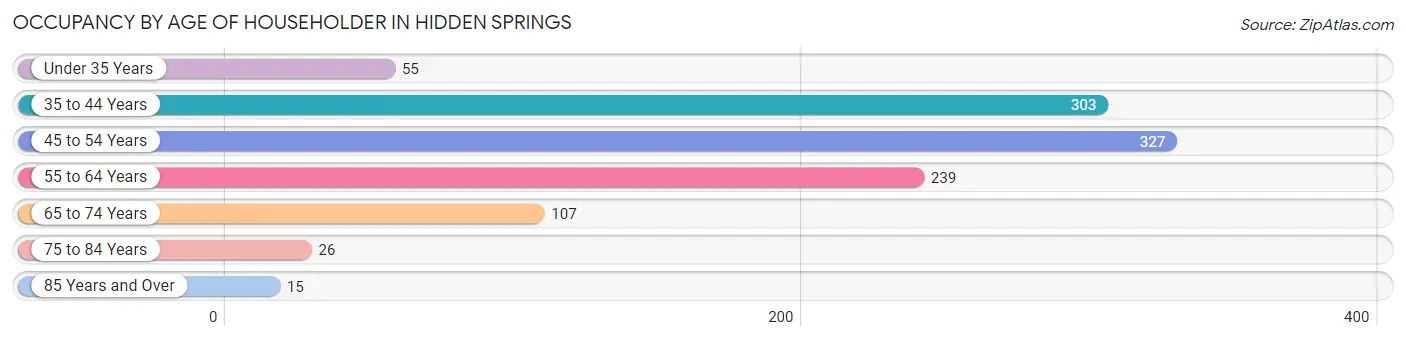
| Age Bracket | # Households | % Households |
| Under 35 Years | 55 | 5.1% |
| 35 to 44 Years | 303 | 28.3% |
| 45 to 54 Years | 327 | 30.5% |
| 55 to 64 Years | 239 | 22.3% |
| 65 to 74 Years | 107 | 10.0% |
| 75 to 84 Years | 26 | 2.4% |
| 85 Years and Over | 15 | 1.4% |
| Total | 1,072 | 100.0% |
Housing Finances in Hidden Springs
Median Income by Occupancy in Hidden Springs
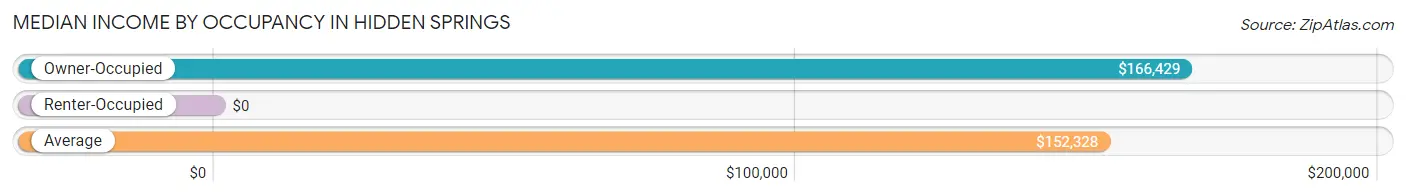
| Occupancy Type | # Households | Median Income |
| Owner-Occupied | 892 (83.2%) | $166,429 |
| Renter-Occupied | 180 (16.8%) | $0 |
| Average | 1,072 (100.0%) | $152,328 |
Occupancy by Householder Income Bracket in Hidden Springs
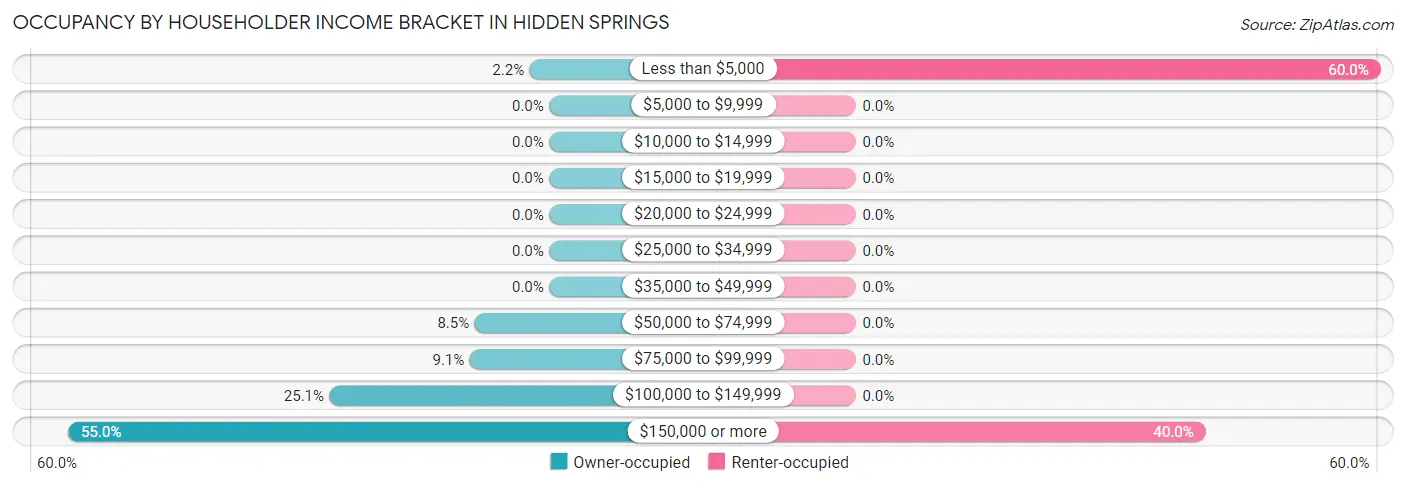
| Income Bracket | Owner-occupied | Renter-occupied |
| Less than $5,000 | 20 (2.2%) | 108 (60.0%) |
| $5,000 to $9,999 | 0 (0.0%) | 0 (0.0%) |
| $10,000 to $14,999 | 0 (0.0%) | 0 (0.0%) |
| $15,000 to $19,999 | 0 (0.0%) | 0 (0.0%) |
| $20,000 to $24,999 | 0 (0.0%) | 0 (0.0%) |
| $25,000 to $34,999 | 0 (0.0%) | 0 (0.0%) |
| $35,000 to $49,999 | 0 (0.0%) | 0 (0.0%) |
| $50,000 to $74,999 | 76 (8.5%) | 0 (0.0%) |
| $75,000 to $99,999 | 81 (9.1%) | 0 (0.0%) |
| $100,000 to $149,999 | 224 (25.1%) | 0 (0.0%) |
| $150,000 or more | 491 (55.0%) | 72 (40.0%) |
| Total | 892 (100.0%) | 180 (100.0%) |
Monthly Housing Cost Tiers in Hidden Springs
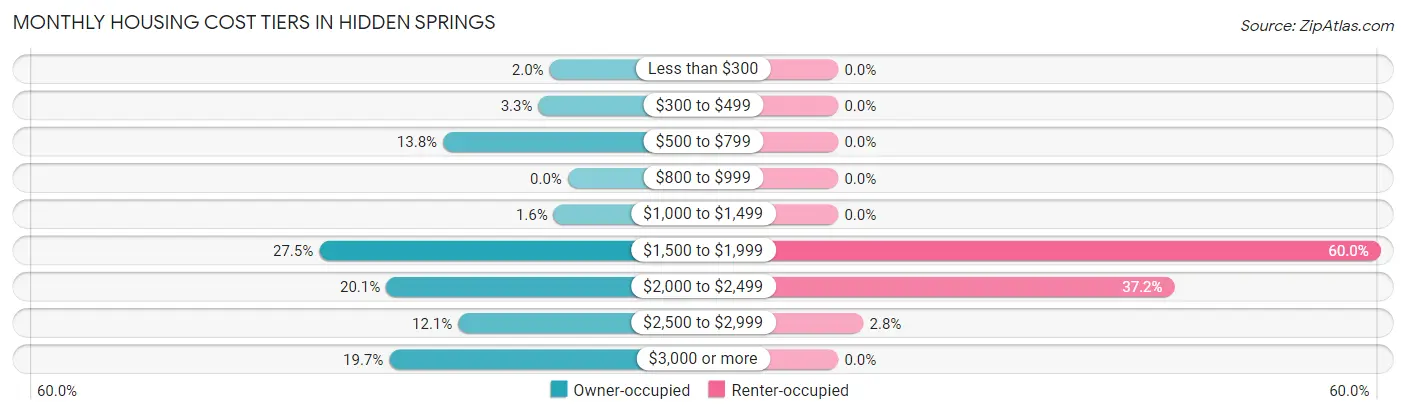
| Monthly Cost | Owner-occupied | Renter-occupied |
| Less than $300 | 18 (2.0%) | 0 (0.0%) |
| $300 to $499 | 29 (3.3%) | 0 (0.0%) |
| $500 to $799 | 123 (13.8%) | 0 (0.0%) |
| $800 to $999 | 0 (0.0%) | 0 (0.0%) |
| $1,000 to $1,499 | 14 (1.6%) | 0 (0.0%) |
| $1,500 to $1,999 | 245 (27.5%) | 108 (60.0%) |
| $2,000 to $2,499 | 179 (20.1%) | 67 (37.2%) |
| $2,500 to $2,999 | 108 (12.1%) | 5 (2.8%) |
| $3,000 or more | 176 (19.7%) | 0 (0.0%) |
| Total | 892 (100.0%) | 180 (100.0%) |
Physical Housing Characteristics in Hidden Springs
Housing Structures in Hidden Springs
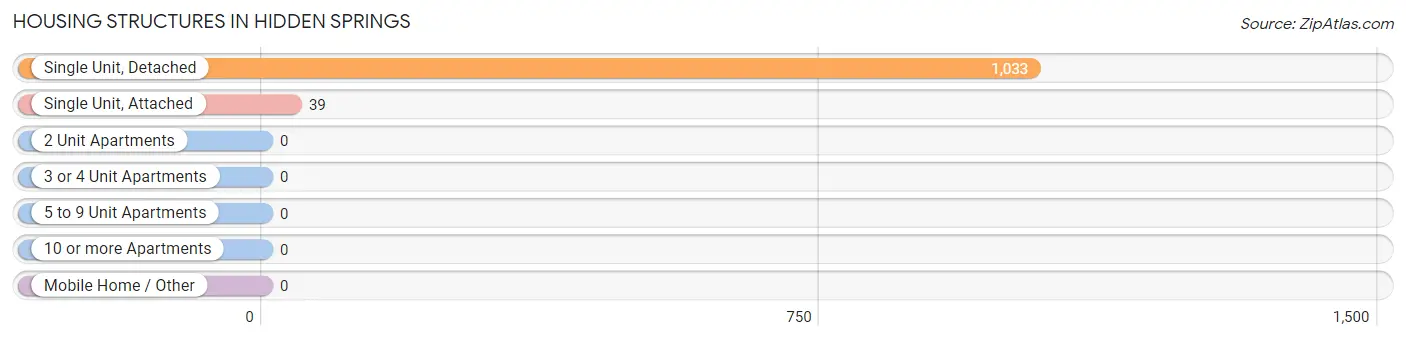
| Structure Type | # Housing Units | % Housing Units |
| Single Unit, Detached | 1,033 | 96.4% |
| Single Unit, Attached | 39 | 3.6% |
| 2 Unit Apartments | 0 | 0.0% |
| 3 or 4 Unit Apartments | 0 | 0.0% |
| 5 to 9 Unit Apartments | 0 | 0.0% |
| 10 or more Apartments | 0 | 0.0% |
| Mobile Home / Other | 0 | 0.0% |
| Total | 1,072 | 100.0% |
Housing Structures by Occupancy in Hidden Springs
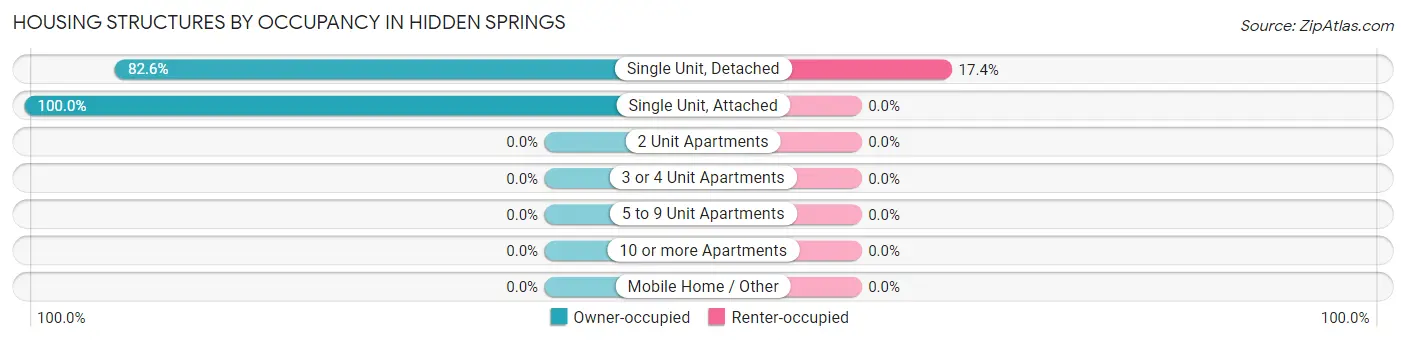
| Structure Type | Owner-occupied | Renter-occupied |
| Single Unit, Detached | 853 (82.6%) | 180 (17.4%) |
| Single Unit, Attached | 39 (100.0%) | 0 (0.0%) |
| 2 Unit Apartments | 0 (0.0%) | 0 (0.0%) |
| 3 or 4 Unit Apartments | 0 (0.0%) | 0 (0.0%) |
| 5 to 9 Unit Apartments | 0 (0.0%) | 0 (0.0%) |
| 10 or more Apartments | 0 (0.0%) | 0 (0.0%) |
| Mobile Home / Other | 0 (0.0%) | 0 (0.0%) |
| Total | 892 (83.2%) | 180 (16.8%) |
Housing Structures by Number of Rooms in Hidden Springs
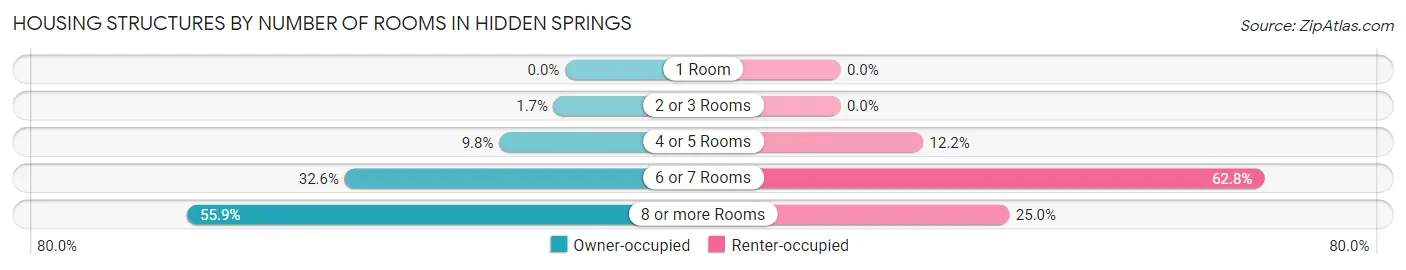
| Number of Rooms | Owner-occupied | Renter-occupied |
| 1 Room | 0 (0.0%) | 0 (0.0%) |
| 2 or 3 Rooms | 15 (1.7%) | 0 (0.0%) |
| 4 or 5 Rooms | 87 (9.8%) | 22 (12.2%) |
| 6 or 7 Rooms | 291 (32.6%) | 113 (62.8%) |
| 8 or more Rooms | 499 (55.9%) | 45 (25.0%) |
| Total | 892 (100.0%) | 180 (100.0%) |
Housing Structure by Heating Type in Hidden Springs
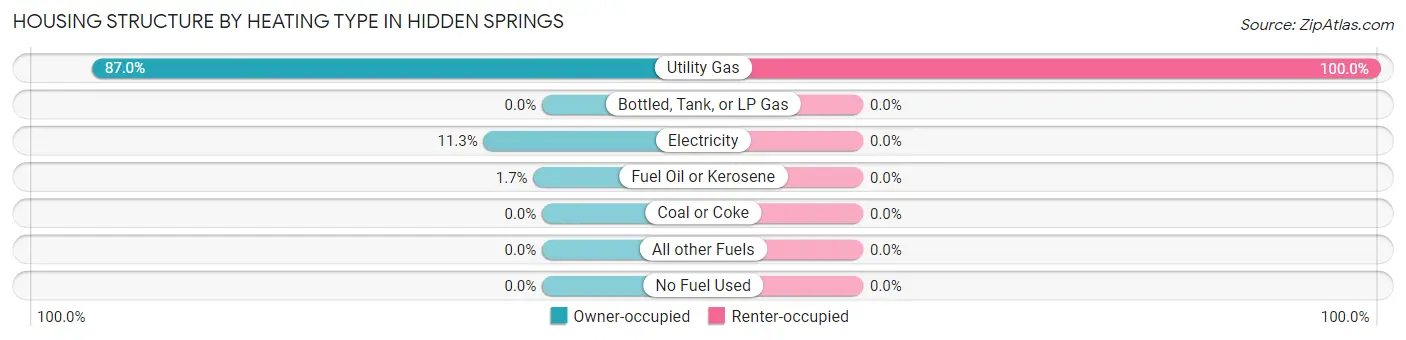
| Heating Type | Owner-occupied | Renter-occupied |
| Utility Gas | 776 (87.0%) | 180 (100.0%) |
| Bottled, Tank, or LP Gas | 0 (0.0%) | 0 (0.0%) |
| Electricity | 101 (11.3%) | 0 (0.0%) |
| Fuel Oil or Kerosene | 15 (1.7%) | 0 (0.0%) |
| Coal or Coke | 0 (0.0%) | 0 (0.0%) |
| All other Fuels | 0 (0.0%) | 0 (0.0%) |
| No Fuel Used | 0 (0.0%) | 0 (0.0%) |
| Total | 892 (100.0%) | 180 (100.0%) |
Household Vehicle Usage in Hidden Springs
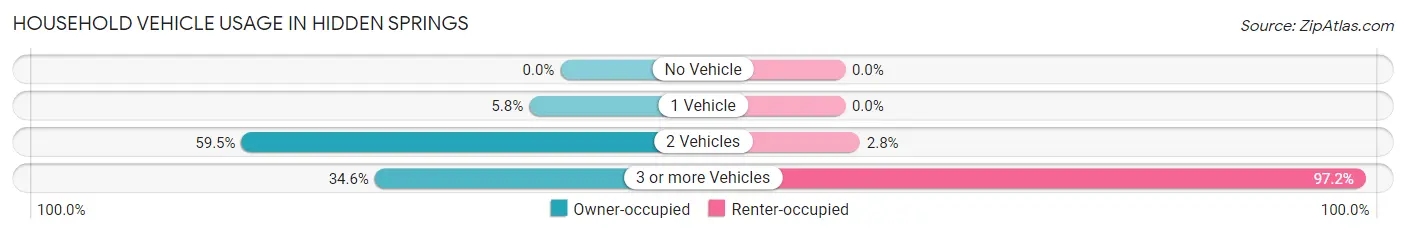
| Vehicles per Household | Owner-occupied | Renter-occupied |
| No Vehicle | 0 (0.0%) | 0 (0.0%) |
| 1 Vehicle | 52 (5.8%) | 0 (0.0%) |
| 2 Vehicles | 531 (59.5%) | 5 (2.8%) |
| 3 or more Vehicles | 309 (34.6%) | 175 (97.2%) |
| Total | 892 (100.0%) | 180 (100.0%) |
Real Estate & Mortgages in Hidden Springs
Real Estate and Mortgage Overview in Hidden Springs
| Characteristic | Without Mortgage | With Mortgage |
| Housing Units | 166 | 726 |
| Median Property Value | $629,500 | $676,900 |
| Median Household Income | $179,333 | $383 |
| Monthly Housing Costs | $587 | $176 |
| Real Estate Taxes | $4,352 | $0 |
Property Value by Mortgage Status in Hidden Springs
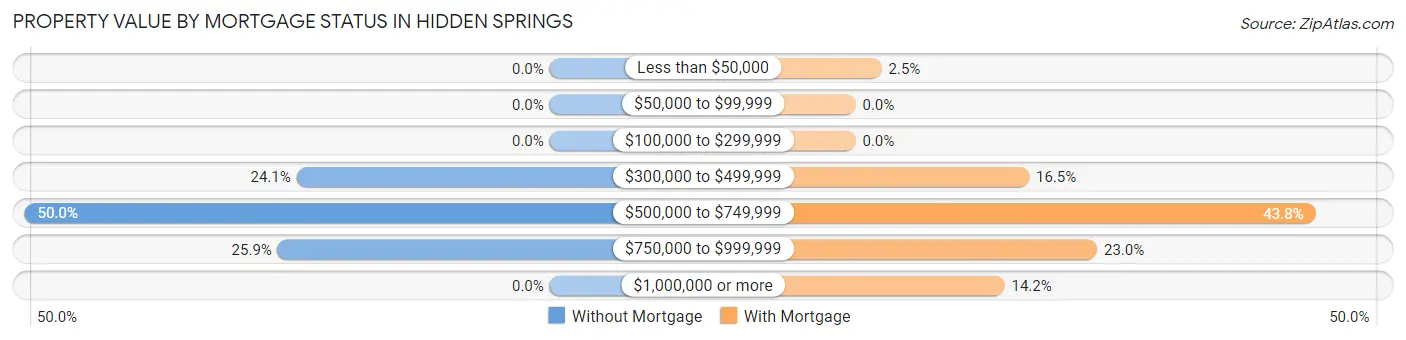
| Property Value | Without Mortgage | With Mortgage |
| Less than $50,000 | 0 (0.0%) | 18 (2.5%) |
| $50,000 to $99,999 | 0 (0.0%) | 0 (0.0%) |
| $100,000 to $299,999 | 0 (0.0%) | 0 (0.0%) |
| $300,000 to $499,999 | 40 (24.1%) | 120 (16.5%) |
| $500,000 to $749,999 | 83 (50.0%) | 318 (43.8%) |
| $750,000 to $999,999 | 43 (25.9%) | 167 (23.0%) |
| $1,000,000 or more | 0 (0.0%) | 103 (14.2%) |
| Total | 166 (100.0%) | 726 (100.0%) |
Household Income by Mortgage Status in Hidden Springs
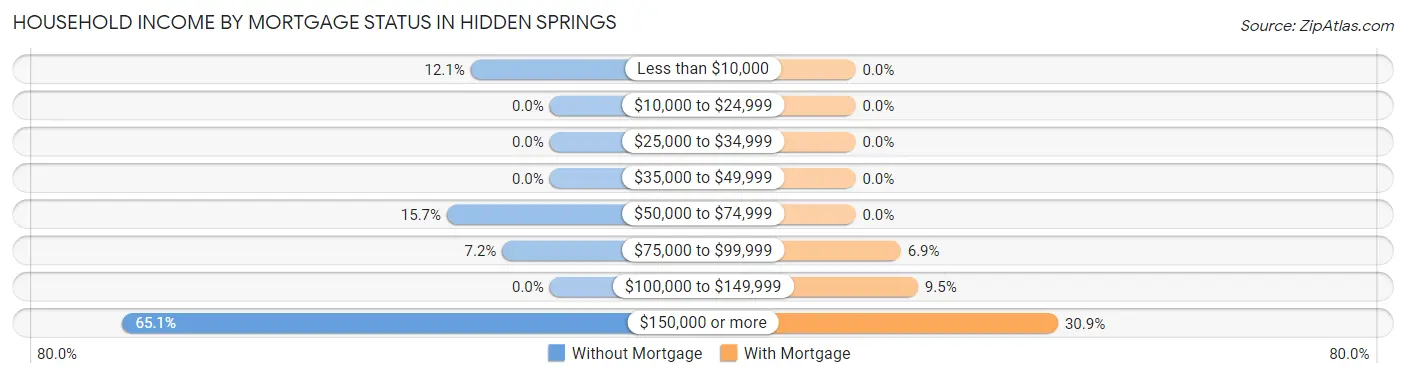
| Household Income | Without Mortgage | With Mortgage |
| Less than $10,000 | 20 (12.0%) | 0 (0.0%) |
| $10,000 to $24,999 | 0 (0.0%) | 0 (0.0%) |
| $25,000 to $34,999 | 0 (0.0%) | 0 (0.0%) |
| $35,000 to $49,999 | 0 (0.0%) | 0 (0.0%) |
| $50,000 to $74,999 | 26 (15.7%) | 0 (0.0%) |
| $75,000 to $99,999 | 12 (7.2%) | 50 (6.9%) |
| $100,000 to $149,999 | 0 (0.0%) | 69 (9.5%) |
| $150,000 or more | 108 (65.1%) | 224 (30.8%) |
| Total | 166 (100.0%) | 726 (100.0%) |
Property Value to Household Income Ratio in Hidden Springs
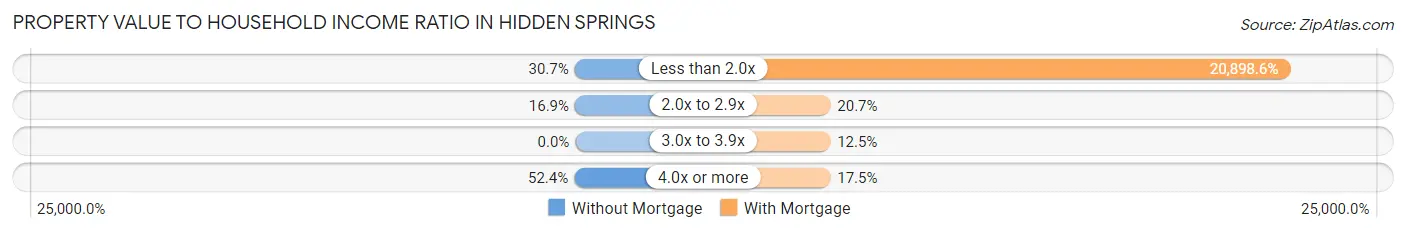
| Value-to-Income Ratio | Without Mortgage | With Mortgage |
| Less than 2.0x | 51 (30.7%) | 151,724 (20,898.6%) |
| 2.0x to 2.9x | 28 (16.9%) | 150 (20.7%) |
| 3.0x to 3.9x | 0 (0.0%) | 91 (12.5%) |
| 4.0x or more | 87 (52.4%) | 127 (17.5%) |
| Total | 166 (100.0%) | 726 (100.0%) |
Real Estate Taxes by Mortgage Status in Hidden Springs
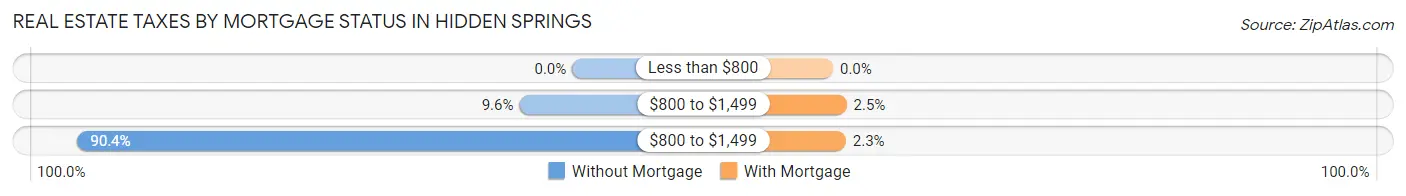
| Property Taxes | Without Mortgage | With Mortgage |
| Less than $800 | 0 (0.0%) | 0 (0.0%) |
| $800 to $1,499 | 16 (9.6%) | 18 (2.5%) |
| $800 to $1,499 | 150 (90.4%) | 17 (2.3%) |
| Total | 166 (100.0%) | 726 (100.0%) |
Health & Disability in Hidden Springs
Health Insurance Coverage by Age in Hidden Springs
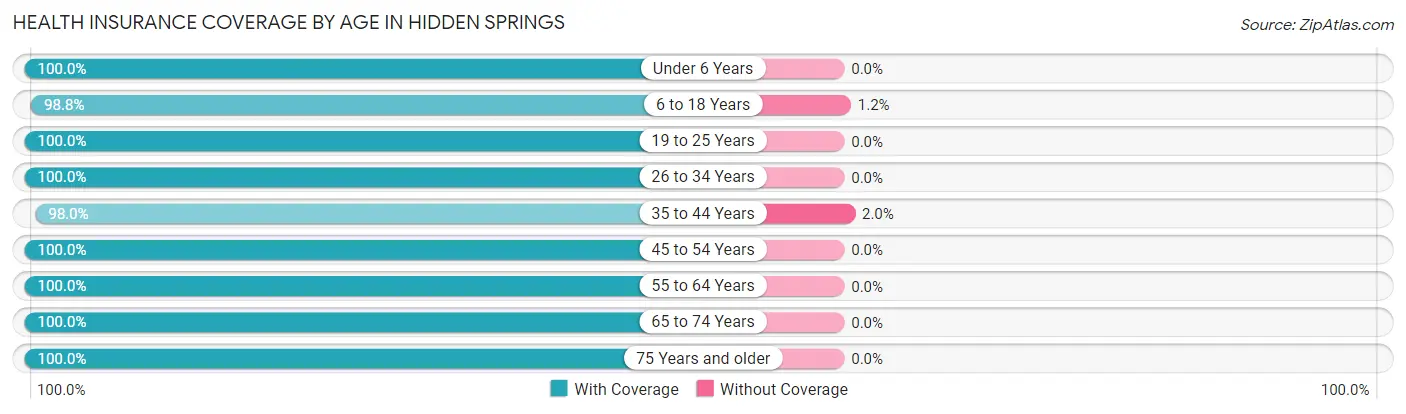
| Age Bracket | With Coverage | Without Coverage |
| Under 6 Years | 259 (100.0%) | 0 (0.0%) |
| 6 to 18 Years | 1,053 (98.8%) | 13 (1.2%) |
| 19 to 25 Years | 82 (100.0%) | 0 (0.0%) |
| 26 to 34 Years | 212 (100.0%) | 0 (0.0%) |
| 35 to 44 Years | 540 (98.0%) | 11 (2.0%) |
| 45 to 54 Years | 657 (100.0%) | 0 (0.0%) |
| 55 to 64 Years | 465 (100.0%) | 0 (0.0%) |
| 65 to 74 Years | 206 (100.0%) | 0 (0.0%) |
| 75 Years and older | 86 (100.0%) | 0 (0.0%) |
| Total | 3,560 (99.3%) | 24 (0.7%) |
Health Insurance Coverage by Citizenship Status in Hidden Springs
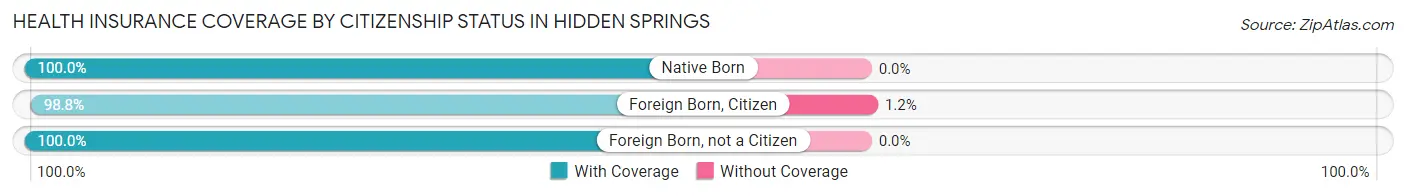
| Citizenship Status | With Coverage | Without Coverage |
| Native Born | 259 (100.0%) | 0 (0.0%) |
| Foreign Born, Citizen | 1,053 (98.8%) | 13 (1.2%) |
| Foreign Born, not a Citizen | 82 (100.0%) | 0 (0.0%) |
Health Insurance Coverage by Household Income in Hidden Springs
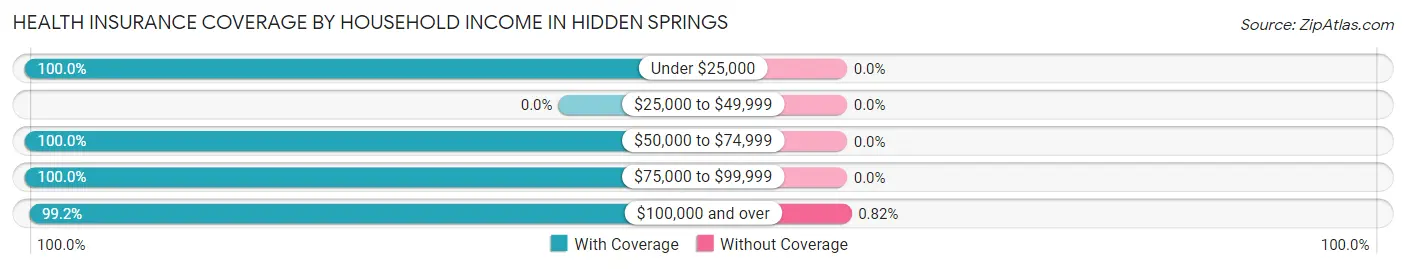
| Household Income | With Coverage | Without Coverage |
| Under $25,000 | 234 (100.0%) | 0 (0.0%) |
| $25,000 to $49,999 | 0 (0.0%) | 0 (0.0%) |
| $50,000 to $74,999 | 136 (100.0%) | 0 (0.0%) |
| $75,000 to $99,999 | 289 (100.0%) | 0 (0.0%) |
| $100,000 and over | 2,901 (99.2%) | 24 (0.8%) |
Public vs Private Health Insurance Coverage by Age in Hidden Springs
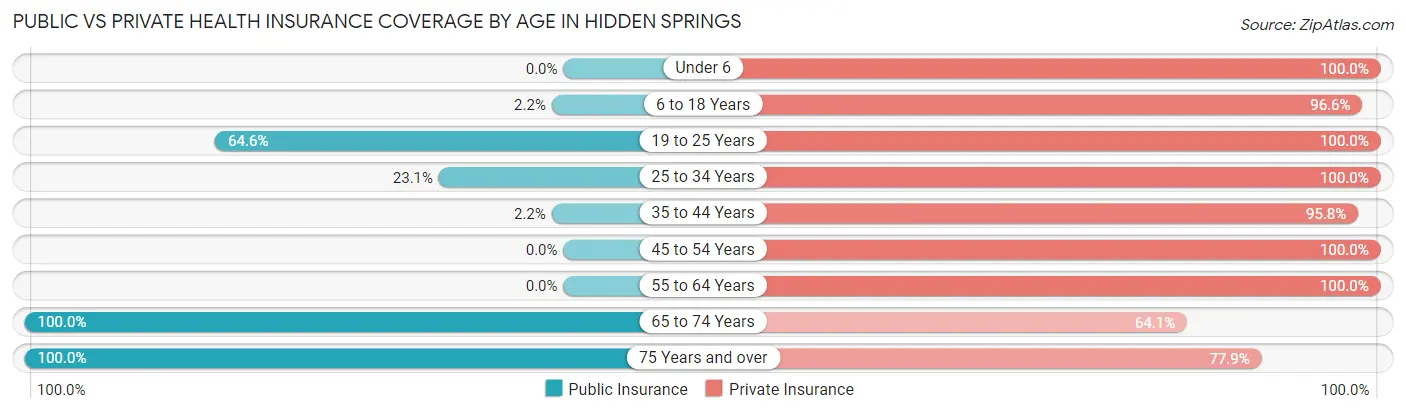
| Age Bracket | Public Insurance | Private Insurance |
| Under 6 | 0 (0.0%) | 259 (100.0%) |
| 6 to 18 Years | 23 (2.2%) | 1,030 (96.6%) |
| 19 to 25 Years | 53 (64.6%) | 82 (100.0%) |
| 25 to 34 Years | 49 (23.1%) | 212 (100.0%) |
| 35 to 44 Years | 12 (2.2%) | 528 (95.8%) |
| 45 to 54 Years | 0 (0.0%) | 657 (100.0%) |
| 55 to 64 Years | 0 (0.0%) | 465 (100.0%) |
| 65 to 74 Years | 206 (100.0%) | 132 (64.1%) |
| 75 Years and over | 86 (100.0%) | 67 (77.9%) |
| Total | 429 (12.0%) | 3,432 (95.8%) |
Disability Status by Sex by Age in Hidden Springs
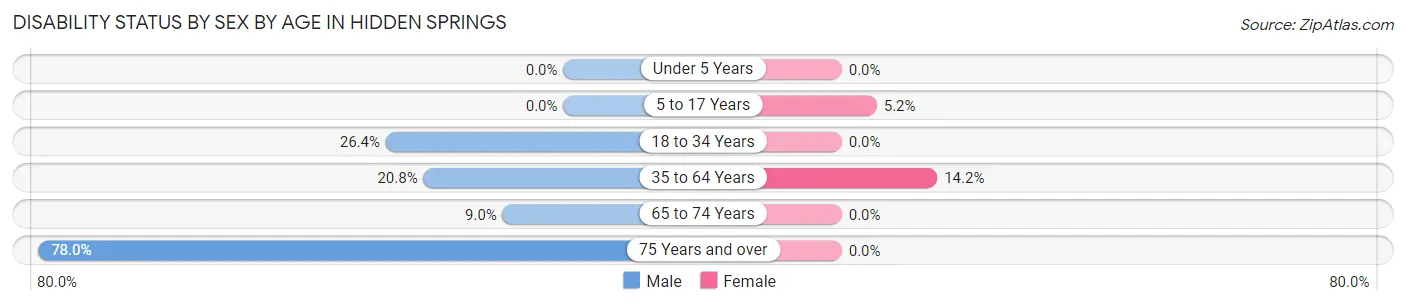
| Age Bracket | Male | Female |
| Under 5 Years | 0 (0.0%) | 0 (0.0%) |
| 5 to 17 Years | 0 (0.0%) | 25 (5.2%) |
| 18 to 34 Years | 53 (26.4%) | 0 (0.0%) |
| 35 to 64 Years | 173 (20.8%) | 119 (14.2%) |
| 65 to 74 Years | 10 (9.0%) | 0 (0.0%) |
| 75 Years and over | 46 (78.0%) | 0 (0.0%) |
Disability Class by Sex by Age in Hidden Springs
Disability Class: Hearing Difficulty
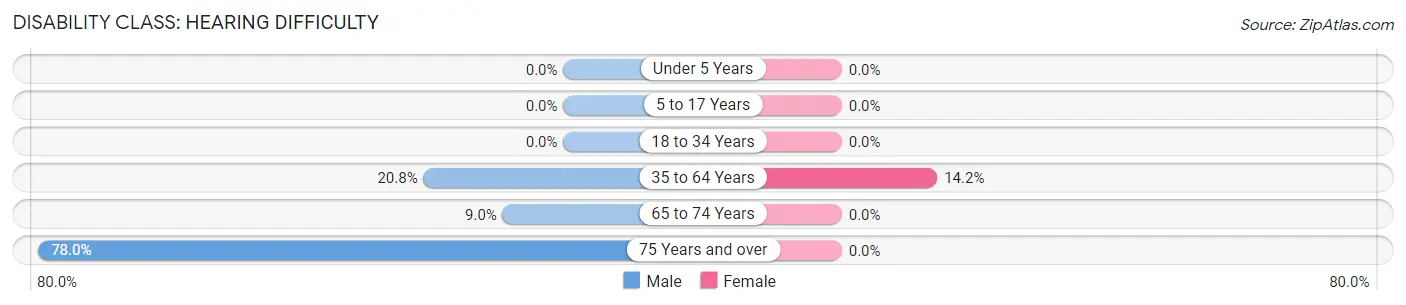
| Age Bracket | Male | Female |
| Under 5 Years | 0 (0.0%) | 0 (0.0%) |
| 5 to 17 Years | 0 (0.0%) | 0 (0.0%) |
| 18 to 34 Years | 0 (0.0%) | 0 (0.0%) |
| 35 to 64 Years | 173 (20.8%) | 119 (14.2%) |
| 65 to 74 Years | 10 (9.0%) | 0 (0.0%) |
| 75 Years and over | 46 (78.0%) | 0 (0.0%) |
Disability Class: Vision Difficulty
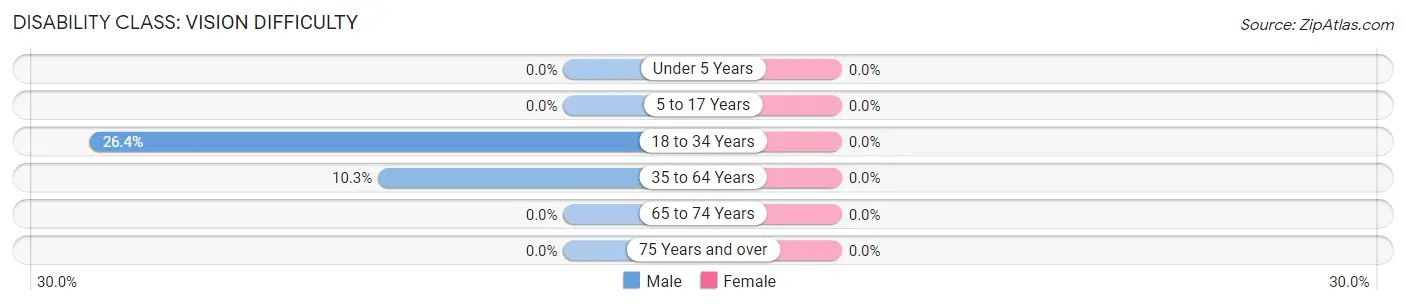
| Age Bracket | Male | Female |
| Under 5 Years | 0 (0.0%) | 0 (0.0%) |
| 5 to 17 Years | 0 (0.0%) | 0 (0.0%) |
| 18 to 34 Years | 53 (26.4%) | 0 (0.0%) |
| 35 to 64 Years | 86 (10.3%) | 0 (0.0%) |
| 65 to 74 Years | 0 (0.0%) | 0 (0.0%) |
| 75 Years and over | 0 (0.0%) | 0 (0.0%) |
Disability Class: Cognitive Difficulty
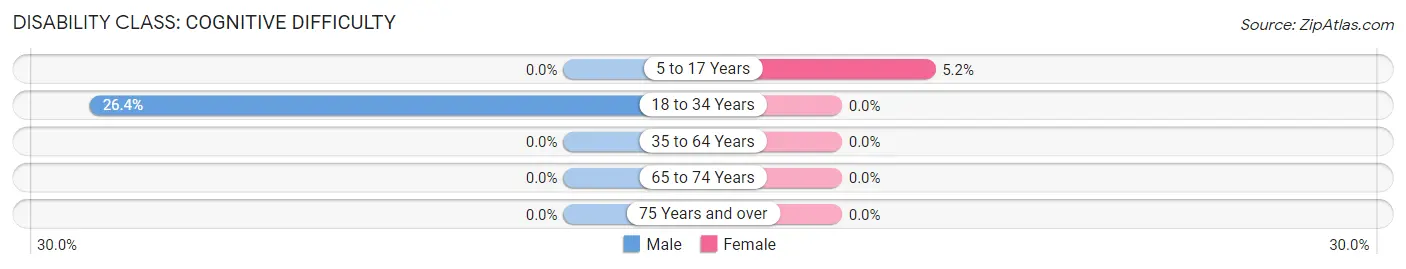
| Age Bracket | Male | Female |
| 5 to 17 Years | 0 (0.0%) | 25 (5.2%) |
| 18 to 34 Years | 53 (26.4%) | 0 (0.0%) |
| 35 to 64 Years | 0 (0.0%) | 0 (0.0%) |
| 65 to 74 Years | 0 (0.0%) | 0 (0.0%) |
| 75 Years and over | 0 (0.0%) | 0 (0.0%) |
Disability Class: Ambulatory Difficulty
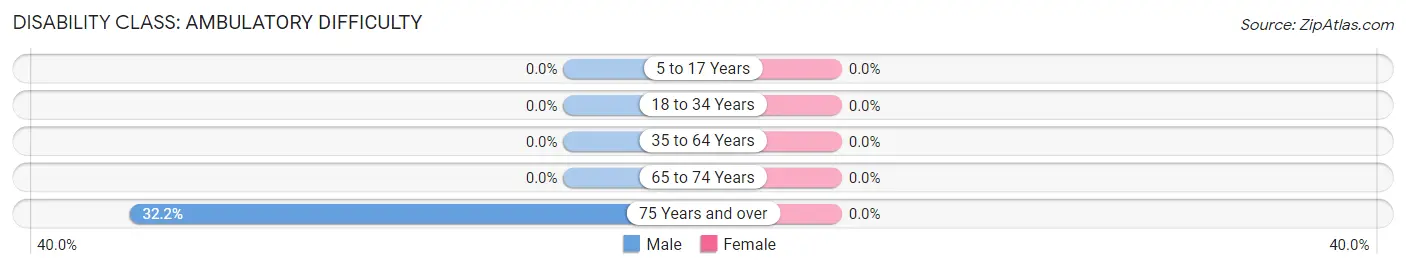
| Age Bracket | Male | Female |
| 5 to 17 Years | 0 (0.0%) | 0 (0.0%) |
| 18 to 34 Years | 0 (0.0%) | 0 (0.0%) |
| 35 to 64 Years | 0 (0.0%) | 0 (0.0%) |
| 65 to 74 Years | 0 (0.0%) | 0 (0.0%) |
| 75 Years and over | 19 (32.2%) | 0 (0.0%) |
Disability Class: Self-Care Difficulty
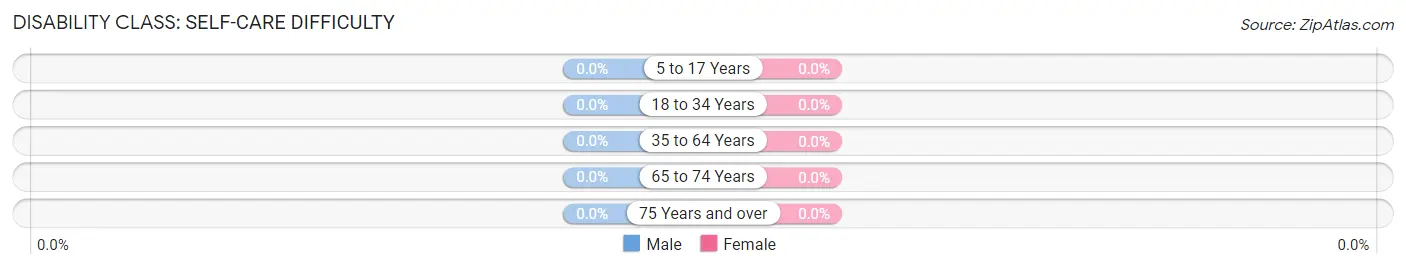
| Age Bracket | Male | Female |
| 5 to 17 Years | 0 (0.0%) | 0 (0.0%) |
| 18 to 34 Years | 0 (0.0%) | 0 (0.0%) |
| 35 to 64 Years | 0 (0.0%) | 0 (0.0%) |
| 65 to 74 Years | 0 (0.0%) | 0 (0.0%) |
| 75 Years and over | 0 (0.0%) | 0 (0.0%) |
Technology Access in Hidden Springs
Computing Device Access in Hidden Springs
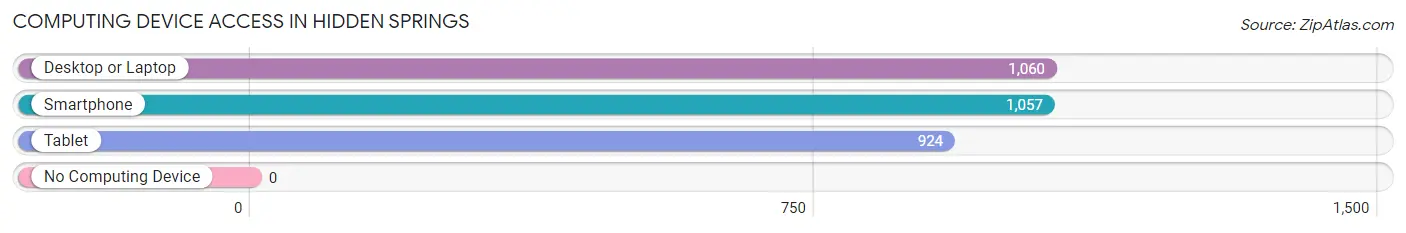
| Device Type | # Households | % Households |
| Desktop or Laptop | 1,060 | 98.9% |
| Smartphone | 1,057 | 98.6% |
| Tablet | 924 | 86.2% |
| No Computing Device | 0 | 0.0% |
| Total | 1,072 | 100.0% |
Internet Access in Hidden Springs
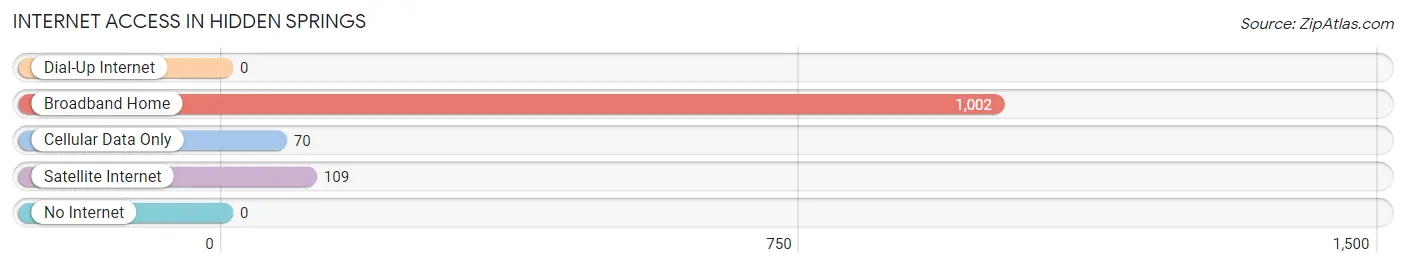
| Internet Type | # Households | % Households |
| Dial-Up Internet | 0 | 0.0% |
| Broadband Home | 1,002 | 93.5% |
| Cellular Data Only | 70 | 6.5% |
| Satellite Internet | 109 | 10.2% |
| No Internet | 0 | 0.0% |
| Total | 1,072 | 100.0% |
Hidden Springs Summary
Hidden Springs is a small town located in the western part of the state of Idaho, approximately 20 miles northwest of Boise. It is situated in the foothills of the Boise Mountains, and is surrounded by lush forests and rolling hills. The town has a population of approximately 1,500 people, and is known for its rural charm and small-town atmosphere.
History
The area that is now known as Hidden Springs was first settled in the late 1800s by homesteaders who were drawn to the area by its abundant natural resources. The town was officially incorporated in 1908, and was named after the nearby springs that were hidden in the surrounding hills.
In the early 1900s, the town was a thriving agricultural community, with many of the residents working in the local farms and ranches. The town also had a thriving lumber industry, and the local sawmill was a major employer in the area.
In the 1950s, the town began to experience a decline in population as many of the residents moved away to larger cities. However, in the late 1970s, the town experienced a resurgence in population as people began to move back to the area in search of a more rural lifestyle.
Geography
Hidden Springs is located in the western part of the state of Idaho, approximately 20 miles northwest of Boise. It is situated in the foothills of the Boise Mountains, and is surrounded by lush forests and rolling hills. The town is located at an elevation of approximately 3,000 feet, and has a total area of 1.3 square miles.
The climate in Hidden Springs is generally mild, with temperatures ranging from the low 30s in the winter to the high 80s in the summer. The town receives an average of 18 inches of precipitation per year, with most of it falling in the form of snow in the winter months.
Economy
The economy of Hidden Springs is largely based on agriculture and tourism. The town is home to several farms and ranches, and the local farmers produce a variety of crops, including potatoes, corn, and hay. The town also has a thriving tourism industry, with many visitors coming to the area to enjoy the natural beauty of the surrounding mountains and forests.
The town also has a number of small businesses, including restaurants, shops, and other services. The local government also provides a number of services to the community, including police and fire protection, water and sewer services, and garbage collection.
Demographics
As of the 2010 census, the population of Hidden Springs was 1,500 people. The racial makeup of the town was 95.3% White, 0.7% African American, 0.7% Native American, 0.7% Asian, 0.3% Pacific Islander, and 1.7% from other races. The median household income in the town was $45,000, and the median age was 37 years.
Conclusion
Hidden Springs is a small town located in the western part of the state of Idaho, approximately 20 miles northwest of Boise. It is situated in the foothills of the Boise Mountains, and is surrounded by lush forests and rolling hills. The town has a population of approximately 1,500 people, and is known for its rural charm and small-town atmosphere. The economy of Hidden Springs is largely based on agriculture and tourism, and the town is home to several farms and ranches, as well as a number of small businesses. The racial makeup of the town is predominantly White, with a small percentage of African American, Native American, Asian, and Pacific Islander residents.
Common Questions
What is Per Capita Income in Hidden Springs?
Per Capita income in Hidden Springs is $61,499.
What is the Median Family Income in Hidden Springs?
Median Family Income in Hidden Springs is $133,264.
What is the Median Household income in Hidden Springs?
Median Household Income in Hidden Springs is $152,328.
What is Income or Wage Gap in Hidden Springs?
Income or Wage Gap in Hidden Springs is 48.8%.
Women in Hidden Springs earn 51.2 cents for every dollar earned by a man.
What is Inequality or Gini Index in Hidden Springs?
Inequality or Gini Index in Hidden Springs is 0.45.
What is the Total Population of Hidden Springs?
Total Population of Hidden Springs is 3,584.
What is the Total Male Population of Hidden Springs?
Total Male Population of Hidden Springs is 1,970.
What is the Total Female Population of Hidden Springs?
Total Female Population of Hidden Springs is 1,614.
What is the Ratio of Males per 100 Females in Hidden Springs?
There are 122.06 Males per 100 Females in Hidden Springs.
What is the Ratio of Females per 100 Males in Hidden Springs?
There are 81.93 Females per 100 Males in Hidden Springs.
What is the Median Population Age in Hidden Springs?
Median Population Age in Hidden Springs is 38.1 Years.
What is the Average Family Size in Hidden Springs
Average Family Size in Hidden Springs is 3.4 People.
What is the Average Household Size in Hidden Springs
Average Household Size in Hidden Springs is 3.3 People.
How Large is the Labor Force in Hidden Springs?
There are 1,578 People in the Labor Forcein in Hidden Springs.
What is the Percentage of People in the Labor Force in Hidden Springs?
61.9% of People are in the Labor Force in Hidden Springs.
What is the Unemployment Rate in Hidden Springs?
Unemployment Rate in Hidden Springs is 1.6%.