Groveland, ID Map & Demographics
Groveland Map
Groveland Overview
$20,746
PER CAPITA INCOME
$66,364
AVG FAMILY INCOME
$54,115
AVG HOUSEHOLD INCOME
0.26
INEQUALITY / GINI INDEX
1,190
TOTAL POPULATION
507
MALE POPULATION
683
FEMALE POPULATION
74.23
MALES / 100 FEMALES
134.71
FEMALES / 100 MALES
29.6
MEDIAN AGE
3.1
AVG FAMILY SIZE
2.9
AVG HOUSEHOLD SIZE
452
LABOR FORCE [ PEOPLE ]
59.2%
PERCENT IN LABOR FORCE
4.0%
UNEMPLOYMENT RATE
Income in Groveland
Income Overview in Groveland
Per Capita Income in Groveland is $20,746, while median incomes of families and households are $66,364 and $54,115 respectively.
| Characteristic | Number | Measure |
| Per Capita Income | 1,190 | $20,746 |
| Median Family Income | 376 | $66,364 |
| Mean Family Income | 376 | $68,605 |
| Median Household Income | 405 | $54,115 |
| Mean Household Income | 405 | $66,477 |
| Income Deficit | 376 | $0 |
| Wage / Income Gap (%) | 1,190 | 0.00% |
| Wage / Income Gap ($) | 1,190 | 100.00¢ per $1 |
| Gini / Inequality Index | 1,190 | 0.26 |
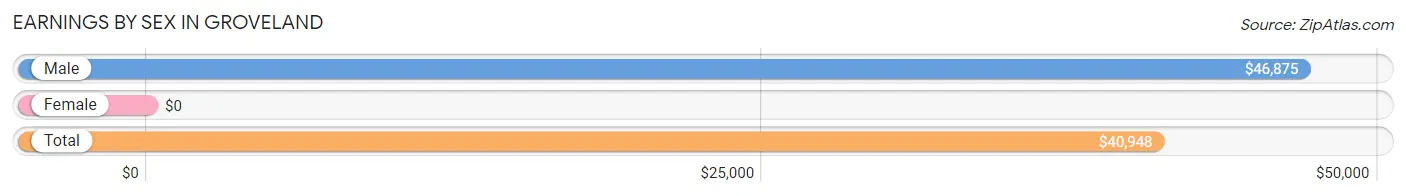
Earnings by Sex in Groveland
| Sex | Number | Average Earnings |
| Male | 278 (58.4%) | $46,875 |
| Female | 198 (41.6%) | $0 |
| Total | 476 (100.0%) | $40,948 |
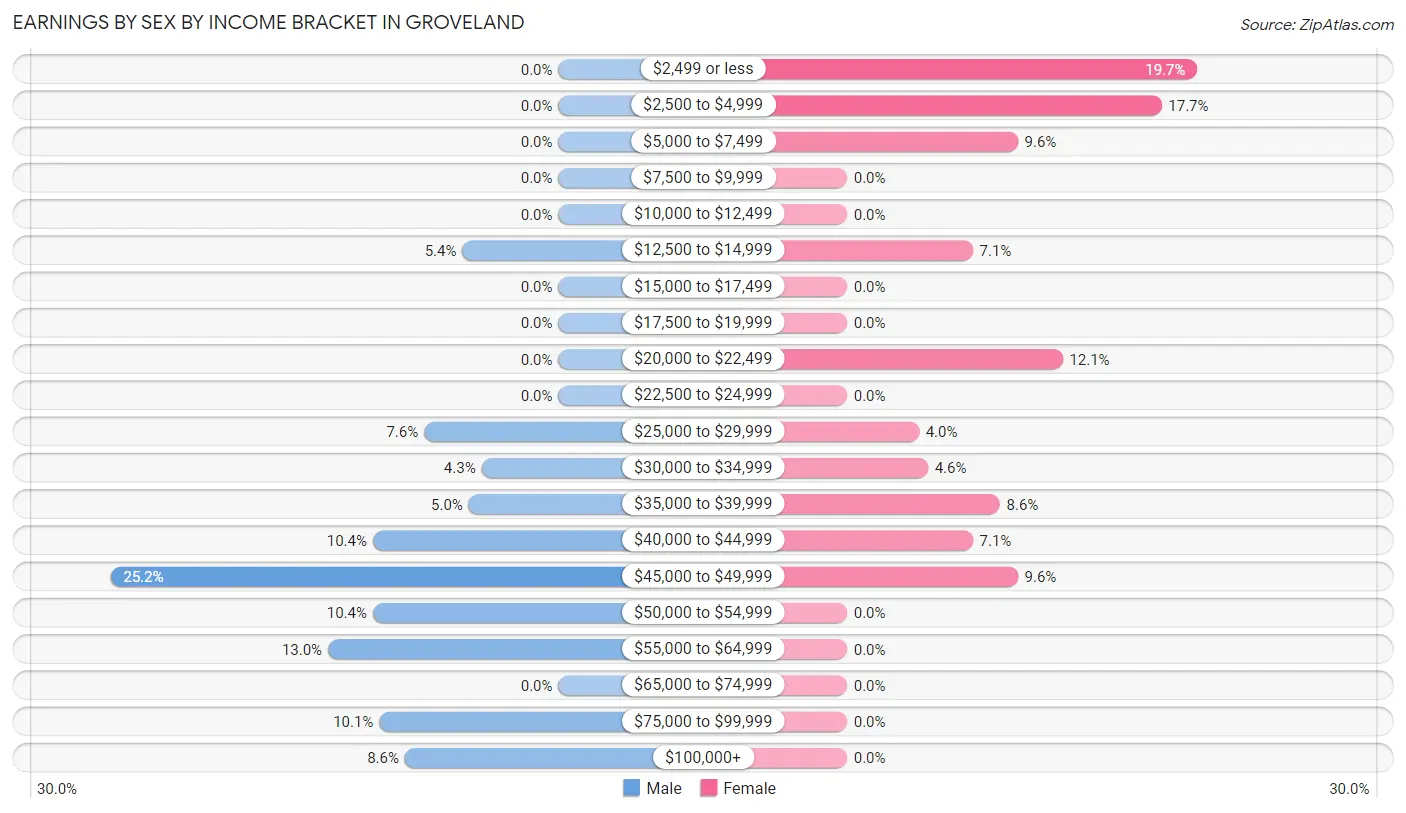
Earnings by Sex by Income Bracket in Groveland
The most common earnings brackets in Groveland are $45,000 to $49,999 for men (70 | 25.2%) and $2,499 or less for women (39 | 19.7%).
| Income | Male | Female |
| $2,499 or less | 0 (0.0%) | 39 (19.7%) |
| $2,500 to $4,999 | 0 (0.0%) | 35 (17.7%) |
| $5,000 to $7,499 | 0 (0.0%) | 19 (9.6%) |
| $7,500 to $9,999 | 0 (0.0%) | 0 (0.0%) |
| $10,000 to $12,499 | 0 (0.0%) | 0 (0.0%) |
| $12,500 to $14,999 | 15 (5.4%) | 14 (7.1%) |
| $15,000 to $17,499 | 0 (0.0%) | 0 (0.0%) |
| $17,500 to $19,999 | 0 (0.0%) | 0 (0.0%) |
| $20,000 to $22,499 | 0 (0.0%) | 24 (12.1%) |
| $22,500 to $24,999 | 0 (0.0%) | 0 (0.0%) |
| $25,000 to $29,999 | 21 (7.5%) | 8 (4.0%) |
| $30,000 to $34,999 | 12 (4.3%) | 9 (4.5%) |
| $35,000 to $39,999 | 14 (5.0%) | 17 (8.6%) |
| $40,000 to $44,999 | 29 (10.4%) | 14 (7.1%) |
| $45,000 to $49,999 | 70 (25.2%) | 19 (9.6%) |
| $50,000 to $54,999 | 29 (10.4%) | 0 (0.0%) |
| $55,000 to $64,999 | 36 (13.0%) | 0 (0.0%) |
| $65,000 to $74,999 | 0 (0.0%) | 0 (0.0%) |
| $75,000 to $99,999 | 28 (10.1%) | 0 (0.0%) |
| $100,000+ | 24 (8.6%) | 0 (0.0%) |
| Total | 278 (100.0%) | 198 (100.0%) |
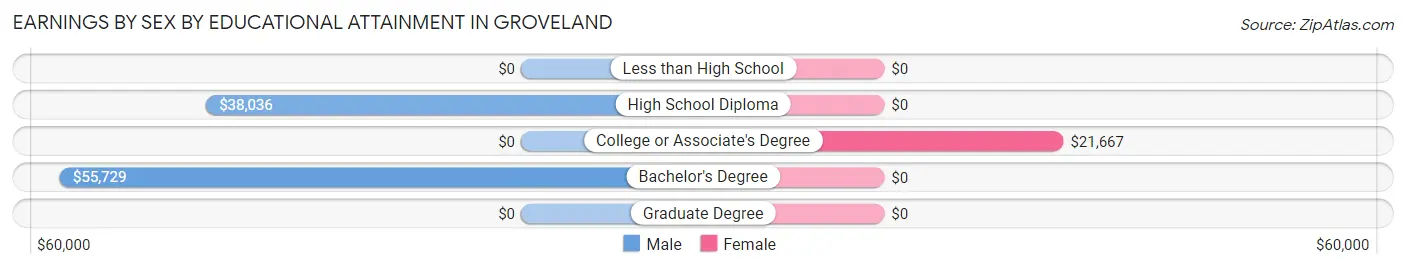
Earnings by Sex by Educational Attainment in Groveland
Average earnings in Groveland are $46,914 for men and $21,198 for women, a difference of 54.8%. Men with an educational attainment of bachelor's degree enjoy the highest average annual earnings of $55,729, while those with high school diploma education earn the least with $38,036. Women with an educational attainment of college or associate's degree earn the most with the average annual earnings of $21,667, while those with college or associate's degree education have the smallest earnings of $21,667.
| Educational Attainment | Male Income | Female Income |
| Less than High School | - | - |
| High School Diploma | $38,036 | $0 |
| College or Associate's Degree | - | - |
| Bachelor's Degree | $55,729 | $0 |
| Graduate Degree | - | - |
| Total | $46,914 | $21,198 |
Family Income in Groveland
Family Income Brackets in Groveland
According to the Groveland family income data, there are 136 families falling into the $35,000 to $49,999 income range, which is the most common income bracket and makes up 36.2% of all families.
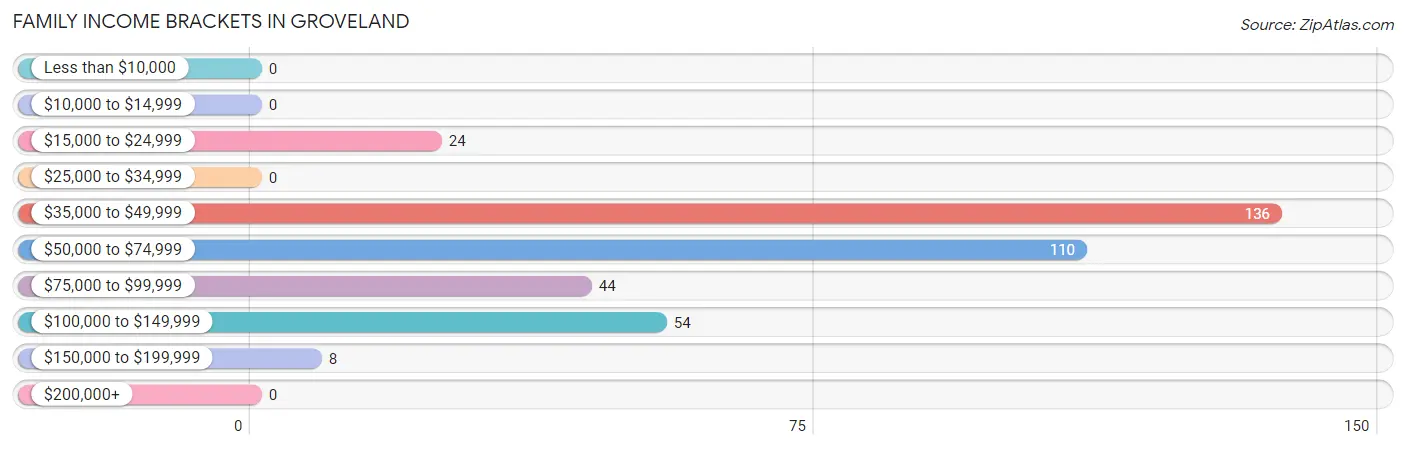
| Income Bracket | # Families | % Families |
| Less than $10,000 | 0 | 0.0% |
| $10,000 to $14,999 | 0 | 0.0% |
| $15,000 to $24,999 | 24 | 6.4% |
| $25,000 to $34,999 | 0 | 0.0% |
| $35,000 to $49,999 | 136 | 36.2% |
| $50,000 to $74,999 | 110 | 29.3% |
| $75,000 to $99,999 | 44 | 11.7% |
| $100,000 to $149,999 | 54 | 14.4% |
| $150,000 to $199,999 | 8 | 2.1% |
| $200,000+ | 0 | 0.0% |
Family Income by Famaliy Size in Groveland
2-person families (165 | 43.9%) account for the highest median family income in Groveland with $71,563 per family, while 2-person families (165 | 43.9%) have the highest median income of $35,782 per family member.
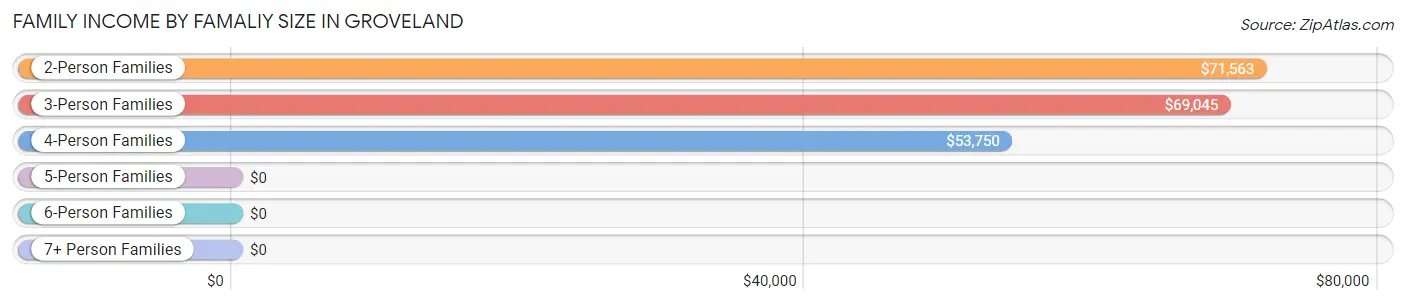
| Income Bracket | # Families | Median Income |
| 2-Person Families | 165 (43.9%) | $71,563 |
| 3-Person Families | 68 (18.1%) | $69,045 |
| 4-Person Families | 40 (10.6%) | $53,750 |
| 5-Person Families | 93 (24.7%) | $0 |
| 6-Person Families | 10 (2.7%) | $0 |
| 7+ Person Families | 0 (0.0%) | $0 |
| Total | 376 (100.0%) | $66,364 |
Family Income by Number of Earners in Groveland
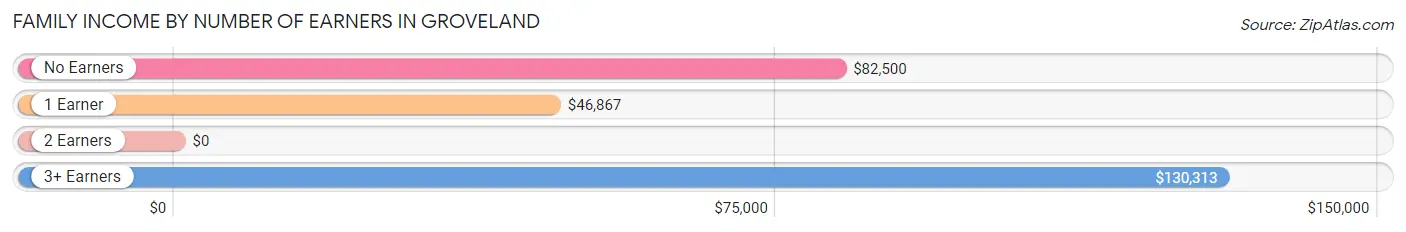
| Number of Earners | # Families | Median Income |
| No Earners | 40 (10.6%) | $82,500 |
| 1 Earner | 197 (52.4%) | $46,867 |
| 2 Earners | 104 (27.7%) | $0 |
| 3+ Earners | 35 (9.3%) | $130,313 |
| Total | 376 (100.0%) | $66,364 |
Household Income in Groveland
Household Income Brackets in Groveland
With 136 households falling in the category, the $35,000 to $49,999 income range is the most frequent in Groveland, accounting for 33.6% of all households.
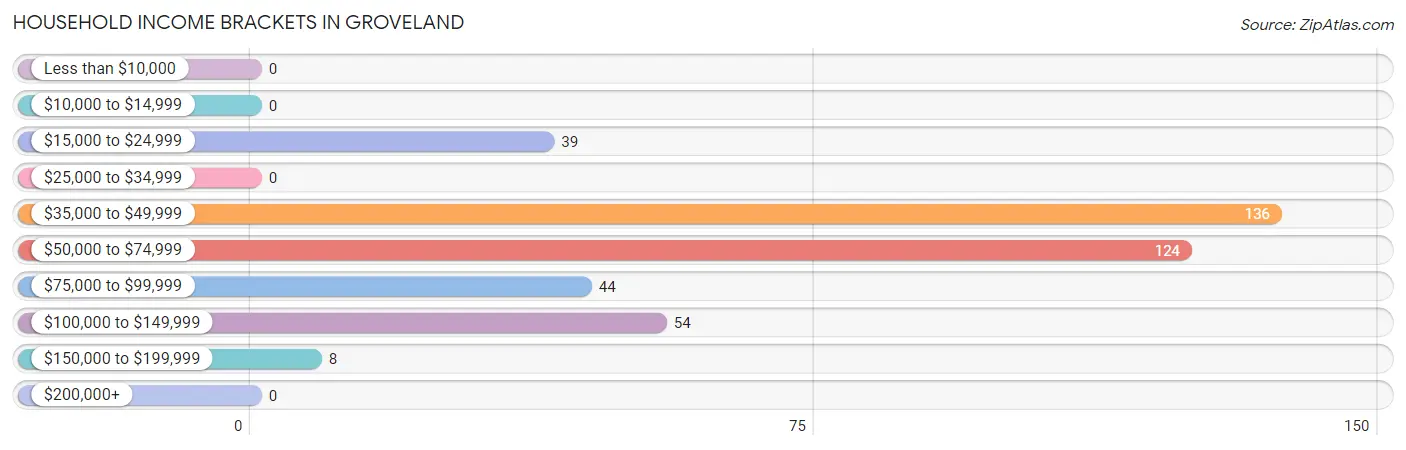
| Income Bracket | # Households | % Households |
| Less than $10,000 | 0 | 0.0% |
| $10,000 to $14,999 | 0 | 0.0% |
| $15,000 to $24,999 | 39 | 9.6% |
| $25,000 to $34,999 | 0 | 0.0% |
| $35,000 to $49,999 | 136 | 33.6% |
| $50,000 to $74,999 | 124 | 30.6% |
| $75,000 to $99,999 | 44 | 10.9% |
| $100,000 to $149,999 | 54 | 13.3% |
| $150,000 to $199,999 | 8 | 2.0% |
| $200,000+ | 0 | 0.0% |
Household Income by Householder Age in Groveland
The median household income in Groveland is $54,115, with the highest median household income of $91,042 found in the 45 to 64 years age bracket for the primary householder. A total of 78 households (19.3%) fall into this category. Meanwhile, the 15 to 24 years age bracket for the primary householder has the lowest median household income of $0, with 30 households (7.4%) in this group.
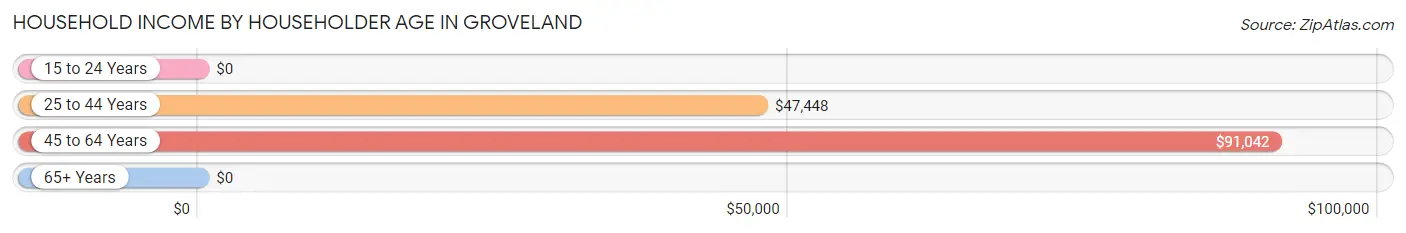
| Income Bracket | # Households | Median Income |
| 15 to 24 Years | 30 (7.4%) | $0 |
| 25 to 44 Years | 242 (59.8%) | $47,448 |
| 45 to 64 Years | 78 (19.3%) | $91,042 |
| 65+ Years | 55 (13.6%) | $0 |
| Total | 405 (100.0%) | $54,115 |
Poverty in Groveland
Income Below Poverty by Sex and Age in Groveland
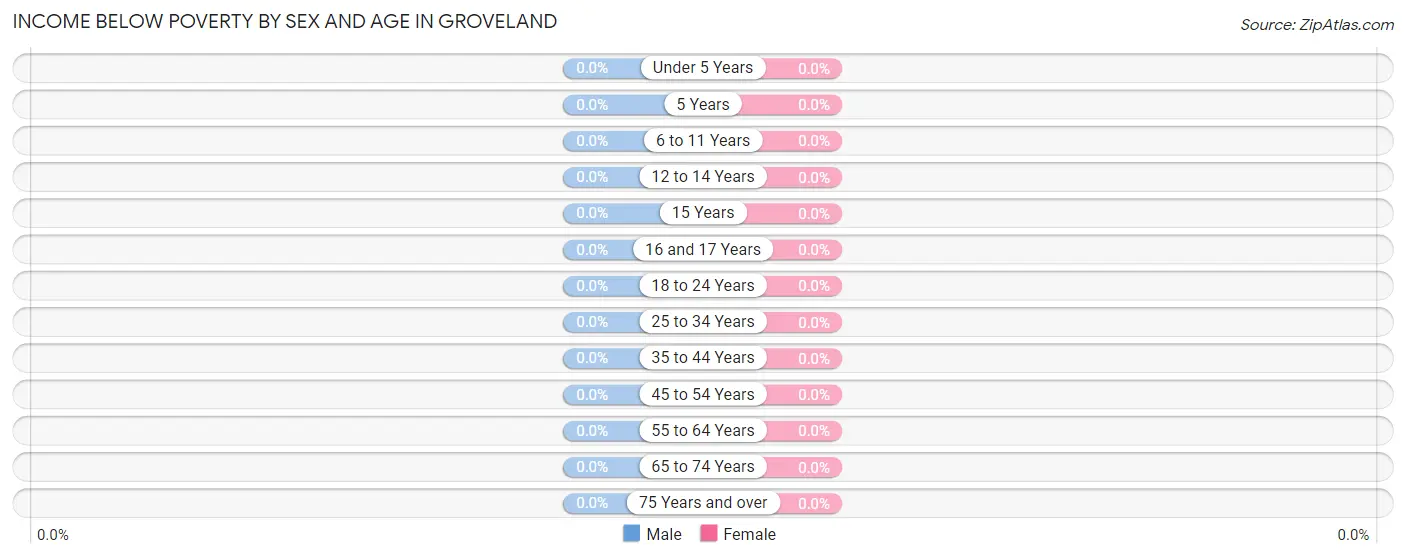
| Age Bracket | Male | Female |
| Under 5 Years | 0 (0.0%) | 0 (0.0%) |
| 5 Years | 0 (0.0%) | 0 (0.0%) |
| 6 to 11 Years | 0 (0.0%) | 0 (0.0%) |
| 12 to 14 Years | 0 (0.0%) | 0 (0.0%) |
| 15 Years | 0 (0.0%) | 0 (0.0%) |
| 16 and 17 Years | 0 (0.0%) | 0 (0.0%) |
| 18 to 24 Years | 0 (0.0%) | 0 (0.0%) |
| 25 to 34 Years | 0 (0.0%) | 0 (0.0%) |
| 35 to 44 Years | 0 (0.0%) | 0 (0.0%) |
| 45 to 54 Years | 0 (0.0%) | 0 (0.0%) |
| 55 to 64 Years | 0 (0.0%) | 0 (0.0%) |
| 65 to 74 Years | 0 (0.0%) | 0 (0.0%) |
| 75 Years and over | 0 (0.0%) | 0 (0.0%) |
| Total | 0 (0.0%) | 0 (0.0%) |
Income Above Poverty by Sex and Age in Groveland
According to the poverty statistics in Groveland, males aged under 5 years and females aged under 5 years are the age groups that are most secure financially, with 100.0% of males and 100.0% of females in these age groups living above the poverty line.
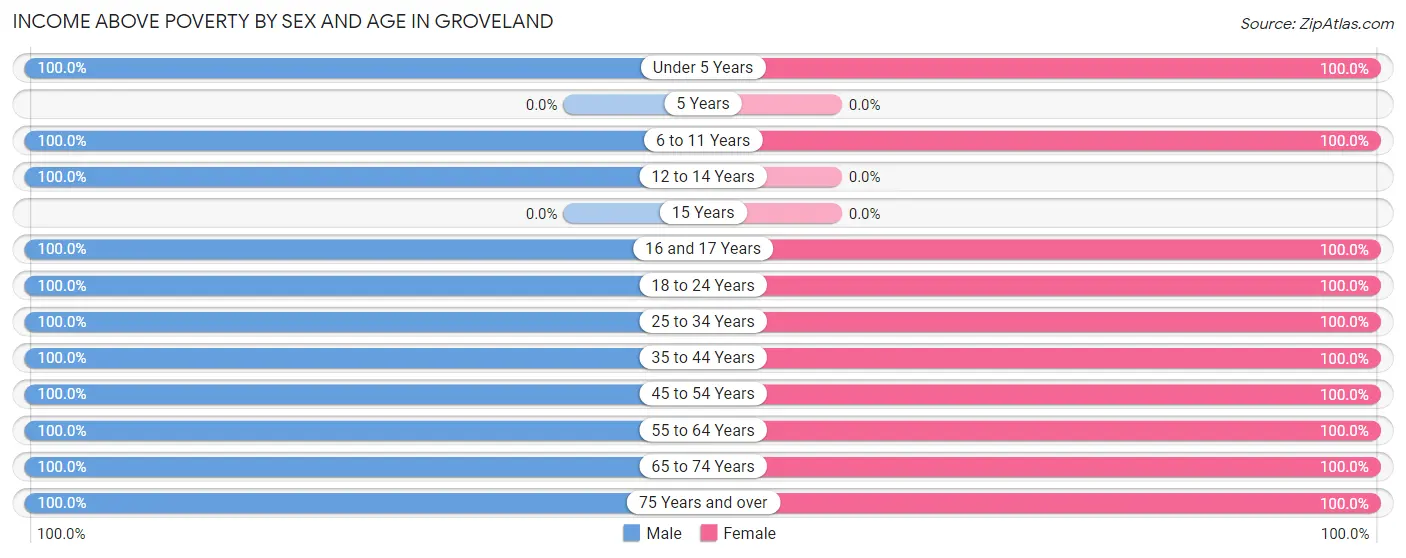
| Age Bracket | Male | Female |
| Under 5 Years | 26 (100.0%) | 42 (100.0%) |
| 5 Years | 0 (0.0%) | 0 (0.0%) |
| 6 to 11 Years | 91 (100.0%) | 244 (100.0%) |
| 12 to 14 Years | 24 (100.0%) | 0 (0.0%) |
| 15 Years | 0 (0.0%) | 0 (0.0%) |
| 16 and 17 Years | 13 (100.0%) | 11 (100.0%) |
| 18 to 24 Years | 30 (100.0%) | 28 (100.0%) |
| 25 to 34 Years | 113 (100.0%) | 171 (100.0%) |
| 35 to 44 Years | 73 (100.0%) | 74 (100.0%) |
| 45 to 54 Years | 30 (100.0%) | 9 (100.0%) |
| 55 to 64 Years | 44 (100.0%) | 51 (100.0%) |
| 65 to 74 Years | 44 (100.0%) | 46 (100.0%) |
| 75 Years and over | 19 (100.0%) | 7 (100.0%) |
| Total | 507 (100.0%) | 683 (100.0%) |
Income Below Poverty Among Married-Couple Families in Groveland
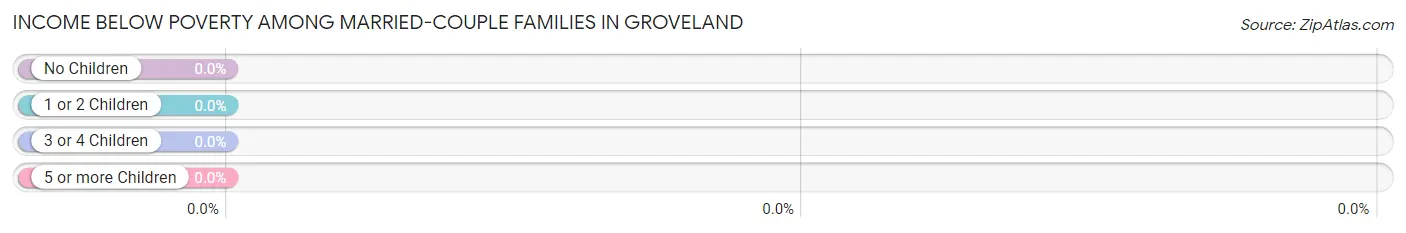
| Children | Above Poverty | Below Poverty |
| No Children | 114 (100.0%) | 0 (0.0%) |
| 1 or 2 Children | 98 (100.0%) | 0 (0.0%) |
| 3 or 4 Children | 103 (100.0%) | 0 (0.0%) |
| 5 or more Children | 0 (0.0%) | 0 (0.0%) |
| Total | 315 (100.0%) | 0 (0.0%) |
Income Below Poverty Among Single-Parent Households in Groveland
| Children | Single Father | Single Mother |
| No Children | 0 (0.0%) | 0 (0.0%) |
| 1 or 2 Children | 0 (0.0%) | 0 (0.0%) |
| 3 or 4 Children | 0 (0.0%) | 0 (0.0%) |
| 5 or more Children | 0 (0.0%) | 0 (0.0%) |
| Total | 0 (0.0%) | 0 (0.0%) |
Income Below Poverty Among Married-Couple vs Single-Parent Households in Groveland
| Children | Married-Couple Families | Single-Parent Households |
| No Children | 0 (0.0%) | 0 (0.0%) |
| 1 or 2 Children | 0 (0.0%) | 0 (0.0%) |
| 3 or 4 Children | 0 (0.0%) | 0 (0.0%) |
| 5 or more Children | 0 (0.0%) | 0 (0.0%) |
| Total | 0 (0.0%) | 0 (0.0%) |
Race in Groveland
The most populous races in Groveland are White / Caucasian (1,128 | 94.8%), Two or more Races (49 | 4.1%), and Hispanic or Latino (19 | 1.6%).
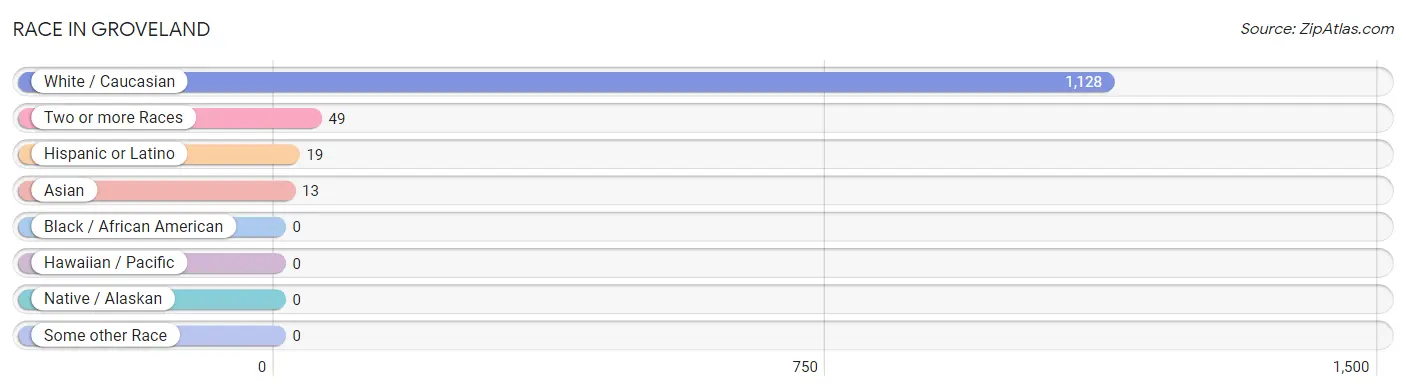
| Race | # Population | % Population |
| Asian | 13 | 1.1% |
| Black / African American | 0 | 0.0% |
| Hawaiian / Pacific | 0 | 0.0% |
| Hispanic or Latino | 19 | 1.6% |
| Native / Alaskan | 0 | 0.0% |
| White / Caucasian | 1,128 | 94.8% |
| Two or more Races | 49 | 4.1% |
| Some other Race | 0 | 0.0% |
| Total | 1,190 | 100.0% |
Ancestry in Groveland
The most populous ancestries reported in Groveland are American (391 | 32.9%), English (200 | 16.8%), European (180 | 15.1%), German (155 | 13.0%), and Danish (102 | 8.6%), together accounting for 86.4% of all Groveland residents.
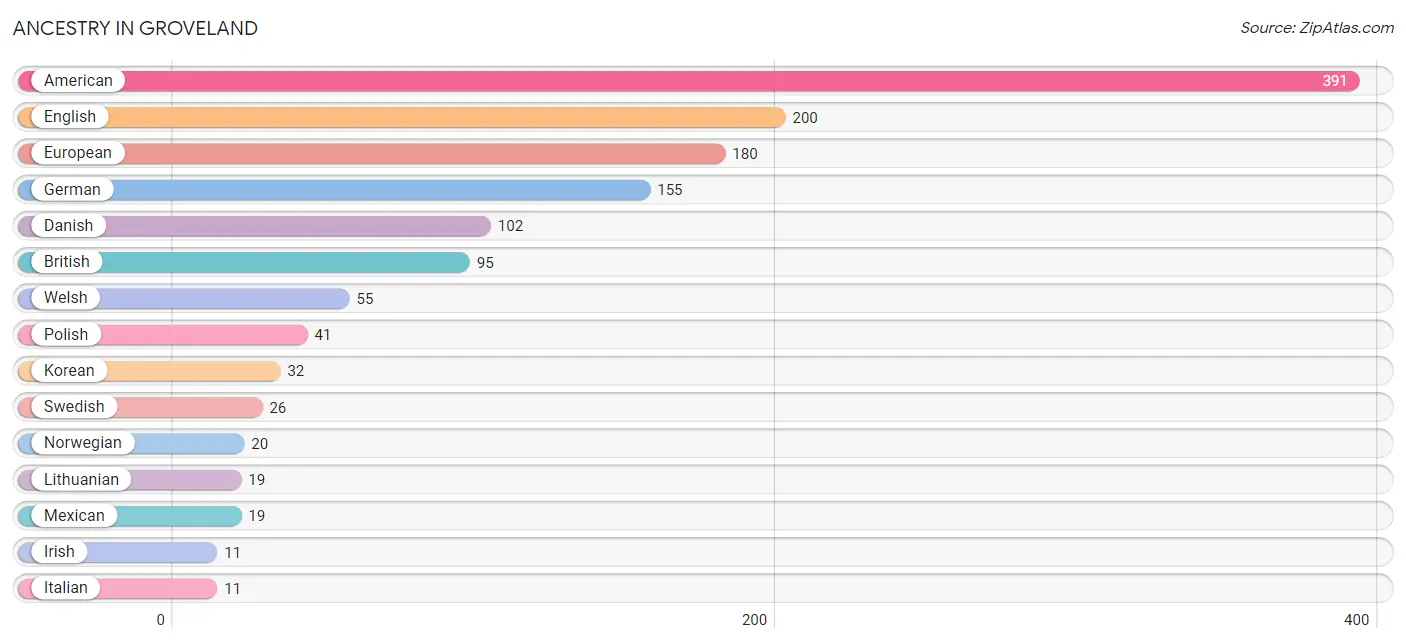
| Ancestry | # Population | % Population |
| American | 391 | 32.9% |
| British | 95 | 8.0% |
| Danish | 102 | 8.6% |
| Dutch | 8 | 0.7% |
| English | 200 | 16.8% |
| European | 180 | 15.1% |
| German | 155 | 13.0% |
| Irish | 11 | 0.9% |
| Italian | 11 | 0.9% |
| Korean | 32 | 2.7% |
| Lithuanian | 19 | 1.6% |
| Mexican | 19 | 1.6% |
| Norwegian | 20 | 1.7% |
| Polish | 41 | 3.5% |
| Swedish | 26 | 2.2% |
| Welsh | 55 | 4.6% | View All 16 Rows |
Immigrants in Groveland

| Immigration Origin | # Population | % Population | View All 0 Rows |
Sex and Age in Groveland
Sex and Age in Groveland
The most populous age groups in Groveland are 30 to 34 Years (77 | 15.2%) for men and 5 to 9 Years (175 | 25.6%) for women.
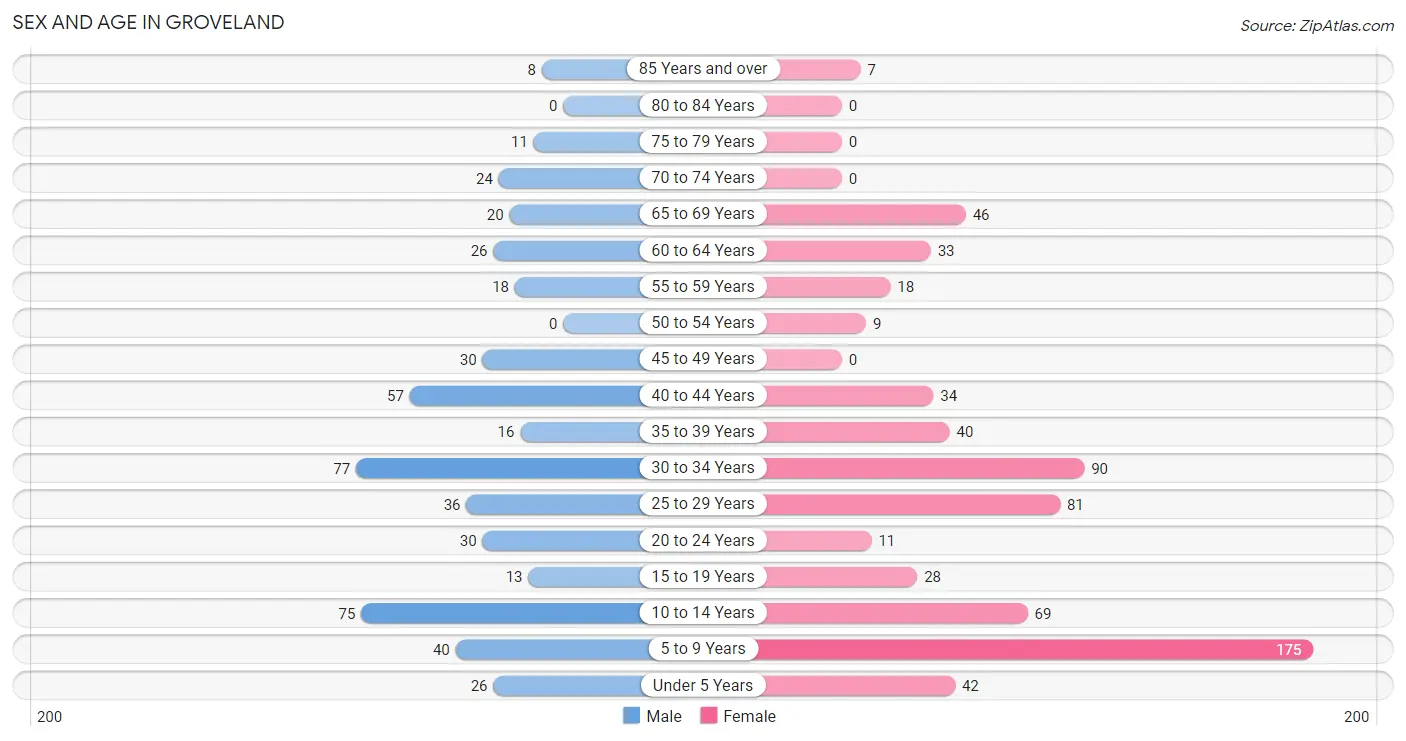
| Age Bracket | Male | Female |
| Under 5 Years | 26 (5.1%) | 42 (6.1%) |
| 5 to 9 Years | 40 (7.9%) | 175 (25.6%) |
| 10 to 14 Years | 75 (14.8%) | 69 (10.1%) |
| 15 to 19 Years | 13 (2.6%) | 28 (4.1%) |
| 20 to 24 Years | 30 (5.9%) | 11 (1.6%) |
| 25 to 29 Years | 36 (7.1%) | 81 (11.9%) |
| 30 to 34 Years | 77 (15.2%) | 90 (13.2%) |
| 35 to 39 Years | 16 (3.2%) | 40 (5.9%) |
| 40 to 44 Years | 57 (11.2%) | 34 (5.0%) |
| 45 to 49 Years | 30 (5.9%) | 0 (0.0%) |
| 50 to 54 Years | 0 (0.0%) | 9 (1.3%) |
| 55 to 59 Years | 18 (3.5%) | 18 (2.6%) |
| 60 to 64 Years | 26 (5.1%) | 33 (4.8%) |
| 65 to 69 Years | 20 (3.9%) | 46 (6.7%) |
| 70 to 74 Years | 24 (4.7%) | 0 (0.0%) |
| 75 to 79 Years | 11 (2.2%) | 0 (0.0%) |
| 80 to 84 Years | 0 (0.0%) | 0 (0.0%) |
| 85 Years and over | 8 (1.6%) | 7 (1.0%) |
| Total | 507 (100.0%) | 683 (100.0%) |
Families and Households in Groveland
Median Family Size in Groveland
The median family size in Groveland is 3.09 persons per family, with married-couple families (315 | 83.8%) accounting for the largest median family size of 3.24 persons per family. On the other hand, single male/father families (23 | 6.1%) represent the smallest median family size with 2.22 persons per family.
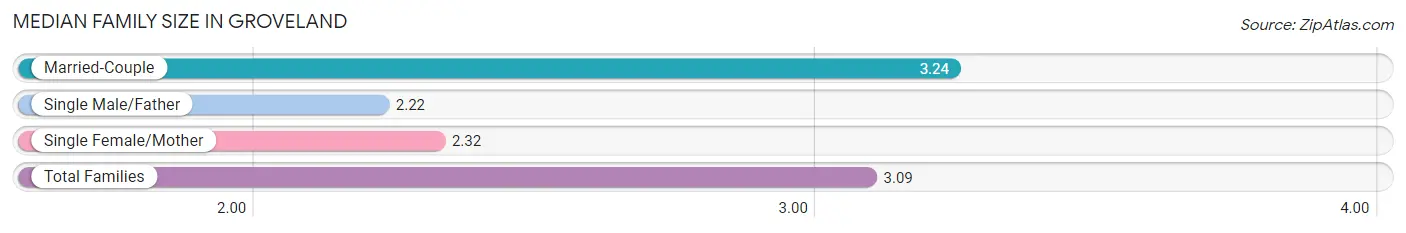
| Family Type | # Families | Family Size |
| Married-Couple | 315 (83.8%) | 3.24 |
| Single Male/Father | 23 (6.1%) | 2.22 |
| Single Female/Mother | 38 (10.1%) | 2.32 |
| Total Families | 376 (100.0%) | 3.09 |
Median Household Size in Groveland
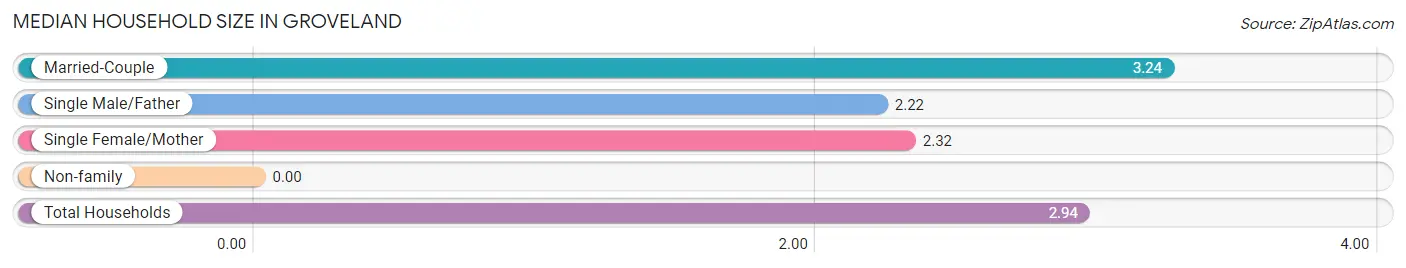
| Household Type | # Households | Household Size |
| Married-Couple | 315 (77.8%) | 3.24 |
| Single Male/Father | 23 (5.7%) | 2.22 |
| Single Female/Mother | 38 (9.4%) | 2.32 |
| Non-family | 29 (7.2%) | - |
| Total Households | 405 (100.0%) | 2.94 |
Household Size by Marriage Status in Groveland
Out of a total of 405 households in Groveland, 376 (92.8%) are family households, while 29 (7.2%) are nonfamily households. The most numerous type of family households are 2-person households, comprising 165, and the most common type of nonfamily households are 1-person households, comprising 29.
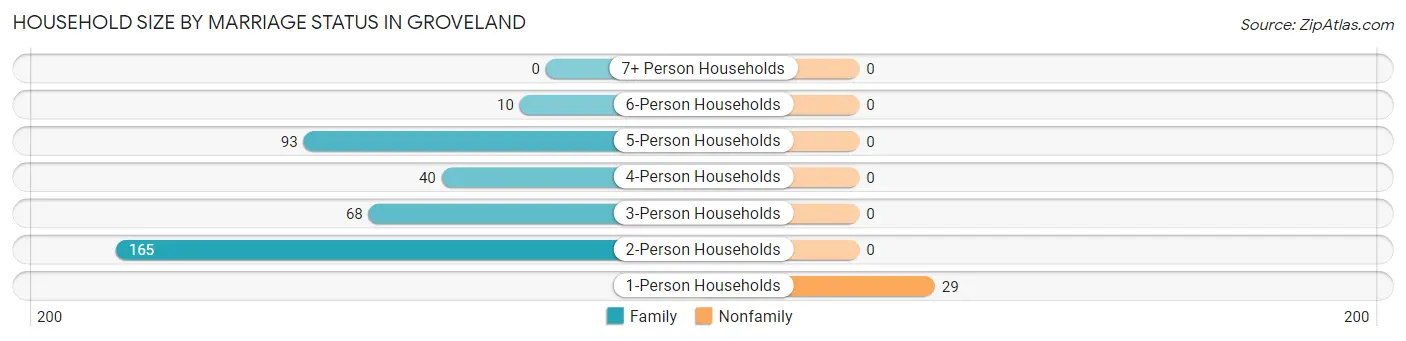
| Household Size | Family Households | Nonfamily Households |
| 1-Person Households | - | 29 (7.2%) |
| 2-Person Households | 165 (40.7%) | 0 (0.0%) |
| 3-Person Households | 68 (16.8%) | 0 (0.0%) |
| 4-Person Households | 40 (9.9%) | 0 (0.0%) |
| 5-Person Households | 93 (23.0%) | 0 (0.0%) |
| 6-Person Households | 10 (2.5%) | 0 (0.0%) |
| 7+ Person Households | 0 (0.0%) | 0 (0.0%) |
| Total | 376 (92.8%) | 29 (7.2%) |
Female Fertility in Groveland
Fertility by Age in Groveland
Average fertility rate in Groveland is 194.0 births per 1,000 women. Women in the age bracket of 20 to 34 years have the highest fertility rate with 302.0 births per 1,000 women. Women in the age bracket of 20 to 34 years acount for 100.0% of all women with births.
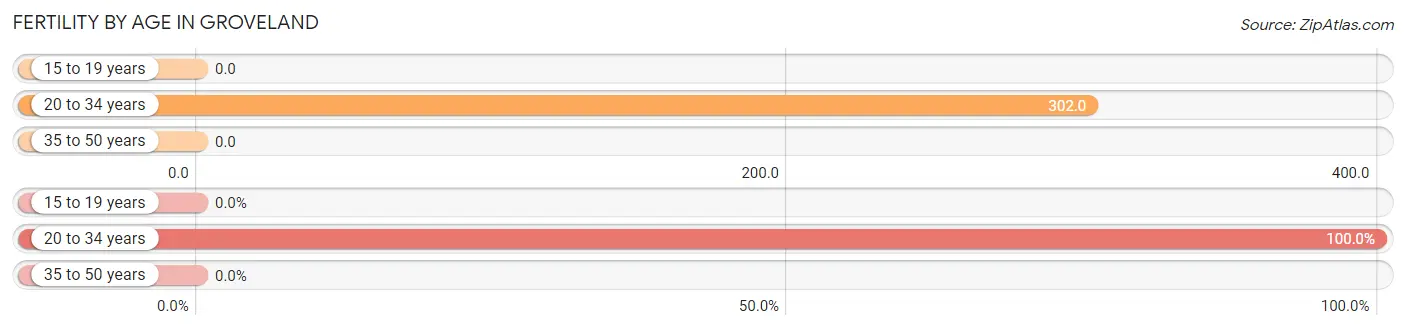
| Age Bracket | Women with Births | Births / 1,000 Women |
| 15 to 19 years | 0 (0.0%) | 0.0 |
| 20 to 34 years | 55 (100.0%) | 302.0 |
| 35 to 50 years | 0 (0.0%) | 0.0 |
| Total | 55 (100.0%) | 194.0 |
Fertility by Age by Marriage Status in Groveland
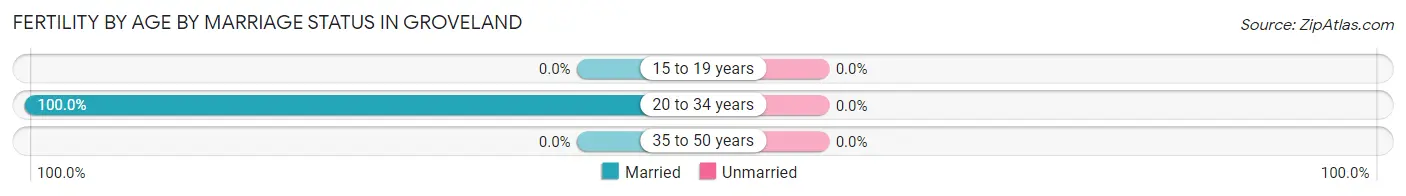
| Age Bracket | Married | Unmarried |
| 15 to 19 years | 0 (0.0%) | 0 (0.0%) |
| 20 to 34 years | 55 (100.0%) | 0 (0.0%) |
| 35 to 50 years | 0 (0.0%) | 0 (0.0%) |
| Total | 55 (100.0%) | 0 (0.0%) |
Fertility by Education in Groveland
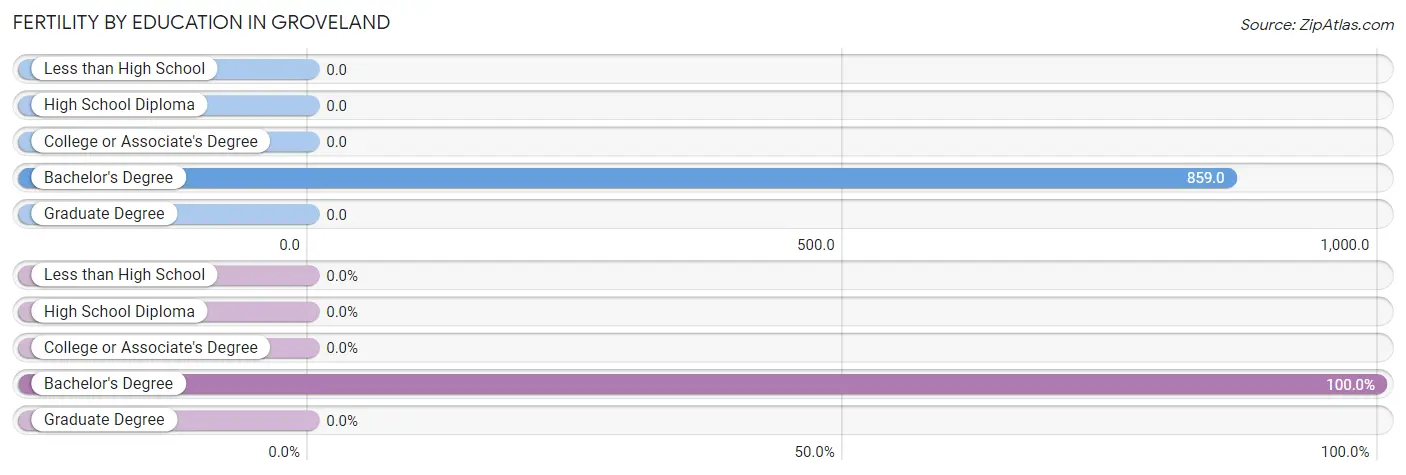
| Educational Attainment | Women with Births | Births / 1,000 Women |
| Less than High School | 0 (0.0%) | 0.0 |
| High School Diploma | 0 (0.0%) | 0.0 |
| College or Associate's Degree | 0 (0.0%) | 0.0 |
| Bachelor's Degree | 55 (100.0%) | 859.0 |
| Graduate Degree | 0 (0.0%) | 0.0 |
| Total | 55 (100.0%) | 194.0 |
Fertility by Education by Marriage Status in Groveland
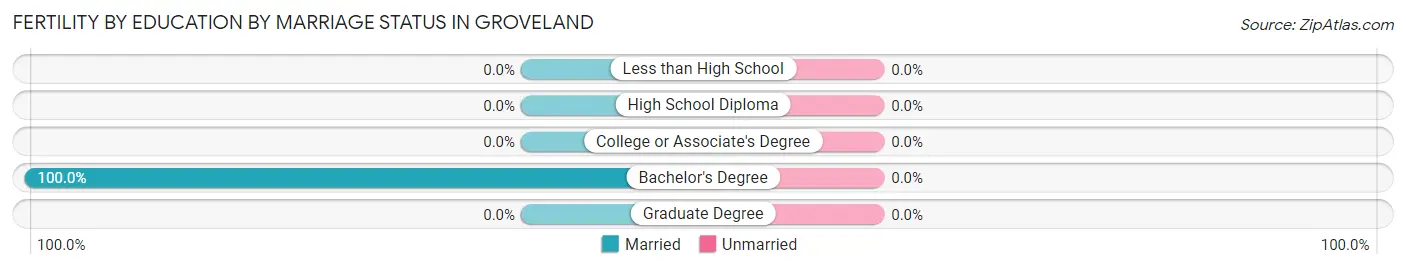
| Educational Attainment | Married | Unmarried |
| Less than High School | 0 (0.0%) | 0 (0.0%) |
| High School Diploma | 0 (0.0%) | 0 (0.0%) |
| College or Associate's Degree | 0 (0.0%) | 0 (0.0%) |
| Bachelor's Degree | 55 (100.0%) | 0 (0.0%) |
| Graduate Degree | 0 (0.0%) | 0 (0.0%) |
| Total | 55 (100.0%) | 0 (0.0%) |
Employment Characteristics in Groveland
Employment by Class of Employer in Groveland
Among the 434 employed individuals in Groveland, private company employees (305 | 70.3%), local government employees (51 | 11.7%), and federal government employees (40 | 9.2%) make up the most common classes of employment.
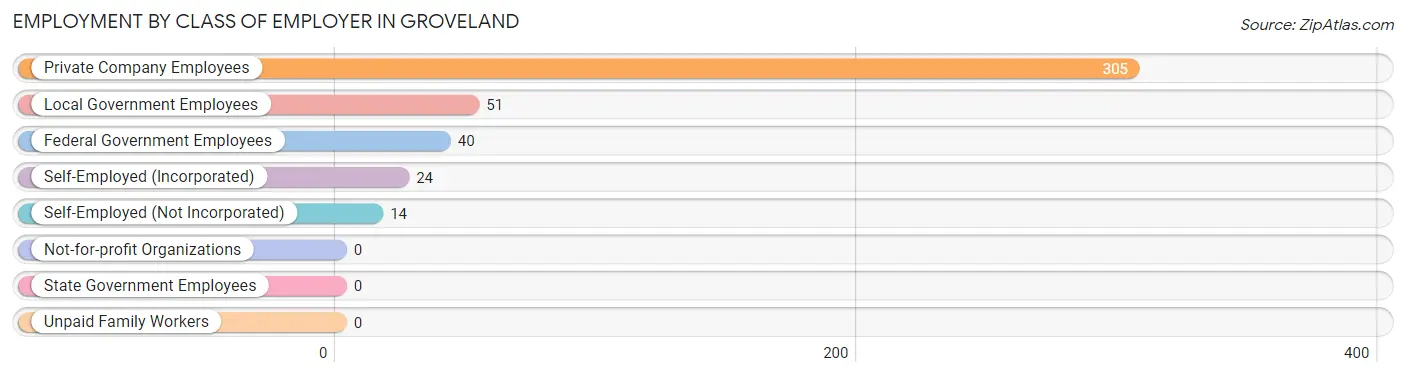
| Employer Class | # Employees | % Employees |
| Private Company Employees | 305 | 70.3% |
| Self-Employed (Incorporated) | 24 | 5.5% |
| Self-Employed (Not Incorporated) | 14 | 3.2% |
| Not-for-profit Organizations | 0 | 0.0% |
| Local Government Employees | 51 | 11.7% |
| State Government Employees | 0 | 0.0% |
| Federal Government Employees | 40 | 9.2% |
| Unpaid Family Workers | 0 | 0.0% |
| Total | 434 | 100.0% |
Employment Status by Age in Groveland
According to the labor force statistics for Groveland, out of the total population over 16 years of age (763), 59.2% or 452 individuals are in the labor force, with 4.0% or 18 of them unemployed. The age group with the highest labor force participation rate is 35 to 44 years, with 100.0% or 147 individuals in the labor force. Within the labor force, the 16 to 19 years age range has the highest percentage of unemployed individuals, with 28.6% or 8 of them being unemployed.
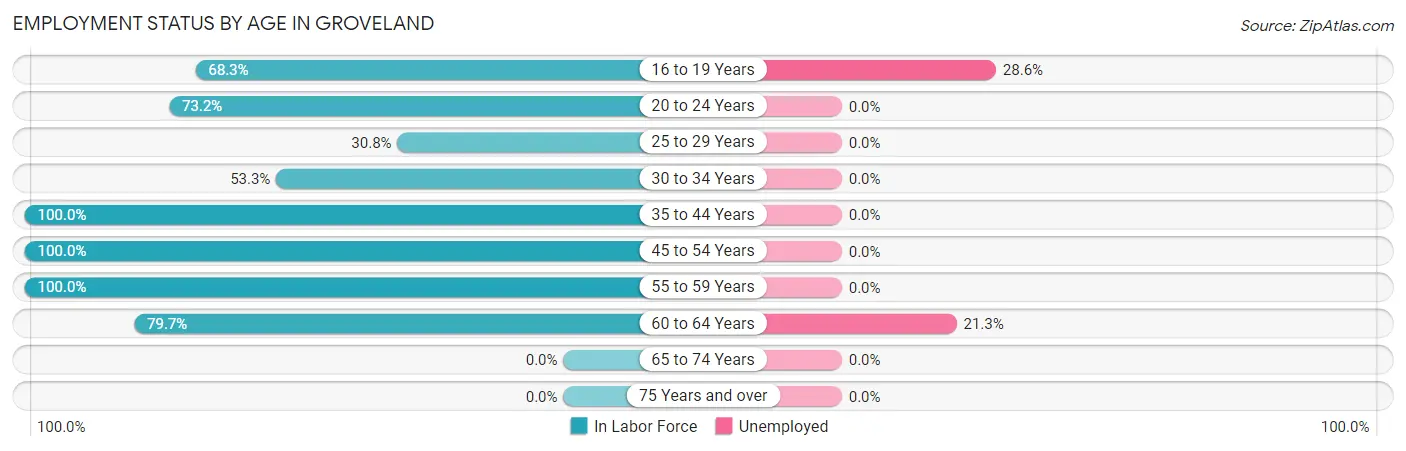
| Age Bracket | In Labor Force | Unemployed |
| 16 to 19 Years | 28 (68.3%) | 8 (28.6%) |
| 20 to 24 Years | 30 (73.2%) | 0 (0.0%) |
| 25 to 29 Years | 36 (30.8%) | 0 (0.0%) |
| 30 to 34 Years | 89 (53.3%) | 0 (0.0%) |
| 35 to 44 Years | 147 (100.0%) | 0 (0.0%) |
| 45 to 54 Years | 39 (100.0%) | 0 (0.0%) |
| 55 to 59 Years | 36 (100.0%) | 0 (0.0%) |
| 60 to 64 Years | 47 (79.7%) | 10 (21.3%) |
| 65 to 74 Years | 0 (0.0%) | 0 (0.0%) |
| 75 Years and over | 0 (0.0%) | 0 (0.0%) |
| Total | 452 (59.2%) | 18 (4.0%) |
Employment Status by Educational Attainment in Groveland
According to labor force statistics for Groveland, 69.7% of individuals (394) out of the total population between 25 and 64 years of age (565) are in the labor force, with 2.5% or 10 of them being unemployed. The group with the highest labor force participation rate are those with the educational attainment of high school diploma, with 81.3% or 100 individuals in the labor force. Within the labor force, individuals with bachelor's degree or higher education have the highest percentage of unemployment, with 8.8% or 10 of them being unemployed.
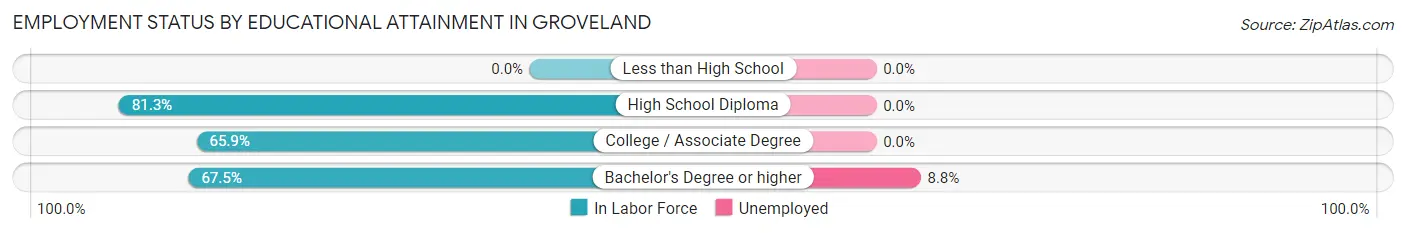
| Educational Attainment | In Labor Force | Unemployed |
| Less than High School | 0 (0.0%) | 0 (0.0%) |
| High School Diploma | 100 (81.3%) | 0 (0.0%) |
| College / Associate Degree | 180 (65.9%) | 0 (0.0%) |
| Bachelor's Degree or higher | 114 (67.5%) | 15 (8.8%) |
| Total | 394 (69.7%) | 14 (2.5%) |
Employment Occupations by Sex in Groveland
Management, Business, Science and Arts Occupations
The most common Management, Business, Science and Arts occupations in Groveland are Management (74 | 17.1%), Community & Social Service (35 | 8.1%), Education Instruction & Library (35 | 8.1%), Computers, Engineering & Science (21 | 4.8%), and Computers & Mathematics (13 | 3.0%).
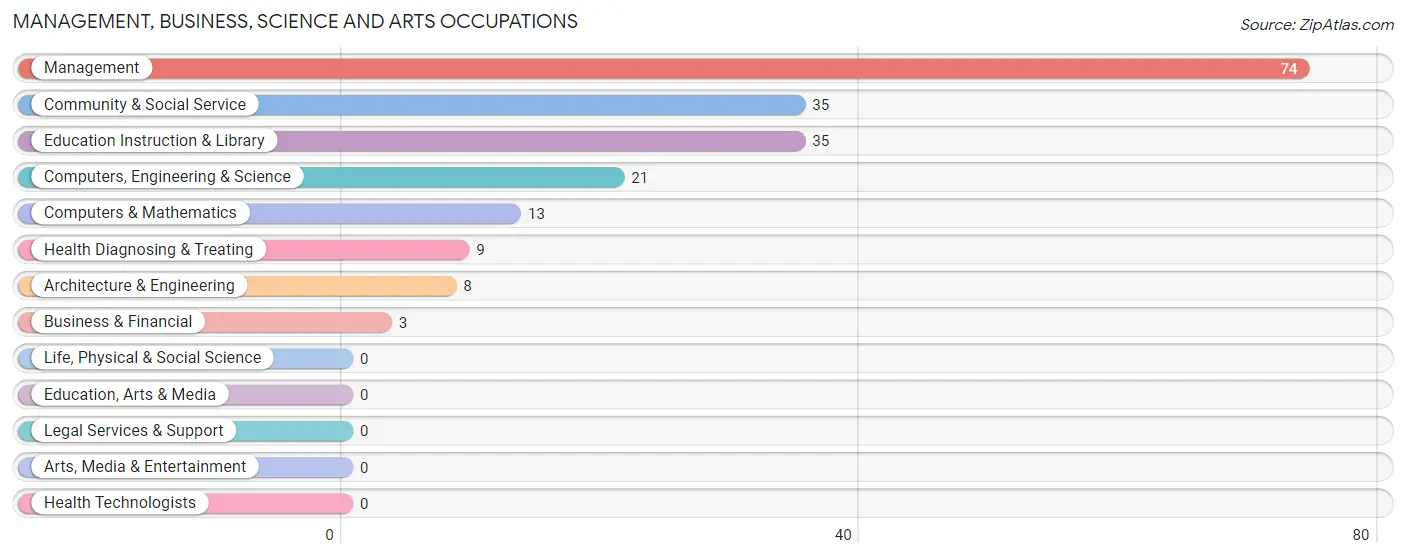
Management, Business, Science and Arts Occupations by Sex
Within the Management, Business, Science and Arts occupations in Groveland, the most male-oriented occupations are Business & Financial (100.0%), Architecture & Engineering (100.0%), and Management (77.0%), while the most female-oriented occupations are Computers & Mathematics (100.0%), Health Diagnosing & Treating (100.0%), and Computers, Engineering & Science (61.9%).
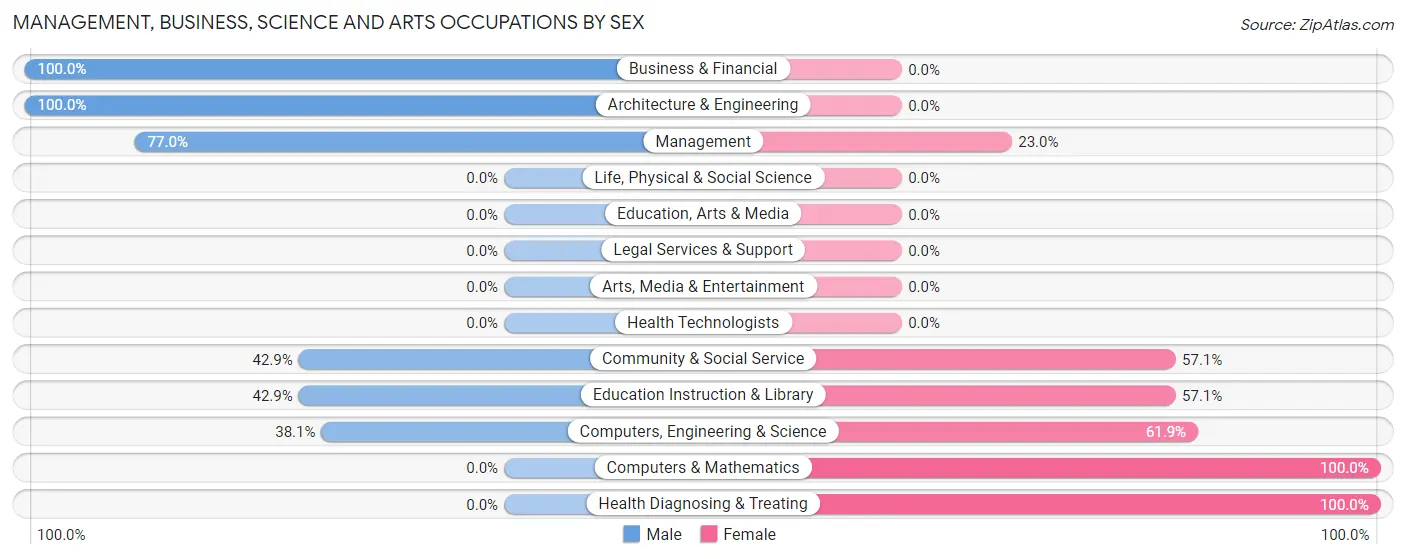
| Occupation | Male | Female |
| Management | 57 (77.0%) | 17 (23.0%) |
| Business & Financial | 3 (100.0%) | 0 (0.0%) |
| Computers, Engineering & Science | 8 (38.1%) | 13 (61.9%) |
| Computers & Mathematics | 0 (0.0%) | 13 (100.0%) |
| Architecture & Engineering | 8 (100.0%) | 0 (0.0%) |
| Life, Physical & Social Science | 0 (0.0%) | 0 (0.0%) |
| Community & Social Service | 15 (42.9%) | 20 (57.1%) |
| Education, Arts & Media | 0 (0.0%) | 0 (0.0%) |
| Legal Services & Support | 0 (0.0%) | 0 (0.0%) |
| Education Instruction & Library | 15 (42.9%) | 20 (57.1%) |
| Arts, Media & Entertainment | 0 (0.0%) | 0 (0.0%) |
| Health Diagnosing & Treating | 0 (0.0%) | 9 (100.0%) |
| Health Technologists | 0 (0.0%) | 0 (0.0%) |
| Total (Category) | 83 (58.5%) | 59 (41.5%) |
| Total (Overall) | 278 (64.1%) | 156 (35.9%) |
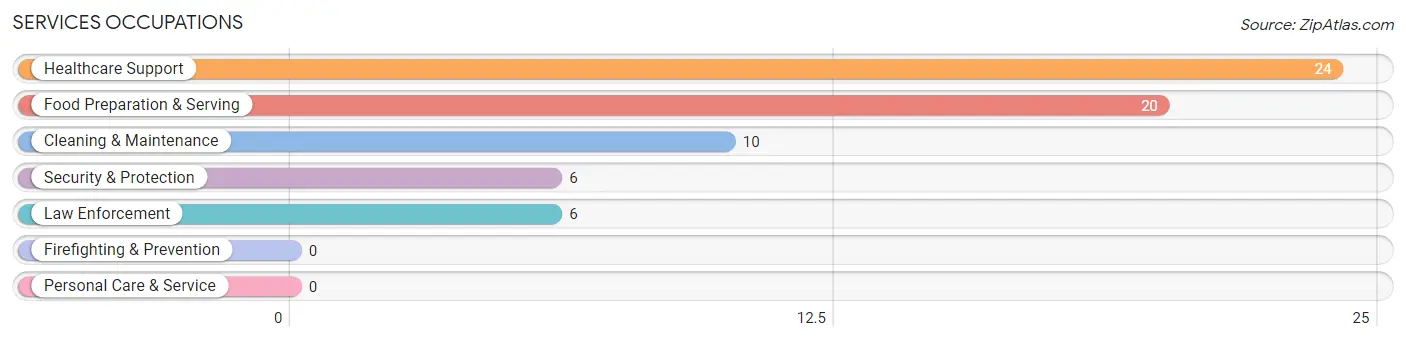
Services Occupations
The most common Services occupations in Groveland are Healthcare Support (24 | 5.5%), Food Preparation & Serving (20 | 4.6%), Cleaning & Maintenance (10 | 2.3%), Security & Protection (6 | 1.4%), and Law Enforcement (6 | 1.4%).
Services Occupations by Sex
Within the Services occupations in Groveland, the most male-oriented occupations are Security & Protection (100.0%), and Law Enforcement (100.0%), while the most female-oriented occupations are Healthcare Support (100.0%), Food Preparation & Serving (100.0%), and Cleaning & Maintenance (100.0%).
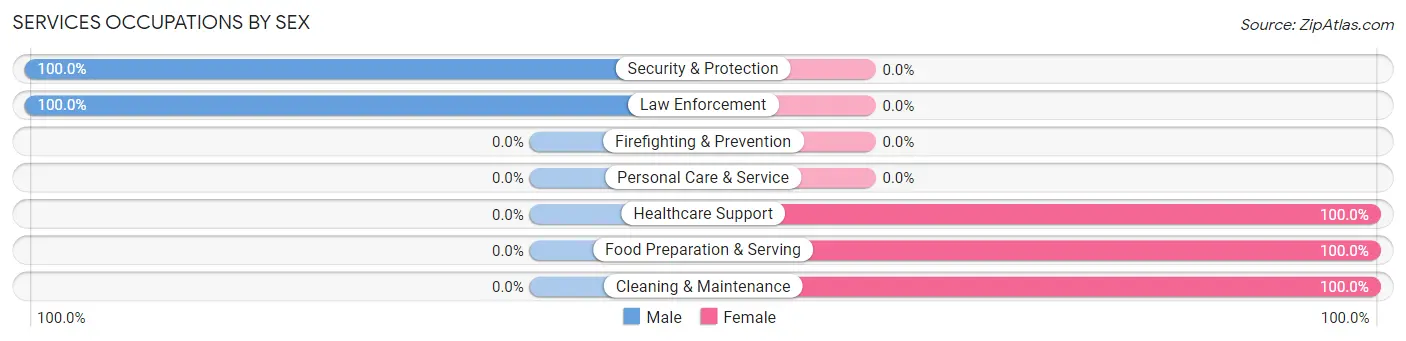
| Occupation | Male | Female |
| Healthcare Support | 0 (0.0%) | 24 (100.0%) |
| Security & Protection | 6 (100.0%) | 0 (0.0%) |
| Firefighting & Prevention | 0 (0.0%) | 0 (0.0%) |
| Law Enforcement | 6 (100.0%) | 0 (0.0%) |
| Food Preparation & Serving | 0 (0.0%) | 20 (100.0%) |
| Cleaning & Maintenance | 0 (0.0%) | 10 (100.0%) |
| Personal Care & Service | 0 (0.0%) | 0 (0.0%) |
| Total (Category) | 6 (10.0%) | 54 (90.0%) |
| Total (Overall) | 278 (64.1%) | 156 (35.9%) |
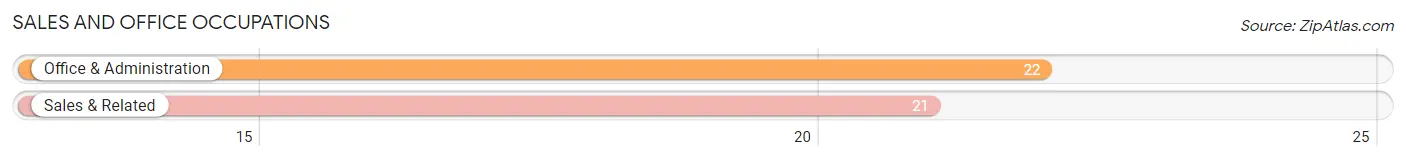
Sales and Office Occupations
The most common Sales and Office occupations in Groveland are Office & Administration (22 | 5.1%), and Sales & Related (21 | 4.8%).
Sales and Office Occupations by Sex
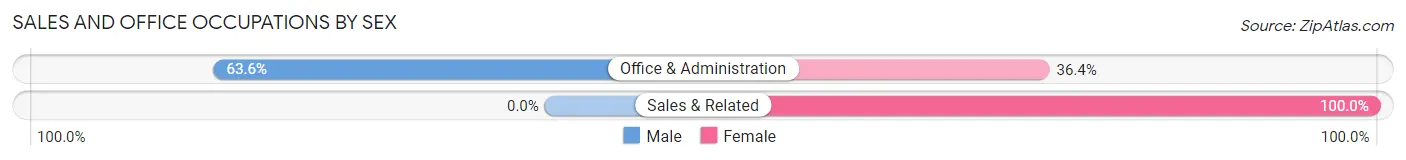
| Occupation | Male | Female |
| Sales & Related | 0 (0.0%) | 21 (100.0%) |
| Office & Administration | 14 (63.6%) | 8 (36.4%) |
| Total (Category) | 14 (32.6%) | 29 (67.4%) |
| Total (Overall) | 278 (64.1%) | 156 (35.9%) |
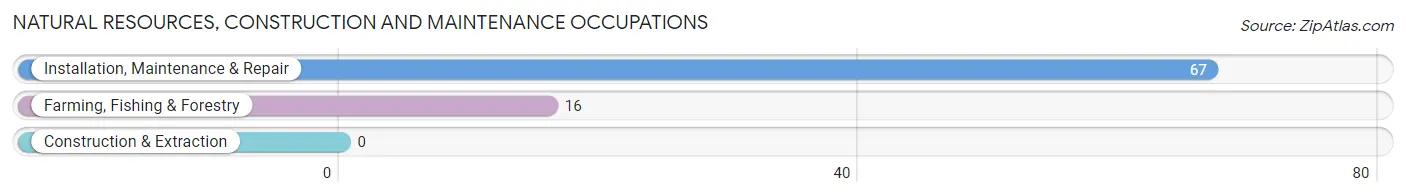
Natural Resources, Construction and Maintenance Occupations
The most common Natural Resources, Construction and Maintenance occupations in Groveland are Installation, Maintenance & Repair (67 | 15.4%), and Farming, Fishing & Forestry (16 | 3.7%).
Natural Resources, Construction and Maintenance Occupations by Sex
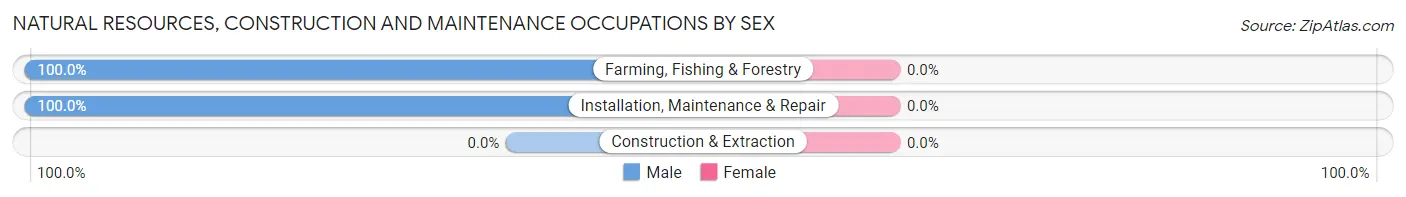
| Occupation | Male | Female |
| Farming, Fishing & Forestry | 16 (100.0%) | 0 (0.0%) |
| Construction & Extraction | 0 (0.0%) | 0 (0.0%) |
| Installation, Maintenance & Repair | 67 (100.0%) | 0 (0.0%) |
| Total (Category) | 83 (100.0%) | 0 (0.0%) |
| Total (Overall) | 278 (64.1%) | 156 (35.9%) |
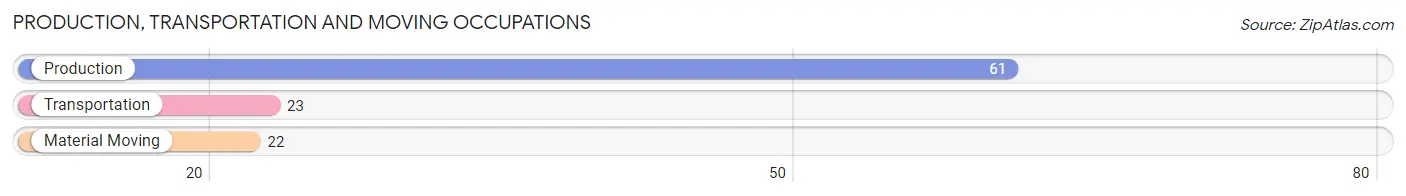
Production, Transportation and Moving Occupations
The most common Production, Transportation and Moving occupations in Groveland are Production (61 | 14.1%), Transportation (23 | 5.3%), and Material Moving (22 | 5.1%).
Production, Transportation and Moving Occupations by Sex
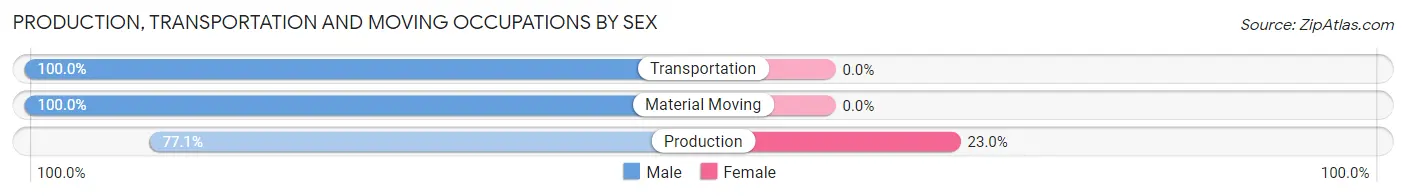
| Occupation | Male | Female |
| Production | 47 (77.0%) | 14 (23.0%) |
| Transportation | 23 (100.0%) | 0 (0.0%) |
| Material Moving | 22 (100.0%) | 0 (0.0%) |
| Total (Category) | 92 (86.8%) | 14 (13.2%) |
| Total (Overall) | 278 (64.1%) | 156 (35.9%) |
Employment Industries by Sex in Groveland
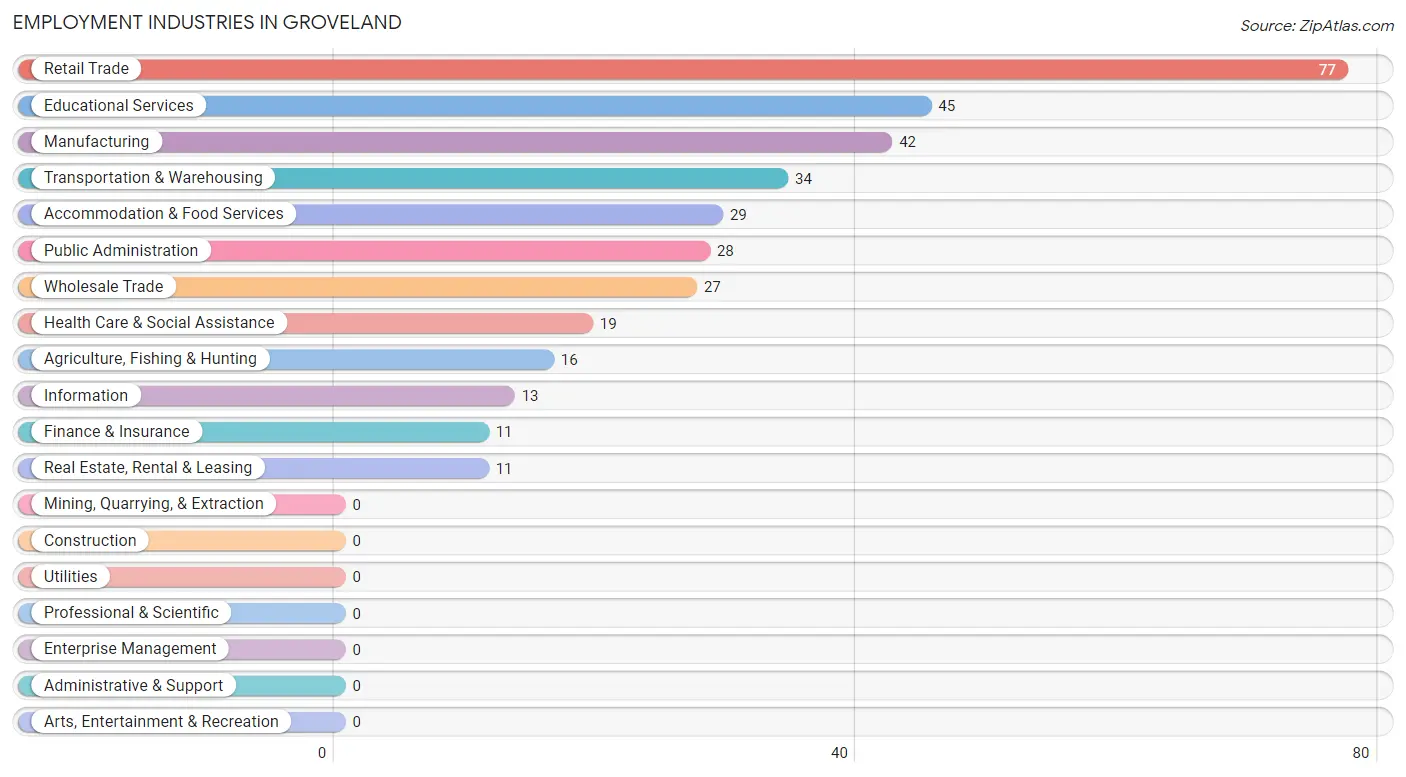
Employment Industries in Groveland
The major employment industries in Groveland include Retail Trade (77 | 17.7%), Educational Services (45 | 10.4%), Manufacturing (42 | 9.7%), Transportation & Warehousing (34 | 7.8%), and Accommodation & Food Services (29 | 6.7%).
Employment Industries by Sex in Groveland
The Groveland industries that see more men than women are Agriculture, Fishing & Hunting (100.0%), Manufacturing (100.0%), and Real Estate, Rental & Leasing (100.0%), whereas the industries that tend to have a higher number of women are Information (100.0%), Health Care & Social Assistance (100.0%), and Accommodation & Food Services (100.0%).
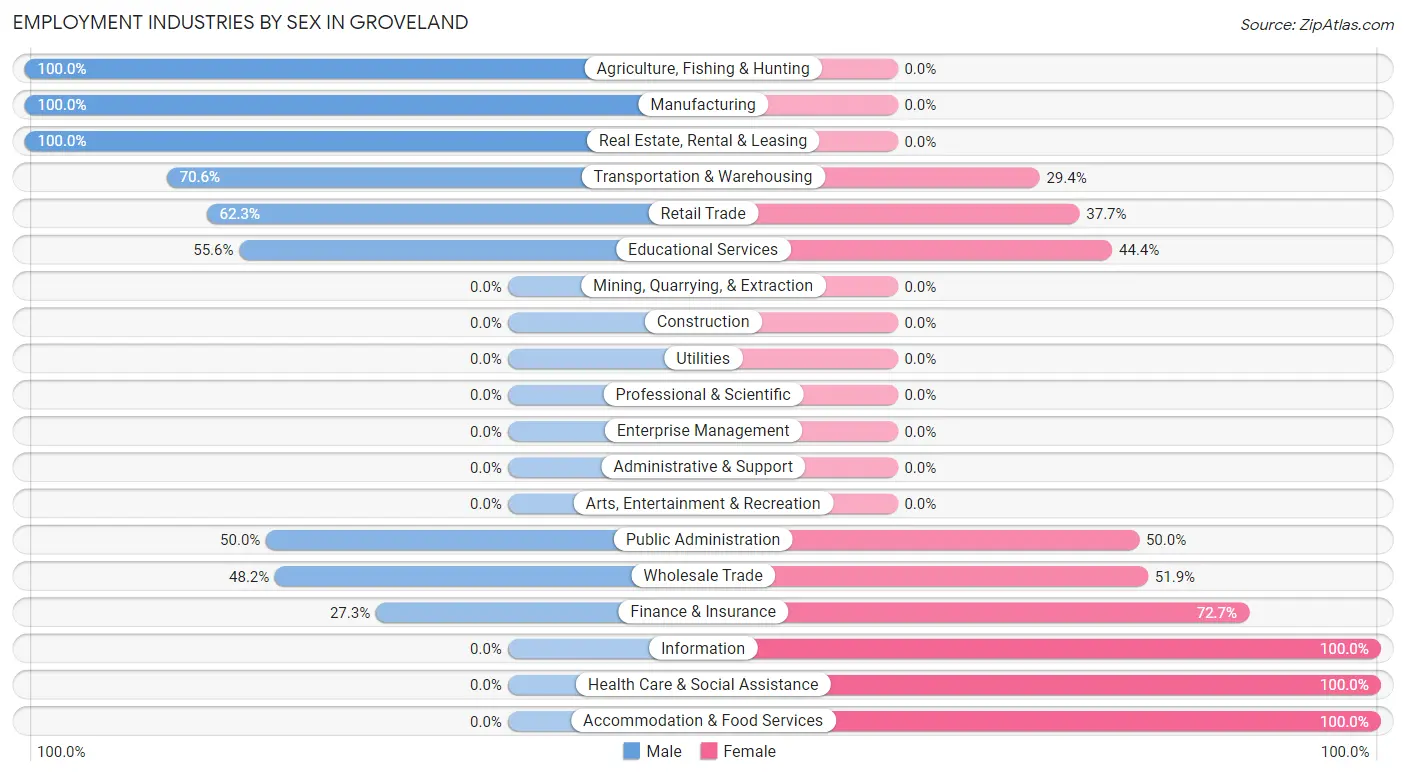
| Industry | Male | Female |
| Agriculture, Fishing & Hunting | 16 (100.0%) | 0 (0.0%) |
| Mining, Quarrying, & Extraction | 0 (0.0%) | 0 (0.0%) |
| Construction | 0 (0.0%) | 0 (0.0%) |
| Manufacturing | 42 (100.0%) | 0 (0.0%) |
| Wholesale Trade | 13 (48.1%) | 14 (51.8%) |
| Retail Trade | 48 (62.3%) | 29 (37.7%) |
| Transportation & Warehousing | 24 (70.6%) | 10 (29.4%) |
| Utilities | 0 (0.0%) | 0 (0.0%) |
| Information | 0 (0.0%) | 13 (100.0%) |
| Finance & Insurance | 3 (27.3%) | 8 (72.7%) |
| Real Estate, Rental & Leasing | 11 (100.0%) | 0 (0.0%) |
| Professional & Scientific | 0 (0.0%) | 0 (0.0%) |
| Enterprise Management | 0 (0.0%) | 0 (0.0%) |
| Administrative & Support | 0 (0.0%) | 0 (0.0%) |
| Educational Services | 25 (55.6%) | 20 (44.4%) |
| Health Care & Social Assistance | 0 (0.0%) | 19 (100.0%) |
| Arts, Entertainment & Recreation | 0 (0.0%) | 0 (0.0%) |
| Accommodation & Food Services | 0 (0.0%) | 29 (100.0%) |
| Public Administration | 14 (50.0%) | 14 (50.0%) |
| Total | 278 (64.1%) | 156 (35.9%) |
Education in Groveland
School Enrollment in Groveland
The most common levels of schooling among the 427 students in Groveland are elementary school (215 | 50.3%), middle school (144 | 33.7%), and graduate / professional (25 | 5.9%).
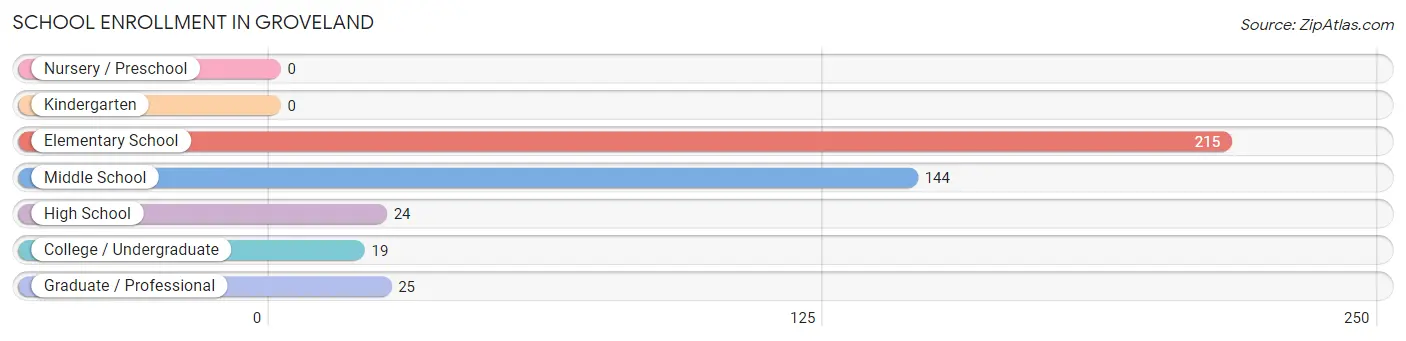
| School Level | # Students | % Students |
| Nursery / Preschool | 0 | 0.0% |
| Kindergarten | 0 | 0.0% |
| Elementary School | 215 | 50.3% |
| Middle School | 144 | 33.7% |
| High School | 24 | 5.6% |
| College / Undergraduate | 19 | 4.4% |
| Graduate / Professional | 25 | 5.9% |
| Total | 427 | 100.0% |
School Enrollment by Age by Funding Source in Groveland
Out of a total of 427 students who are enrolled in schools in Groveland, 260 (60.9%) attend a private institution, while the remaining 167 (39.1%) are enrolled in public schools. The age group of 18 to 19 year olds has the highest likelihood of being enrolled in private schools, with 8 (100.0% in the age bracket) enrolled. Conversely, the age group of 15 to 17 year olds has the lowest likelihood of being enrolled in a private school, with 24 (100.0% in the age bracket) attending a public institution.
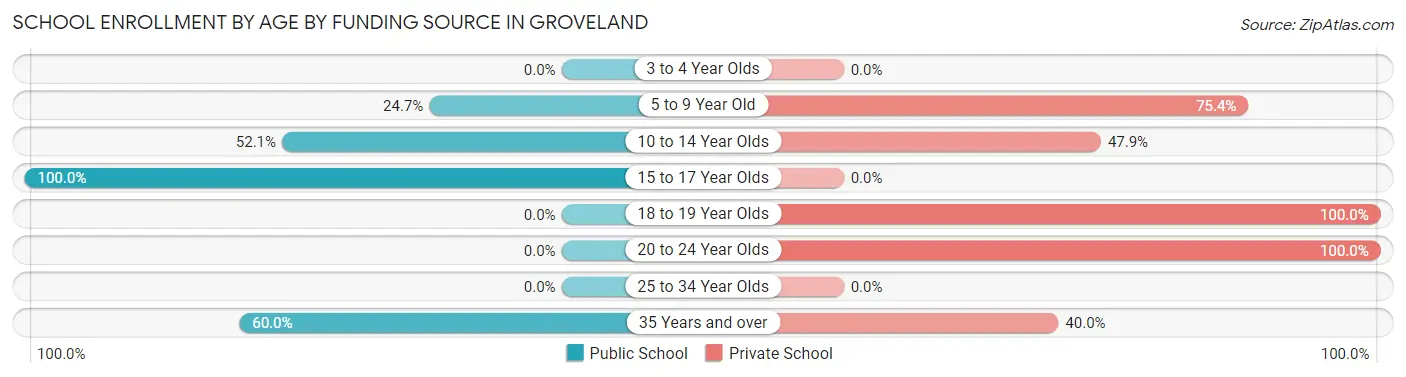
| Age Bracket | Public School | Private School |
| 3 to 4 Year Olds | 0 (0.0%) | 0 (0.0%) |
| 5 to 9 Year Old | 53 (24.6%) | 162 (75.3%) |
| 10 to 14 Year Olds | 75 (52.1%) | 69 (47.9%) |
| 15 to 17 Year Olds | 24 (100.0%) | 0 (0.0%) |
| 18 to 19 Year Olds | 0 (0.0%) | 8 (100.0%) |
| 20 to 24 Year Olds | 0 (0.0%) | 11 (100.0%) |
| 25 to 34 Year Olds | 0 (0.0%) | 0 (0.0%) |
| 35 Years and over | 15 (60.0%) | 10 (40.0%) |
| Total | 167 (39.1%) | 260 (60.9%) |
Educational Attainment by Field of Study in Groveland
Education (101 | 42.8%), business (57 | 24.1%), bio, nature & agricultural (22 | 9.3%), science & technology (17 | 7.2%), and arts & humanities (10 | 4.2%) are the most common fields of study among 236 individuals in Groveland who have obtained a bachelor's degree or higher.
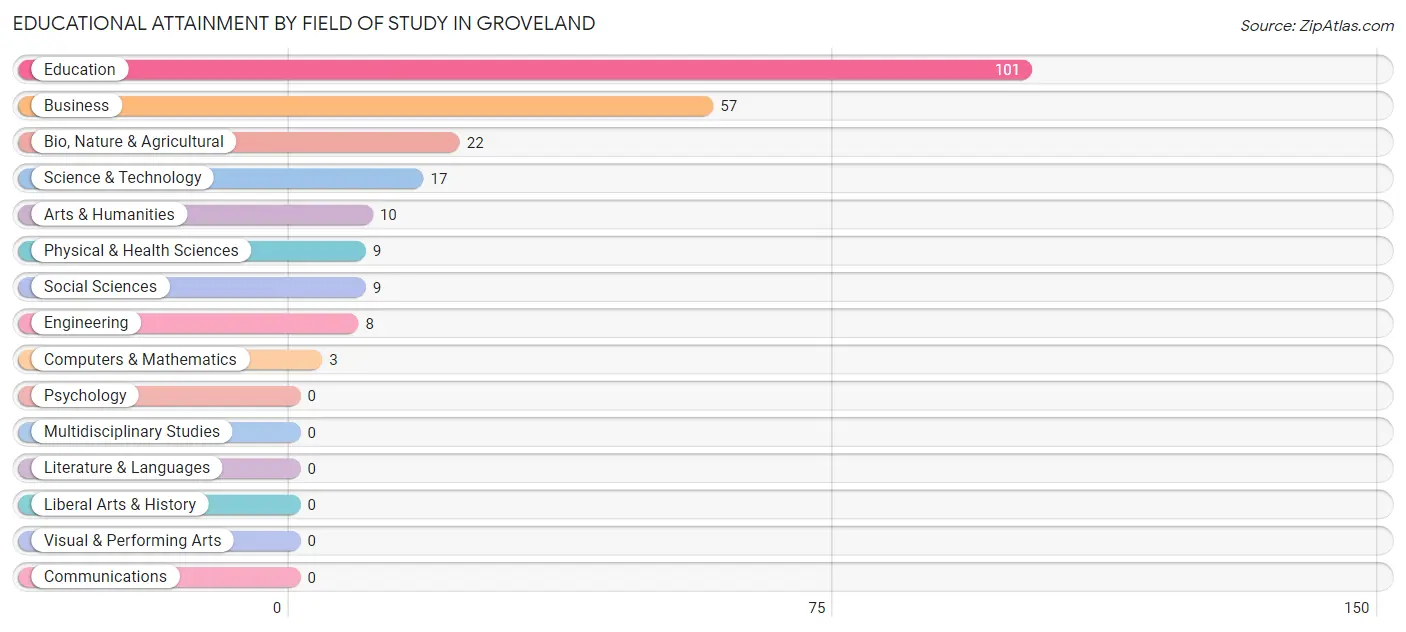
| Field of Study | # Graduates | % Graduates |
| Computers & Mathematics | 3 | 1.3% |
| Bio, Nature & Agricultural | 22 | 9.3% |
| Physical & Health Sciences | 9 | 3.8% |
| Psychology | 0 | 0.0% |
| Social Sciences | 9 | 3.8% |
| Engineering | 8 | 3.4% |
| Multidisciplinary Studies | 0 | 0.0% |
| Science & Technology | 17 | 7.2% |
| Business | 57 | 24.1% |
| Education | 101 | 42.8% |
| Literature & Languages | 0 | 0.0% |
| Liberal Arts & History | 0 | 0.0% |
| Visual & Performing Arts | 0 | 0.0% |
| Communications | 0 | 0.0% |
| Arts & Humanities | 10 | 4.2% |
| Total | 236 | 100.0% |
Transportation & Commute in Groveland
Vehicle Availability by Sex in Groveland
The most prevalent vehicle ownership categories in Groveland are males with 2 vehicles (153, accounting for 55.0%) and females with 2 vehicles (58, making up 98.1%).
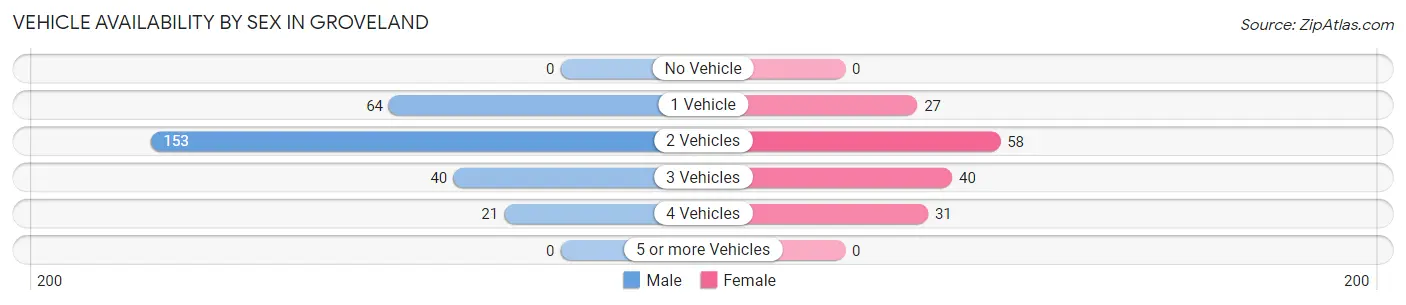
| Vehicles Available | Male | Female |
| No Vehicle | 0 (0.0%) | 0 (0.0%) |
| 1 Vehicle | 64 (23.0%) | 27 (17.3%) |
| 2 Vehicles | 153 (55.0%) | 58 (37.2%) |
| 3 Vehicles | 40 (14.4%) | 40 (25.6%) |
| 4 Vehicles | 21 (7.5%) | 31 (19.9%) |
| 5 or more Vehicles | 0 (0.0%) | 0 (0.0%) |
| Total | 278 (100.0%) | 156 (100.0%) |
Commute Time in Groveland
The most frequently occuring commute durations in Groveland are 10 to 14 minutes (95 commuters, 22.6%), 30 to 34 minutes (64 commuters, 15.2%), and 40 to 44 minutes (64 commuters, 15.2%).
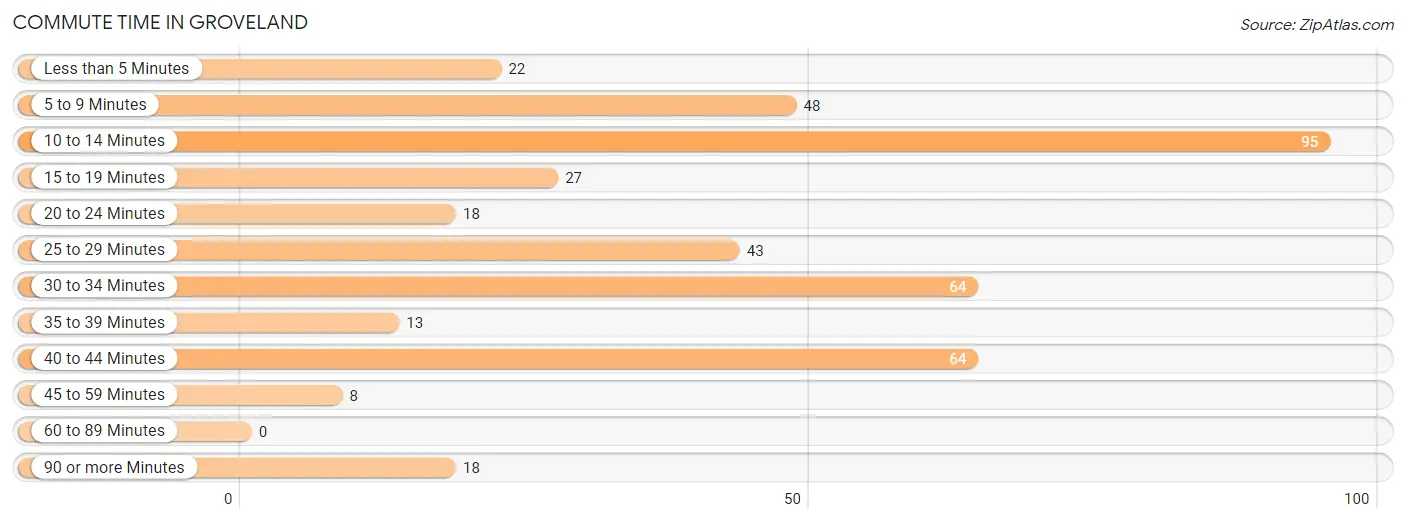
| Commute Time | # Commuters | % Commuters |
| Less than 5 Minutes | 22 | 5.2% |
| 5 to 9 Minutes | 48 | 11.4% |
| 10 to 14 Minutes | 95 | 22.6% |
| 15 to 19 Minutes | 27 | 6.4% |
| 20 to 24 Minutes | 18 | 4.3% |
| 25 to 29 Minutes | 43 | 10.2% |
| 30 to 34 Minutes | 64 | 15.2% |
| 35 to 39 Minutes | 13 | 3.1% |
| 40 to 44 Minutes | 64 | 15.2% |
| 45 to 59 Minutes | 8 | 1.9% |
| 60 to 89 Minutes | 0 | 0.0% |
| 90 or more Minutes | 18 | 4.3% |
Commute Time by Sex in Groveland
The most common commute times in Groveland are 40 to 44 minutes (64 commuters, 23.0%) for males and 10 to 14 minutes (52 commuters, 36.6%) for females.
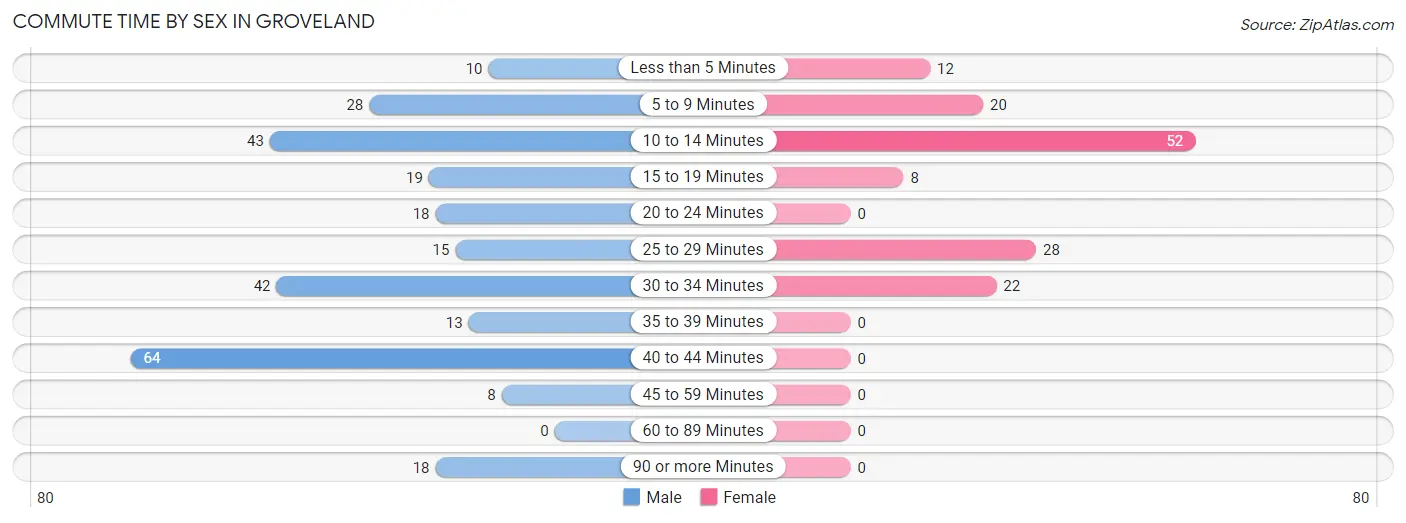
| Commute Time | Male | Female |
| Less than 5 Minutes | 10 (3.6%) | 12 (8.5%) |
| 5 to 9 Minutes | 28 (10.1%) | 20 (14.1%) |
| 10 to 14 Minutes | 43 (15.5%) | 52 (36.6%) |
| 15 to 19 Minutes | 19 (6.8%) | 8 (5.6%) |
| 20 to 24 Minutes | 18 (6.5%) | 0 (0.0%) |
| 25 to 29 Minutes | 15 (5.4%) | 28 (19.7%) |
| 30 to 34 Minutes | 42 (15.1%) | 22 (15.5%) |
| 35 to 39 Minutes | 13 (4.7%) | 0 (0.0%) |
| 40 to 44 Minutes | 64 (23.0%) | 0 (0.0%) |
| 45 to 59 Minutes | 8 (2.9%) | 0 (0.0%) |
| 60 to 89 Minutes | 0 (0.0%) | 0 (0.0%) |
| 90 or more Minutes | 18 (6.5%) | 0 (0.0%) |
Time of Departure to Work by Sex in Groveland
The most frequent times of departure to work in Groveland are 6:00 AM to 6:29 AM (85, 30.6%) for males and 8:30 AM to 8:59 AM (45, 31.7%) for females.
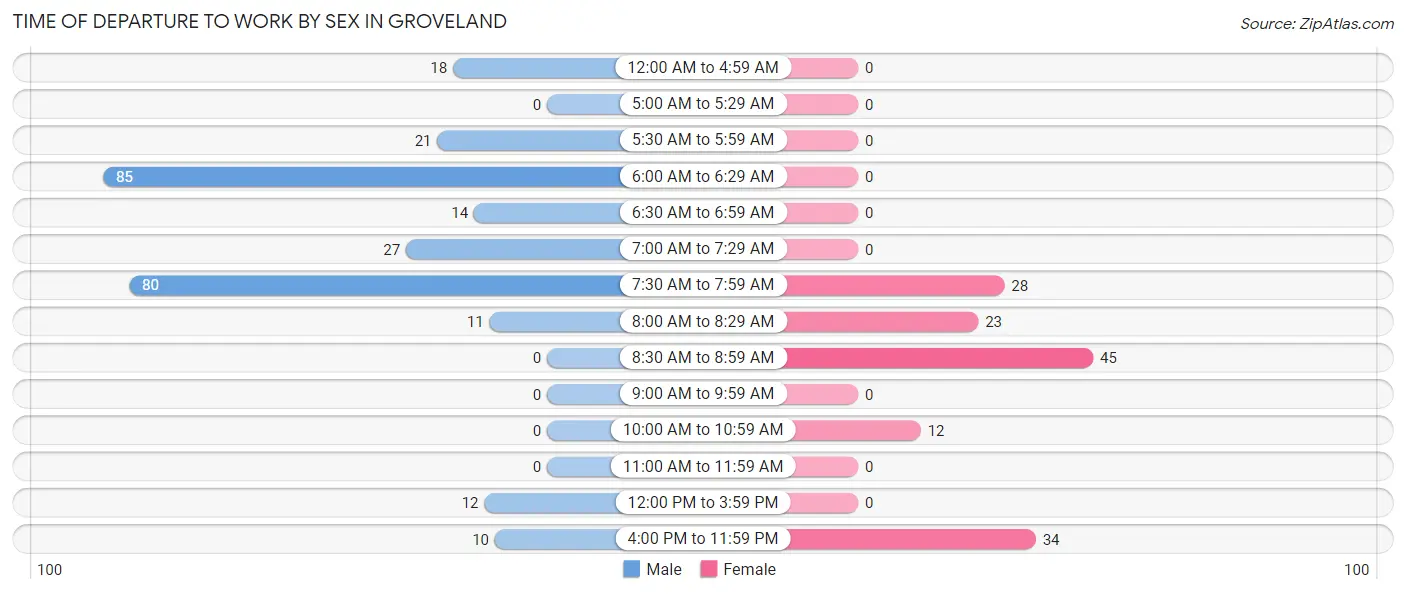
| Time of Departure | Male | Female |
| 12:00 AM to 4:59 AM | 18 (6.5%) | 0 (0.0%) |
| 5:00 AM to 5:29 AM | 0 (0.0%) | 0 (0.0%) |
| 5:30 AM to 5:59 AM | 21 (7.5%) | 0 (0.0%) |
| 6:00 AM to 6:29 AM | 85 (30.6%) | 0 (0.0%) |
| 6:30 AM to 6:59 AM | 14 (5.0%) | 0 (0.0%) |
| 7:00 AM to 7:29 AM | 27 (9.7%) | 0 (0.0%) |
| 7:30 AM to 7:59 AM | 80 (28.8%) | 28 (19.7%) |
| 8:00 AM to 8:29 AM | 11 (4.0%) | 23 (16.2%) |
| 8:30 AM to 8:59 AM | 0 (0.0%) | 45 (31.7%) |
| 9:00 AM to 9:59 AM | 0 (0.0%) | 0 (0.0%) |
| 10:00 AM to 10:59 AM | 0 (0.0%) | 12 (8.5%) |
| 11:00 AM to 11:59 AM | 0 (0.0%) | 0 (0.0%) |
| 12:00 PM to 3:59 PM | 12 (4.3%) | 0 (0.0%) |
| 4:00 PM to 11:59 PM | 10 (3.6%) | 34 (23.9%) |
| Total | 278 (100.0%) | 142 (100.0%) |
Housing Occupancy in Groveland
Occupancy by Ownership in Groveland
Of the total 405 dwellings in Groveland, owner-occupied units account for 202 (49.9%), while renter-occupied units make up 203 (50.1%).
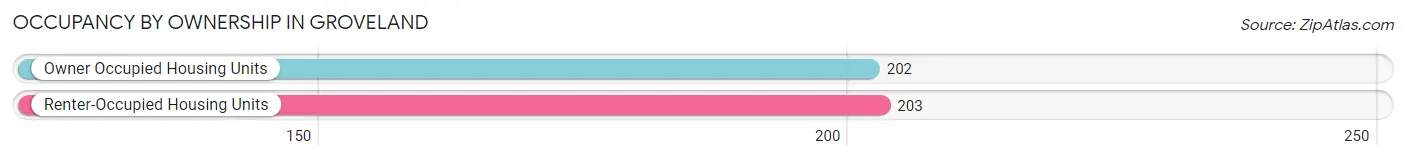
| Occupancy | # Housing Units | % Housing Units |
| Owner Occupied Housing Units | 202 | 49.9% |
| Renter-Occupied Housing Units | 203 | 50.1% |
| Total Occupied Housing Units | 405 | 100.0% |
Occupancy by Household Size in Groveland
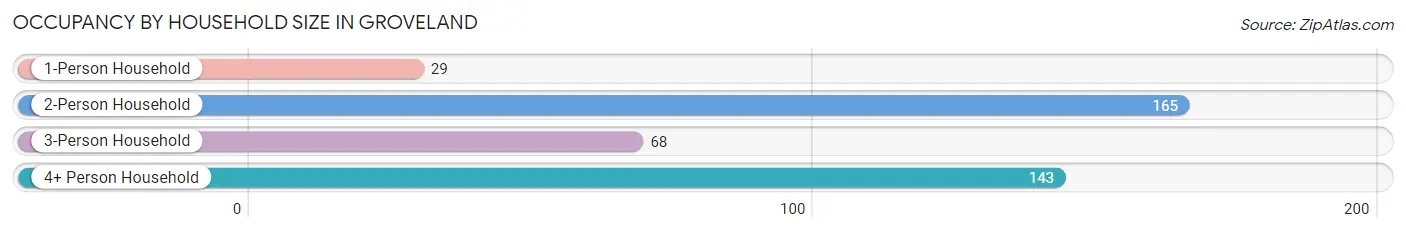
| Household Size | # Housing Units | % Housing Units |
| 1-Person Household | 29 | 7.2% |
| 2-Person Household | 165 | 40.7% |
| 3-Person Household | 68 | 16.8% |
| 4+ Person Household | 143 | 35.3% |
| Total Housing Units | 405 | 100.0% |
Occupancy by Ownership by Household Size in Groveland
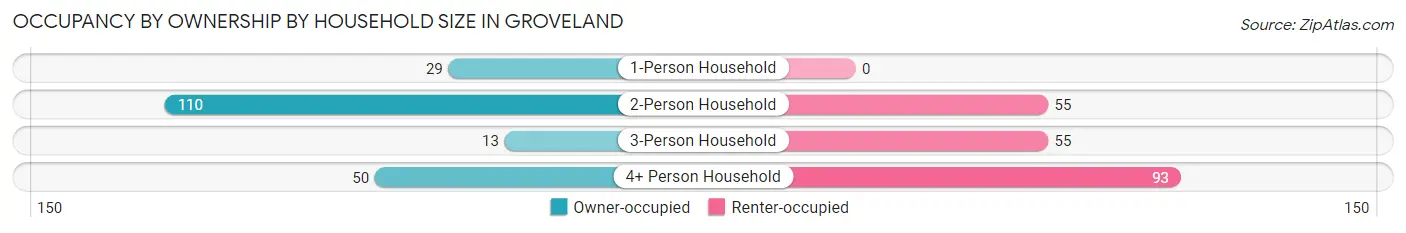
| Household Size | Owner-occupied | Renter-occupied |
| 1-Person Household | 29 (100.0%) | 0 (0.0%) |
| 2-Person Household | 110 (66.7%) | 55 (33.3%) |
| 3-Person Household | 13 (19.1%) | 55 (80.9%) |
| 4+ Person Household | 50 (35.0%) | 93 (65.0%) |
| Total Housing Units | 202 (49.9%) | 203 (50.1%) |
Occupancy by Educational Attainment in Groveland
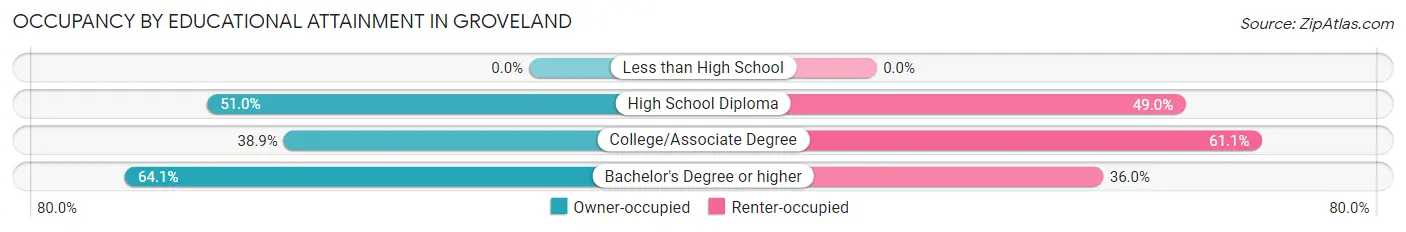
| Household Size | Owner-occupied | Renter-occupied |
| Less than High School | 0 (0.0%) | 0 (0.0%) |
| High School Diploma | 25 (51.0%) | 24 (49.0%) |
| College/Associate Degree | 79 (38.9%) | 124 (61.1%) |
| Bachelor's Degree or higher | 98 (64.0%) | 55 (35.9%) |
Occupancy by Age of Householder in Groveland
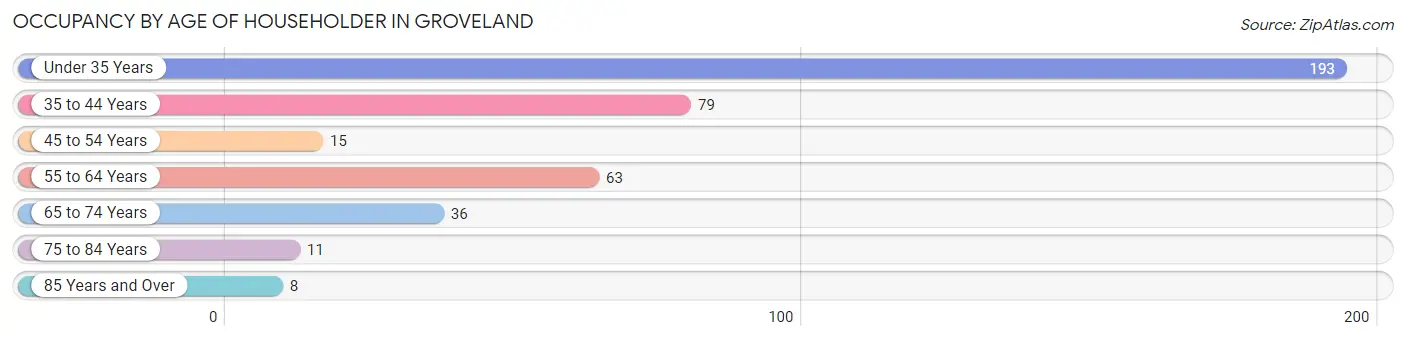
| Age Bracket | # Households | % Households |
| Under 35 Years | 193 | 47.6% |
| 35 to 44 Years | 79 | 19.5% |
| 45 to 54 Years | 15 | 3.7% |
| 55 to 64 Years | 63 | 15.6% |
| 65 to 74 Years | 36 | 8.9% |
| 75 to 84 Years | 11 | 2.7% |
| 85 Years and Over | 8 | 2.0% |
| Total | 405 | 100.0% |
Housing Finances in Groveland
Median Income by Occupancy in Groveland
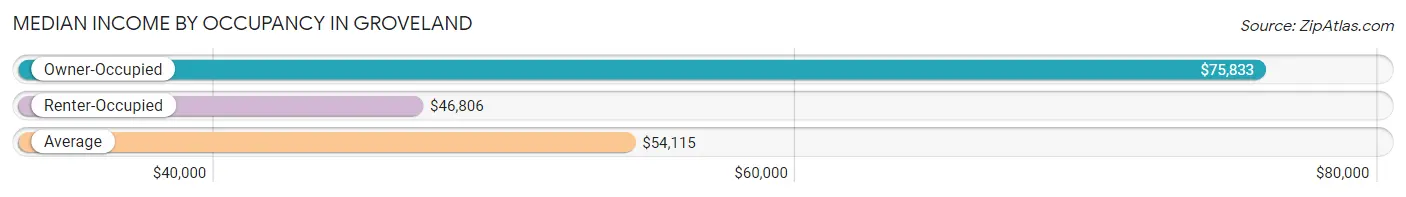
| Occupancy Type | # Households | Median Income |
| Owner-Occupied | 202 (49.9%) | $75,833 |
| Renter-Occupied | 203 (50.1%) | $46,806 |
| Average | 405 (100.0%) | $54,115 |
Occupancy by Householder Income Bracket in Groveland
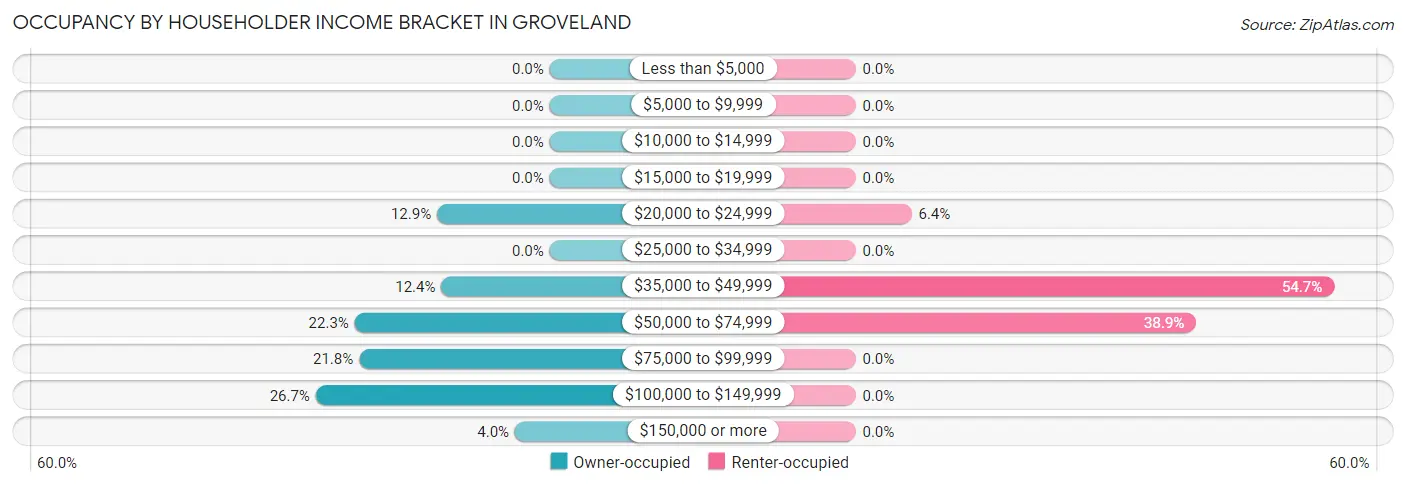
| Income Bracket | Owner-occupied | Renter-occupied |
| Less than $5,000 | 0 (0.0%) | 0 (0.0%) |
| $5,000 to $9,999 | 0 (0.0%) | 0 (0.0%) |
| $10,000 to $14,999 | 0 (0.0%) | 0 (0.0%) |
| $15,000 to $19,999 | 0 (0.0%) | 0 (0.0%) |
| $20,000 to $24,999 | 26 (12.9%) | 13 (6.4%) |
| $25,000 to $34,999 | 0 (0.0%) | 0 (0.0%) |
| $35,000 to $49,999 | 25 (12.4%) | 111 (54.7%) |
| $50,000 to $74,999 | 45 (22.3%) | 79 (38.9%) |
| $75,000 to $99,999 | 44 (21.8%) | 0 (0.0%) |
| $100,000 to $149,999 | 54 (26.7%) | 0 (0.0%) |
| $150,000 or more | 8 (4.0%) | 0 (0.0%) |
| Total | 202 (100.0%) | 203 (100.0%) |
Monthly Housing Cost Tiers in Groveland
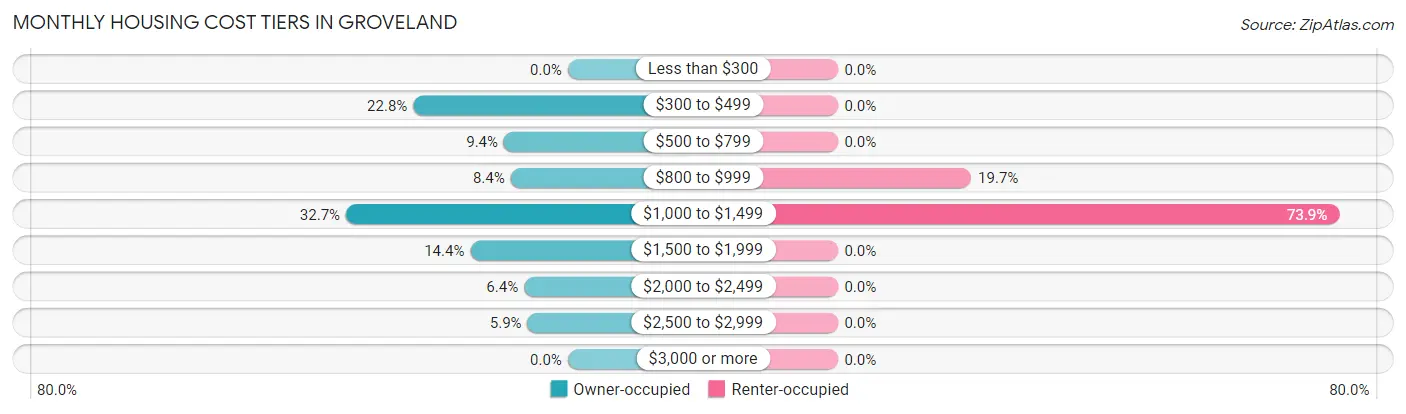
| Monthly Cost | Owner-occupied | Renter-occupied |
| Less than $300 | 0 (0.0%) | 0 (0.0%) |
| $300 to $499 | 46 (22.8%) | 0 (0.0%) |
| $500 to $799 | 19 (9.4%) | 0 (0.0%) |
| $800 to $999 | 17 (8.4%) | 40 (19.7%) |
| $1,000 to $1,499 | 66 (32.7%) | 150 (73.9%) |
| $1,500 to $1,999 | 29 (14.4%) | 0 (0.0%) |
| $2,000 to $2,499 | 13 (6.4%) | 0 (0.0%) |
| $2,500 to $2,999 | 12 (5.9%) | 0 (0.0%) |
| $3,000 or more | 0 (0.0%) | 0 (0.0%) |
| Total | 202 (100.0%) | 203 (100.0%) |
Physical Housing Characteristics in Groveland
Housing Structures in Groveland
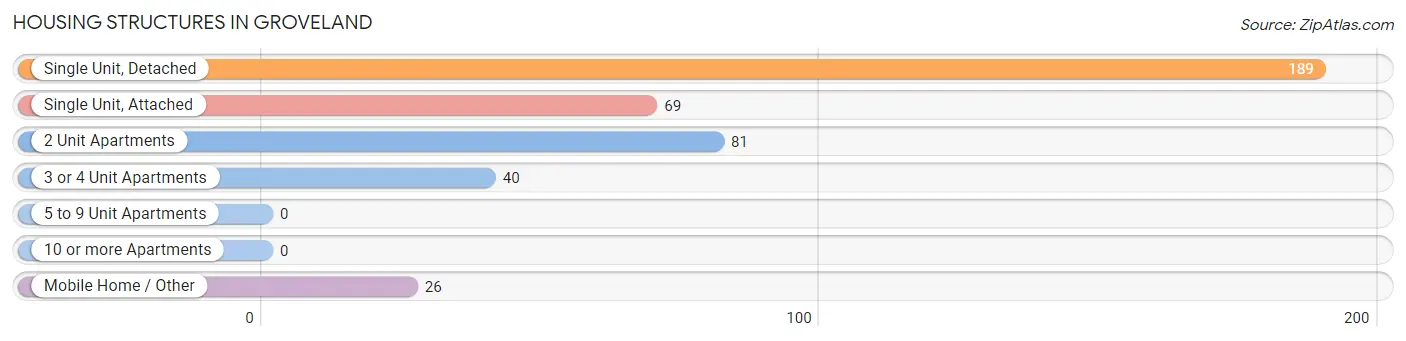
| Structure Type | # Housing Units | % Housing Units |
| Single Unit, Detached | 189 | 46.7% |
| Single Unit, Attached | 69 | 17.0% |
| 2 Unit Apartments | 81 | 20.0% |
| 3 or 4 Unit Apartments | 40 | 9.9% |
| 5 to 9 Unit Apartments | 0 | 0.0% |
| 10 or more Apartments | 0 | 0.0% |
| Mobile Home / Other | 26 | 6.4% |
| Total | 405 | 100.0% |
Housing Structures by Occupancy in Groveland
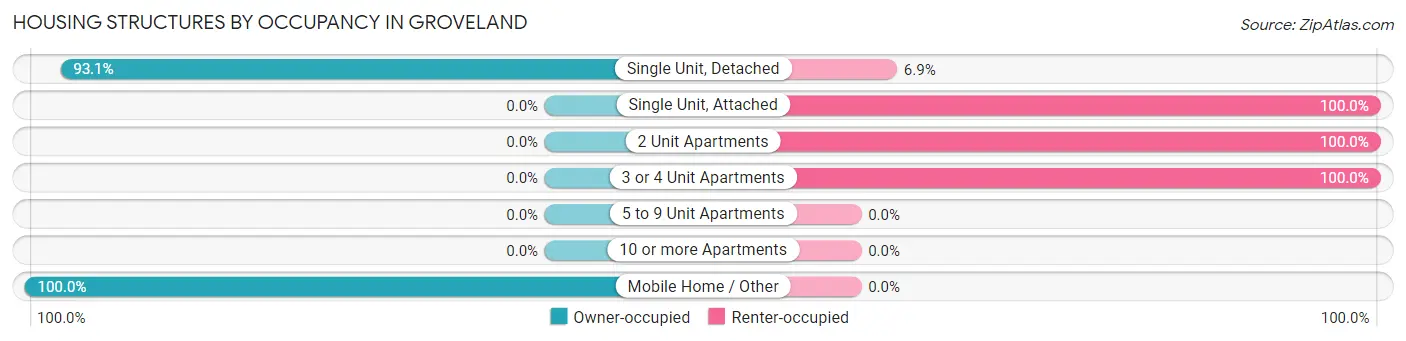
| Structure Type | Owner-occupied | Renter-occupied |
| Single Unit, Detached | 176 (93.1%) | 13 (6.9%) |
| Single Unit, Attached | 0 (0.0%) | 69 (100.0%) |
| 2 Unit Apartments | 0 (0.0%) | 81 (100.0%) |
| 3 or 4 Unit Apartments | 0 (0.0%) | 40 (100.0%) |
| 5 to 9 Unit Apartments | 0 (0.0%) | 0 (0.0%) |
| 10 or more Apartments | 0 (0.0%) | 0 (0.0%) |
| Mobile Home / Other | 26 (100.0%) | 0 (0.0%) |
| Total | 202 (49.9%) | 203 (50.1%) |
Housing Structures by Number of Rooms in Groveland
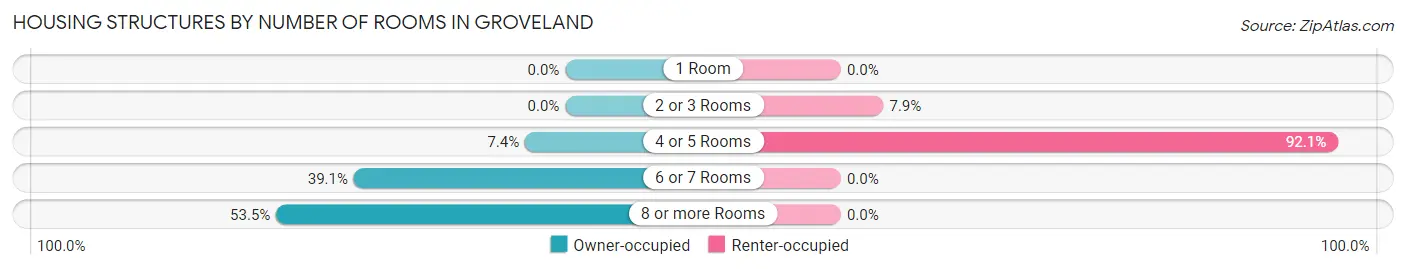
| Number of Rooms | Owner-occupied | Renter-occupied |
| 1 Room | 0 (0.0%) | 0 (0.0%) |
| 2 or 3 Rooms | 0 (0.0%) | 16 (7.9%) |
| 4 or 5 Rooms | 15 (7.4%) | 187 (92.1%) |
| 6 or 7 Rooms | 79 (39.1%) | 0 (0.0%) |
| 8 or more Rooms | 108 (53.5%) | 0 (0.0%) |
| Total | 202 (100.0%) | 203 (100.0%) |
Housing Structure by Heating Type in Groveland
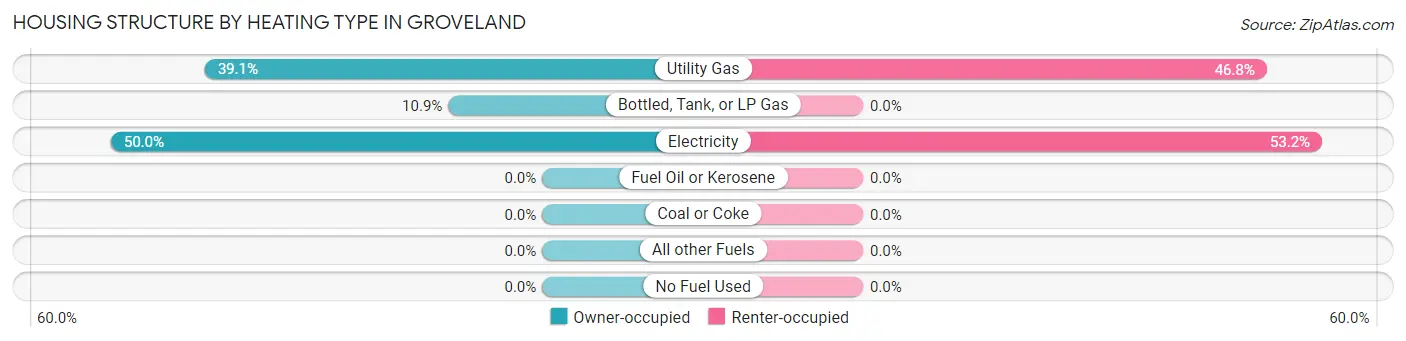
| Heating Type | Owner-occupied | Renter-occupied |
| Utility Gas | 79 (39.1%) | 95 (46.8%) |
| Bottled, Tank, or LP Gas | 22 (10.9%) | 0 (0.0%) |
| Electricity | 101 (50.0%) | 108 (53.2%) |
| Fuel Oil or Kerosene | 0 (0.0%) | 0 (0.0%) |
| Coal or Coke | 0 (0.0%) | 0 (0.0%) |
| All other Fuels | 0 (0.0%) | 0 (0.0%) |
| No Fuel Used | 0 (0.0%) | 0 (0.0%) |
| Total | 202 (100.0%) | 203 (100.0%) |
Household Vehicle Usage in Groveland
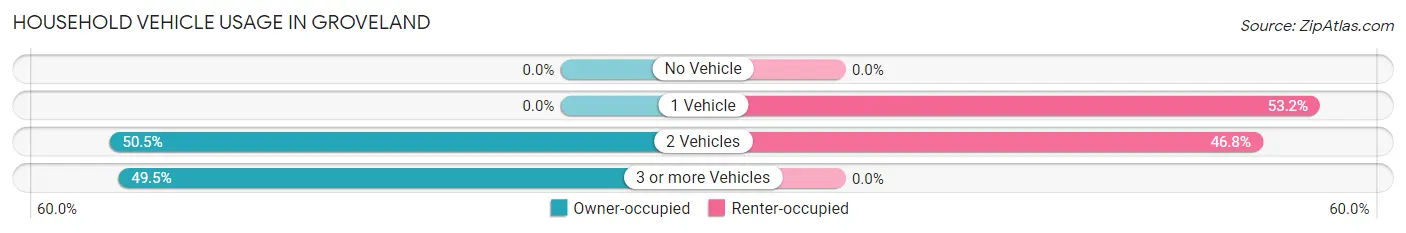
| Vehicles per Household | Owner-occupied | Renter-occupied |
| No Vehicle | 0 (0.0%) | 0 (0.0%) |
| 1 Vehicle | 0 (0.0%) | 108 (53.2%) |
| 2 Vehicles | 102 (50.5%) | 95 (46.8%) |
| 3 or more Vehicles | 100 (49.5%) | 0 (0.0%) |
| Total | 202 (100.0%) | 203 (100.0%) |
Real Estate & Mortgages in Groveland
Real Estate and Mortgage Overview in Groveland
| Characteristic | Without Mortgage | With Mortgage |
| Housing Units | 65 | 137 |
| Median Property Value | $290,600 | $242,300 |
| Median Household Income | - | - |
| Monthly Housing Costs | $392 | $0 |
| Real Estate Taxes | $1,406 | $0 |
Property Value by Mortgage Status in Groveland
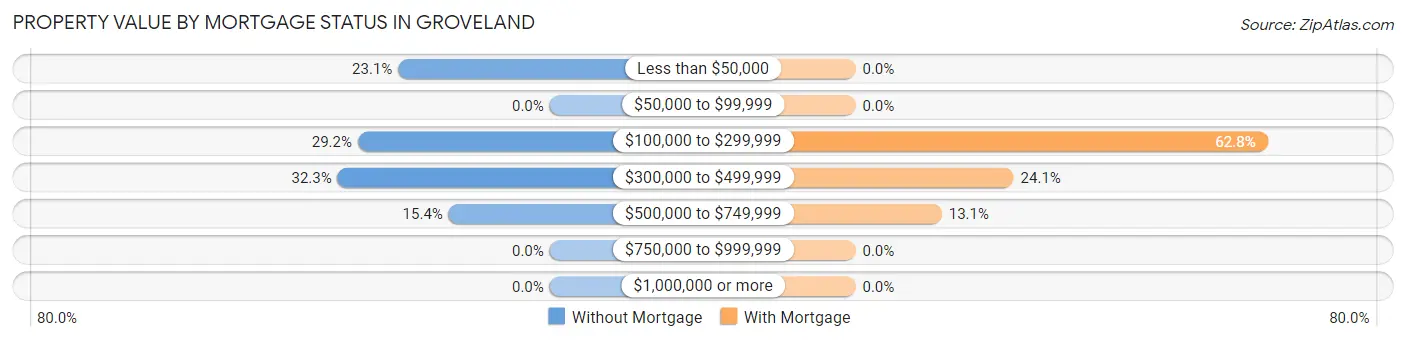
| Property Value | Without Mortgage | With Mortgage |
| Less than $50,000 | 15 (23.1%) | 0 (0.0%) |
| $50,000 to $99,999 | 0 (0.0%) | 0 (0.0%) |
| $100,000 to $299,999 | 19 (29.2%) | 86 (62.8%) |
| $300,000 to $499,999 | 21 (32.3%) | 33 (24.1%) |
| $500,000 to $749,999 | 10 (15.4%) | 18 (13.1%) |
| $750,000 to $999,999 | 0 (0.0%) | 0 (0.0%) |
| $1,000,000 or more | 0 (0.0%) | 0 (0.0%) |
| Total | 65 (100.0%) | 137 (100.0%) |
Household Income by Mortgage Status in Groveland
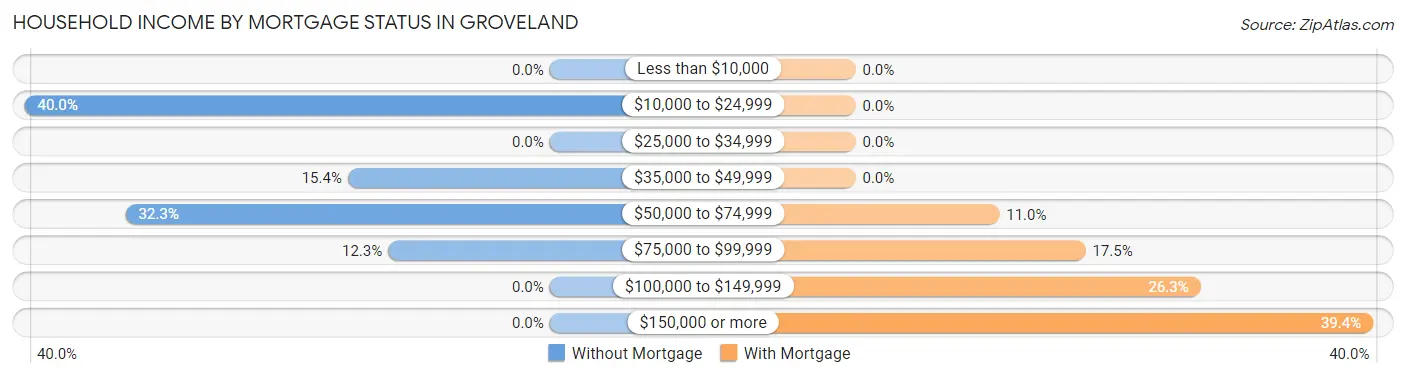
| Household Income | Without Mortgage | With Mortgage |
| Less than $10,000 | 0 (0.0%) | 0 (0.0%) |
| $10,000 to $24,999 | 26 (40.0%) | 0 (0.0%) |
| $25,000 to $34,999 | 0 (0.0%) | 0 (0.0%) |
| $35,000 to $49,999 | 10 (15.4%) | 0 (0.0%) |
| $50,000 to $74,999 | 21 (32.3%) | 15 (11.0%) |
| $75,000 to $99,999 | 8 (12.3%) | 24 (17.5%) |
| $100,000 to $149,999 | 0 (0.0%) | 36 (26.3%) |
| $150,000 or more | 0 (0.0%) | 54 (39.4%) |
| Total | 65 (100.0%) | 137 (100.0%) |
Property Value to Household Income Ratio in Groveland
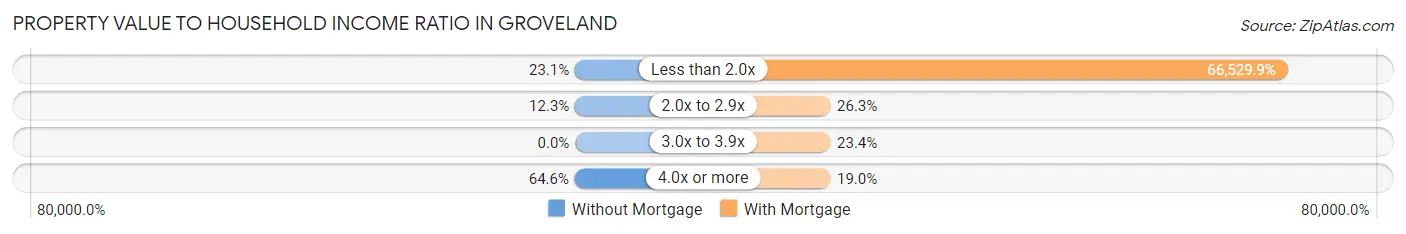
| Value-to-Income Ratio | Without Mortgage | With Mortgage |
| Less than 2.0x | 15 (23.1%) | 91,146 (66,529.9%) |
| 2.0x to 2.9x | 8 (12.3%) | 36 (26.3%) |
| 3.0x to 3.9x | 0 (0.0%) | 32 (23.4%) |
| 4.0x or more | 42 (64.6%) | 26 (19.0%) |
| Total | 65 (100.0%) | 137 (100.0%) |
Real Estate Taxes by Mortgage Status in Groveland
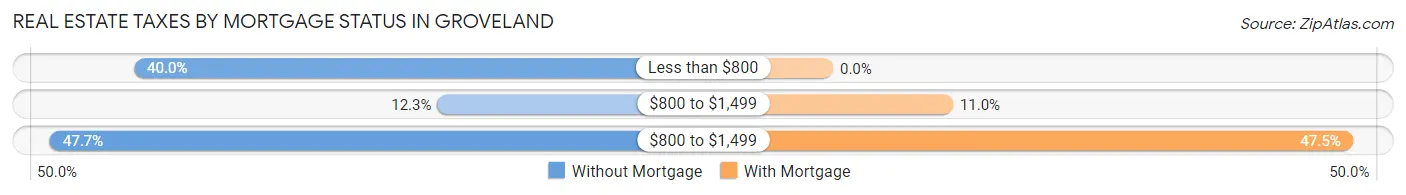
| Property Taxes | Without Mortgage | With Mortgage |
| Less than $800 | 26 (40.0%) | 0 (0.0%) |
| $800 to $1,499 | 8 (12.3%) | 15 (11.0%) |
| $800 to $1,499 | 31 (47.7%) | 65 (47.4%) |
| Total | 65 (100.0%) | 137 (100.0%) |
Health & Disability in Groveland
Health Insurance Coverage by Age in Groveland
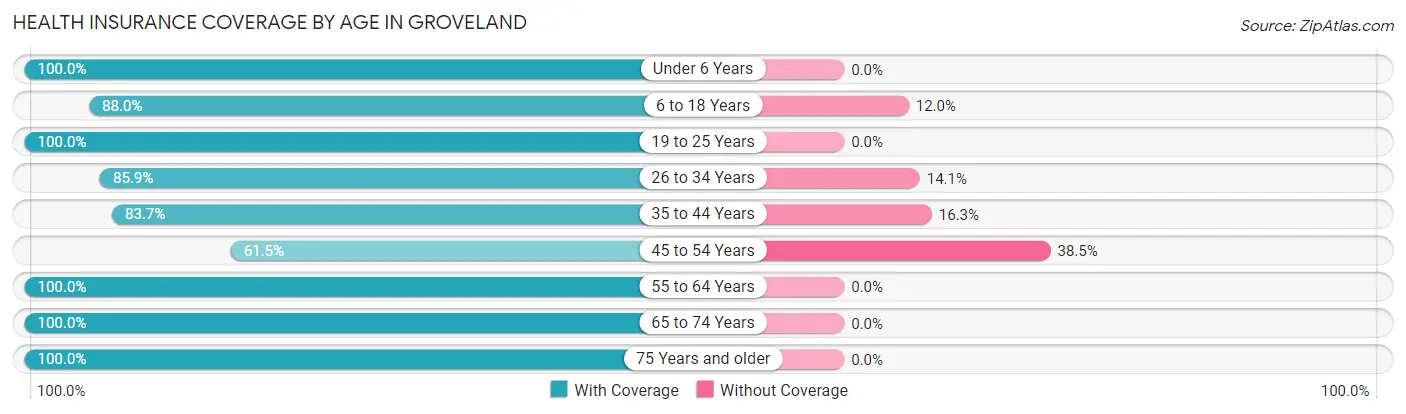
| Age Bracket | With Coverage | Without Coverage |
| Under 6 Years | 68 (100.0%) | 0 (0.0%) |
| 6 to 18 Years | 344 (88.0%) | 47 (12.0%) |
| 19 to 25 Years | 50 (100.0%) | 0 (0.0%) |
| 26 to 34 Years | 244 (85.9%) | 40 (14.1%) |
| 35 to 44 Years | 123 (83.7%) | 24 (16.3%) |
| 45 to 54 Years | 24 (61.5%) | 15 (38.5%) |
| 55 to 64 Years | 95 (100.0%) | 0 (0.0%) |
| 65 to 74 Years | 90 (100.0%) | 0 (0.0%) |
| 75 Years and older | 26 (100.0%) | 0 (0.0%) |
| Total | 1,064 (89.4%) | 126 (10.6%) |
Health Insurance Coverage by Citizenship Status in Groveland
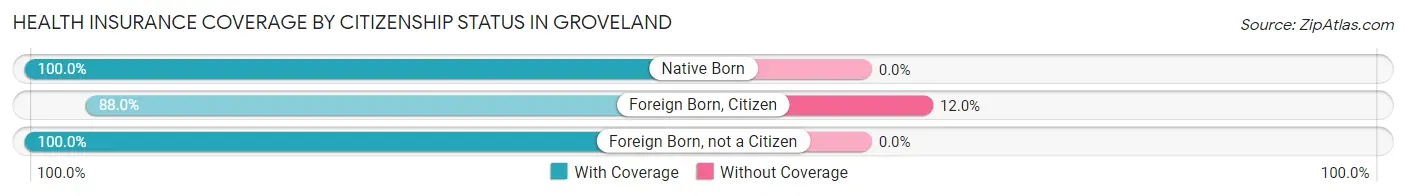
| Citizenship Status | With Coverage | Without Coverage |
| Native Born | 68 (100.0%) | 0 (0.0%) |
| Foreign Born, Citizen | 344 (88.0%) | 47 (12.0%) |
| Foreign Born, not a Citizen | 50 (100.0%) | 0 (0.0%) |
Health Insurance Coverage by Household Income in Groveland
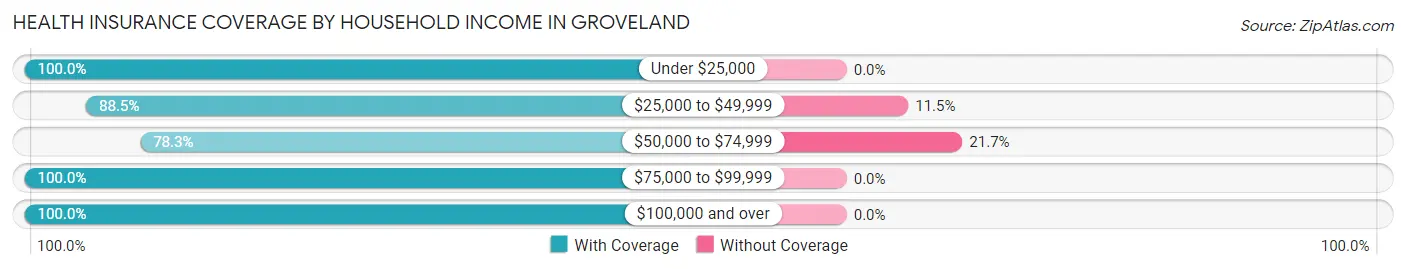
| Household Income | With Coverage | Without Coverage |
| Under $25,000 | 72 (100.0%) | 0 (0.0%) |
| $25,000 to $49,999 | 445 (88.5%) | 58 (11.5%) |
| $50,000 to $74,999 | 246 (78.3%) | 68 (21.7%) |
| $75,000 to $99,999 | 109 (100.0%) | 0 (0.0%) |
| $100,000 and over | 192 (100.0%) | 0 (0.0%) |
Public vs Private Health Insurance Coverage by Age in Groveland
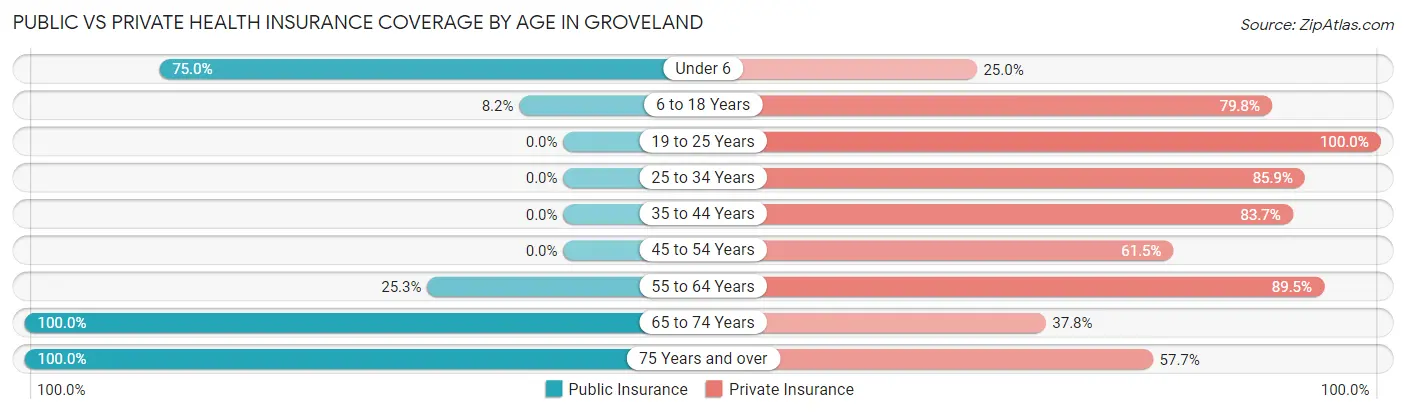
| Age Bracket | Public Insurance | Private Insurance |
| Under 6 | 51 (75.0%) | 17 (25.0%) |
| 6 to 18 Years | 32 (8.2%) | 312 (79.8%) |
| 19 to 25 Years | 0 (0.0%) | 50 (100.0%) |
| 25 to 34 Years | 0 (0.0%) | 244 (85.9%) |
| 35 to 44 Years | 0 (0.0%) | 123 (83.7%) |
| 45 to 54 Years | 0 (0.0%) | 24 (61.5%) |
| 55 to 64 Years | 24 (25.3%) | 85 (89.5%) |
| 65 to 74 Years | 90 (100.0%) | 34 (37.8%) |
| 75 Years and over | 26 (100.0%) | 15 (57.7%) |
| Total | 223 (18.7%) | 904 (76.0%) |
Disability Status by Sex by Age in Groveland
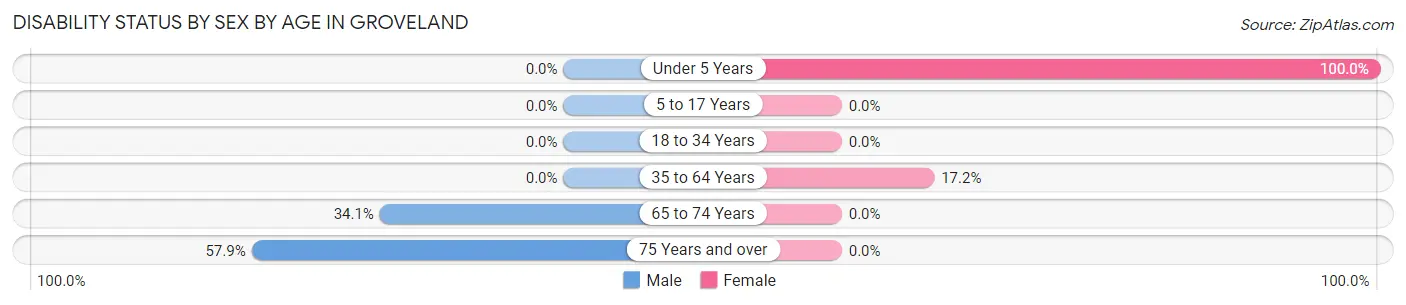
| Age Bracket | Male | Female |
| Under 5 Years | 0 (0.0%) | 42 (100.0%) |
| 5 to 17 Years | 0 (0.0%) | 0 (0.0%) |
| 18 to 34 Years | 0 (0.0%) | 0 (0.0%) |
| 35 to 64 Years | 0 (0.0%) | 23 (17.2%) |
| 65 to 74 Years | 15 (34.1%) | 0 (0.0%) |
| 75 Years and over | 11 (57.9%) | 0 (0.0%) |
Disability Class by Sex by Age in Groveland
Disability Class: Hearing Difficulty
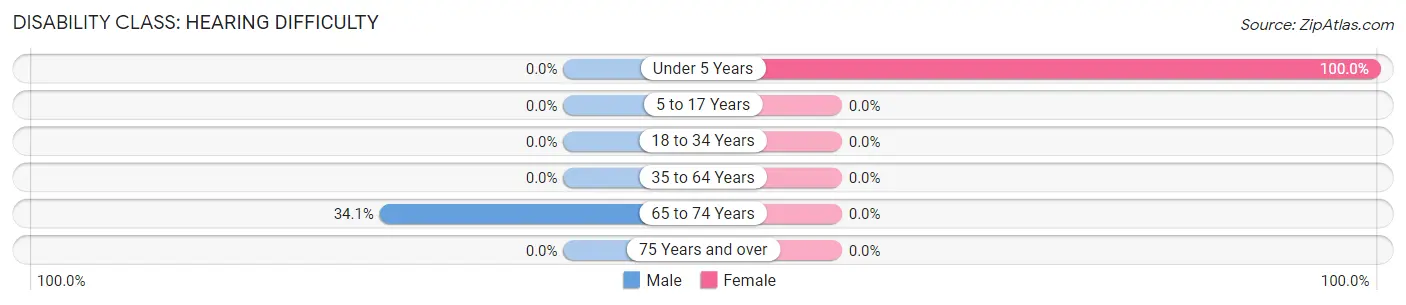
| Age Bracket | Male | Female |
| Under 5 Years | 0 (0.0%) | 42 (100.0%) |
| 5 to 17 Years | 0 (0.0%) | 0 (0.0%) |
| 18 to 34 Years | 0 (0.0%) | 0 (0.0%) |
| 35 to 64 Years | 0 (0.0%) | 0 (0.0%) |
| 65 to 74 Years | 15 (34.1%) | 0 (0.0%) |
| 75 Years and over | 0 (0.0%) | 0 (0.0%) |
Disability Class: Vision Difficulty
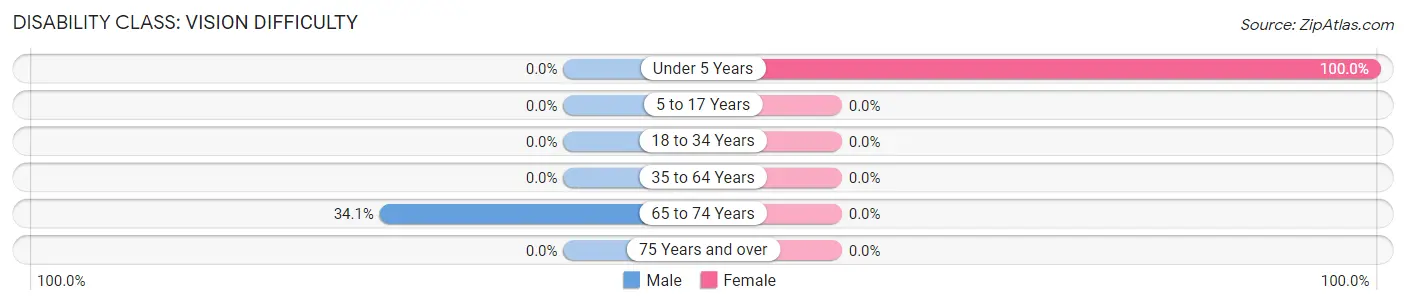
| Age Bracket | Male | Female |
| Under 5 Years | 0 (0.0%) | 42 (100.0%) |
| 5 to 17 Years | 0 (0.0%) | 0 (0.0%) |
| 18 to 34 Years | 0 (0.0%) | 0 (0.0%) |
| 35 to 64 Years | 0 (0.0%) | 0 (0.0%) |
| 65 to 74 Years | 15 (34.1%) | 0 (0.0%) |
| 75 Years and over | 0 (0.0%) | 0 (0.0%) |
Disability Class: Cognitive Difficulty
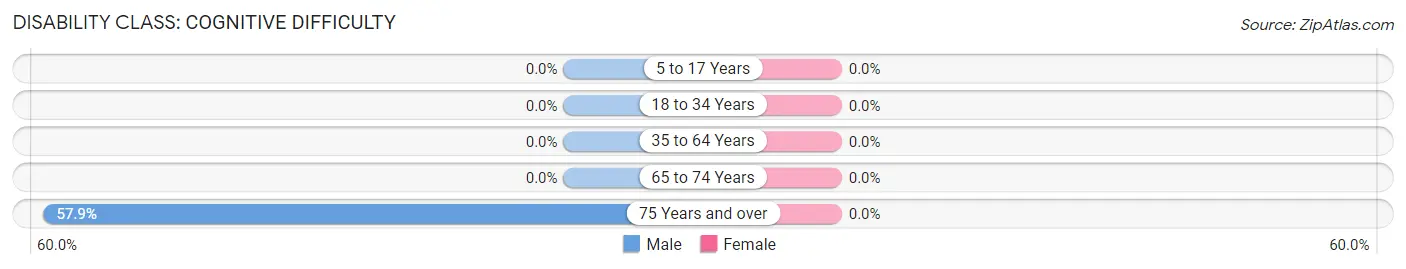
| Age Bracket | Male | Female |
| 5 to 17 Years | 0 (0.0%) | 0 (0.0%) |
| 18 to 34 Years | 0 (0.0%) | 0 (0.0%) |
| 35 to 64 Years | 0 (0.0%) | 0 (0.0%) |
| 65 to 74 Years | 0 (0.0%) | 0 (0.0%) |
| 75 Years and over | 11 (57.9%) | 0 (0.0%) |
Disability Class: Ambulatory Difficulty
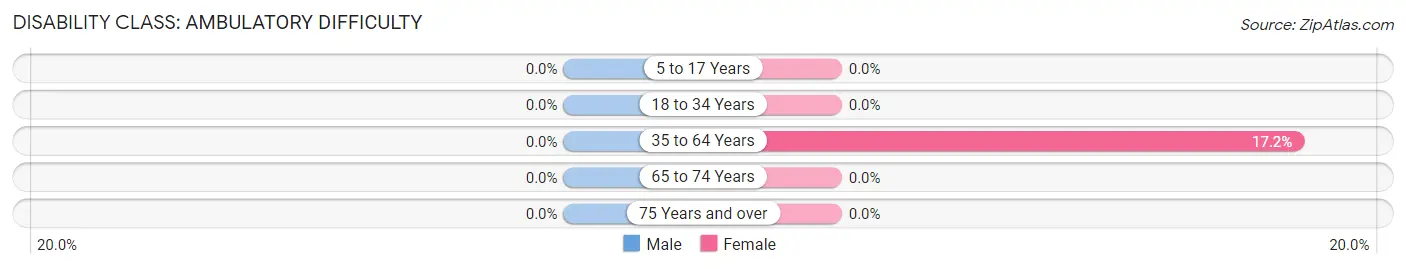
| Age Bracket | Male | Female |
| 5 to 17 Years | 0 (0.0%) | 0 (0.0%) |
| 18 to 34 Years | 0 (0.0%) | 0 (0.0%) |
| 35 to 64 Years | 0 (0.0%) | 23 (17.2%) |
| 65 to 74 Years | 0 (0.0%) | 0 (0.0%) |
| 75 Years and over | 0 (0.0%) | 0 (0.0%) |
Disability Class: Self-Care Difficulty
| Age Bracket | Male | Female |
| 5 to 17 Years | 0 (0.0%) | 0 (0.0%) |
| 18 to 34 Years | 0 (0.0%) | 0 (0.0%) |
| 35 to 64 Years | 0 (0.0%) | 0 (0.0%) |
| 65 to 74 Years | 0 (0.0%) | 0 (0.0%) |
| 75 Years and over | 0 (0.0%) | 0 (0.0%) |
Technology Access in Groveland
Computing Device Access in Groveland
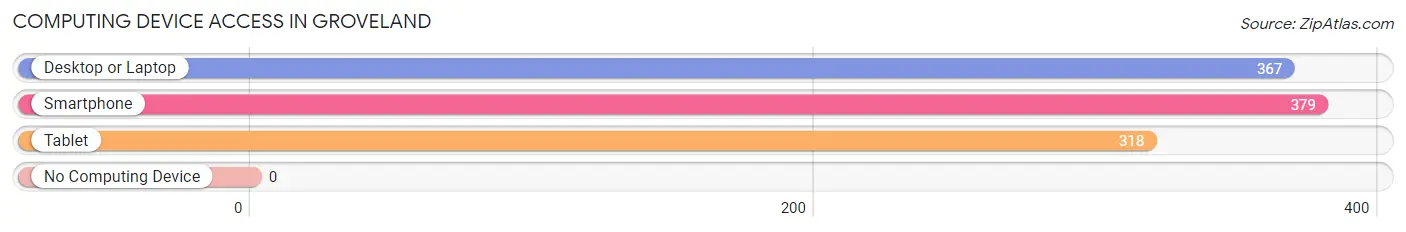
| Device Type | # Households | % Households |
| Desktop or Laptop | 367 | 90.6% |
| Smartphone | 379 | 93.6% |
| Tablet | 318 | 78.5% |
| No Computing Device | 0 | 0.0% |
| Total | 405 | 100.0% |
Internet Access in Groveland
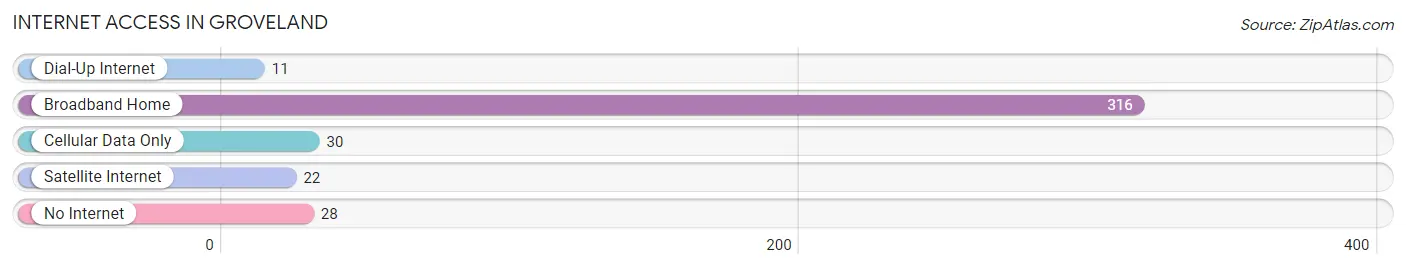
| Internet Type | # Households | % Households |
| Dial-Up Internet | 11 | 2.7% |
| Broadband Home | 316 | 78.0% |
| Cellular Data Only | 30 | 7.4% |
| Satellite Internet | 22 | 5.4% |
| No Internet | 28 | 6.9% |
| Total | 405 | 100.0% |
Groveland Summary
History
The small town of Groveland, Idaho is located in the northern part of the state, in the county of Shoshone. It is situated in the Clearwater River Valley, and is surrounded by the Bitterroot Mountains. The area was first inhabited by the Nez Perce Native American tribe, who lived in the area for centuries before the arrival of European settlers.
The first European settlers to arrive in the area were miners, who came in search of gold and other minerals. The town of Groveland was founded in 1883, and was named after the nearby Groveland Mine. The mine was a major source of income for the town, and it was also the site of the first post office in the area.
The town of Groveland grew rapidly in the late 19th century, and by the early 20th century it had become a bustling center of commerce and industry. The town was home to several businesses, including a sawmill, a flour mill, a blacksmith shop, and a general store. The town also had a school, a church, and a hotel.
In the early 20th century, the town of Groveland was a popular destination for tourists, who came to enjoy the area’s natural beauty and outdoor activities. The town was also home to several resorts, which attracted visitors from all over the country.
Geography
Groveland is located in the northern part of Idaho, in the county of Shoshone. It is situated in the Clearwater River Valley, and is surrounded by the Bitterroot Mountains. The town is located at an elevation of 4,000 feet, and has a total area of 1.2 square miles.
The climate in Groveland is generally mild, with warm summers and cold winters. The average temperature in the summer is around 70 degrees Fahrenheit, and the average temperature in the winter is around 30 degrees Fahrenheit. The town receives an average of 20 inches of precipitation per year.
The town of Groveland is located near several natural attractions, including the Clearwater National Forest, the Nez Perce National Historical Park, and the Selway-Bitterroot Wilderness Area. The town is also located near several popular recreational areas, including the Priest Lake State Park and the Hells Canyon National Recreation Area.
Economy
The economy of Groveland is largely based on tourism and outdoor recreation. The town is home to several resorts, which attract visitors from all over the country. The town is also home to several businesses, including a sawmill, a flour mill, a blacksmith shop, and a general store.
The town is also home to several manufacturing companies, which produce a variety of products, including furniture, clothing, and electronics. The town is also home to several agricultural businesses, which produce a variety of crops, including potatoes, wheat, and hay.
Demographics
As of the 2010 census, the town of Groveland had a population of 1,093. The population is largely white, with a small percentage of Native American and Hispanic residents. The median age of the population is 44.7 years, and the median household income is $37,917.
The town of Groveland is served by the Clearwater County School District, which operates two elementary schools, one middle school, and one high school. The town is also home to several churches, including the Church of Jesus Christ of Latter-day Saints, the United Methodist Church, and the Catholic Church.
Common Questions
What is Per Capita Income in Groveland?
Per Capita income in Groveland is $20,746.
What is the Median Family Income in Groveland?
Median Family Income in Groveland is $66,364.
What is the Median Household income in Groveland?
Median Household Income in Groveland is $54,115.
What is Inequality or Gini Index in Groveland?
Inequality or Gini Index in Groveland is 0.26.
What is the Total Population of Groveland?
Total Population of Groveland is 1,190.
What is the Total Male Population of Groveland?
Total Male Population of Groveland is 507.
What is the Total Female Population of Groveland?
Total Female Population of Groveland is 683.
What is the Ratio of Males per 100 Females in Groveland?
There are 74.23 Males per 100 Females in Groveland.
What is the Ratio of Females per 100 Males in Groveland?
There are 134.71 Females per 100 Males in Groveland.
What is the Median Population Age in Groveland?
Median Population Age in Groveland is 29.6 Years.
What is the Average Family Size in Groveland
Average Family Size in Groveland is 3.1 People.
What is the Average Household Size in Groveland
Average Household Size in Groveland is 2.9 People.
How Large is the Labor Force in Groveland?
There are 452 People in the Labor Forcein in Groveland.
What is the Percentage of People in the Labor Force in Groveland?
59.2% of People are in the Labor Force in Groveland.
What is the Unemployment Rate in Groveland?
Unemployment Rate in Groveland is 4.0%.