Heyburn, ID Map & Demographics
Heyburn Map
Heyburn Overview
$25,545
PER CAPITA INCOME
$64,145
AVG FAMILY INCOME
$61,443
AVG HOUSEHOLD INCOME
44.0%
WAGE / INCOME GAP [ % ]
56.0¢/ $1
WAGE / INCOME GAP [ $ ]
$3,828
FAMILY INCOME DEFICIT
0.35
INEQUALITY / GINI INDEX
3,640
TOTAL POPULATION
1,807
MALE POPULATION
1,833
FEMALE POPULATION
98.58
MALES / 100 FEMALES
101.44
FEMALES / 100 MALES
26.5
MEDIAN AGE
3.4
AVG FAMILY SIZE
2.8
AVG HOUSEHOLD SIZE
1,863
LABOR FORCE [ PEOPLE ]
75.3%
PERCENT IN LABOR FORCE
4.1%
UNEMPLOYMENT RATE
Heyburn Zip Codes
Heyburn Area Codes
Income in Heyburn
Income Overview in Heyburn
Per Capita Income in Heyburn is $25,545, while median incomes of families and households are $64,145 and $61,443 respectively.
| Characteristic | Number | Measure |
| Per Capita Income | 3,640 | $25,545 |
| Median Family Income | 920 | $64,145 |
| Mean Family Income | 920 | $76,553 |
| Median Household Income | 1,285 | $61,443 |
| Mean Household Income | 1,285 | $70,753 |
| Income Deficit | 920 | $3,828 |
| Wage / Income Gap (%) | 3,640 | 44.02% |
| Wage / Income Gap ($) | 3,640 | 55.98¢ per $1 |
| Gini / Inequality Index | 3,640 | 0.35 |
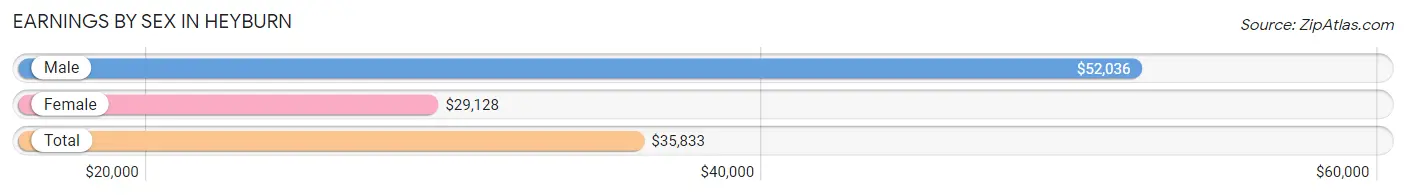
Earnings by Sex in Heyburn
Average Earnings in Heyburn are $35,833, $52,036 for men and $29,128 for women, a difference of 44.0%.
| Sex | Number | Average Earnings |
| Male | 993 (54.6%) | $52,036 |
| Female | 827 (45.4%) | $29,128 |
| Total | 1,820 (100.0%) | $35,833 |
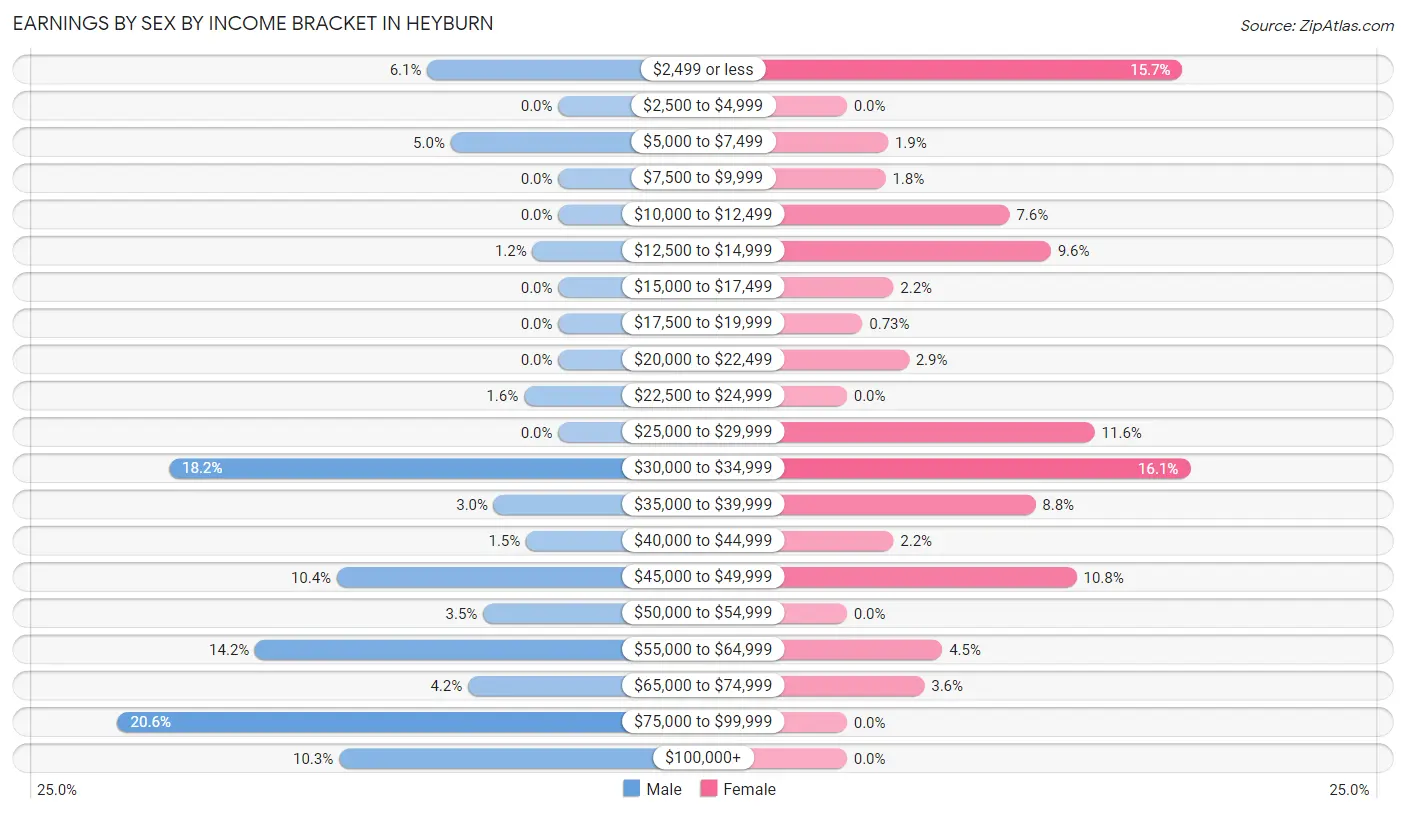
Earnings by Sex by Income Bracket in Heyburn
The most common earnings brackets in Heyburn are $75,000 to $99,999 for men (205 | 20.6%) and $30,000 to $34,999 for women (133 | 16.1%).
| Income | Male | Female |
| $2,499 or less | 61 (6.1%) | 130 (15.7%) |
| $2,500 to $4,999 | 0 (0.0%) | 0 (0.0%) |
| $5,000 to $7,499 | 50 (5.0%) | 16 (1.9%) |
| $7,500 to $9,999 | 0 (0.0%) | 15 (1.8%) |
| $10,000 to $12,499 | 0 (0.0%) | 63 (7.6%) |
| $12,500 to $14,999 | 12 (1.2%) | 79 (9.6%) |
| $15,000 to $17,499 | 0 (0.0%) | 18 (2.2%) |
| $17,500 to $19,999 | 0 (0.0%) | 6 (0.7%) |
| $20,000 to $22,499 | 0 (0.0%) | 24 (2.9%) |
| $22,500 to $24,999 | 16 (1.6%) | 0 (0.0%) |
| $25,000 to $29,999 | 0 (0.0%) | 96 (11.6%) |
| $30,000 to $34,999 | 181 (18.2%) | 133 (16.1%) |
| $35,000 to $39,999 | 30 (3.0%) | 73 (8.8%) |
| $40,000 to $44,999 | 15 (1.5%) | 18 (2.2%) |
| $45,000 to $49,999 | 103 (10.4%) | 89 (10.8%) |
| $50,000 to $54,999 | 35 (3.5%) | 0 (0.0%) |
| $55,000 to $64,999 | 141 (14.2%) | 37 (4.5%) |
| $65,000 to $74,999 | 42 (4.2%) | 30 (3.6%) |
| $75,000 to $99,999 | 205 (20.6%) | 0 (0.0%) |
| $100,000+ | 102 (10.3%) | 0 (0.0%) |
| Total | 993 (100.0%) | 827 (100.0%) |
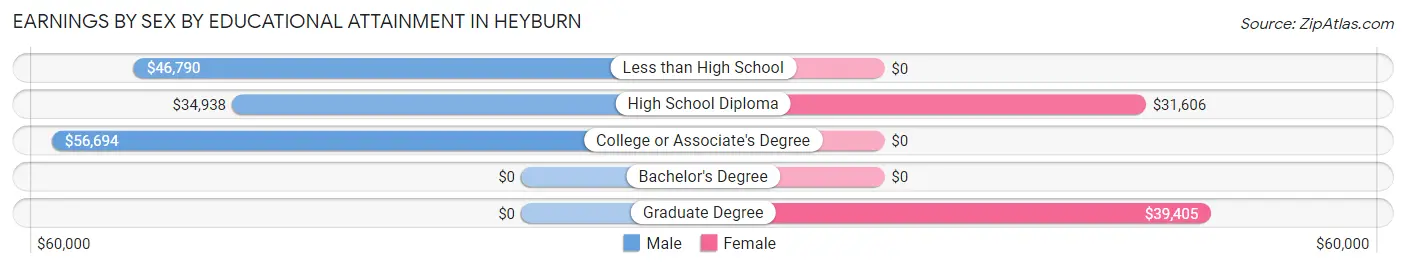
Earnings by Sex by Educational Attainment in Heyburn
Average earnings in Heyburn are $56,022 for men and $30,608 for women, a difference of 45.4%. Men with an educational attainment of college or associate's degree enjoy the highest average annual earnings of $56,694, while those with high school diploma education earn the least with $34,938. Women with an educational attainment of graduate degree earn the most with the average annual earnings of $39,405, while those with high school diploma education have the smallest earnings of $31,606.
| Educational Attainment | Male Income | Female Income |
| Less than High School | $46,790 | $0 |
| High School Diploma | $34,938 | $31,606 |
| College or Associate's Degree | $56,694 | $0 |
| Bachelor's Degree | - | - |
| Graduate Degree | - | - |
| Total | $56,022 | $30,608 |
Family Income in Heyburn
Family Income Brackets in Heyburn
According to the Heyburn family income data, there are 308 families falling into the $50,000 to $74,999 income range, which is the most common income bracket and makes up 33.5% of all families.
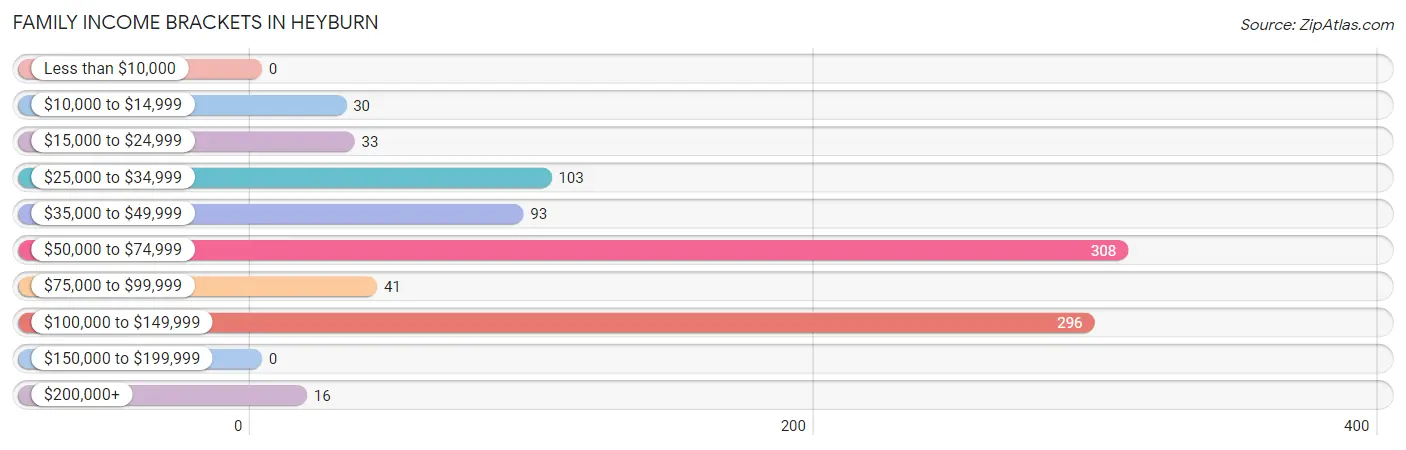
| Income Bracket | # Families | % Families |
| Less than $10,000 | 0 | 0.0% |
| $10,000 to $14,999 | 30 | 3.3% |
| $15,000 to $24,999 | 33 | 3.6% |
| $25,000 to $34,999 | 103 | 11.2% |
| $35,000 to $49,999 | 93 | 10.1% |
| $50,000 to $74,999 | 308 | 33.5% |
| $75,000 to $99,999 | 41 | 4.5% |
| $100,000 to $149,999 | 296 | 32.2% |
| $150,000 to $199,999 | 0 | 0.0% |
| $200,000+ | 16 | 1.7% |
Family Income by Famaliy Size in Heyburn
3-person families (306 | 33.3%) account for the highest median family income in Heyburn with $106,317 per family, while 3-person families (306 | 33.3%) have the highest median income of $35,439 per family member.
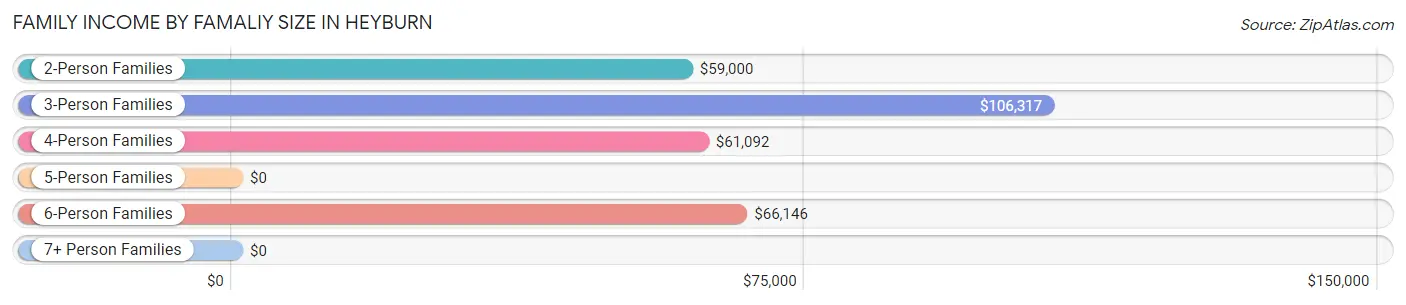
| Income Bracket | # Families | Median Income |
| 2-Person Families | 234 (25.4%) | $59,000 |
| 3-Person Families | 306 (33.3%) | $106,317 |
| 4-Person Families | 195 (21.2%) | $61,092 |
| 5-Person Families | 93 (10.1%) | $0 |
| 6-Person Families | 92 (10.0%) | $66,146 |
| 7+ Person Families | 0 (0.0%) | $0 |
| Total | 920 (100.0%) | $64,145 |
Family Income by Number of Earners in Heyburn
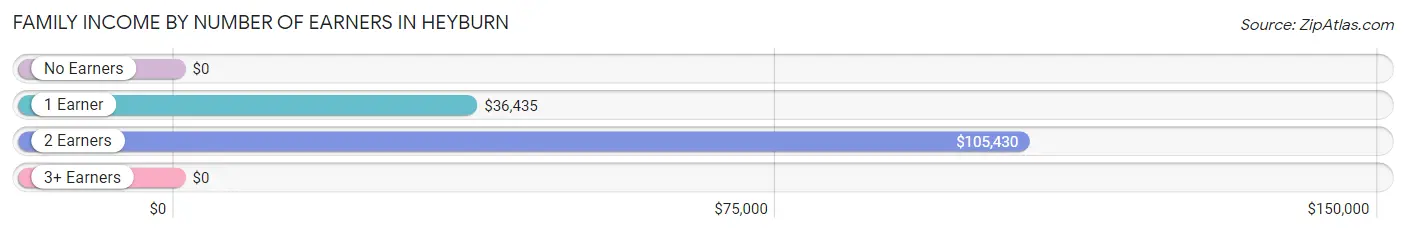
| Number of Earners | # Families | Median Income |
| No Earners | 36 (3.9%) | $0 |
| 1 Earner | 322 (35.0%) | $36,435 |
| 2 Earners | 490 (53.3%) | $105,430 |
| 3+ Earners | 72 (7.8%) | $0 |
| Total | 920 (100.0%) | $64,145 |
Household Income in Heyburn
Household Income Brackets in Heyburn
With 362 households falling in the category, the $100,000 to $149,999 income range is the most frequent in Heyburn, accounting for 28.2% of all households.
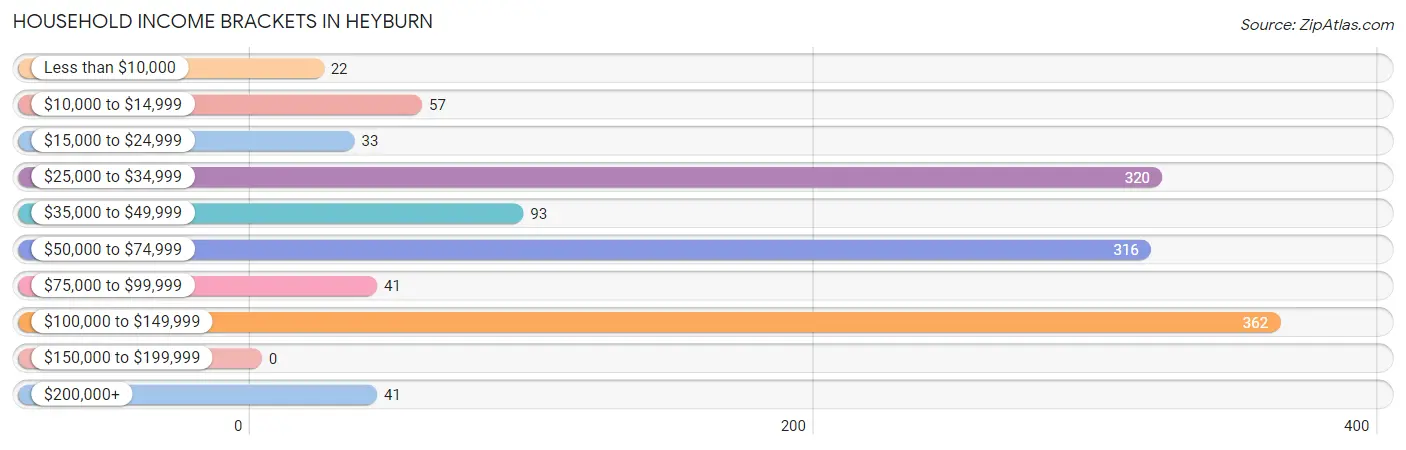
| Income Bracket | # Households | % Households |
| Less than $10,000 | 22 | 1.7% |
| $10,000 to $14,999 | 57 | 4.4% |
| $15,000 to $24,999 | 33 | 2.6% |
| $25,000 to $34,999 | 320 | 24.9% |
| $35,000 to $49,999 | 93 | 7.2% |
| $50,000 to $74,999 | 316 | 24.6% |
| $75,000 to $99,999 | 41 | 3.2% |
| $100,000 to $149,999 | 362 | 28.2% |
| $150,000 to $199,999 | 0 | 0.0% |
| $200,000+ | 41 | 3.2% |
Household Income by Householder Age in Heyburn
The median household income in Heyburn is $61,443, with the highest median household income of $62,408 found in the 25 to 44 years age bracket for the primary householder. A total of 738 households (57.4%) fall into this category. Meanwhile, the 15 to 24 years age bracket for the primary householder has the lowest median household income of $0, with 48 households (3.7%) in this group.
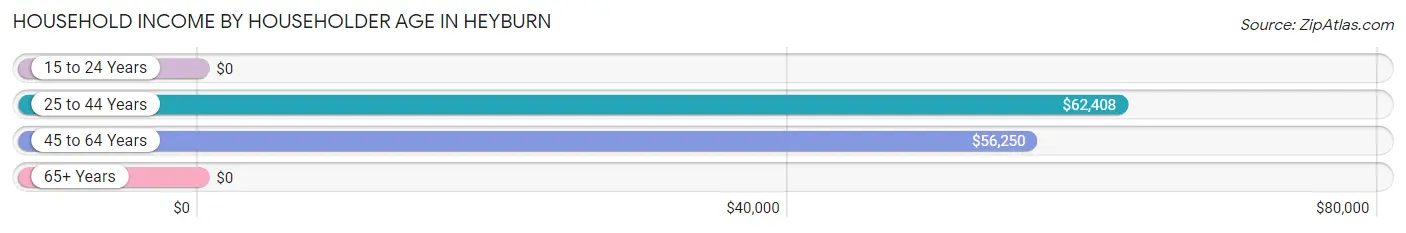
| Income Bracket | # Households | Median Income |
| 15 to 24 Years | 48 (3.7%) | $0 |
| 25 to 44 Years | 738 (57.4%) | $62,408 |
| 45 to 64 Years | 385 (30.0%) | $56,250 |
| 65+ Years | 114 (8.9%) | $0 |
| Total | 1,285 (100.0%) | $61,443 |
Poverty in Heyburn
Income Below Poverty by Sex and Age in Heyburn
With 16.3% poverty level for males and 16.3% for females among the residents of Heyburn, 16 and 17 year old males and 12 to 14 year old females are the most vulnerable to poverty, with 53 males (66.2%) and 45 females (60.0%) in their respective age groups living below the poverty level.
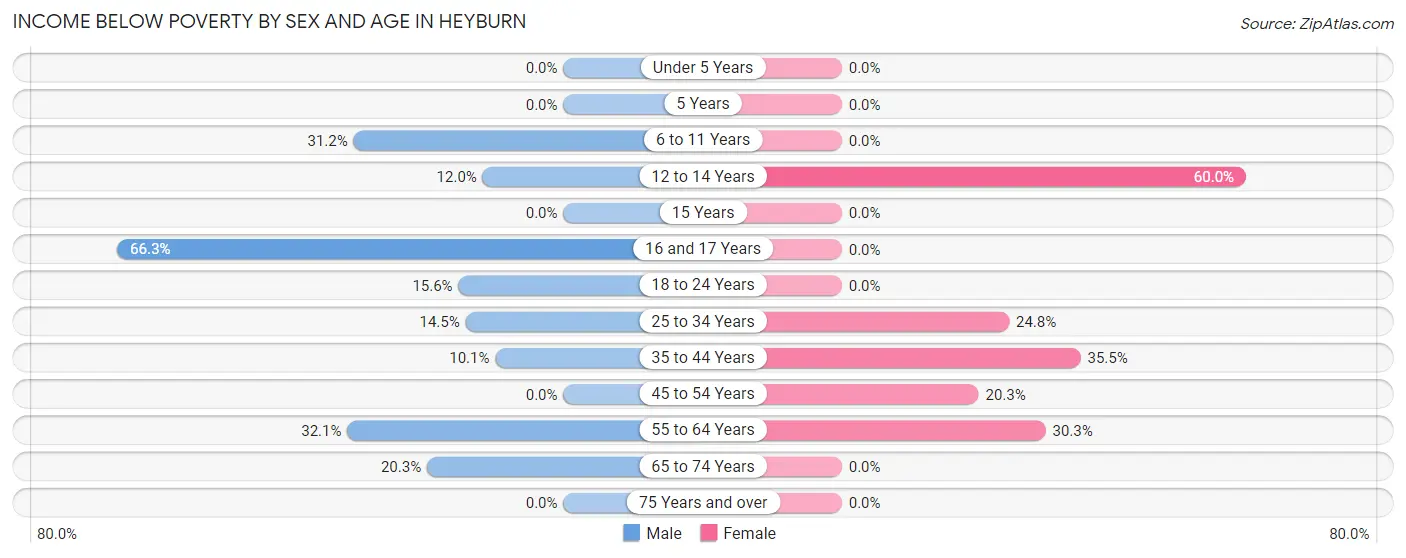
| Age Bracket | Male | Female |
| Under 5 Years | 0 (0.0%) | 0 (0.0%) |
| 5 Years | 0 (0.0%) | 0 (0.0%) |
| 6 to 11 Years | 62 (31.2%) | 0 (0.0%) |
| 12 to 14 Years | 23 (12.0%) | 45 (60.0%) |
| 15 Years | 0 (0.0%) | 0 (0.0%) |
| 16 and 17 Years | 53 (66.2%) | 0 (0.0%) |
| 18 to 24 Years | 12 (15.6%) | 0 (0.0%) |
| 25 to 34 Years | 67 (14.5%) | 75 (24.8%) |
| 35 to 44 Years | 28 (10.1%) | 117 (35.4%) |
| 45 to 54 Years | 0 (0.0%) | 26 (20.3%) |
| 55 to 64 Years | 34 (32.1%) | 36 (30.2%) |
| 65 to 74 Years | 16 (20.3%) | 0 (0.0%) |
| 75 Years and over | 0 (0.0%) | 0 (0.0%) |
| Total | 295 (16.3%) | 299 (16.3%) |
Income Above Poverty by Sex and Age in Heyburn
According to the poverty statistics in Heyburn, males aged under 5 years and females aged under 5 years are the age groups that are most secure financially, with 100.0% of males and 100.0% of females in these age groups living above the poverty line.
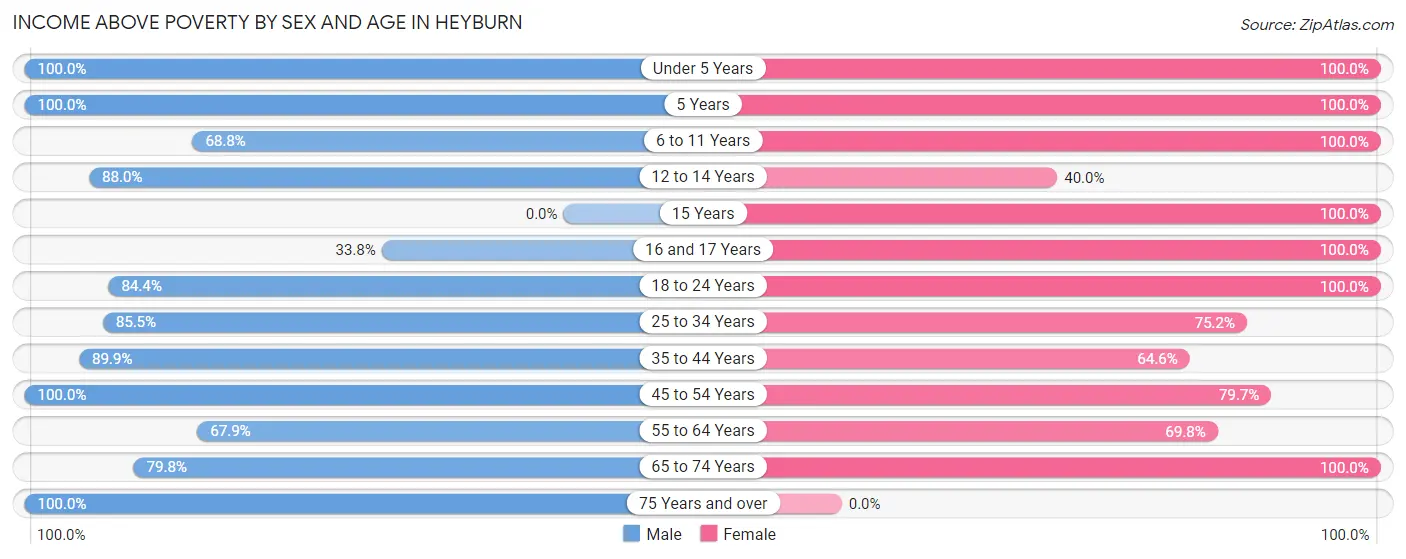
| Age Bracket | Male | Female |
| Under 5 Years | 74 (100.0%) | 254 (100.0%) |
| 5 Years | 31 (100.0%) | 117 (100.0%) |
| 6 to 11 Years | 137 (68.8%) | 215 (100.0%) |
| 12 to 14 Years | 169 (88.0%) | 30 (40.0%) |
| 15 Years | 0 (0.0%) | 9 (100.0%) |
| 16 and 17 Years | 27 (33.8%) | 119 (100.0%) |
| 18 to 24 Years | 65 (84.4%) | 67 (100.0%) |
| 25 to 34 Years | 394 (85.5%) | 227 (75.2%) |
| 35 to 44 Years | 249 (89.9%) | 213 (64.5%) |
| 45 to 54 Years | 182 (100.0%) | 102 (79.7%) |
| 55 to 64 Years | 72 (67.9%) | 83 (69.8%) |
| 65 to 74 Years | 63 (79.7%) | 98 (100.0%) |
| 75 Years and over | 49 (100.0%) | 0 (0.0%) |
| Total | 1,512 (83.7%) | 1,534 (83.7%) |
Income Below Poverty Among Married-Couple Families in Heyburn
The poverty statistics for married-couple families in Heyburn show that 17.9% or 130 of the total 725 families live below the poverty line. Families with 3 or 4 children have the highest poverty rate of 36.2%, comprising of 67 families. On the other hand, families with 1 or 2 children have the lowest poverty rate of 9.1%, which includes 33 families.
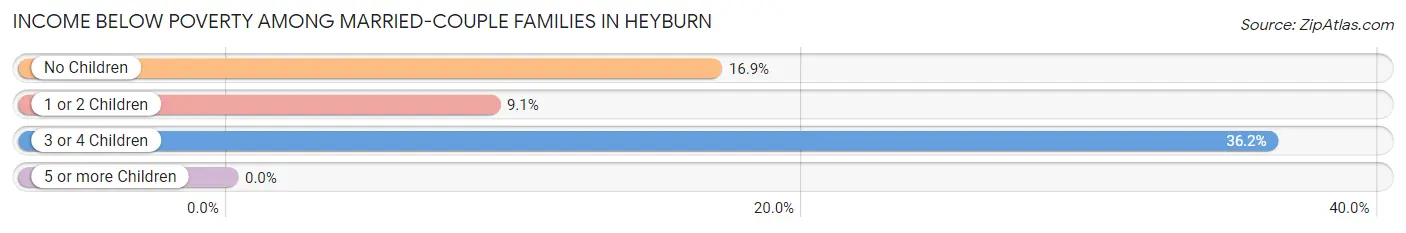
| Children | Above Poverty | Below Poverty |
| No Children | 148 (83.2%) | 30 (16.9%) |
| 1 or 2 Children | 329 (90.9%) | 33 (9.1%) |
| 3 or 4 Children | 118 (63.8%) | 67 (36.2%) |
| 5 or more Children | 0 (0.0%) | 0 (0.0%) |
| Total | 595 (82.1%) | 130 (17.9%) |
Income Below Poverty Among Single-Parent Households in Heyburn
| Children | Single Father | Single Mother |
| No Children | 0 (0.0%) | 0 (0.0%) |
| 1 or 2 Children | 0 (0.0%) | 0 (0.0%) |
| 3 or 4 Children | 0 (0.0%) | 0 (0.0%) |
| 5 or more Children | 0 (0.0%) | 0 (0.0%) |
| Total | 0 (0.0%) | 0 (0.0%) |
Income Below Poverty Among Married-Couple vs Single-Parent Households in Heyburn
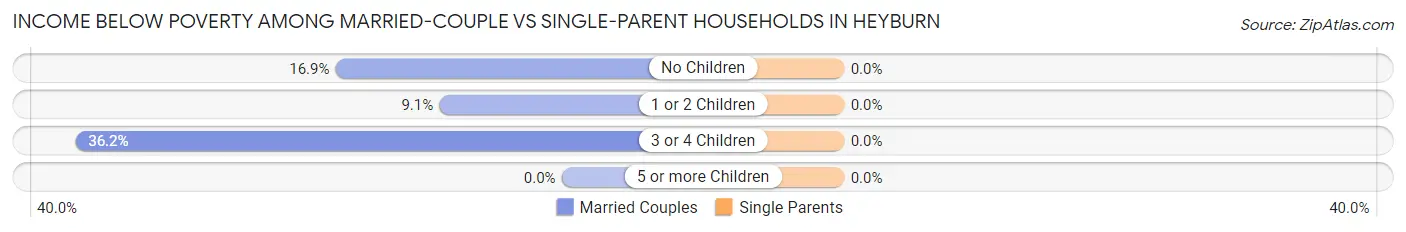
| Children | Married-Couple Families | Single-Parent Households |
| No Children | 30 (16.9%) | 0 (0.0%) |
| 1 or 2 Children | 33 (9.1%) | 0 (0.0%) |
| 3 or 4 Children | 67 (36.2%) | 0 (0.0%) |
| 5 or more Children | 0 (0.0%) | 0 (0.0%) |
| Total | 130 (17.9%) | 0 (0.0%) |
Race in Heyburn
The most populous races in Heyburn are White / Caucasian (3,138 | 86.2%), Hispanic or Latino (915 | 25.1%), and Some other Race (321 | 8.8%).
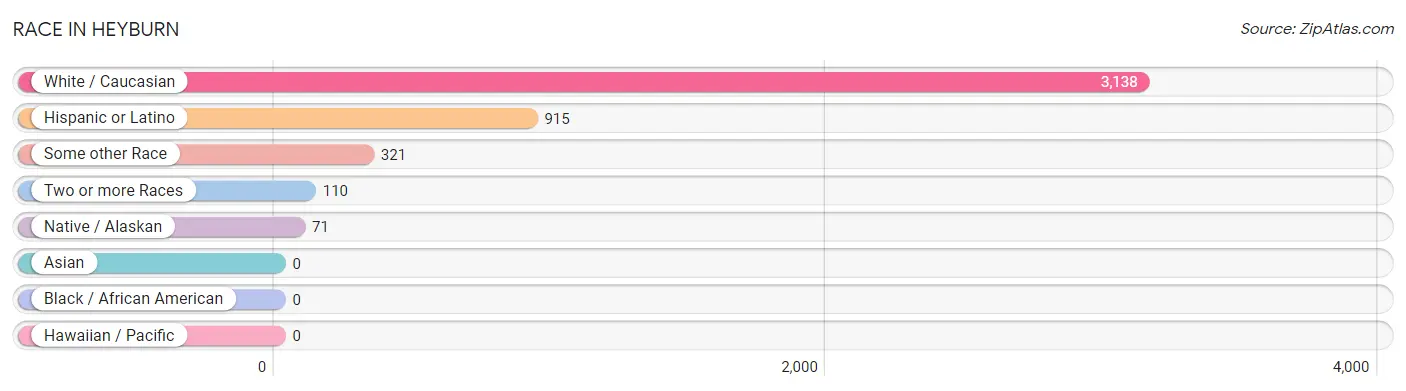
| Race | # Population | % Population |
| Asian | 0 | 0.0% |
| Black / African American | 0 | 0.0% |
| Hawaiian / Pacific | 0 | 0.0% |
| Hispanic or Latino | 915 | 25.1% |
| Native / Alaskan | 71 | 1.9% |
| White / Caucasian | 3,138 | 86.2% |
| Two or more Races | 110 | 3.0% |
| Some other Race | 321 | 8.8% |
| Total | 3,640 | 100.0% |
Ancestry in Heyburn
The most populous ancestries reported in Heyburn are Mexican (879 | 24.1%), American (815 | 22.4%), English (378 | 10.4%), German (368 | 10.1%), and Irish (196 | 5.4%), together accounting for 72.4% of all Heyburn residents.
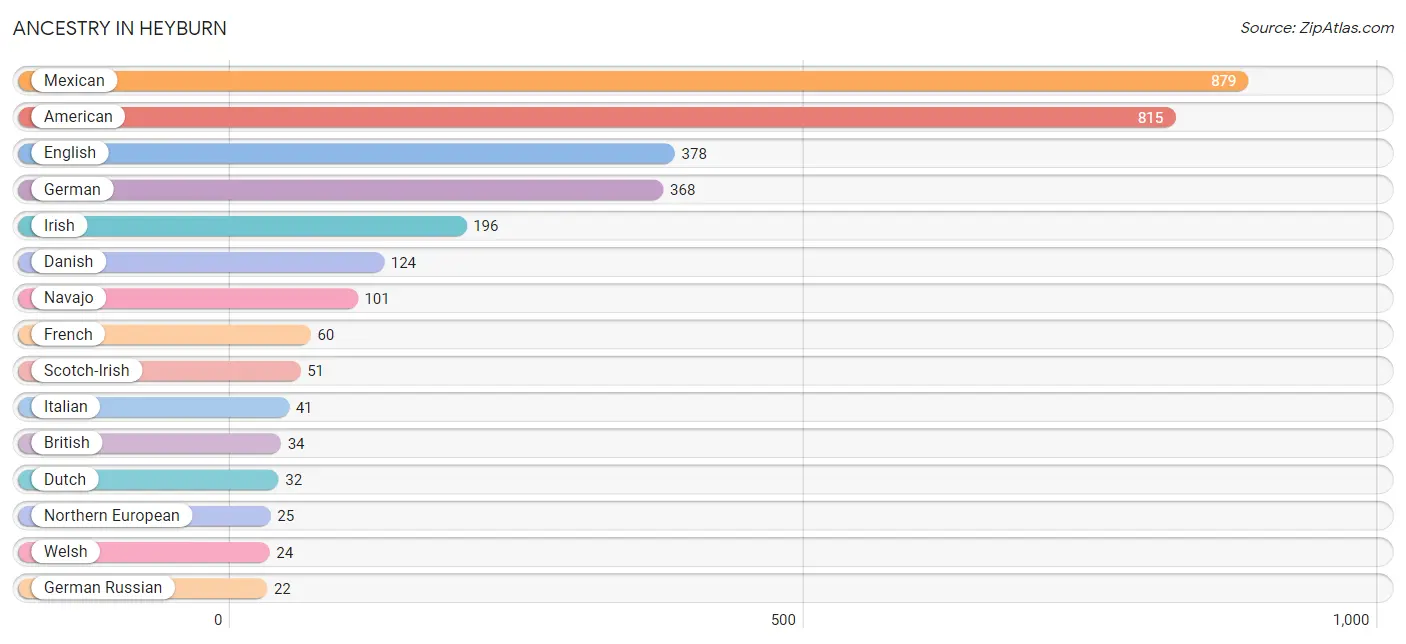
| Ancestry | # Population | % Population |
| American | 815 | 22.4% |
| British | 34 | 0.9% |
| Danish | 124 | 3.4% |
| Dutch | 32 | 0.9% |
| English | 378 | 10.4% |
| European | 16 | 0.4% |
| French | 60 | 1.7% |
| German | 368 | 10.1% |
| German Russian | 22 | 0.6% |
| Greek | 17 | 0.5% |
| Irish | 196 | 5.4% |
| Italian | 41 | 1.1% |
| Mexican | 879 | 24.1% |
| Navajo | 101 | 2.8% |
| Northern European | 25 | 0.7% |
| Scotch-Irish | 51 | 1.4% |
| Scottish | 9 | 0.3% |
| Shoshone | 16 | 0.4% |
| Swiss | 10 | 0.3% |
| Welsh | 24 | 0.7% | View All 20 Rows |
Immigrants in Heyburn
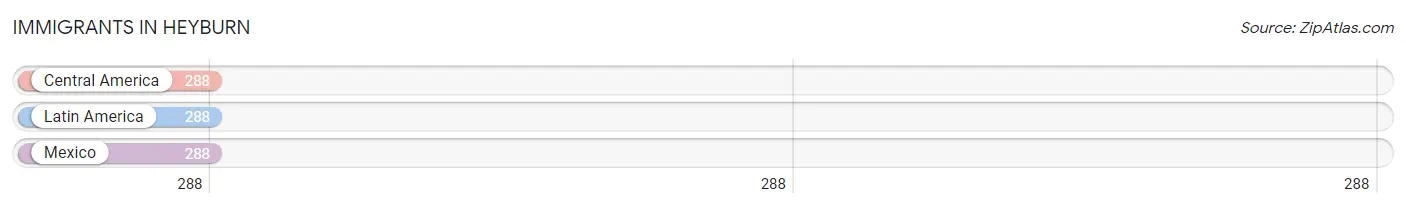
The most numerous immigrant groups reported in Heyburn came from Central America (288 | 7.9%), Latin America (288 | 7.9%), and Mexico (288 | 7.9%), together accounting for 23.7% of all Heyburn residents.
| Immigration Origin | # Population | % Population |
| Central America | 288 | 7.9% |
| Latin America | 288 | 7.9% |
| Mexico | 288 | 7.9% | View All 3 Rows |
Sex and Age in Heyburn
Sex and Age in Heyburn
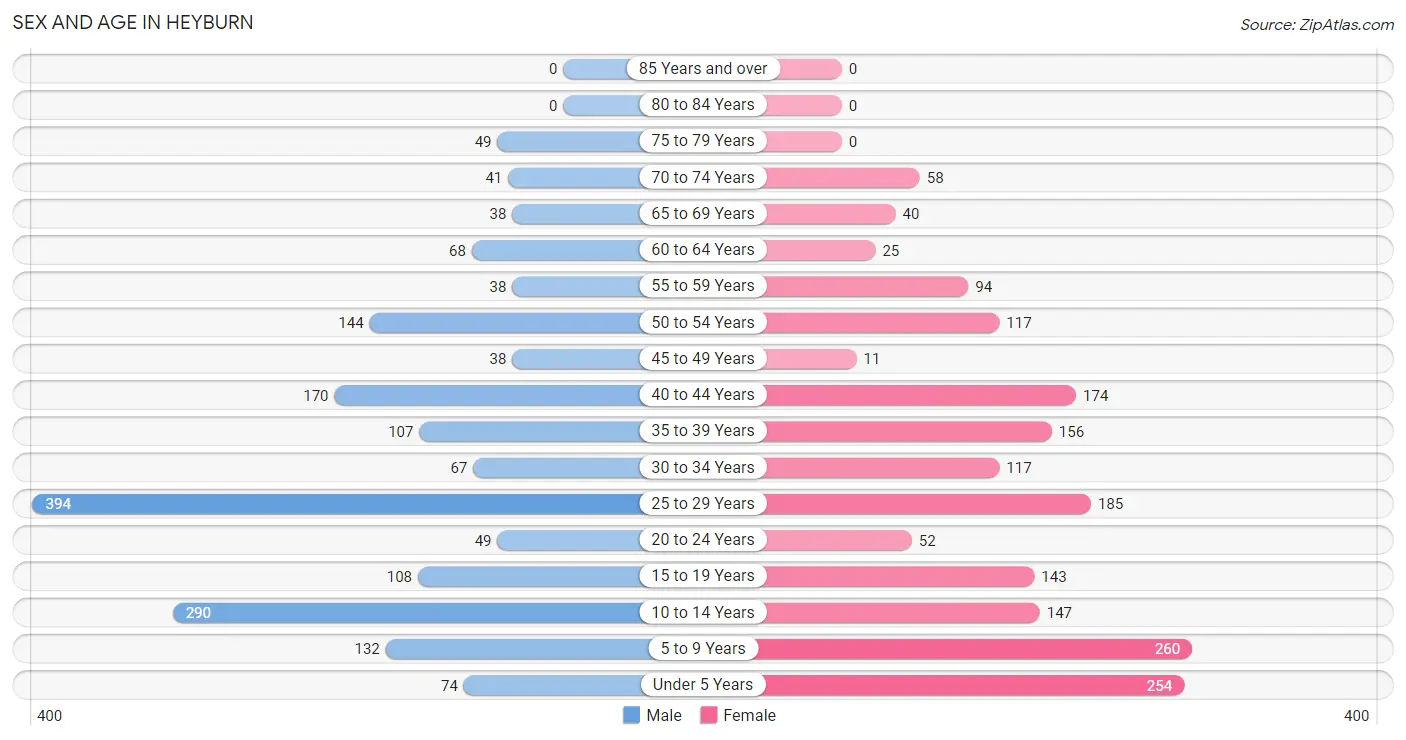
The most populous age groups in Heyburn are 25 to 29 Years (394 | 21.8%) for men and 5 to 9 Years (260 | 14.2%) for women.
| Age Bracket | Male | Female |
| Under 5 Years | 74 (4.1%) | 254 (13.9%) |
| 5 to 9 Years | 132 (7.3%) | 260 (14.2%) |
| 10 to 14 Years | 290 (16.1%) | 147 (8.0%) |
| 15 to 19 Years | 108 (6.0%) | 143 (7.8%) |
| 20 to 24 Years | 49 (2.7%) | 52 (2.8%) |
| 25 to 29 Years | 394 (21.8%) | 185 (10.1%) |
| 30 to 34 Years | 67 (3.7%) | 117 (6.4%) |
| 35 to 39 Years | 107 (5.9%) | 156 (8.5%) |
| 40 to 44 Years | 170 (9.4%) | 174 (9.5%) |
| 45 to 49 Years | 38 (2.1%) | 11 (0.6%) |
| 50 to 54 Years | 144 (8.0%) | 117 (6.4%) |
| 55 to 59 Years | 38 (2.1%) | 94 (5.1%) |
| 60 to 64 Years | 68 (3.8%) | 25 (1.4%) |
| 65 to 69 Years | 38 (2.1%) | 40 (2.2%) |
| 70 to 74 Years | 41 (2.3%) | 58 (3.2%) |
| 75 to 79 Years | 49 (2.7%) | 0 (0.0%) |
| 80 to 84 Years | 0 (0.0%) | 0 (0.0%) |
| 85 Years and over | 0 (0.0%) | 0 (0.0%) |
| Total | 1,807 (100.0%) | 1,833 (100.0%) |
Families and Households in Heyburn
Median Family Size in Heyburn
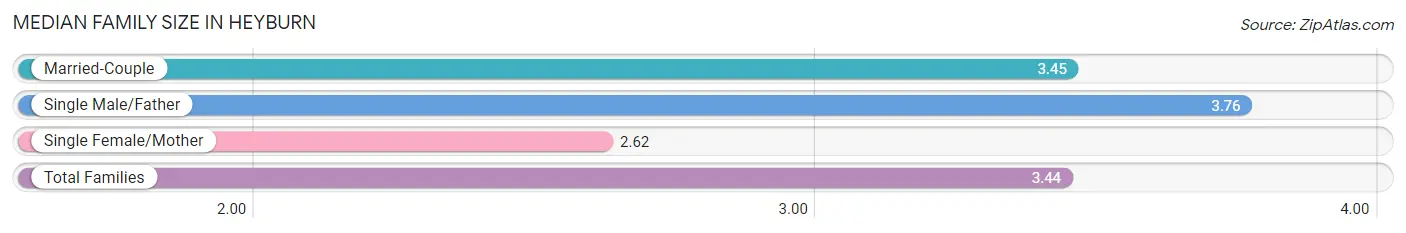
The median family size in Heyburn is 3.44 persons per family, with single male/father families (134 | 14.6%) accounting for the largest median family size of 3.76 persons per family. On the other hand, single female/mother families (61 | 6.6%) represent the smallest median family size with 2.62 persons per family.
| Family Type | # Families | Family Size |
| Married-Couple | 725 (78.8%) | 3.45 |
| Single Male/Father | 134 (14.6%) | 3.76 |
| Single Female/Mother | 61 (6.6%) | 2.62 |
| Total Families | 920 (100.0%) | 3.44 |
Median Household Size in Heyburn
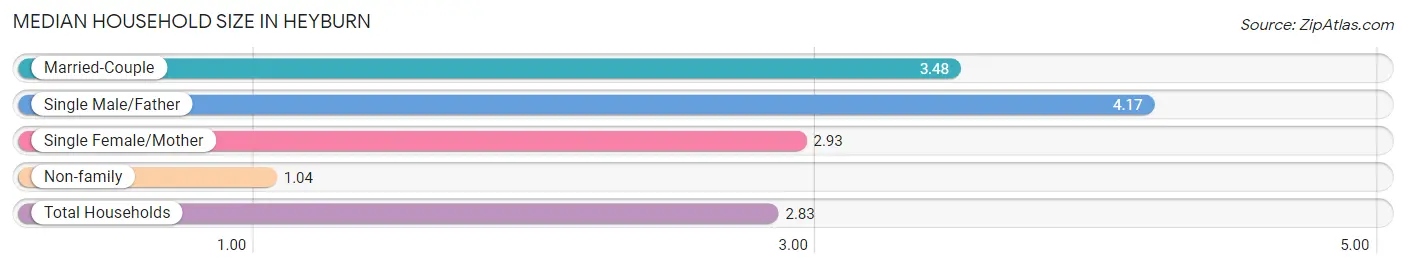
The median household size in Heyburn is 2.83 persons per household, with single male/father households (134 | 10.4%) accounting for the largest median household size of 4.17 persons per household. non-family households (365 | 28.4%) represent the smallest median household size with 1.04 persons per household.
| Household Type | # Households | Household Size |
| Married-Couple | 725 (56.4%) | 3.48 |
| Single Male/Father | 134 (10.4%) | 4.17 |
| Single Female/Mother | 61 (4.8%) | 2.93 |
| Non-family | 365 (28.4%) | 1.04 |
| Total Households | 1,285 (100.0%) | 2.83 |
Household Size by Marriage Status in Heyburn
Out of a total of 1,285 households in Heyburn, 920 (71.6%) are family households, while 365 (28.4%) are nonfamily households. The most numerous type of family households are 3-person households, comprising 296, and the most common type of nonfamily households are 1-person households, comprising 353.
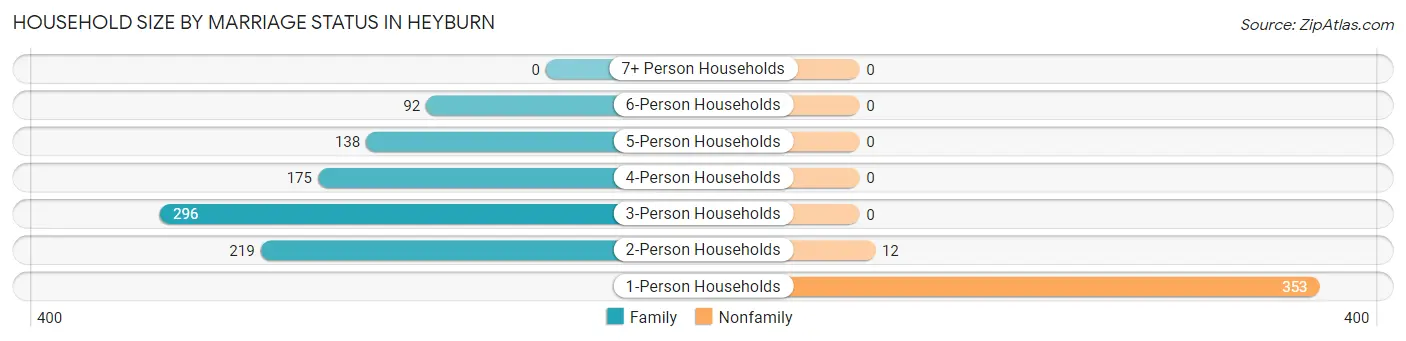
| Household Size | Family Households | Nonfamily Households |
| 1-Person Households | - | 353 (27.5%) |
| 2-Person Households | 219 (17.0%) | 12 (0.9%) |
| 3-Person Households | 296 (23.0%) | 0 (0.0%) |
| 4-Person Households | 175 (13.6%) | 0 (0.0%) |
| 5-Person Households | 138 (10.7%) | 0 (0.0%) |
| 6-Person Households | 92 (7.2%) | 0 (0.0%) |
| 7+ Person Households | 0 (0.0%) | 0 (0.0%) |
| Total | 920 (71.6%) | 365 (28.4%) |
Female Fertility in Heyburn
Fertility by Age in Heyburn
Average fertility rate in Heyburn is 213.0 births per 1,000 women. Women in the age bracket of 20 to 34 years have the highest fertility rate with 523.0 births per 1,000 women. Women in the age bracket of 20 to 34 years acount for 100.0% of all women with births.
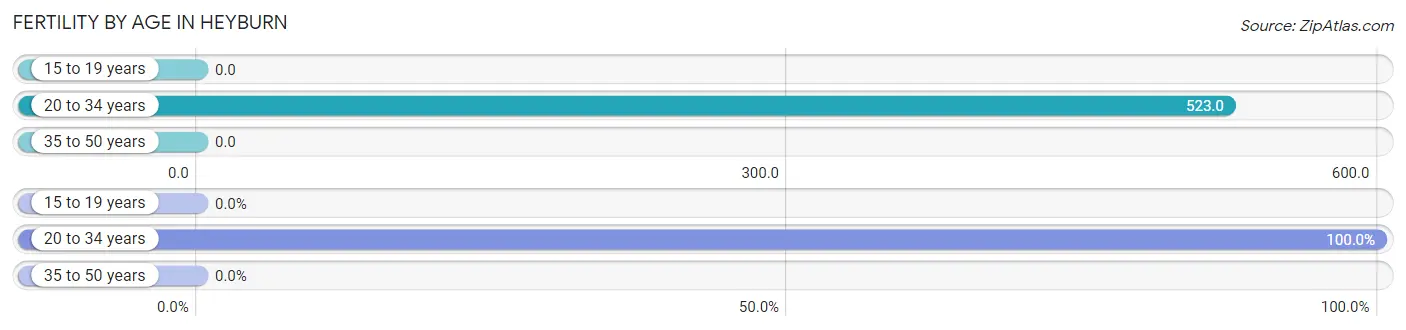
| Age Bracket | Women with Births | Births / 1,000 Women |
| 15 to 19 years | 0 (0.0%) | 0.0 |
| 20 to 34 years | 185 (100.0%) | 523.0 |
| 35 to 50 years | 0 (0.0%) | 0.0 |
| Total | 185 (100.0%) | 213.0 |
Fertility by Age by Marriage Status in Heyburn
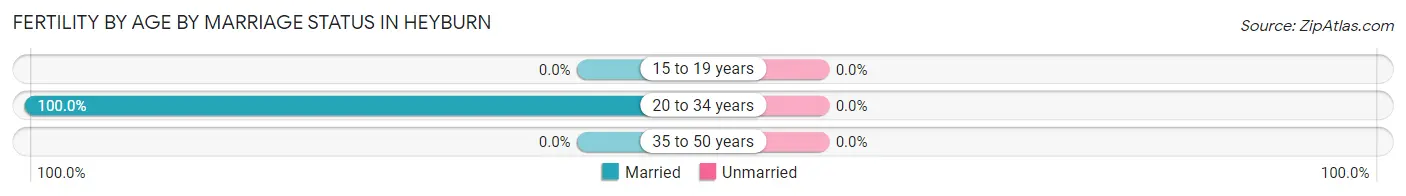
| Age Bracket | Married | Unmarried |
| 15 to 19 years | 0 (0.0%) | 0 (0.0%) |
| 20 to 34 years | 185 (100.0%) | 0 (0.0%) |
| 35 to 50 years | 0 (0.0%) | 0 (0.0%) |
| Total | 185 (100.0%) | 0 (0.0%) |
Fertility by Education in Heyburn
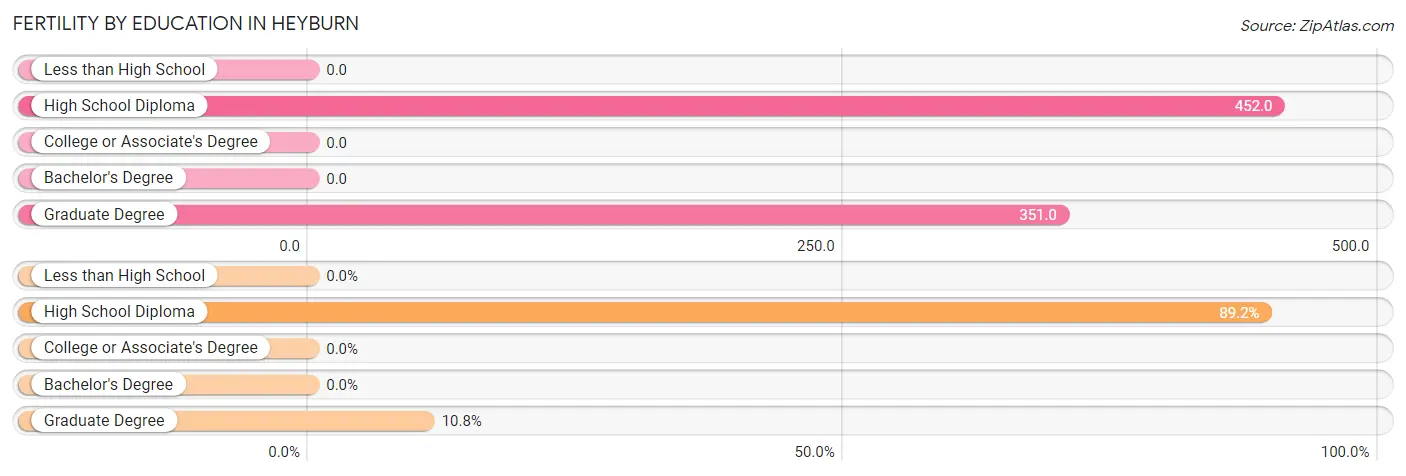
| Educational Attainment | Women with Births | Births / 1,000 Women |
| Less than High School | 0 (0.0%) | 0.0 |
| High School Diploma | 165 (89.2%) | 452.0 |
| College or Associate's Degree | 0 (0.0%) | 0.0 |
| Bachelor's Degree | 0 (0.0%) | 0.0 |
| Graduate Degree | 20 (10.8%) | 351.0 |
| Total | 185 (100.0%) | 213.0 |
Fertility by Education by Marriage Status in Heyburn
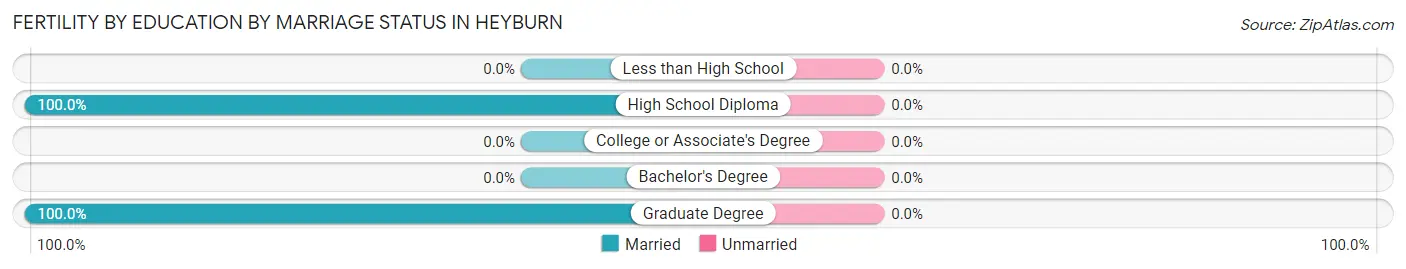
| Educational Attainment | Married | Unmarried |
| Less than High School | 0 (0.0%) | 0 (0.0%) |
| High School Diploma | 165 (100.0%) | 0 (0.0%) |
| College or Associate's Degree | 0 (0.0%) | 0 (0.0%) |
| Bachelor's Degree | 0 (0.0%) | 0 (0.0%) |
| Graduate Degree | 20 (100.0%) | 0 (0.0%) |
| Total | 185 (100.0%) | 0 (0.0%) |
Employment Characteristics in Heyburn
Employment by Class of Employer in Heyburn
Among the 1,785 employed individuals in Heyburn, private company employees (1,388 | 77.8%), local government employees (224 | 12.6%), and self-employed (not incorporated) (105 | 5.9%) make up the most common classes of employment.
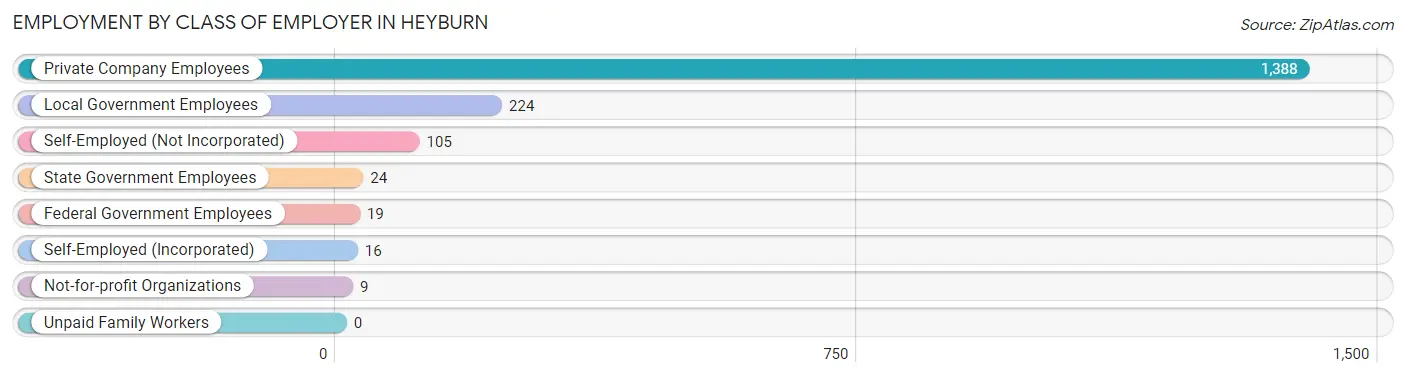
| Employer Class | # Employees | % Employees |
| Private Company Employees | 1,388 | 77.8% |
| Self-Employed (Incorporated) | 16 | 0.9% |
| Self-Employed (Not Incorporated) | 105 | 5.9% |
| Not-for-profit Organizations | 9 | 0.5% |
| Local Government Employees | 224 | 12.6% |
| State Government Employees | 24 | 1.3% |
| Federal Government Employees | 19 | 1.1% |
| Unpaid Family Workers | 0 | 0.0% |
| Total | 1,785 | 100.0% |
Employment Status by Age in Heyburn
According to the labor force statistics for Heyburn, out of the total population over 16 years of age (2,474), 75.3% or 1,863 individuals are in the labor force, with 4.1% or 76 of them unemployed. The age group with the highest labor force participation rate is 25 to 29 years, with 95.5% or 553 individuals in the labor force. Within the labor force, the 16 to 19 years age range has the highest percentage of unemployed individuals, with 33.5% or 62 of them being unemployed.
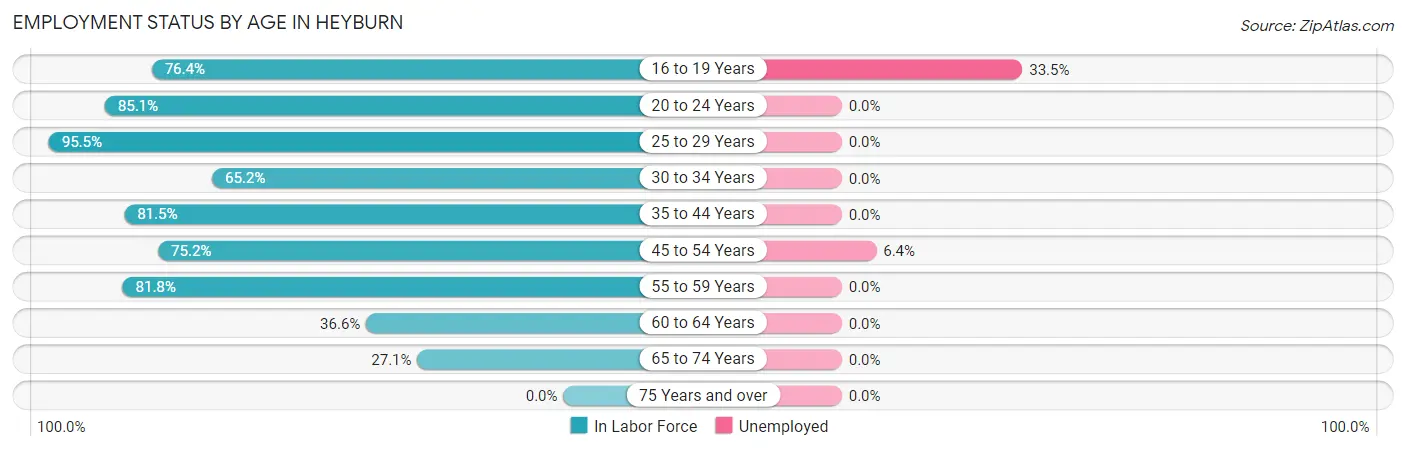
| Age Bracket | In Labor Force | Unemployed |
| 16 to 19 Years | 185 (76.4%) | 62 (33.5%) |
| 20 to 24 Years | 86 (85.1%) | 0 (0.0%) |
| 25 to 29 Years | 553 (95.5%) | 0 (0.0%) |
| 30 to 34 Years | 120 (65.2%) | 0 (0.0%) |
| 35 to 44 Years | 495 (81.5%) | 0 (0.0%) |
| 45 to 54 Years | 233 (75.2%) | 15 (6.4%) |
| 55 to 59 Years | 108 (81.8%) | 0 (0.0%) |
| 60 to 64 Years | 34 (36.6%) | 0 (0.0%) |
| 65 to 74 Years | 48 (27.1%) | 0 (0.0%) |
| 75 Years and over | 0 (0.0%) | 0 (0.0%) |
| Total | 1,863 (75.3%) | 76 (4.1%) |
Employment Status by Educational Attainment in Heyburn
According to labor force statistics for Heyburn, 81.0% of individuals (1,543) out of the total population between 25 and 64 years of age (1,905) are in the labor force, with 1.0% or 15 of them being unemployed. The group with the highest labor force participation rate are those with the educational attainment of bachelor's degree or higher, with 94.0% or 328 individuals in the labor force. Within the labor force, individuals with less than high school education have the highest percentage of unemployment, with 6.0% or 15 of them being unemployed.
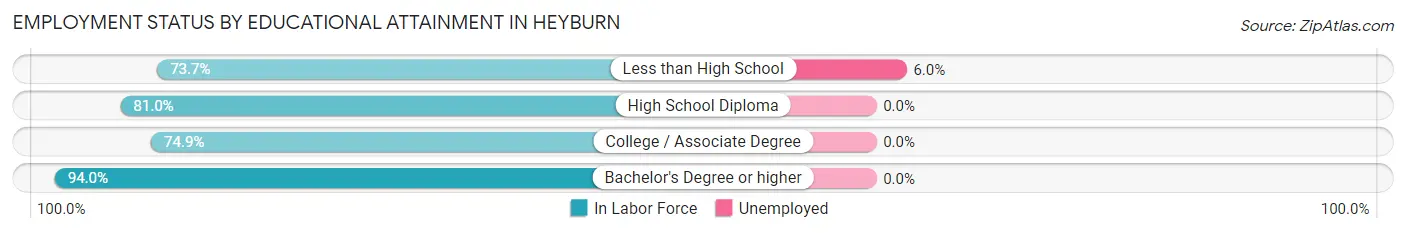
| Educational Attainment | In Labor Force | Unemployed |
| Less than High School | 250 (73.7%) | 20 (6.0%) |
| High School Diploma | 715 (81.0%) | 0 (0.0%) |
| College / Associate Degree | 250 (74.9%) | 0 (0.0%) |
| Bachelor's Degree or higher | 328 (94.0%) | 0 (0.0%) |
| Total | 1,543 (81.0%) | 19 (1.0%) |
Employment Occupations by Sex in Heyburn
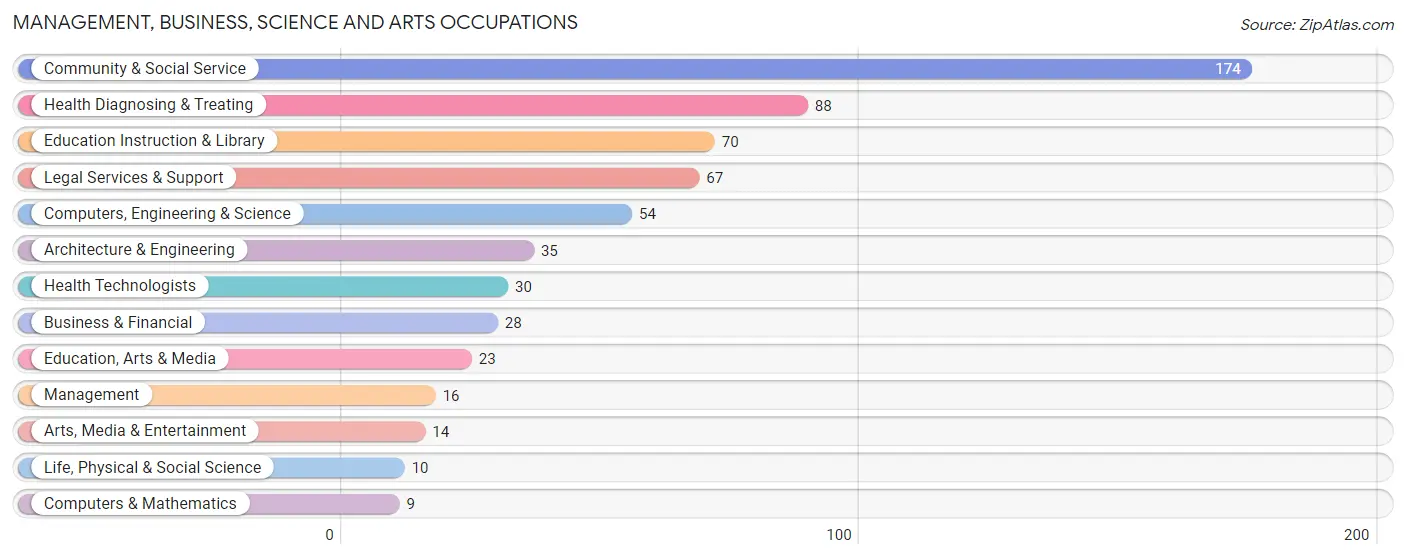
Management, Business, Science and Arts Occupations
The most common Management, Business, Science and Arts occupations in Heyburn are Community & Social Service (174 | 9.8%), Health Diagnosing & Treating (88 | 4.9%), Education Instruction & Library (70 | 3.9%), Legal Services & Support (67 | 3.7%), and Computers, Engineering & Science (54 | 3.0%).
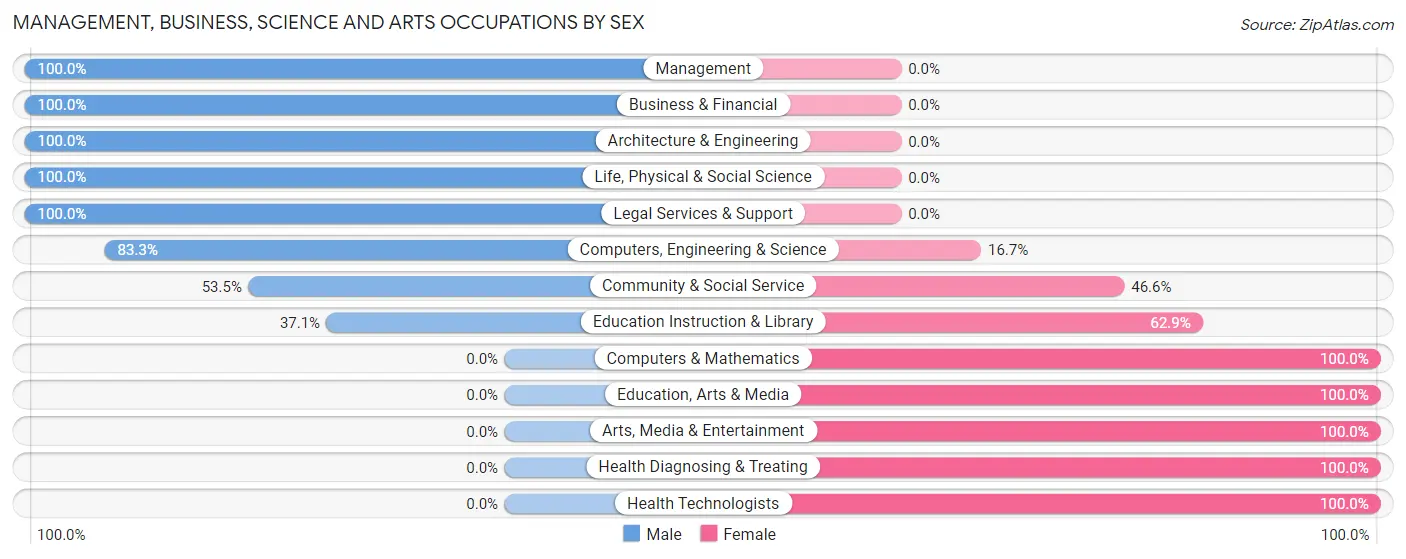
Management, Business, Science and Arts Occupations by Sex
Within the Management, Business, Science and Arts occupations in Heyburn, the most male-oriented occupations are Management (100.0%), Business & Financial (100.0%), and Architecture & Engineering (100.0%), while the most female-oriented occupations are Computers & Mathematics (100.0%), Education, Arts & Media (100.0%), and Arts, Media & Entertainment (100.0%).
| Occupation | Male | Female |
| Management | 16 (100.0%) | 0 (0.0%) |
| Business & Financial | 28 (100.0%) | 0 (0.0%) |
| Computers, Engineering & Science | 45 (83.3%) | 9 (16.7%) |
| Computers & Mathematics | 0 (0.0%) | 9 (100.0%) |
| Architecture & Engineering | 35 (100.0%) | 0 (0.0%) |
| Life, Physical & Social Science | 10 (100.0%) | 0 (0.0%) |
| Community & Social Service | 93 (53.4%) | 81 (46.6%) |
| Education, Arts & Media | 0 (0.0%) | 23 (100.0%) |
| Legal Services & Support | 67 (100.0%) | 0 (0.0%) |
| Education Instruction & Library | 26 (37.1%) | 44 (62.9%) |
| Arts, Media & Entertainment | 0 (0.0%) | 14 (100.0%) |
| Health Diagnosing & Treating | 0 (0.0%) | 88 (100.0%) |
| Health Technologists | 0 (0.0%) | 30 (100.0%) |
| Total (Category) | 182 (50.6%) | 178 (49.4%) |
| Total (Overall) | 978 (54.8%) | 807 (45.2%) |
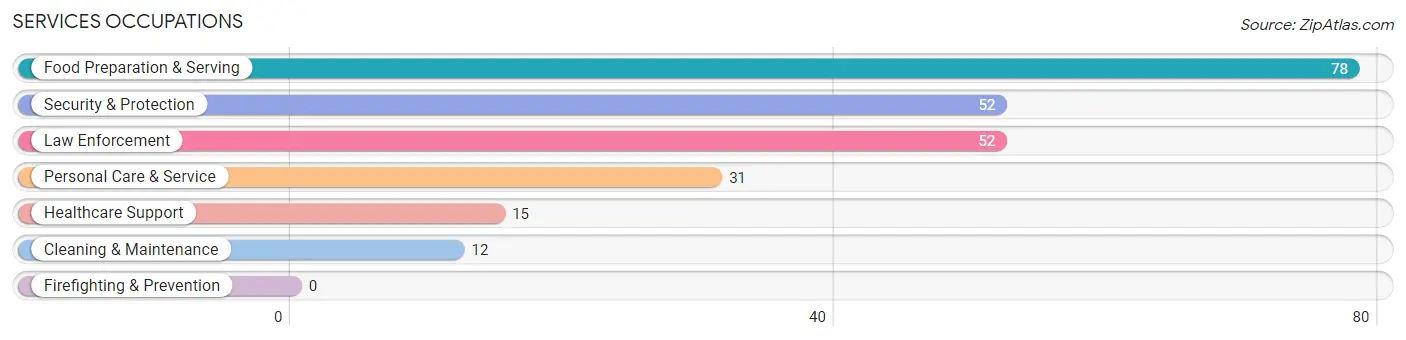
Services Occupations
The most common Services occupations in Heyburn are Food Preparation & Serving (78 | 4.4%), Security & Protection (52 | 2.9%), Law Enforcement (52 | 2.9%), Personal Care & Service (31 | 1.7%), and Healthcare Support (15 | 0.8%).
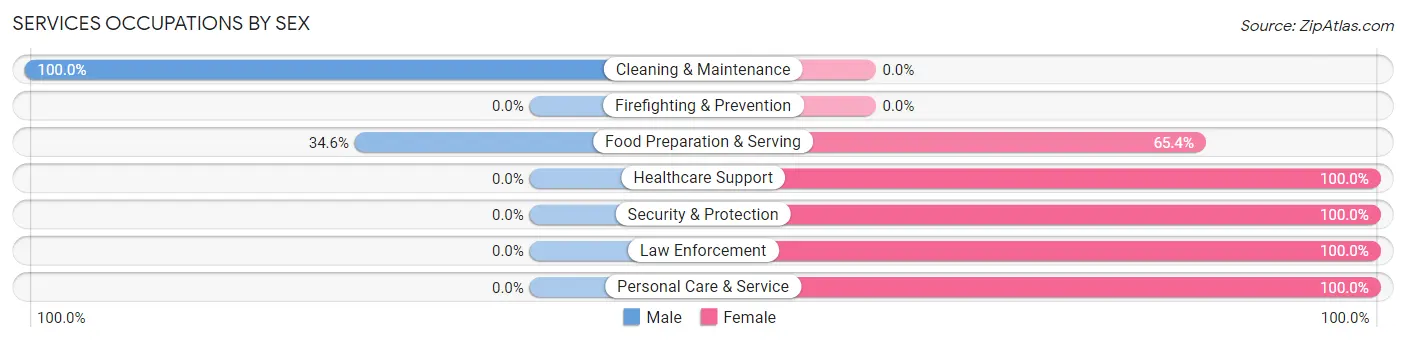
Services Occupations by Sex
Within the Services occupations in Heyburn, the most male-oriented occupations are Cleaning & Maintenance (100.0%), and Food Preparation & Serving (34.6%), while the most female-oriented occupations are Healthcare Support (100.0%), Security & Protection (100.0%), and Law Enforcement (100.0%).
| Occupation | Male | Female |
| Healthcare Support | 0 (0.0%) | 15 (100.0%) |
| Security & Protection | 0 (0.0%) | 52 (100.0%) |
| Firefighting & Prevention | 0 (0.0%) | 0 (0.0%) |
| Law Enforcement | 0 (0.0%) | 52 (100.0%) |
| Food Preparation & Serving | 27 (34.6%) | 51 (65.4%) |
| Cleaning & Maintenance | 12 (100.0%) | 0 (0.0%) |
| Personal Care & Service | 0 (0.0%) | 31 (100.0%) |
| Total (Category) | 39 (20.7%) | 149 (79.3%) |
| Total (Overall) | 978 (54.8%) | 807 (45.2%) |
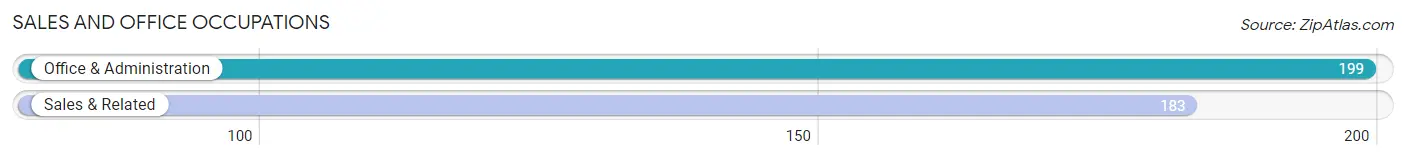
Sales and Office Occupations
The most common Sales and Office occupations in Heyburn are Office & Administration (199 | 11.2%), and Sales & Related (183 | 10.2%).
Sales and Office Occupations by Sex
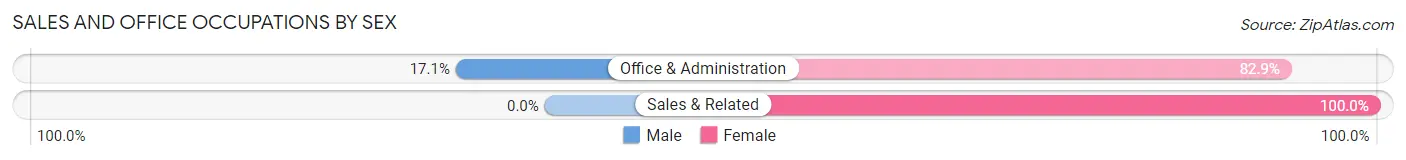
| Occupation | Male | Female |
| Sales & Related | 0 (0.0%) | 183 (100.0%) |
| Office & Administration | 34 (17.1%) | 165 (82.9%) |
| Total (Category) | 34 (8.9%) | 348 (91.1%) |
| Total (Overall) | 978 (54.8%) | 807 (45.2%) |
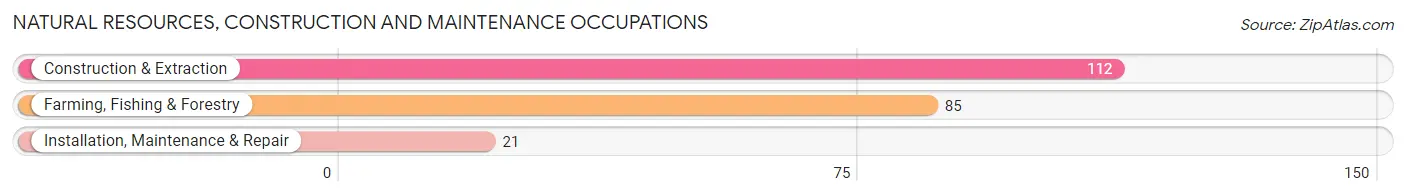
Natural Resources, Construction and Maintenance Occupations
The most common Natural Resources, Construction and Maintenance occupations in Heyburn are Construction & Extraction (112 | 6.3%), Farming, Fishing & Forestry (85 | 4.8%), and Installation, Maintenance & Repair (21 | 1.2%).
Natural Resources, Construction and Maintenance Occupations by Sex
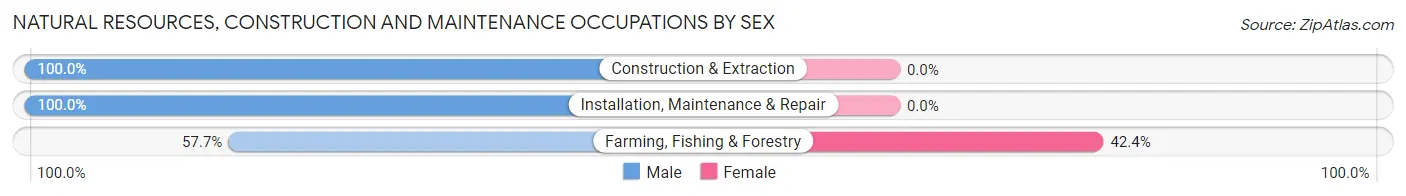
| Occupation | Male | Female |
| Farming, Fishing & Forestry | 49 (57.7%) | 36 (42.3%) |
| Construction & Extraction | 112 (100.0%) | 0 (0.0%) |
| Installation, Maintenance & Repair | 21 (100.0%) | 0 (0.0%) |
| Total (Category) | 182 (83.5%) | 36 (16.5%) |
| Total (Overall) | 978 (54.8%) | 807 (45.2%) |
Production, Transportation and Moving Occupations
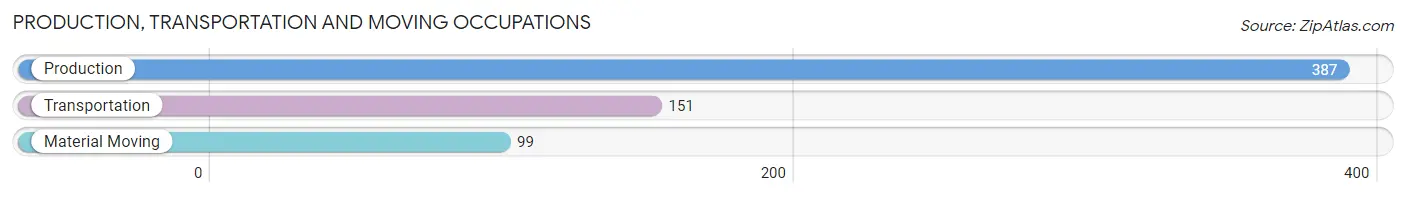
The most common Production, Transportation and Moving occupations in Heyburn are Production (387 | 21.7%), Transportation (151 | 8.5%), and Material Moving (99 | 5.6%).
Production, Transportation and Moving Occupations by Sex
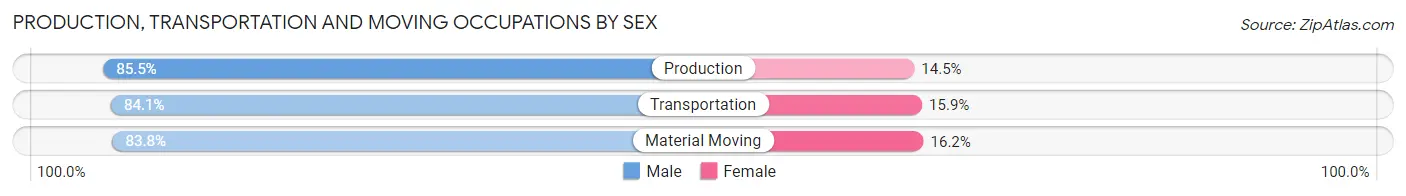
| Occupation | Male | Female |
| Production | 331 (85.5%) | 56 (14.5%) |
| Transportation | 127 (84.1%) | 24 (15.9%) |
| Material Moving | 83 (83.8%) | 16 (16.2%) |
| Total (Category) | 541 (84.9%) | 96 (15.1%) |
| Total (Overall) | 978 (54.8%) | 807 (45.2%) |
Employment Industries by Sex in Heyburn
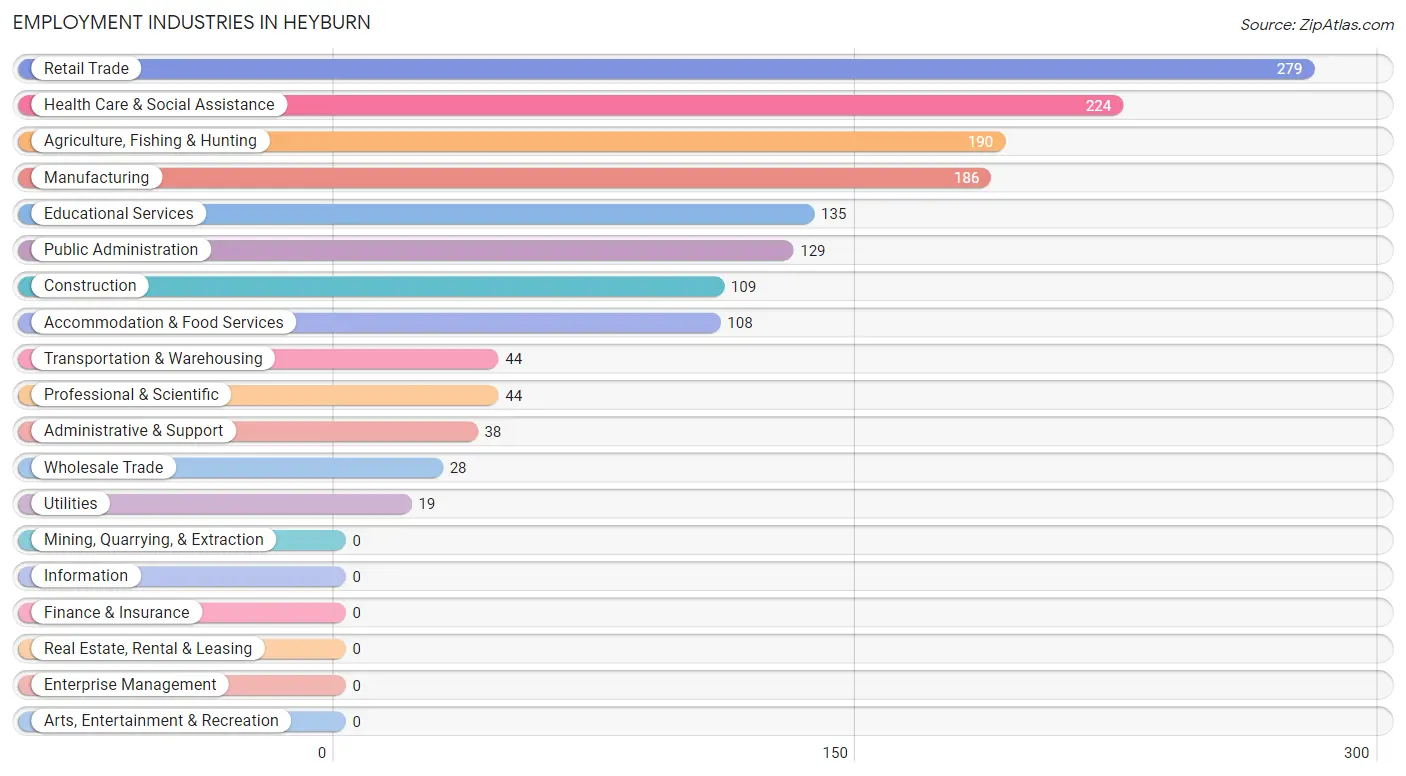
Employment Industries in Heyburn
The major employment industries in Heyburn include Retail Trade (279 | 15.6%), Health Care & Social Assistance (224 | 12.6%), Agriculture, Fishing & Hunting (190 | 10.6%), Manufacturing (186 | 10.4%), and Educational Services (135 | 7.6%).
Employment Industries by Sex in Heyburn
The Heyburn industries that see more men than women are Construction (100.0%), Wholesale Trade (100.0%), and Utilities (100.0%), whereas the industries that tend to have a higher number of women are Health Care & Social Assistance (93.8%), Educational Services (80.7%), and Accommodation & Food Services (75.0%).
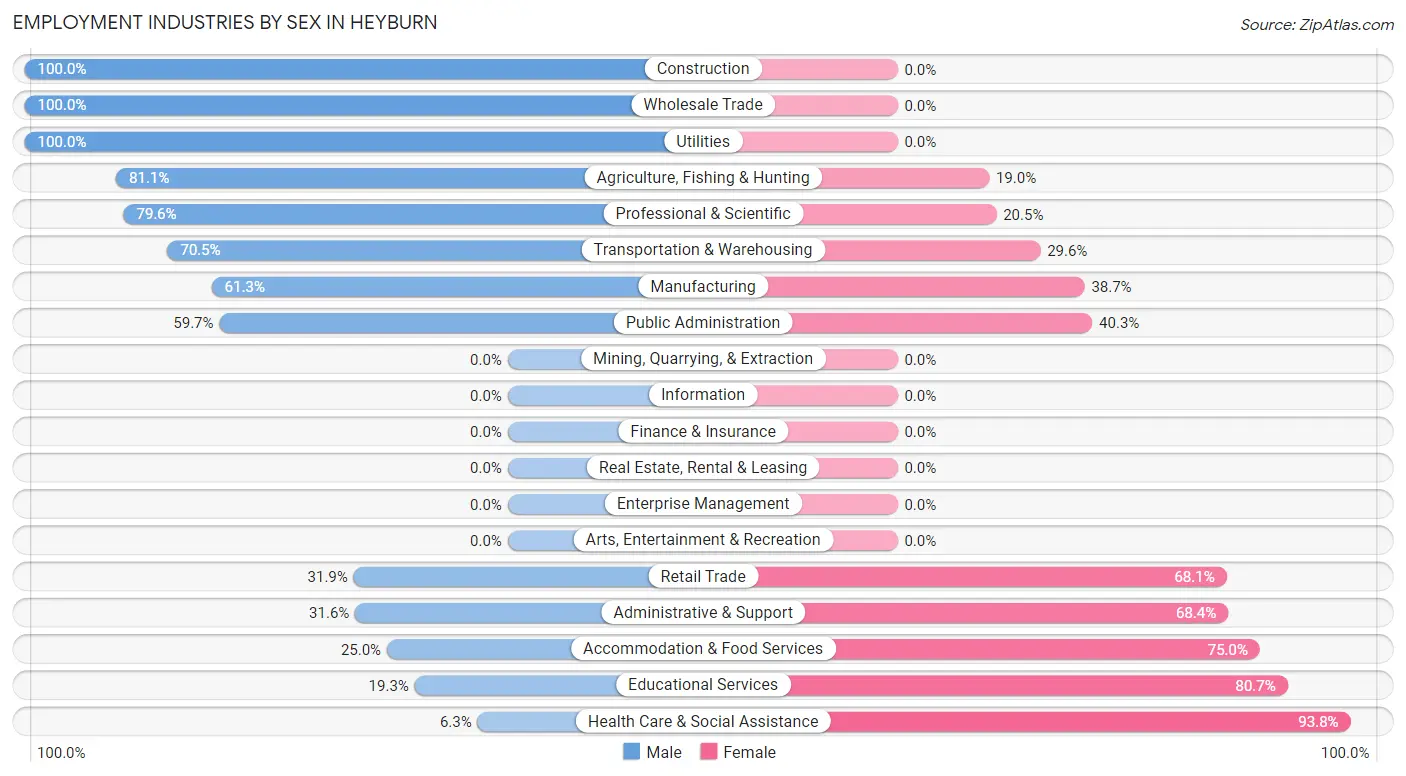
| Industry | Male | Female |
| Agriculture, Fishing & Hunting | 154 (81.0%) | 36 (19.0%) |
| Mining, Quarrying, & Extraction | 0 (0.0%) | 0 (0.0%) |
| Construction | 109 (100.0%) | 0 (0.0%) |
| Manufacturing | 114 (61.3%) | 72 (38.7%) |
| Wholesale Trade | 28 (100.0%) | 0 (0.0%) |
| Retail Trade | 89 (31.9%) | 190 (68.1%) |
| Transportation & Warehousing | 31 (70.5%) | 13 (29.5%) |
| Utilities | 19 (100.0%) | 0 (0.0%) |
| Information | 0 (0.0%) | 0 (0.0%) |
| Finance & Insurance | 0 (0.0%) | 0 (0.0%) |
| Real Estate, Rental & Leasing | 0 (0.0%) | 0 (0.0%) |
| Professional & Scientific | 35 (79.5%) | 9 (20.4%) |
| Enterprise Management | 0 (0.0%) | 0 (0.0%) |
| Administrative & Support | 12 (31.6%) | 26 (68.4%) |
| Educational Services | 26 (19.3%) | 109 (80.7%) |
| Health Care & Social Assistance | 14 (6.2%) | 210 (93.8%) |
| Arts, Entertainment & Recreation | 0 (0.0%) | 0 (0.0%) |
| Accommodation & Food Services | 27 (25.0%) | 81 (75.0%) |
| Public Administration | 77 (59.7%) | 52 (40.3%) |
| Total | 978 (54.8%) | 807 (45.2%) |
Education in Heyburn
School Enrollment in Heyburn
The most common levels of schooling among the 1,154 students in Heyburn are middle school (399 | 34.6%), elementary school (235 | 20.4%), and high school (223 | 19.3%).
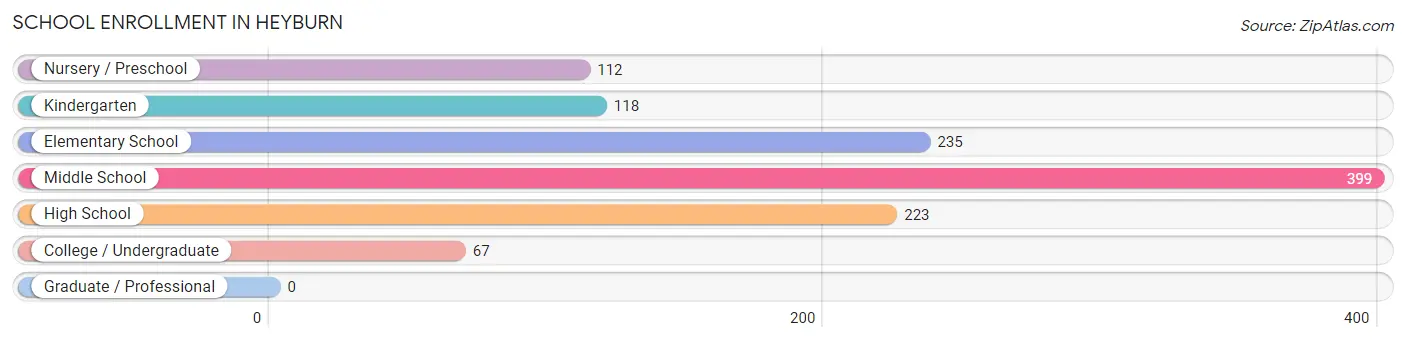
| School Level | # Students | % Students |
| Nursery / Preschool | 112 | 9.7% |
| Kindergarten | 118 | 10.2% |
| Elementary School | 235 | 20.4% |
| Middle School | 399 | 34.6% |
| High School | 223 | 19.3% |
| College / Undergraduate | 67 | 5.8% |
| Graduate / Professional | 0 | 0.0% |
| Total | 1,154 | 100.0% |
School Enrollment by Age by Funding Source in Heyburn
Out of a total of 1,154 students who are enrolled in schools in Heyburn, 77 (6.7%) attend a private institution, while the remaining 1,077 (93.3%) are enrolled in public schools. The age group of 35 years and over has the highest likelihood of being enrolled in private schools, with 24 (100.0% in the age bracket) enrolled. Conversely, the age group of 10 to 14 year olds has the lowest likelihood of being enrolled in a private school, with 437 (100.0% in the age bracket) attending a public institution.
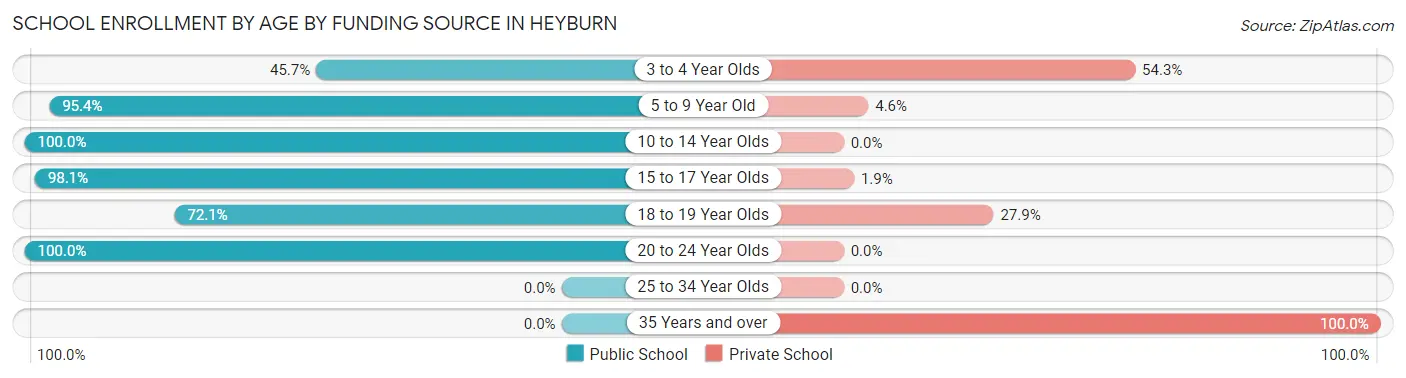
| Age Bracket | Public School | Private School |
| 3 to 4 Year Olds | 16 (45.7%) | 19 (54.3%) |
| 5 to 9 Year Old | 374 (95.4%) | 18 (4.6%) |
| 10 to 14 Year Olds | 437 (100.0%) | 0 (0.0%) |
| 15 to 17 Year Olds | 204 (98.1%) | 4 (1.9%) |
| 18 to 19 Year Olds | 31 (72.1%) | 12 (27.9%) |
| 20 to 24 Year Olds | 15 (100.0%) | 0 (0.0%) |
| 25 to 34 Year Olds | 0 (0.0%) | 0 (0.0%) |
| 35 Years and over | 0 (0.0%) | 24 (100.0%) |
| Total | 1,077 (93.3%) | 77 (6.7%) |
Educational Attainment by Field of Study in Heyburn
Education (109 | 22.4%), social sciences (93 | 19.1%), arts & humanities (79 | 16.2%), business (46 | 9.5%), and engineering (35 | 7.2%) are the most common fields of study among 487 individuals in Heyburn who have obtained a bachelor's degree or higher.
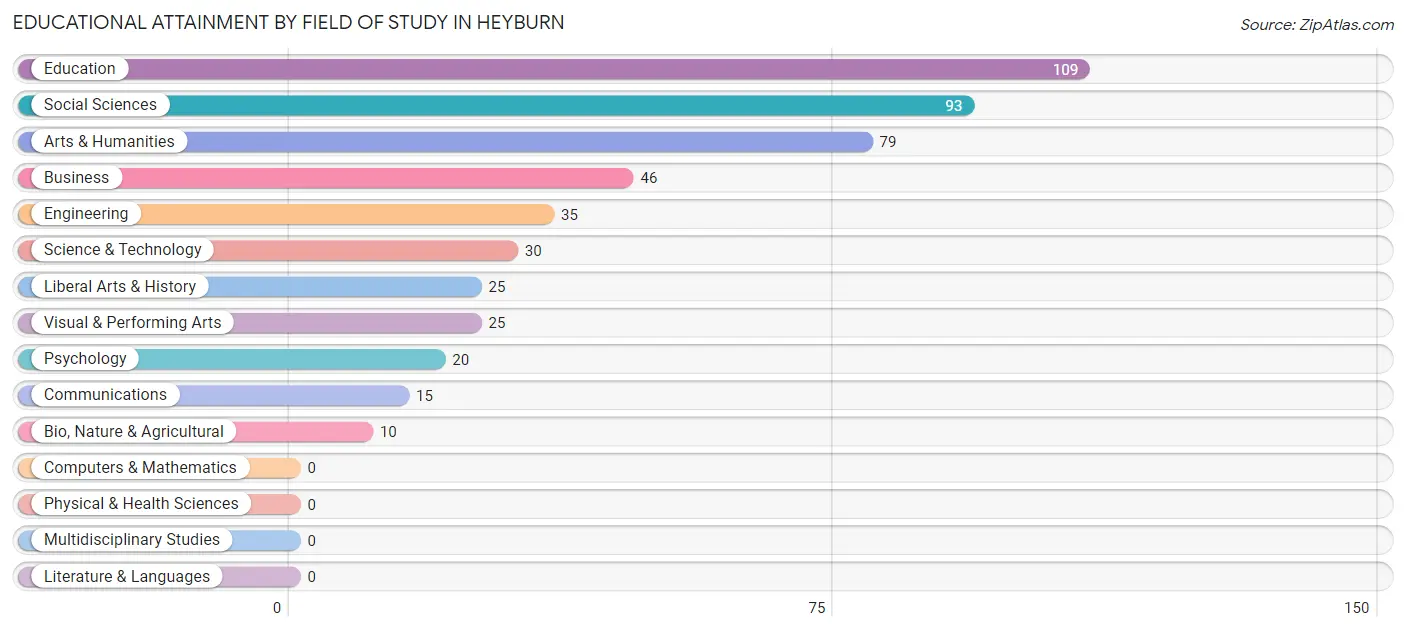
| Field of Study | # Graduates | % Graduates |
| Computers & Mathematics | 0 | 0.0% |
| Bio, Nature & Agricultural | 10 | 2.1% |
| Physical & Health Sciences | 0 | 0.0% |
| Psychology | 20 | 4.1% |
| Social Sciences | 93 | 19.1% |
| Engineering | 35 | 7.2% |
| Multidisciplinary Studies | 0 | 0.0% |
| Science & Technology | 30 | 6.2% |
| Business | 46 | 9.5% |
| Education | 109 | 22.4% |
| Literature & Languages | 0 | 0.0% |
| Liberal Arts & History | 25 | 5.1% |
| Visual & Performing Arts | 25 | 5.1% |
| Communications | 15 | 3.1% |
| Arts & Humanities | 79 | 16.2% |
| Total | 487 | 100.0% |
Transportation & Commute in Heyburn
Vehicle Availability by Sex in Heyburn
The most prevalent vehicle ownership categories in Heyburn are males with 3 vehicles (343, accounting for 35.1%) and females with 3 vehicles (364, making up 42.5%).
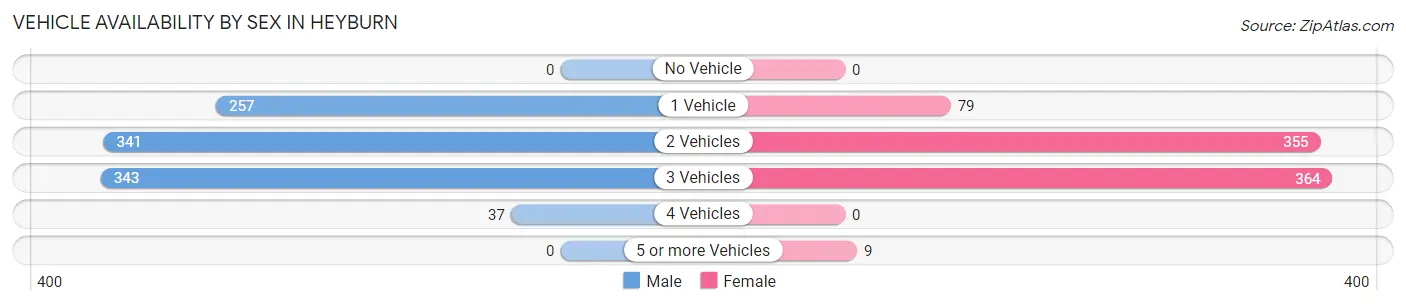
| Vehicles Available | Male | Female |
| No Vehicle | 0 (0.0%) | 0 (0.0%) |
| 1 Vehicle | 257 (26.3%) | 79 (9.8%) |
| 2 Vehicles | 341 (34.9%) | 355 (44.0%) |
| 3 Vehicles | 343 (35.1%) | 364 (45.1%) |
| 4 Vehicles | 37 (3.8%) | 0 (0.0%) |
| 5 or more Vehicles | 0 (0.0%) | 9 (1.1%) |
| Total | 978 (100.0%) | 807 (100.0%) |
Commute Time in Heyburn
The most frequently occuring commute durations in Heyburn are 10 to 14 minutes (796 commuters, 45.6%), 5 to 9 minutes (434 commuters, 24.9%), and 20 to 24 minutes (258 commuters, 14.8%).
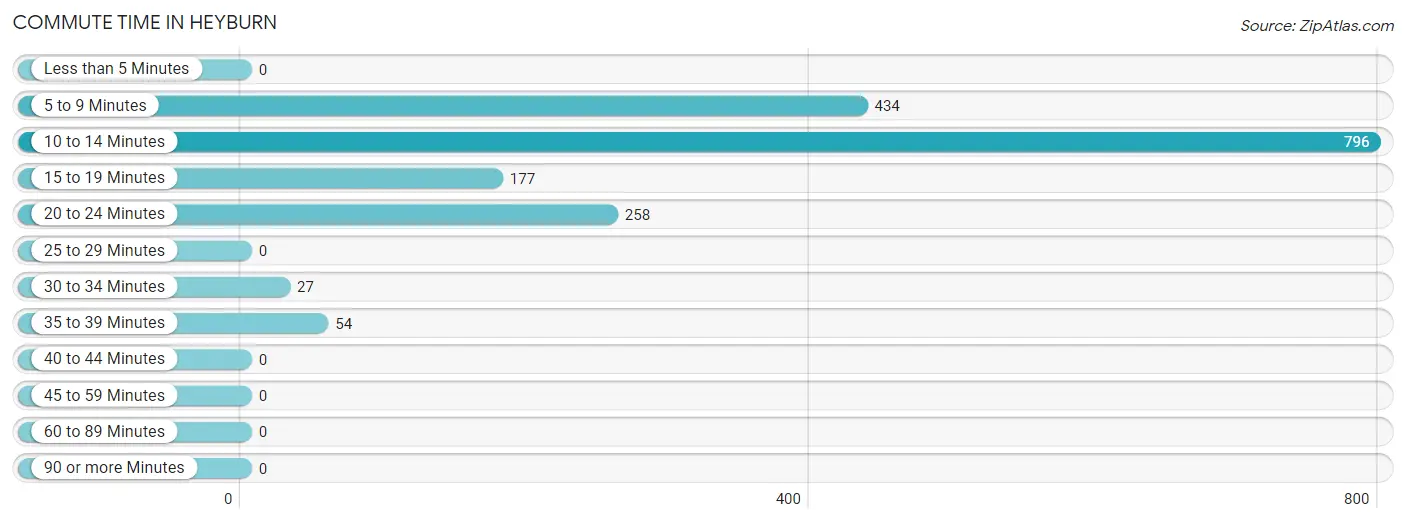
| Commute Time | # Commuters | % Commuters |
| Less than 5 Minutes | 0 | 0.0% |
| 5 to 9 Minutes | 434 | 24.9% |
| 10 to 14 Minutes | 796 | 45.6% |
| 15 to 19 Minutes | 177 | 10.1% |
| 20 to 24 Minutes | 258 | 14.8% |
| 25 to 29 Minutes | 0 | 0.0% |
| 30 to 34 Minutes | 27 | 1.5% |
| 35 to 39 Minutes | 54 | 3.1% |
| 40 to 44 Minutes | 0 | 0.0% |
| 45 to 59 Minutes | 0 | 0.0% |
| 60 to 89 Minutes | 0 | 0.0% |
| 90 or more Minutes | 0 | 0.0% |
Commute Time by Sex in Heyburn
The most common commute times in Heyburn are 10 to 14 minutes (406 commuters, 42.3%) for males and 10 to 14 minutes (390 commuters, 49.6%) for females.
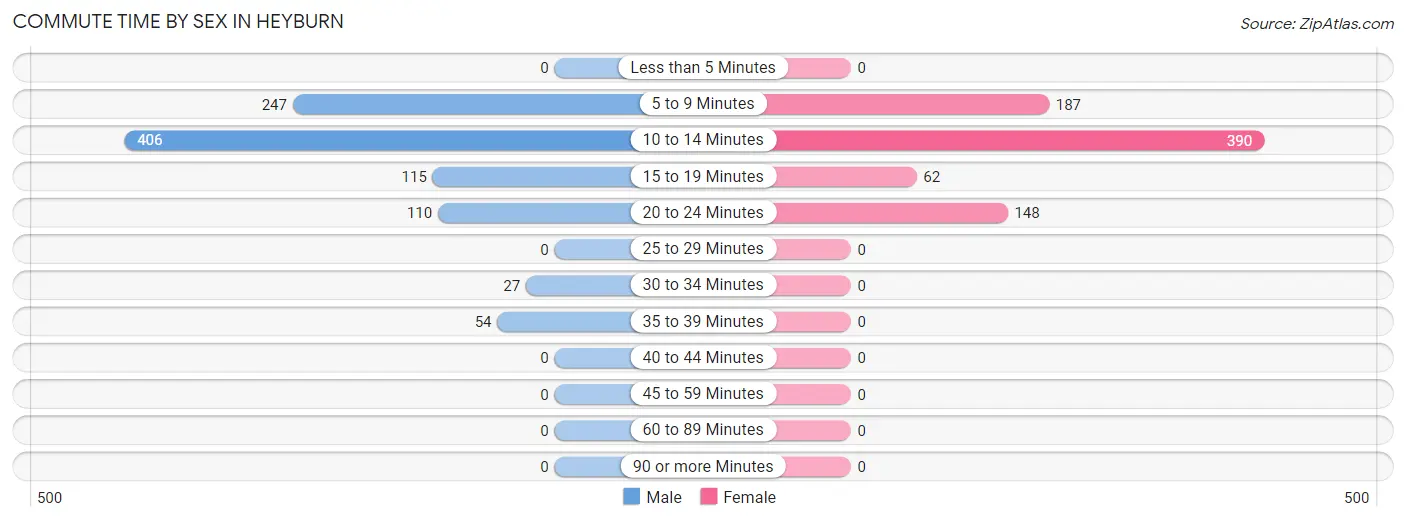
| Commute Time | Male | Female |
| Less than 5 Minutes | 0 (0.0%) | 0 (0.0%) |
| 5 to 9 Minutes | 247 (25.8%) | 187 (23.8%) |
| 10 to 14 Minutes | 406 (42.3%) | 390 (49.6%) |
| 15 to 19 Minutes | 115 (12.0%) | 62 (7.9%) |
| 20 to 24 Minutes | 110 (11.5%) | 148 (18.8%) |
| 25 to 29 Minutes | 0 (0.0%) | 0 (0.0%) |
| 30 to 34 Minutes | 27 (2.8%) | 0 (0.0%) |
| 35 to 39 Minutes | 54 (5.6%) | 0 (0.0%) |
| 40 to 44 Minutes | 0 (0.0%) | 0 (0.0%) |
| 45 to 59 Minutes | 0 (0.0%) | 0 (0.0%) |
| 60 to 89 Minutes | 0 (0.0%) | 0 (0.0%) |
| 90 or more Minutes | 0 (0.0%) | 0 (0.0%) |
Time of Departure to Work by Sex in Heyburn
The most frequent times of departure to work in Heyburn are 6:00 AM to 6:29 AM (258, 26.9%) for males and 7:30 AM to 7:59 AM (210, 26.7%) for females.
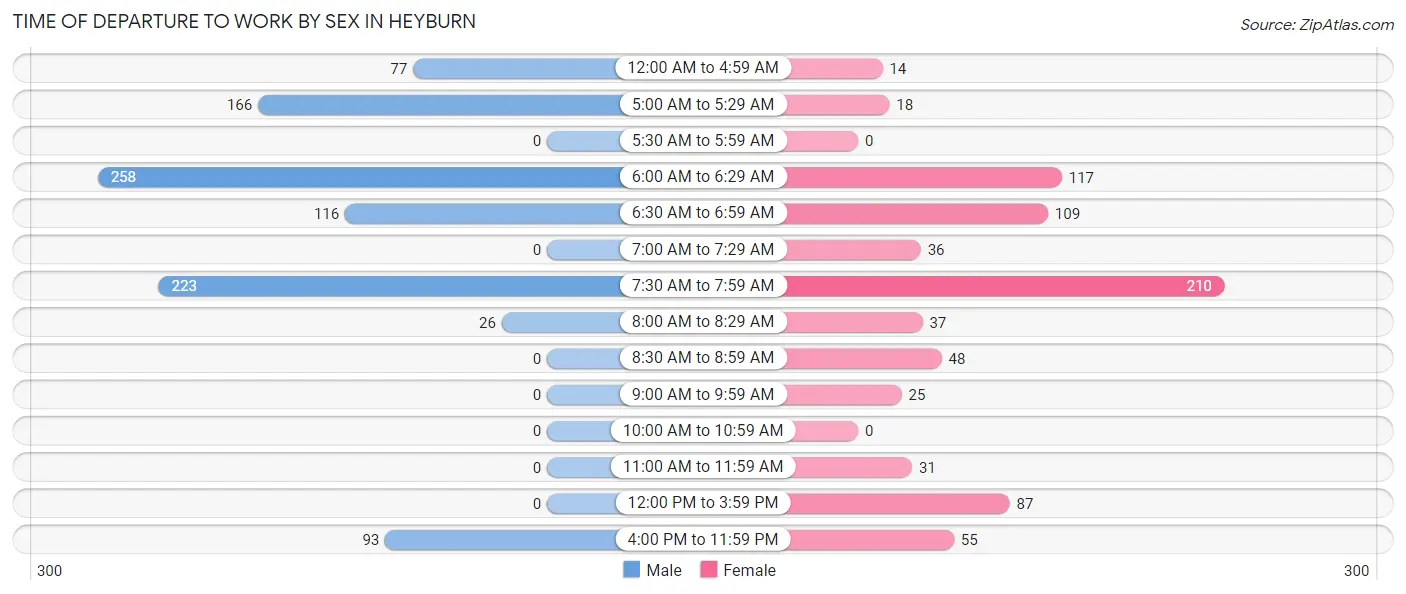
| Time of Departure | Male | Female |
| 12:00 AM to 4:59 AM | 77 (8.0%) | 14 (1.8%) |
| 5:00 AM to 5:29 AM | 166 (17.3%) | 18 (2.3%) |
| 5:30 AM to 5:59 AM | 0 (0.0%) | 0 (0.0%) |
| 6:00 AM to 6:29 AM | 258 (26.9%) | 117 (14.9%) |
| 6:30 AM to 6:59 AM | 116 (12.1%) | 109 (13.9%) |
| 7:00 AM to 7:29 AM | 0 (0.0%) | 36 (4.6%) |
| 7:30 AM to 7:59 AM | 223 (23.3%) | 210 (26.7%) |
| 8:00 AM to 8:29 AM | 26 (2.7%) | 37 (4.7%) |
| 8:30 AM to 8:59 AM | 0 (0.0%) | 48 (6.1%) |
| 9:00 AM to 9:59 AM | 0 (0.0%) | 25 (3.2%) |
| 10:00 AM to 10:59 AM | 0 (0.0%) | 0 (0.0%) |
| 11:00 AM to 11:59 AM | 0 (0.0%) | 31 (3.9%) |
| 12:00 PM to 3:59 PM | 0 (0.0%) | 87 (11.1%) |
| 4:00 PM to 11:59 PM | 93 (9.7%) | 55 (7.0%) |
| Total | 959 (100.0%) | 787 (100.0%) |
Housing Occupancy in Heyburn
Occupancy by Ownership in Heyburn
Of the total 1,285 dwellings in Heyburn, owner-occupied units account for 609 (47.4%), while renter-occupied units make up 676 (52.6%).
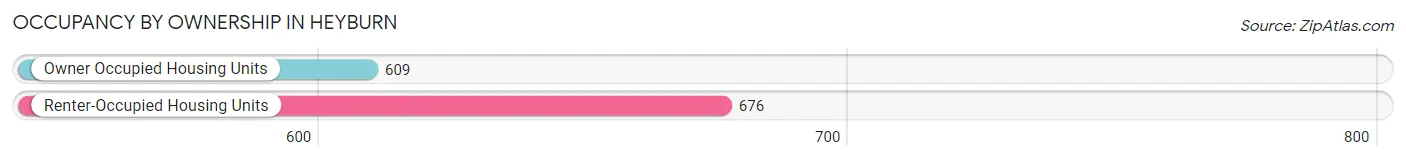
| Occupancy | # Housing Units | % Housing Units |
| Owner Occupied Housing Units | 609 | 47.4% |
| Renter-Occupied Housing Units | 676 | 52.6% |
| Total Occupied Housing Units | 1,285 | 100.0% |
Occupancy by Household Size in Heyburn
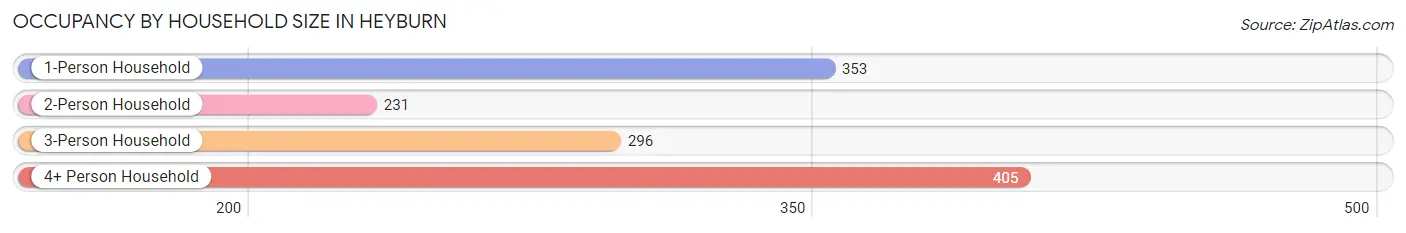
| Household Size | # Housing Units | % Housing Units |
| 1-Person Household | 353 | 27.5% |
| 2-Person Household | 231 | 18.0% |
| 3-Person Household | 296 | 23.0% |
| 4+ Person Household | 405 | 31.5% |
| Total Housing Units | 1,285 | 100.0% |
Occupancy by Ownership by Household Size in Heyburn
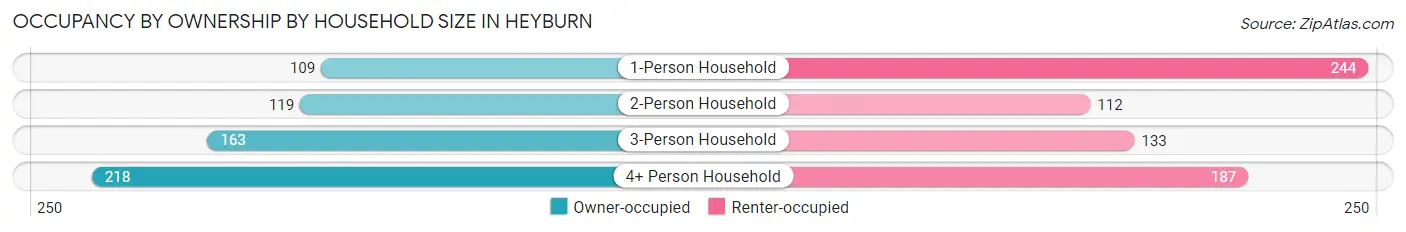
| Household Size | Owner-occupied | Renter-occupied |
| 1-Person Household | 109 (30.9%) | 244 (69.1%) |
| 2-Person Household | 119 (51.5%) | 112 (48.5%) |
| 3-Person Household | 163 (55.1%) | 133 (44.9%) |
| 4+ Person Household | 218 (53.8%) | 187 (46.2%) |
| Total Housing Units | 609 (47.4%) | 676 (52.6%) |
Occupancy by Educational Attainment in Heyburn
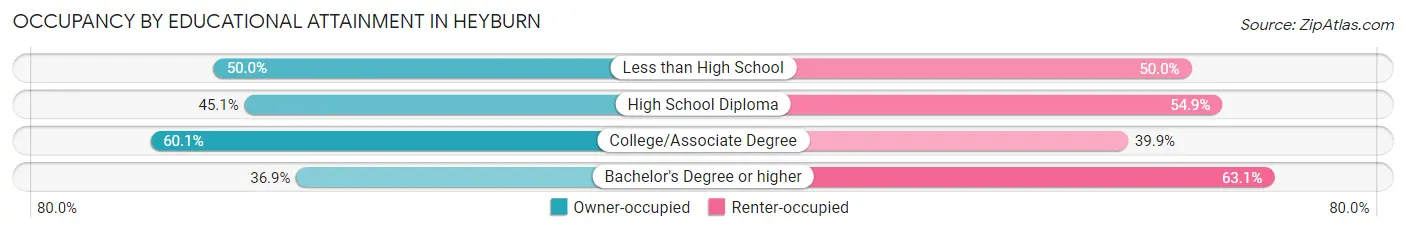
| Household Size | Owner-occupied | Renter-occupied |
| Less than High School | 94 (50.0%) | 94 (50.0%) |
| High School Diploma | 226 (45.1%) | 275 (54.9%) |
| College/Associate Degree | 179 (60.1%) | 119 (39.9%) |
| Bachelor's Degree or higher | 110 (36.9%) | 188 (63.1%) |
Occupancy by Age of Householder in Heyburn
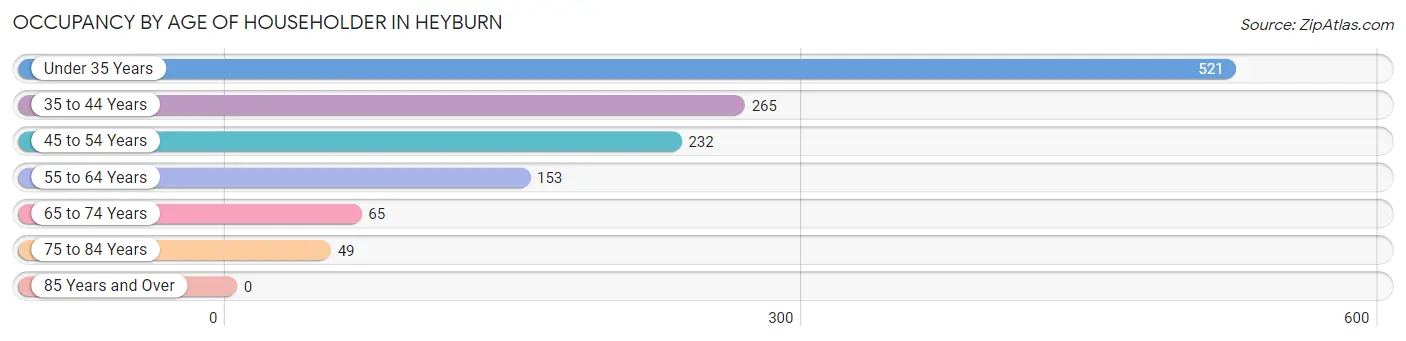
| Age Bracket | # Households | % Households |
| Under 35 Years | 521 | 40.5% |
| 35 to 44 Years | 265 | 20.6% |
| 45 to 54 Years | 232 | 18.0% |
| 55 to 64 Years | 153 | 11.9% |
| 65 to 74 Years | 65 | 5.1% |
| 75 to 84 Years | 49 | 3.8% |
| 85 Years and Over | 0 | 0.0% |
| Total | 1,285 | 100.0% |
Housing Finances in Heyburn
Median Income by Occupancy in Heyburn
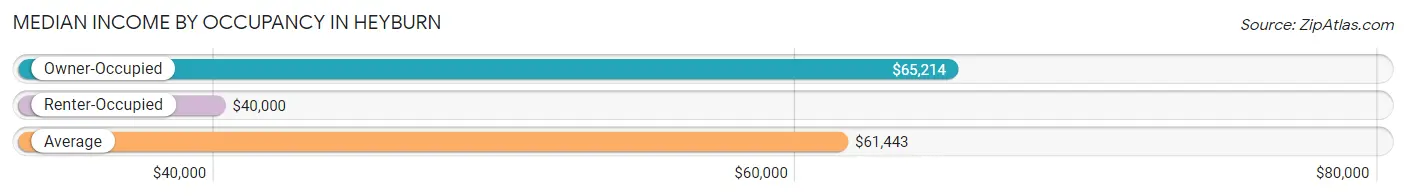
| Occupancy Type | # Households | Median Income |
| Owner-Occupied | 609 (47.4%) | $65,214 |
| Renter-Occupied | 676 (52.6%) | $40,000 |
| Average | 1,285 (100.0%) | $61,443 |
Occupancy by Householder Income Bracket in Heyburn
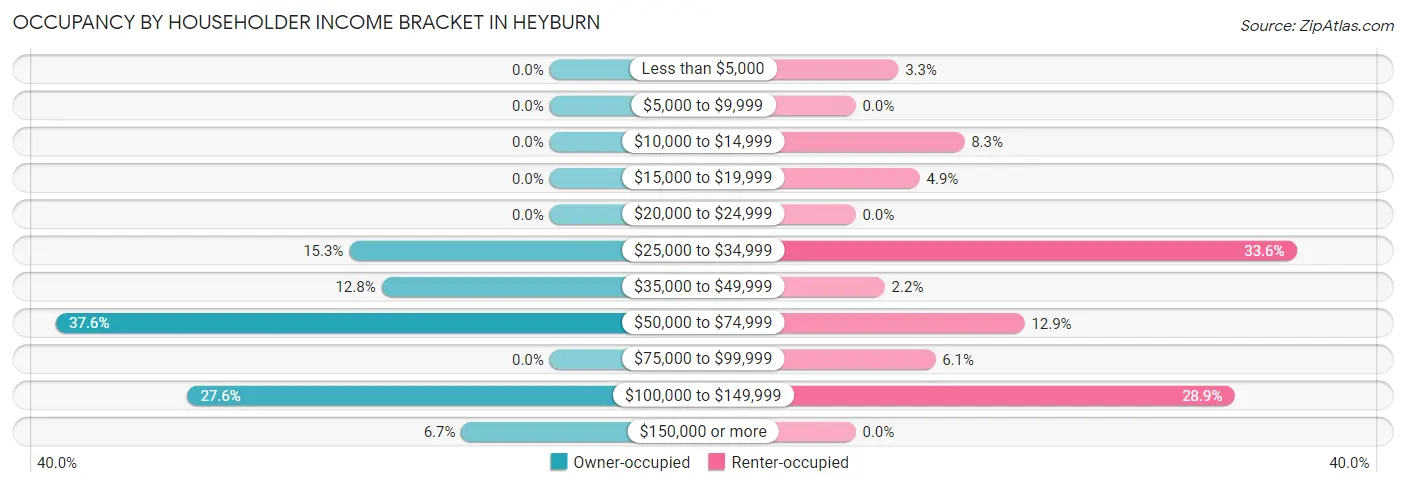
| Income Bracket | Owner-occupied | Renter-occupied |
| Less than $5,000 | 0 (0.0%) | 22 (3.3%) |
| $5,000 to $9,999 | 0 (0.0%) | 0 (0.0%) |
| $10,000 to $14,999 | 0 (0.0%) | 56 (8.3%) |
| $15,000 to $19,999 | 0 (0.0%) | 33 (4.9%) |
| $20,000 to $24,999 | 0 (0.0%) | 0 (0.0%) |
| $25,000 to $34,999 | 93 (15.3%) | 227 (33.6%) |
| $35,000 to $49,999 | 78 (12.8%) | 15 (2.2%) |
| $50,000 to $74,999 | 229 (37.6%) | 87 (12.9%) |
| $75,000 to $99,999 | 0 (0.0%) | 41 (6.1%) |
| $100,000 to $149,999 | 168 (27.6%) | 195 (28.8%) |
| $150,000 or more | 41 (6.7%) | 0 (0.0%) |
| Total | 609 (100.0%) | 676 (100.0%) |
Monthly Housing Cost Tiers in Heyburn
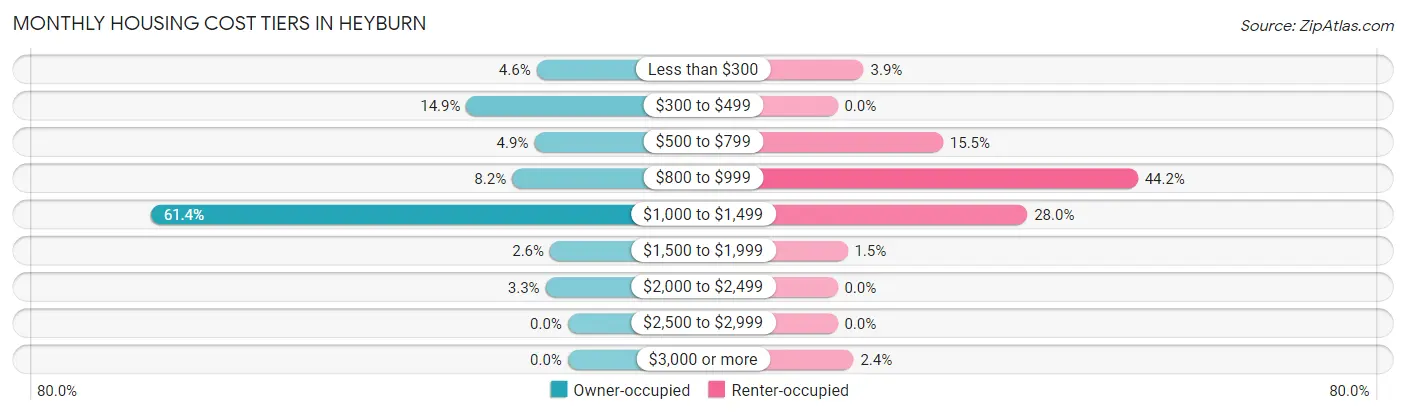
| Monthly Cost | Owner-occupied | Renter-occupied |
| Less than $300 | 28 (4.6%) | 26 (3.8%) |
| $300 to $499 | 91 (14.9%) | 0 (0.0%) |
| $500 to $799 | 30 (4.9%) | 105 (15.5%) |
| $800 to $999 | 50 (8.2%) | 299 (44.2%) |
| $1,000 to $1,499 | 374 (61.4%) | 189 (28.0%) |
| $1,500 to $1,999 | 16 (2.6%) | 10 (1.5%) |
| $2,000 to $2,499 | 20 (3.3%) | 0 (0.0%) |
| $2,500 to $2,999 | 0 (0.0%) | 0 (0.0%) |
| $3,000 or more | 0 (0.0%) | 16 (2.4%) |
| Total | 609 (100.0%) | 676 (100.0%) |
Physical Housing Characteristics in Heyburn
Housing Structures in Heyburn
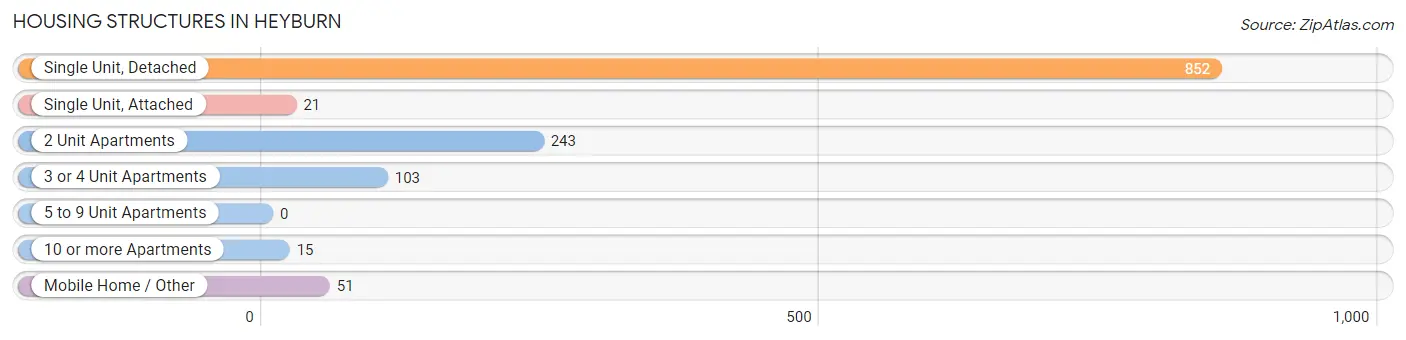
| Structure Type | # Housing Units | % Housing Units |
| Single Unit, Detached | 852 | 66.3% |
| Single Unit, Attached | 21 | 1.6% |
| 2 Unit Apartments | 243 | 18.9% |
| 3 or 4 Unit Apartments | 103 | 8.0% |
| 5 to 9 Unit Apartments | 0 | 0.0% |
| 10 or more Apartments | 15 | 1.2% |
| Mobile Home / Other | 51 | 4.0% |
| Total | 1,285 | 100.0% |
Housing Structures by Occupancy in Heyburn
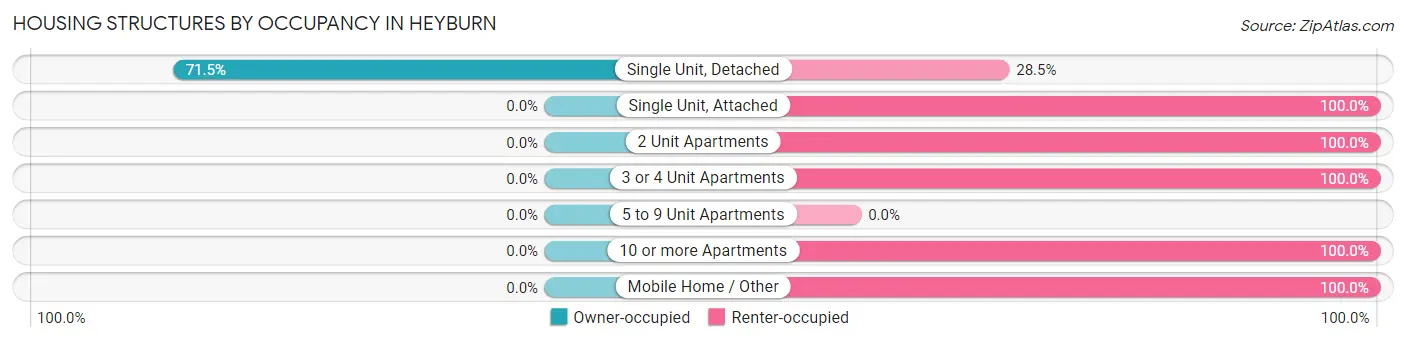
| Structure Type | Owner-occupied | Renter-occupied |
| Single Unit, Detached | 609 (71.5%) | 243 (28.5%) |
| Single Unit, Attached | 0 (0.0%) | 21 (100.0%) |
| 2 Unit Apartments | 0 (0.0%) | 243 (100.0%) |
| 3 or 4 Unit Apartments | 0 (0.0%) | 103 (100.0%) |
| 5 to 9 Unit Apartments | 0 (0.0%) | 0 (0.0%) |
| 10 or more Apartments | 0 (0.0%) | 15 (100.0%) |
| Mobile Home / Other | 0 (0.0%) | 51 (100.0%) |
| Total | 609 (47.4%) | 676 (52.6%) |
Housing Structures by Number of Rooms in Heyburn
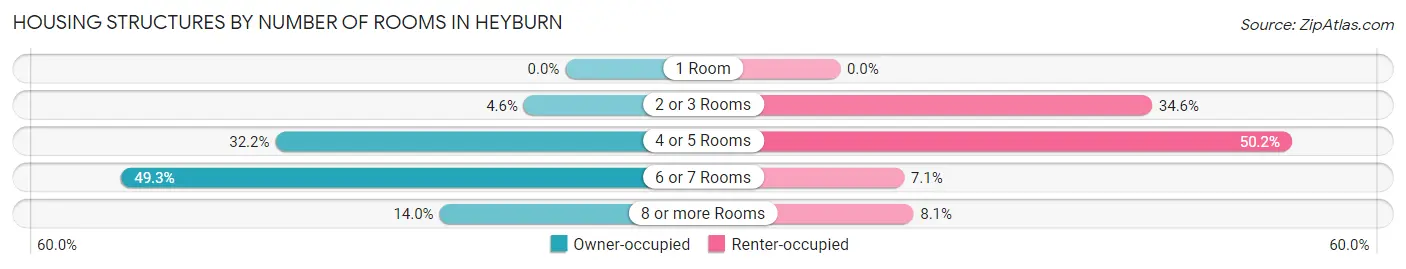
| Number of Rooms | Owner-occupied | Renter-occupied |
| 1 Room | 0 (0.0%) | 0 (0.0%) |
| 2 or 3 Rooms | 28 (4.6%) | 234 (34.6%) |
| 4 or 5 Rooms | 196 (32.2%) | 339 (50.1%) |
| 6 or 7 Rooms | 300 (49.3%) | 48 (7.1%) |
| 8 or more Rooms | 85 (14.0%) | 55 (8.1%) |
| Total | 609 (100.0%) | 676 (100.0%) |
Housing Structure by Heating Type in Heyburn
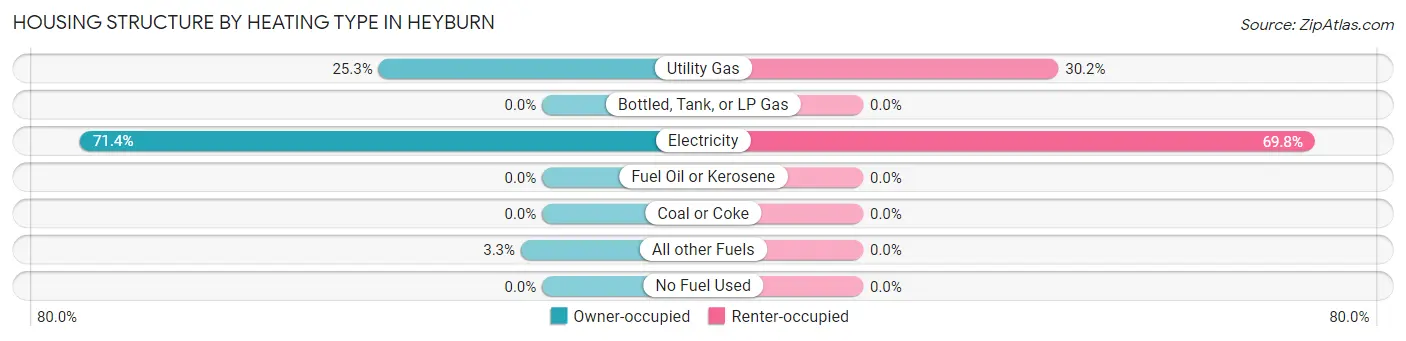
| Heating Type | Owner-occupied | Renter-occupied |
| Utility Gas | 154 (25.3%) | 204 (30.2%) |
| Bottled, Tank, or LP Gas | 0 (0.0%) | 0 (0.0%) |
| Electricity | 435 (71.4%) | 472 (69.8%) |
| Fuel Oil or Kerosene | 0 (0.0%) | 0 (0.0%) |
| Coal or Coke | 0 (0.0%) | 0 (0.0%) |
| All other Fuels | 20 (3.3%) | 0 (0.0%) |
| No Fuel Used | 0 (0.0%) | 0 (0.0%) |
| Total | 609 (100.0%) | 676 (100.0%) |
Household Vehicle Usage in Heyburn
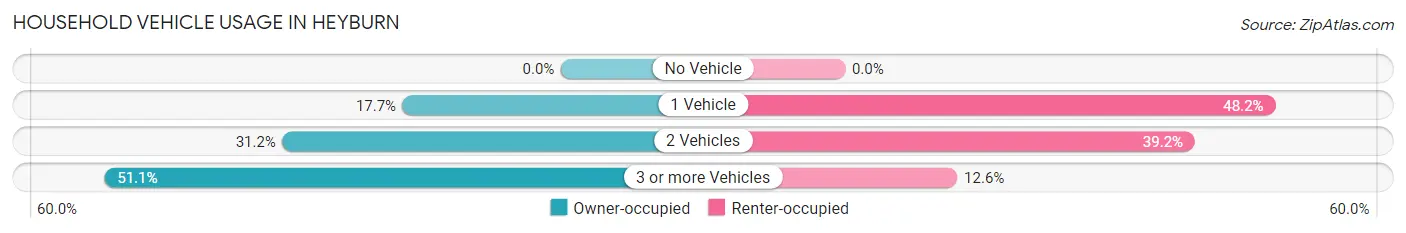
| Vehicles per Household | Owner-occupied | Renter-occupied |
| No Vehicle | 0 (0.0%) | 0 (0.0%) |
| 1 Vehicle | 108 (17.7%) | 326 (48.2%) |
| 2 Vehicles | 190 (31.2%) | 265 (39.2%) |
| 3 or more Vehicles | 311 (51.1%) | 85 (12.6%) |
| Total | 609 (100.0%) | 676 (100.0%) |
Real Estate & Mortgages in Heyburn
Real Estate and Mortgage Overview in Heyburn
| Characteristic | Without Mortgage | With Mortgage |
| Housing Units | 175 | 434 |
| Median Property Value | $162,900 | $167,000 |
| Median Household Income | $66,384 | $16 |
| Monthly Housing Costs | $360 | $0 |
| Real Estate Taxes | $1,158 | $0 |
Property Value by Mortgage Status in Heyburn
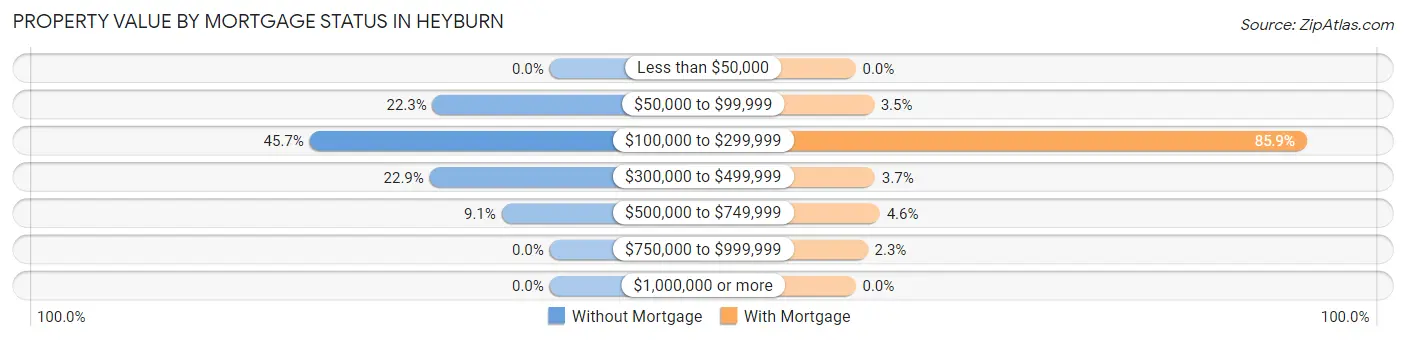
| Property Value | Without Mortgage | With Mortgage |
| Less than $50,000 | 0 (0.0%) | 0 (0.0%) |
| $50,000 to $99,999 | 39 (22.3%) | 15 (3.5%) |
| $100,000 to $299,999 | 80 (45.7%) | 373 (85.9%) |
| $300,000 to $499,999 | 40 (22.9%) | 16 (3.7%) |
| $500,000 to $749,999 | 16 (9.1%) | 20 (4.6%) |
| $750,000 to $999,999 | 0 (0.0%) | 10 (2.3%) |
| $1,000,000 or more | 0 (0.0%) | 0 (0.0%) |
| Total | 175 (100.0%) | 434 (100.0%) |
Household Income by Mortgage Status in Heyburn
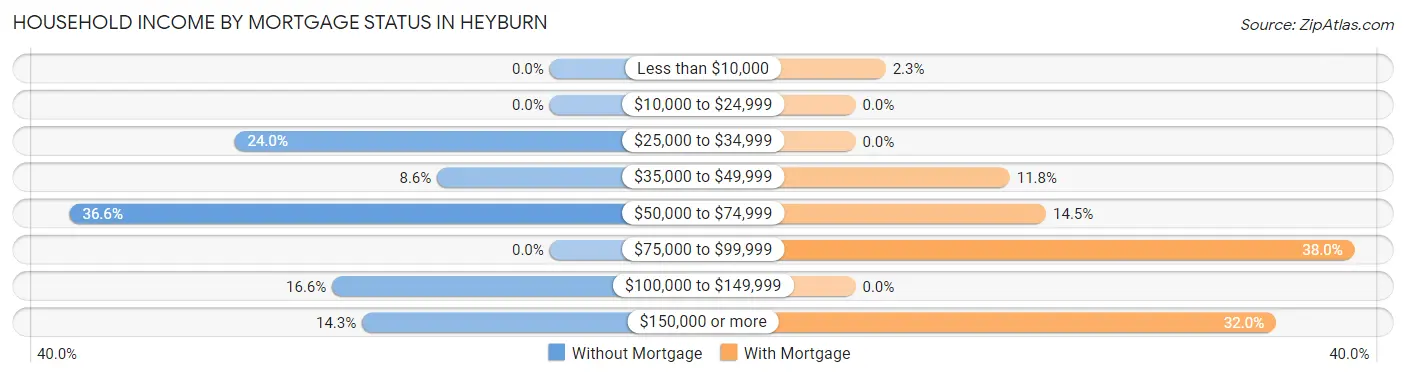
| Household Income | Without Mortgage | With Mortgage |
| Less than $10,000 | 0 (0.0%) | 10 (2.3%) |
| $10,000 to $24,999 | 0 (0.0%) | 0 (0.0%) |
| $25,000 to $34,999 | 42 (24.0%) | 0 (0.0%) |
| $35,000 to $49,999 | 15 (8.6%) | 51 (11.7%) |
| $50,000 to $74,999 | 64 (36.6%) | 63 (14.5%) |
| $75,000 to $99,999 | 0 (0.0%) | 165 (38.0%) |
| $100,000 to $149,999 | 29 (16.6%) | 0 (0.0%) |
| $150,000 or more | 25 (14.3%) | 139 (32.0%) |
| Total | 175 (100.0%) | 434 (100.0%) |
Property Value to Household Income Ratio in Heyburn
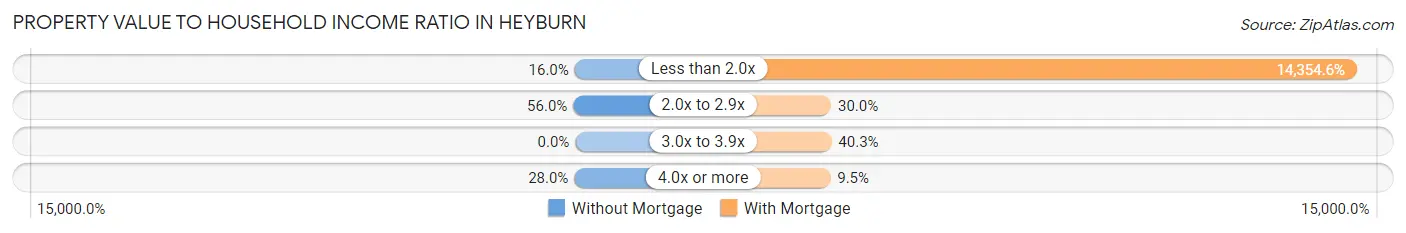
| Value-to-Income Ratio | Without Mortgage | With Mortgage |
| Less than 2.0x | 28 (16.0%) | 62,299 (14,354.6%) |
| 2.0x to 2.9x | 98 (56.0%) | 130 (29.9%) |
| 3.0x to 3.9x | 0 (0.0%) | 175 (40.3%) |
| 4.0x or more | 49 (28.0%) | 41 (9.5%) |
| Total | 175 (100.0%) | 434 (100.0%) |
Real Estate Taxes by Mortgage Status in Heyburn
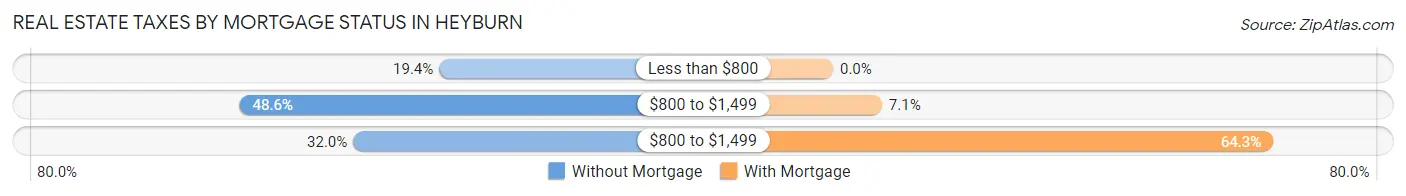
| Property Taxes | Without Mortgage | With Mortgage |
| Less than $800 | 34 (19.4%) | 0 (0.0%) |
| $800 to $1,499 | 85 (48.6%) | 31 (7.1%) |
| $800 to $1,499 | 56 (32.0%) | 279 (64.3%) |
| Total | 175 (100.0%) | 434 (100.0%) |
Health & Disability in Heyburn
Health Insurance Coverage by Age in Heyburn
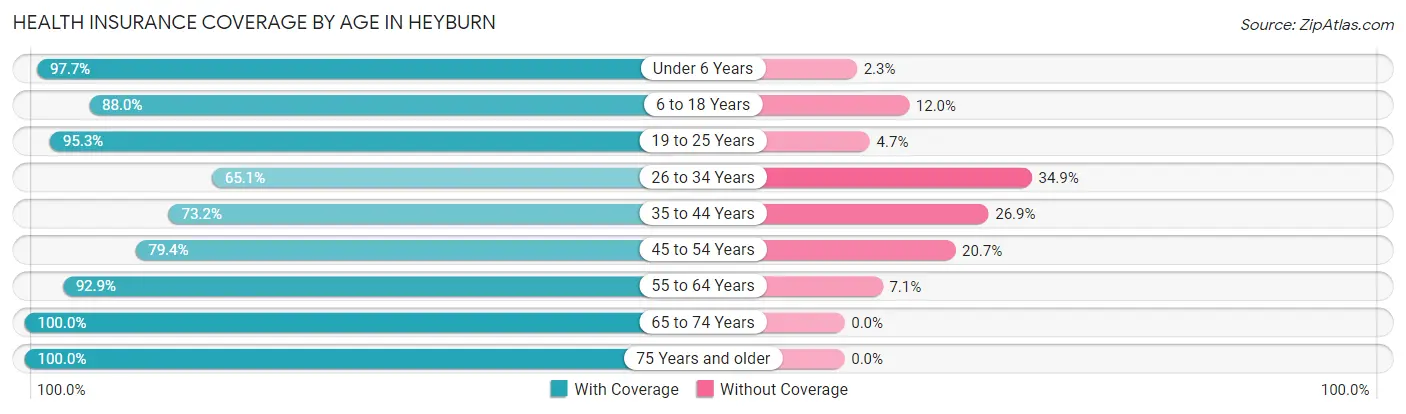
| Age Bracket | With Coverage | Without Coverage |
| Under 6 Years | 465 (97.7%) | 11 (2.3%) |
| 6 to 18 Years | 782 (88.0%) | 107 (12.0%) |
| 19 to 25 Years | 302 (95.3%) | 15 (4.7%) |
| 26 to 34 Years | 384 (65.1%) | 206 (34.9%) |
| 35 to 44 Years | 444 (73.2%) | 163 (26.9%) |
| 45 to 54 Years | 246 (79.3%) | 64 (20.6%) |
| 55 to 64 Years | 209 (92.9%) | 16 (7.1%) |
| 65 to 74 Years | 177 (100.0%) | 0 (0.0%) |
| 75 Years and older | 49 (100.0%) | 0 (0.0%) |
| Total | 3,058 (84.0%) | 582 (16.0%) |
Health Insurance Coverage by Citizenship Status in Heyburn
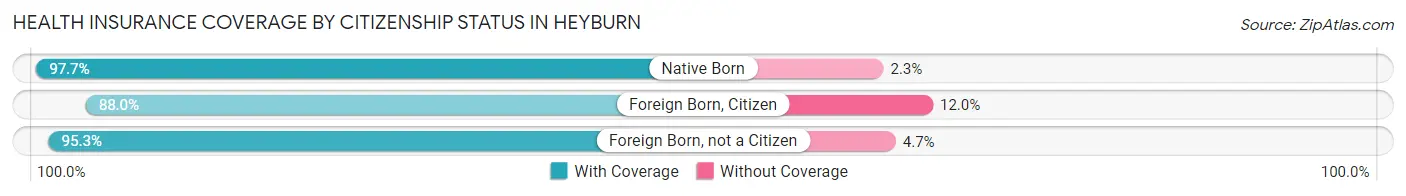
| Citizenship Status | With Coverage | Without Coverage |
| Native Born | 465 (97.7%) | 11 (2.3%) |
| Foreign Born, Citizen | 782 (88.0%) | 107 (12.0%) |
| Foreign Born, not a Citizen | 302 (95.3%) | 15 (4.7%) |
Health Insurance Coverage by Household Income in Heyburn
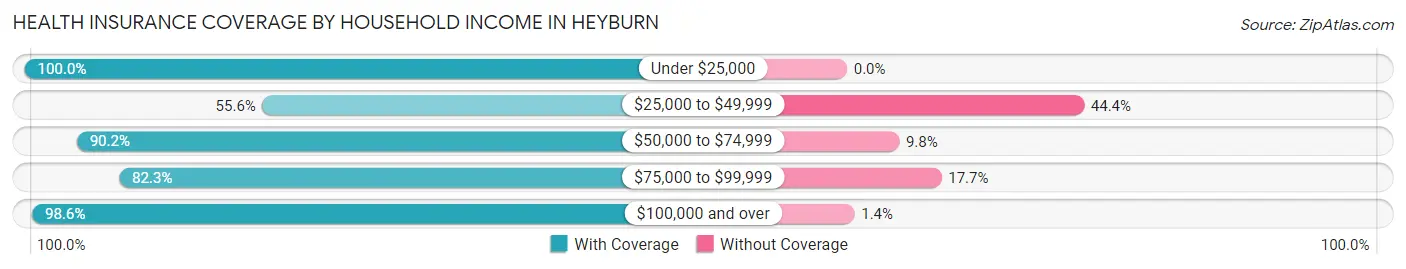
| Household Income | With Coverage | Without Coverage |
| Under $25,000 | 219 (100.0%) | 0 (0.0%) |
| $25,000 to $49,999 | 537 (55.6%) | 429 (44.4%) |
| $50,000 to $74,999 | 1,080 (90.2%) | 117 (9.8%) |
| $75,000 to $99,999 | 93 (82.3%) | 20 (17.7%) |
| $100,000 and over | 1,129 (98.6%) | 16 (1.4%) |
Public vs Private Health Insurance Coverage by Age in Heyburn
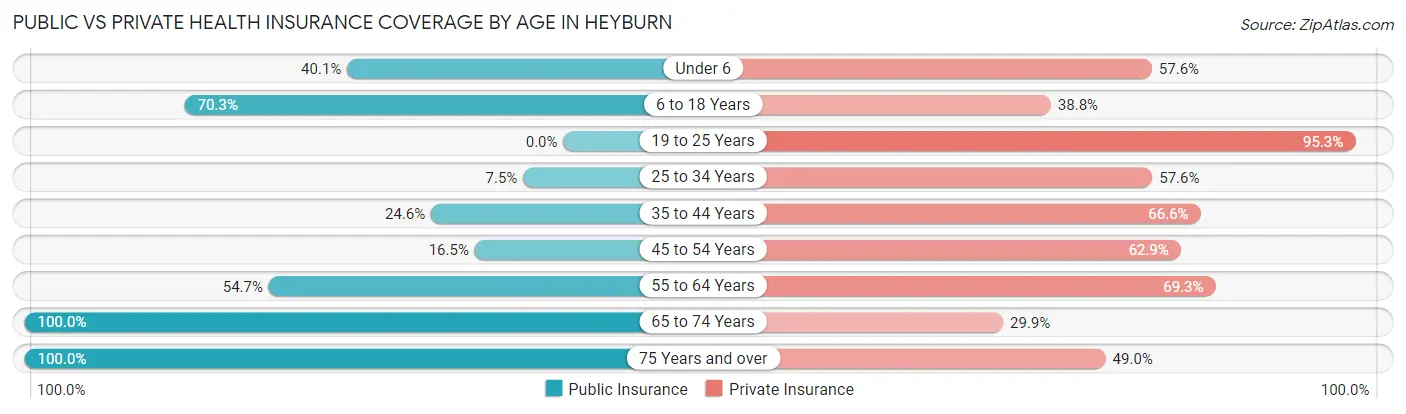
| Age Bracket | Public Insurance | Private Insurance |
| Under 6 | 191 (40.1%) | 274 (57.6%) |
| 6 to 18 Years | 625 (70.3%) | 345 (38.8%) |
| 19 to 25 Years | 0 (0.0%) | 302 (95.3%) |
| 25 to 34 Years | 44 (7.5%) | 340 (57.6%) |
| 35 to 44 Years | 149 (24.5%) | 404 (66.6%) |
| 45 to 54 Years | 51 (16.5%) | 195 (62.9%) |
| 55 to 64 Years | 123 (54.7%) | 156 (69.3%) |
| 65 to 74 Years | 177 (100.0%) | 53 (29.9%) |
| 75 Years and over | 49 (100.0%) | 24 (49.0%) |
| Total | 1,409 (38.7%) | 2,093 (57.5%) |
Disability Status by Sex by Age in Heyburn
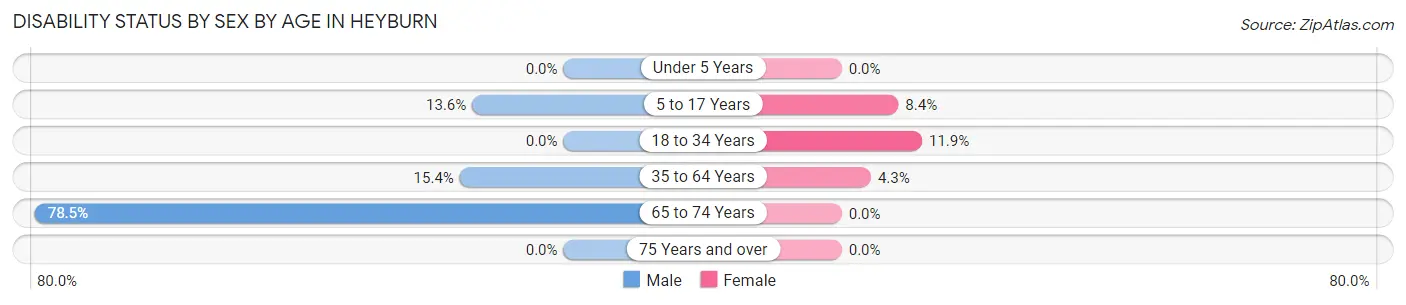
| Age Bracket | Male | Female |
| Under 5 Years | 0 (0.0%) | 0 (0.0%) |
| 5 to 17 Years | 68 (13.6%) | 45 (8.4%) |
| 18 to 34 Years | 0 (0.0%) | 44 (11.9%) |
| 35 to 64 Years | 87 (15.4%) | 25 (4.3%) |
| 65 to 74 Years | 62 (78.5%) | 0 (0.0%) |
| 75 Years and over | 0 (0.0%) | 0 (0.0%) |
Disability Class by Sex by Age in Heyburn
Disability Class: Hearing Difficulty
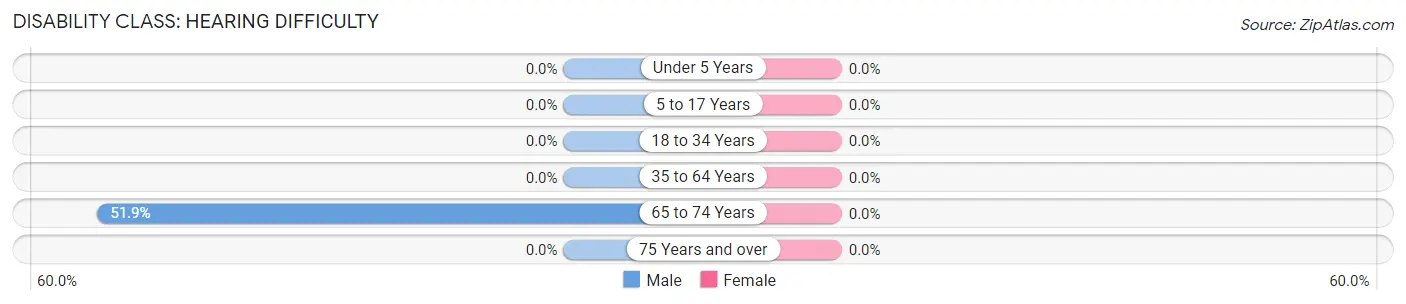
| Age Bracket | Male | Female |
| Under 5 Years | 0 (0.0%) | 0 (0.0%) |
| 5 to 17 Years | 0 (0.0%) | 0 (0.0%) |
| 18 to 34 Years | 0 (0.0%) | 0 (0.0%) |
| 35 to 64 Years | 0 (0.0%) | 0 (0.0%) |
| 65 to 74 Years | 41 (51.9%) | 0 (0.0%) |
| 75 Years and over | 0 (0.0%) | 0 (0.0%) |
Disability Class: Vision Difficulty
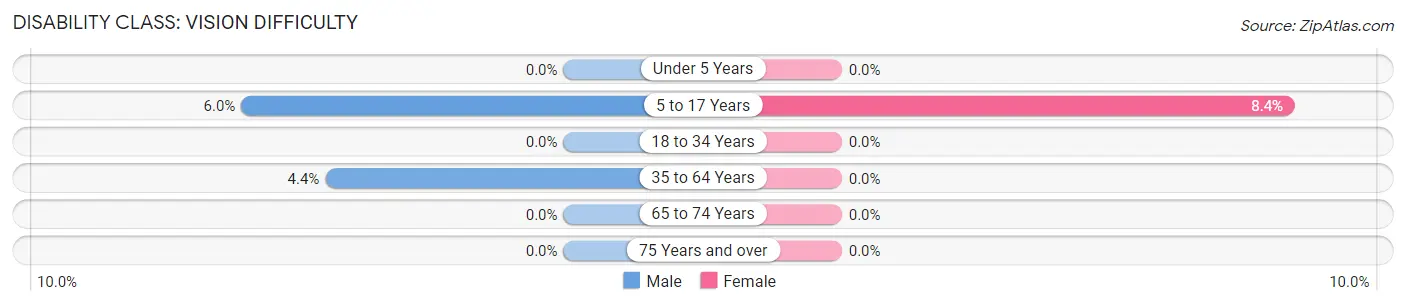
| Age Bracket | Male | Female |
| Under 5 Years | 0 (0.0%) | 0 (0.0%) |
| 5 to 17 Years | 30 (6.0%) | 45 (8.4%) |
| 18 to 34 Years | 0 (0.0%) | 0 (0.0%) |
| 35 to 64 Years | 25 (4.4%) | 0 (0.0%) |
| 65 to 74 Years | 0 (0.0%) | 0 (0.0%) |
| 75 Years and over | 0 (0.0%) | 0 (0.0%) |
Disability Class: Cognitive Difficulty
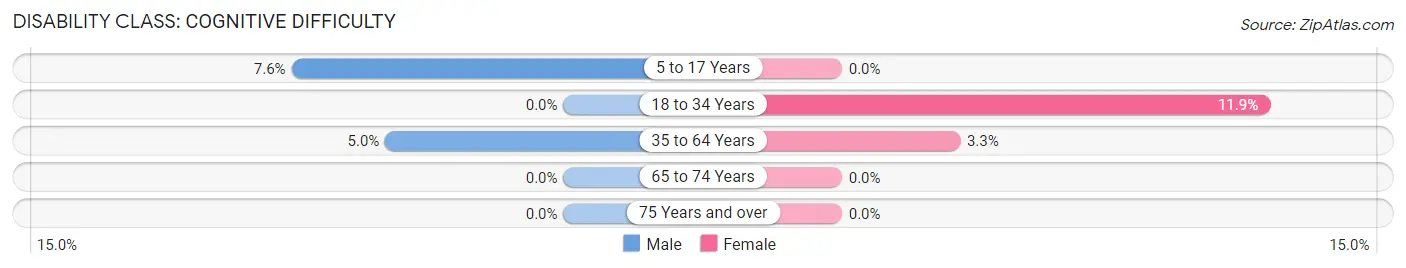
| Age Bracket | Male | Female |
| 5 to 17 Years | 38 (7.6%) | 0 (0.0%) |
| 18 to 34 Years | 0 (0.0%) | 44 (11.9%) |
| 35 to 64 Years | 28 (5.0%) | 19 (3.3%) |
| 65 to 74 Years | 0 (0.0%) | 0 (0.0%) |
| 75 Years and over | 0 (0.0%) | 0 (0.0%) |
Disability Class: Ambulatory Difficulty
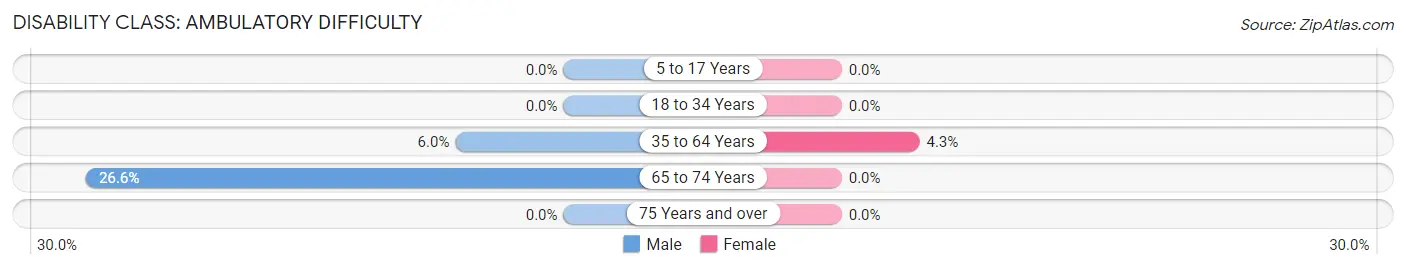
| Age Bracket | Male | Female |
| 5 to 17 Years | 0 (0.0%) | 0 (0.0%) |
| 18 to 34 Years | 0 (0.0%) | 0 (0.0%) |
| 35 to 64 Years | 34 (6.0%) | 25 (4.3%) |
| 65 to 74 Years | 21 (26.6%) | 0 (0.0%) |
| 75 Years and over | 0 (0.0%) | 0 (0.0%) |
Disability Class: Self-Care Difficulty
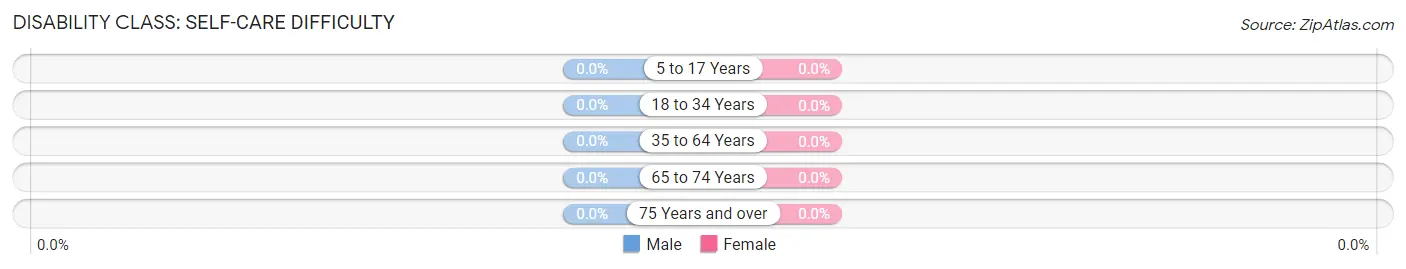
| Age Bracket | Male | Female |
| 5 to 17 Years | 0 (0.0%) | 0 (0.0%) |
| 18 to 34 Years | 0 (0.0%) | 0 (0.0%) |
| 35 to 64 Years | 0 (0.0%) | 0 (0.0%) |
| 65 to 74 Years | 0 (0.0%) | 0 (0.0%) |
| 75 Years and over | 0 (0.0%) | 0 (0.0%) |
Technology Access in Heyburn
Computing Device Access in Heyburn
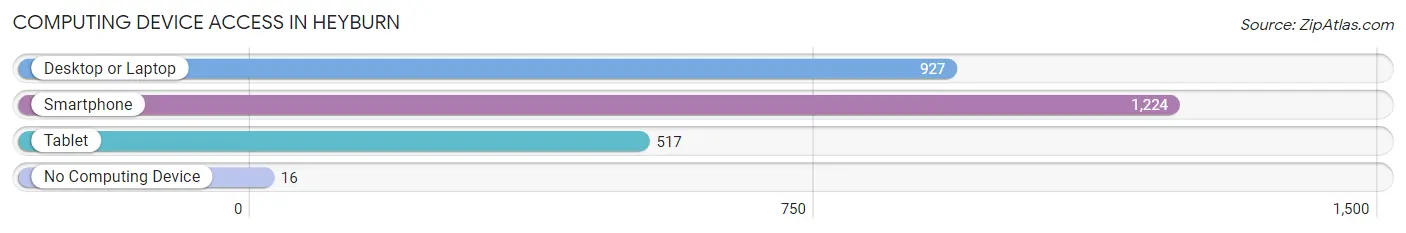
| Device Type | # Households | % Households |
| Desktop or Laptop | 927 | 72.1% |
| Smartphone | 1,224 | 95.3% |
| Tablet | 517 | 40.2% |
| No Computing Device | 16 | 1.3% |
| Total | 1,285 | 100.0% |
Internet Access in Heyburn
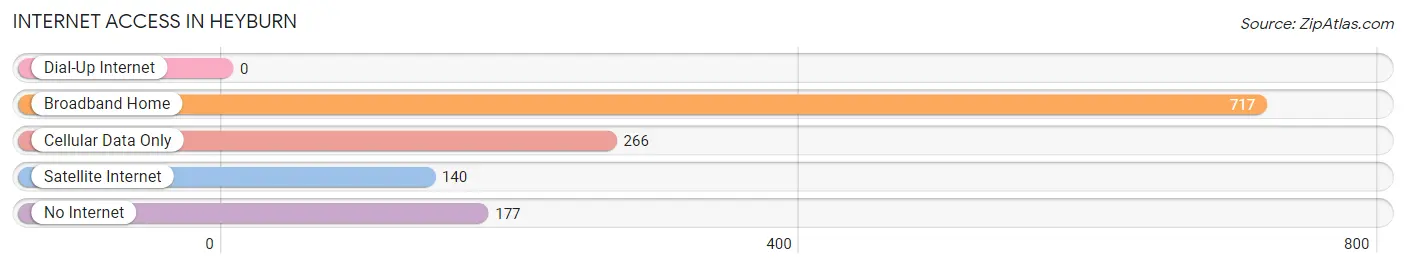
| Internet Type | # Households | % Households |
| Dial-Up Internet | 0 | 0.0% |
| Broadband Home | 717 | 55.8% |
| Cellular Data Only | 266 | 20.7% |
| Satellite Internet | 140 | 10.9% |
| No Internet | 177 | 13.8% |
| Total | 1,285 | 100.0% |
Heyburn Summary
History
The area now known as Heyburn, Idaho was first inhabited by the Shoshone-Bannock Native American tribes. The first European settlers arrived in the area in the late 1800s, and the town of Heyburn was officially established in 1906. The town was named after former U.S. Senator Weldon Heyburn, who was a prominent figure in the area.
The town of Heyburn was originally a farming and ranching community, and the local economy was largely based on agriculture. In the early 1900s, the town was home to several businesses, including a general store, a hotel, a blacksmith shop, and a saloon.
In the 1920s, the town began to experience a period of growth and development. The Union Pacific Railroad built a line through the town, and the local economy began to diversify. The town became a hub for the mining, timber, and agricultural industries, and several new businesses opened in the area.
In the 1950s, the town experienced a period of decline as the local economy shifted away from agriculture and towards industry. The Union Pacific Railroad closed its line through the town, and many of the businesses in the area closed.
In the late 1970s, the town began to experience a period of revitalization. The local economy shifted back towards agriculture, and several new businesses opened in the area. The town also began to attract new residents, and the population began to grow.
Geography
Heyburn is located in the southeastern corner of Idaho, in the Snake River Plain region. The town is situated at an elevation of 4,000 feet, and is surrounded by rolling hills and mountains. The town is located near the Snake River, and is approximately 25 miles from the Idaho-Utah border.
The climate in Heyburn is semi-arid, with hot summers and cold winters. The average annual temperature is around 50 degrees Fahrenheit, and the average annual precipitation is around 10 inches.
Economy
The economy of Heyburn is largely based on agriculture. The town is home to several farms and ranches, and the local economy is supported by the production of wheat, barley, hay, and other crops. The town is also home to several businesses, including restaurants, retail stores, and service providers.
The town is also home to several manufacturing companies, including a furniture factory and a plastics factory. The town is also home to several government agencies, including the Bureau of Land Management and the U.S. Forest Service.
Demographics
As of the 2010 census, the population of Heyburn was 2,717. The population is predominantly white (94.3%), with small percentages of Hispanic (2.2%), Native American (1.2%), and African American (0.7%) residents. The median household income in the town is $41,944, and the median home value is $117,400. The town has a poverty rate of 11.3%.
Common Questions
What is Per Capita Income in Heyburn?
Per Capita income in Heyburn is $25,545.
What is the Median Family Income in Heyburn?
Median Family Income in Heyburn is $64,145.
What is the Median Household income in Heyburn?
Median Household Income in Heyburn is $61,443.
What is Income or Wage Gap in Heyburn?
Income or Wage Gap in Heyburn is 44.0%.
Women in Heyburn earn 56.0 cents for every dollar earned by a man.
What is Family Income Deficit in Heyburn?
Family Income Deficit in Heyburn is $3,828.
Families that are below poverty line in Heyburn earn $3,828 less on average than the poverty threshold level.
What is Inequality or Gini Index in Heyburn?
Inequality or Gini Index in Heyburn is 0.35.
What is the Total Population of Heyburn?
Total Population of Heyburn is 3,640.
What is the Total Male Population of Heyburn?
Total Male Population of Heyburn is 1,807.
What is the Total Female Population of Heyburn?
Total Female Population of Heyburn is 1,833.
What is the Ratio of Males per 100 Females in Heyburn?
There are 98.58 Males per 100 Females in Heyburn.
What is the Ratio of Females per 100 Males in Heyburn?
There are 101.44 Females per 100 Males in Heyburn.
What is the Median Population Age in Heyburn?
Median Population Age in Heyburn is 26.5 Years.
What is the Average Family Size in Heyburn
Average Family Size in Heyburn is 3.4 People.
What is the Average Household Size in Heyburn
Average Household Size in Heyburn is 2.8 People.
How Large is the Labor Force in Heyburn?
There are 1,863 People in the Labor Forcein in Heyburn.
What is the Percentage of People in the Labor Force in Heyburn?
75.3% of People are in the Labor Force in Heyburn.
What is the Unemployment Rate in Heyburn?
Unemployment Rate in Heyburn is 4.1%.