Jersey, GA Map & Demographics
Jersey Map
Jersey Overview
$20,735
PER CAPITA INCOME
$72,500
AVG FAMILY INCOME
$36,736
AVG HOUSEHOLD INCOME
0.33
INEQUALITY / GINI INDEX
164
TOTAL POPULATION
81
MALE POPULATION
83
FEMALE POPULATION
97.59
MALES / 100 FEMALES
102.47
FEMALES / 100 MALES
30.8
MEDIAN AGE
3.8
AVG FAMILY SIZE
2.8
AVG HOUSEHOLD SIZE
60
LABOR FORCE [ PEOPLE ]
52.2%
PERCENT IN LABOR FORCE
Jersey Zip Codes
Jersey Area Codes
Income in Jersey
Income Overview in Jersey
Per Capita Income in Jersey is $20,735, while median incomes of families and households are $72,500 and $36,736 respectively.
| Characteristic | Number | Measure |
| Per Capita Income | 164 | $20,735 |
| Median Family Income | 34 | $72,500 |
| Mean Family Income | 34 | $74,476 |
| Median Household Income | 59 | $36,736 |
| Mean Household Income | 59 | $56,371 |
| Income Deficit | 34 | $0 |
| Wage / Income Gap (%) | 164 | 0.00% |
| Wage / Income Gap ($) | 164 | 100.00¢ per $1 |
| Gini / Inequality Index | 164 | 0.33 |
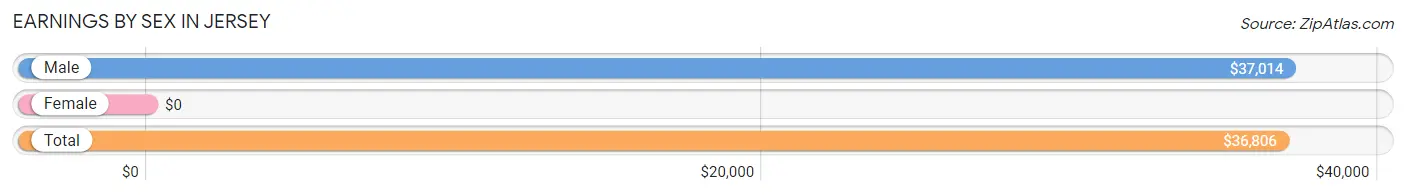
Earnings by Sex in Jersey
| Sex | Number | Average Earnings |
| Male | 29 (48.3%) | $37,014 |
| Female | 31 (51.7%) | $0 |
| Total | 60 (100.0%) | $36,806 |
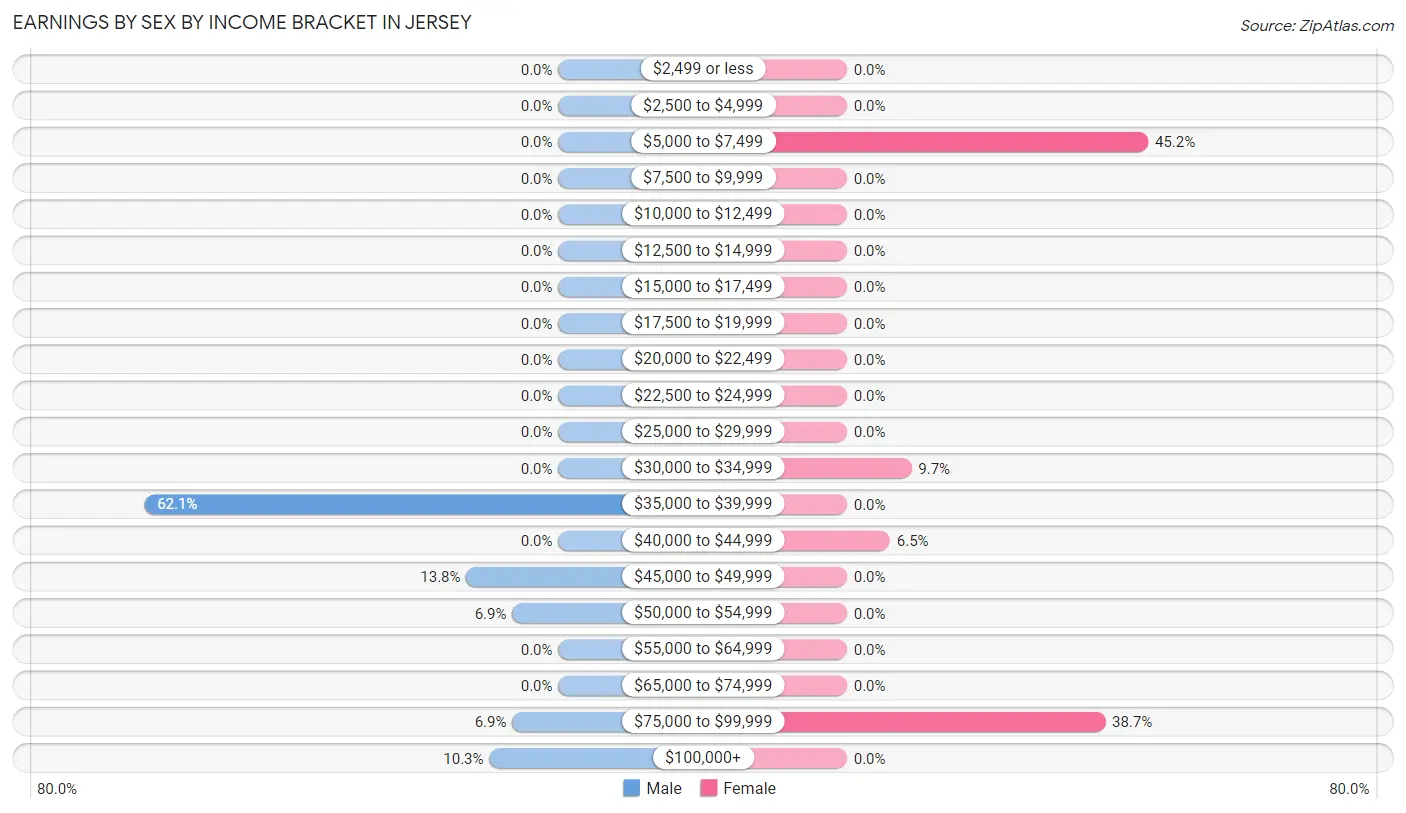
Earnings by Sex by Income Bracket in Jersey
The most common earnings brackets in Jersey are $35,000 to $39,999 for men (18 | 62.1%) and $5,000 to $7,499 for women (14 | 45.2%).
| Income | Male | Female |
| $2,499 or less | 0 (0.0%) | 0 (0.0%) |
| $2,500 to $4,999 | 0 (0.0%) | 0 (0.0%) |
| $5,000 to $7,499 | 0 (0.0%) | 14 (45.2%) |
| $7,500 to $9,999 | 0 (0.0%) | 0 (0.0%) |
| $10,000 to $12,499 | 0 (0.0%) | 0 (0.0%) |
| $12,500 to $14,999 | 0 (0.0%) | 0 (0.0%) |
| $15,000 to $17,499 | 0 (0.0%) | 0 (0.0%) |
| $17,500 to $19,999 | 0 (0.0%) | 0 (0.0%) |
| $20,000 to $22,499 | 0 (0.0%) | 0 (0.0%) |
| $22,500 to $24,999 | 0 (0.0%) | 0 (0.0%) |
| $25,000 to $29,999 | 0 (0.0%) | 0 (0.0%) |
| $30,000 to $34,999 | 0 (0.0%) | 3 (9.7%) |
| $35,000 to $39,999 | 18 (62.1%) | 0 (0.0%) |
| $40,000 to $44,999 | 0 (0.0%) | 2 (6.5%) |
| $45,000 to $49,999 | 4 (13.8%) | 0 (0.0%) |
| $50,000 to $54,999 | 2 (6.9%) | 0 (0.0%) |
| $55,000 to $64,999 | 0 (0.0%) | 0 (0.0%) |
| $65,000 to $74,999 | 0 (0.0%) | 0 (0.0%) |
| $75,000 to $99,999 | 2 (6.9%) | 12 (38.7%) |
| $100,000+ | 3 (10.3%) | 0 (0.0%) |
| Total | 29 (100.0%) | 31 (100.0%) |
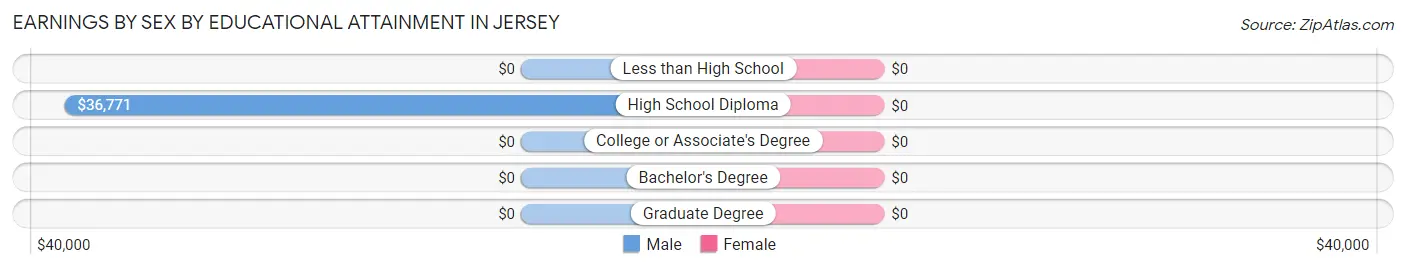
Earnings by Sex by Educational Attainment in Jersey
| Educational Attainment | Male Income | Female Income |
| Less than High School | - | - |
| High School Diploma | $36,771 | $0 |
| College or Associate's Degree | - | - |
| Bachelor's Degree | - | - |
| Graduate Degree | - | - |
| Total | $37,396 | $0 |
Family Income in Jersey
Family Income Brackets in Jersey
According to the Jersey family income data, there are 14 families falling into the $75,000 to $99,999 income range, which is the most common income bracket and makes up 41.2% of all families.
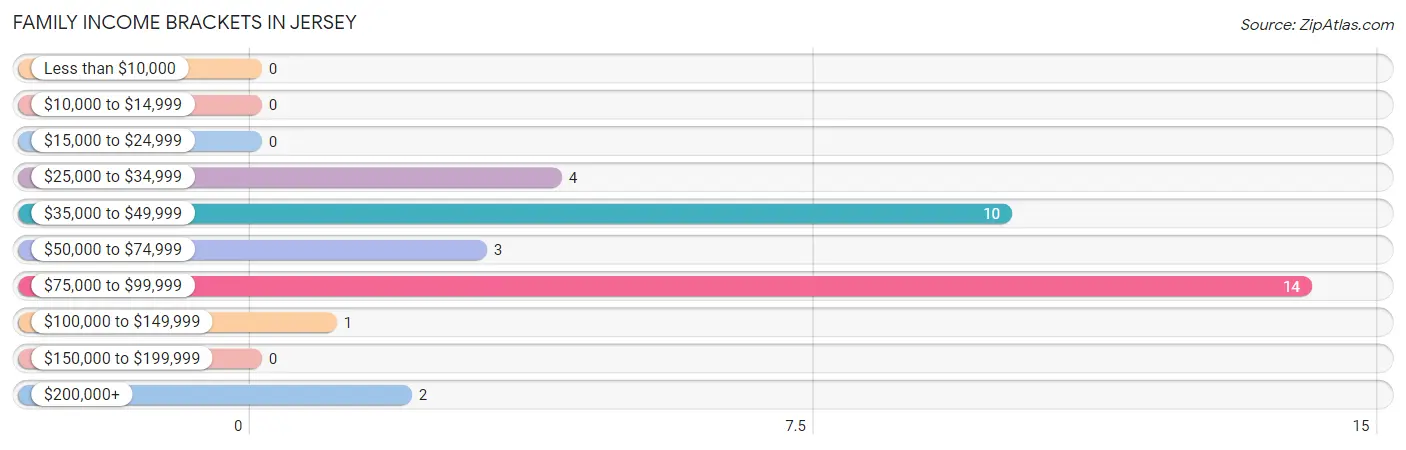
| Income Bracket | # Families | % Families |
| Less than $10,000 | 0 | 0.0% |
| $10,000 to $14,999 | 0 | 0.0% |
| $15,000 to $24,999 | 0 | 0.0% |
| $25,000 to $34,999 | 4 | 11.8% |
| $35,000 to $49,999 | 10 | 29.4% |
| $50,000 to $74,999 | 3 | 8.8% |
| $75,000 to $99,999 | 14 | 41.2% |
| $100,000 to $149,999 | 1 | 2.9% |
| $150,000 to $199,999 | 0 | 0.0% |
| $200,000+ | 2 | 5.9% |
Family Income by Famaliy Size in Jersey
2-person families (8 | 23.5%) account for the highest median family income in Jersey with $36,250 per family, while 2-person families (8 | 23.5%) have the highest median income of $18,125 per family member.
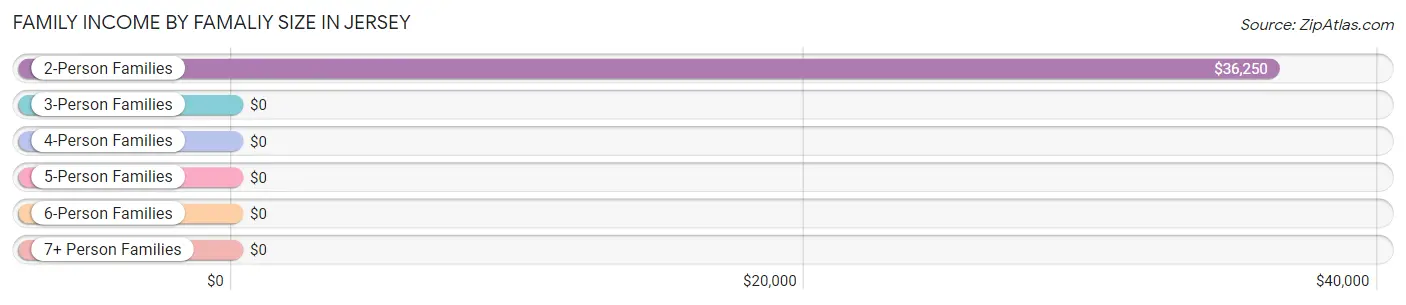
| Income Bracket | # Families | Median Income |
| 2-Person Families | 8 (23.5%) | $36,250 |
| 3-Person Families | 4 (11.8%) | $0 |
| 4-Person Families | 6 (17.6%) | $0 |
| 5-Person Families | 16 (47.1%) | $0 |
| 6-Person Families | 0 (0.0%) | $0 |
| 7+ Person Families | 0 (0.0%) | $0 |
| Total | 34 (100.0%) | $72,500 |
Family Income by Number of Earners in Jersey
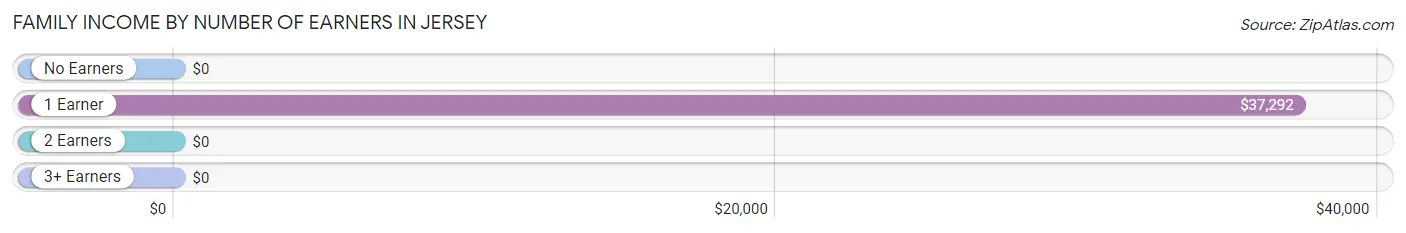
| Number of Earners | # Families | Median Income |
| No Earners | 3 (8.8%) | $0 |
| 1 Earner | 17 (50.0%) | $37,292 |
| 2 Earners | 14 (41.2%) | $0 |
| 3+ Earners | 0 (0.0%) | $0 |
| Total | 34 (100.0%) | $72,500 |
Household Income in Jersey
Household Income Brackets in Jersey
With 22 households falling in the category, the $35,000 to $49,999 income range is the most frequent in Jersey, accounting for 37.3% of all households.
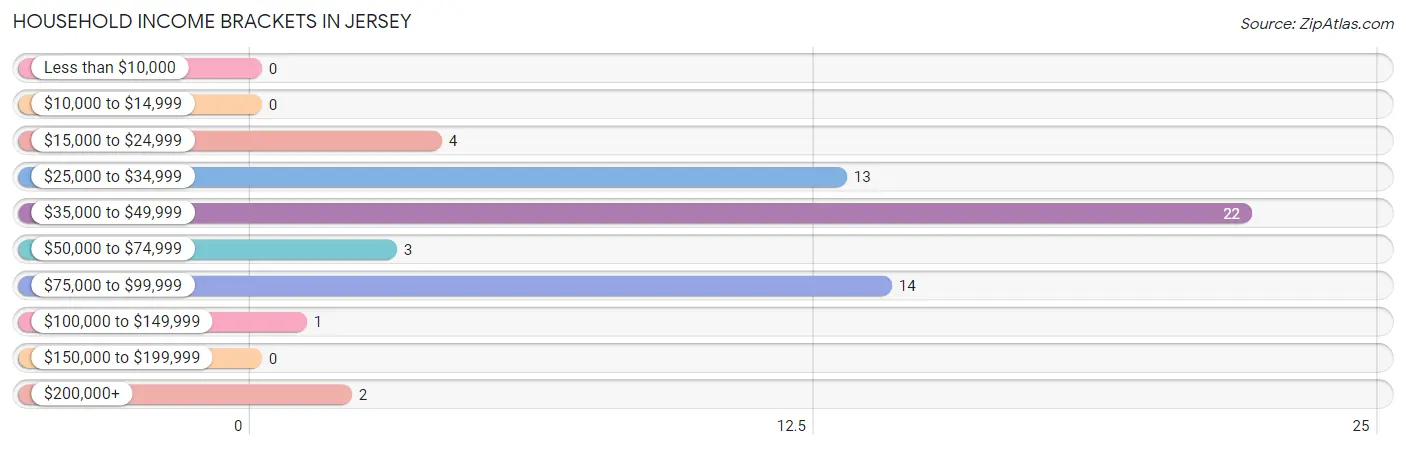
| Income Bracket | # Households | % Households |
| Less than $10,000 | 0 | 0.0% |
| $10,000 to $14,999 | 0 | 0.0% |
| $15,000 to $24,999 | 4 | 6.8% |
| $25,000 to $34,999 | 13 | 22.0% |
| $35,000 to $49,999 | 22 | 37.3% |
| $50,000 to $74,999 | 3 | 5.1% |
| $75,000 to $99,999 | 14 | 23.7% |
| $100,000 to $149,999 | 1 | 1.7% |
| $150,000 to $199,999 | 0 | 0.0% |
| $200,000+ | 2 | 3.4% |
Household Income by Householder Age in Jersey
The median household income in Jersey is $36,736, with the highest median household income of $86,354 found in the 45 to 64 years age bracket for the primary householder. A total of 15 households (25.4%) fall into this category. Meanwhile, the 15 to 24 years age bracket for the primary householder has the lowest median household income of $0, with 9 households (15.2%) in this group.
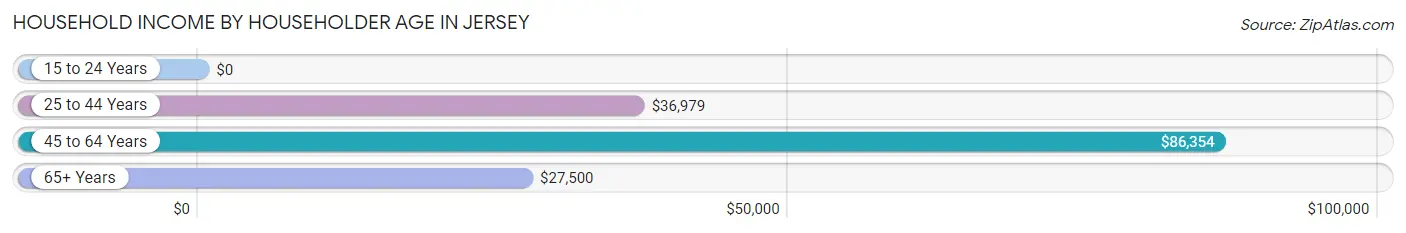
| Income Bracket | # Households | Median Income |
| 15 to 24 Years | 9 (15.2%) | $0 |
| 25 to 44 Years | 19 (32.2%) | $36,979 |
| 45 to 64 Years | 15 (25.4%) | $86,354 |
| 65+ Years | 16 (27.1%) | $27,500 |
| Total | 59 (100.0%) | $36,736 |
Poverty in Jersey
Income Below Poverty by Sex and Age in Jersey
With 3.7% poverty level for males and 8.4% for females among the residents of Jersey, 16 and 17 year old males and 35 to 44 year old females are the most vulnerable to poverty, with 1 males (100.0%) and 2 females (100.0%) in their respective age groups living below the poverty level.
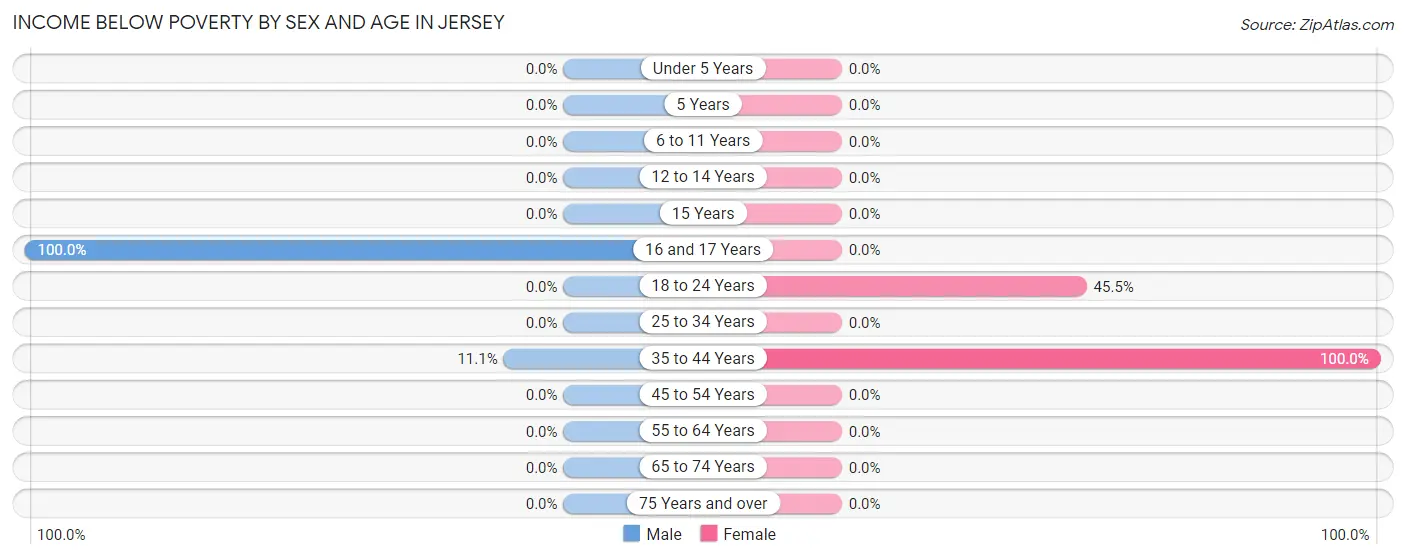
| Age Bracket | Male | Female |
| Under 5 Years | 0 (0.0%) | 0 (0.0%) |
| 5 Years | 0 (0.0%) | 0 (0.0%) |
| 6 to 11 Years | 0 (0.0%) | 0 (0.0%) |
| 12 to 14 Years | 0 (0.0%) | 0 (0.0%) |
| 15 Years | 0 (0.0%) | 0 (0.0%) |
| 16 and 17 Years | 1 (100.0%) | 0 (0.0%) |
| 18 to 24 Years | 0 (0.0%) | 5 (45.5%) |
| 25 to 34 Years | 0 (0.0%) | 0 (0.0%) |
| 35 to 44 Years | 2 (11.1%) | 2 (100.0%) |
| 45 to 54 Years | 0 (0.0%) | 0 (0.0%) |
| 55 to 64 Years | 0 (0.0%) | 0 (0.0%) |
| 65 to 74 Years | 0 (0.0%) | 0 (0.0%) |
| 75 Years and over | 0 (0.0%) | 0 (0.0%) |
| Total | 3 (3.7%) | 7 (8.4%) |
Income Above Poverty by Sex and Age in Jersey
According to the poverty statistics in Jersey, males aged under 5 years and females aged under 5 years are the age groups that are most secure financially, with 100.0% of males and 100.0% of females in these age groups living above the poverty line.
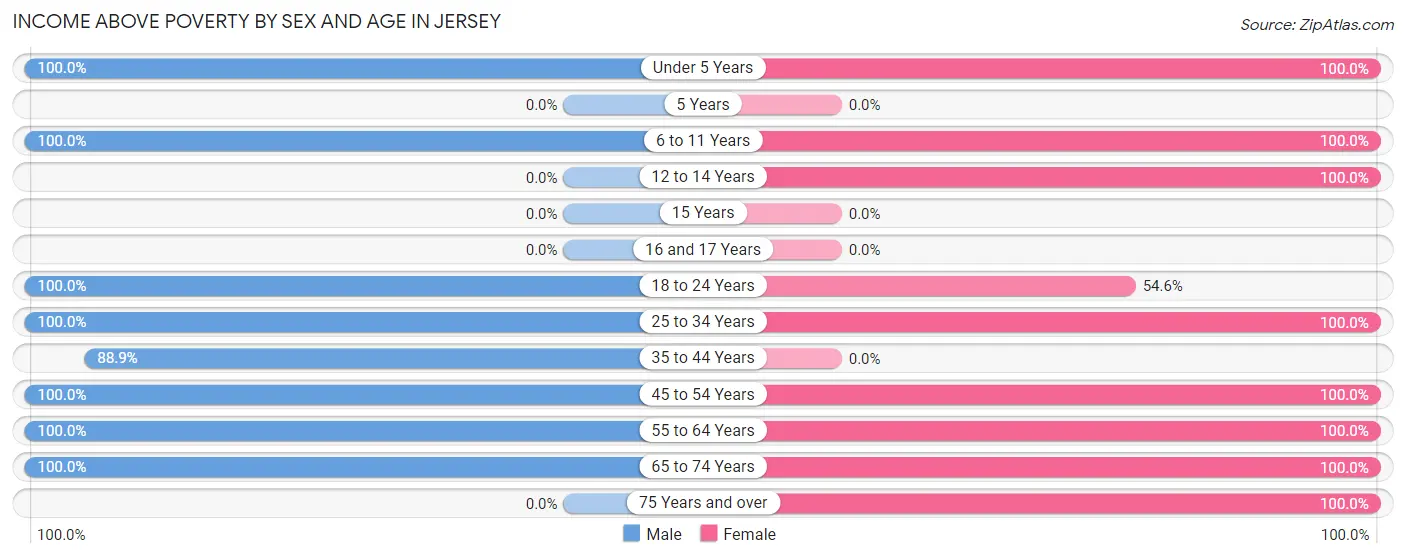
| Age Bracket | Male | Female |
| Under 5 Years | 10 (100.0%) | 7 (100.0%) |
| 5 Years | 0 (0.0%) | 0 (0.0%) |
| 6 to 11 Years | 22 (100.0%) | 8 (100.0%) |
| 12 to 14 Years | 0 (0.0%) | 2 (100.0%) |
| 15 Years | 0 (0.0%) | 0 (0.0%) |
| 16 and 17 Years | 0 (0.0%) | 0 (0.0%) |
| 18 to 24 Years | 8 (100.0%) | 6 (54.5%) |
| 25 to 34 Years | 3 (100.0%) | 19 (100.0%) |
| 35 to 44 Years | 16 (88.9%) | 0 (0.0%) |
| 45 to 54 Years | 2 (100.0%) | 15 (100.0%) |
| 55 to 64 Years | 13 (100.0%) | 3 (100.0%) |
| 65 to 74 Years | 4 (100.0%) | 6 (100.0%) |
| 75 Years and over | 0 (0.0%) | 10 (100.0%) |
| Total | 78 (96.3%) | 76 (91.6%) |
Income Below Poverty Among Married-Couple Families in Jersey
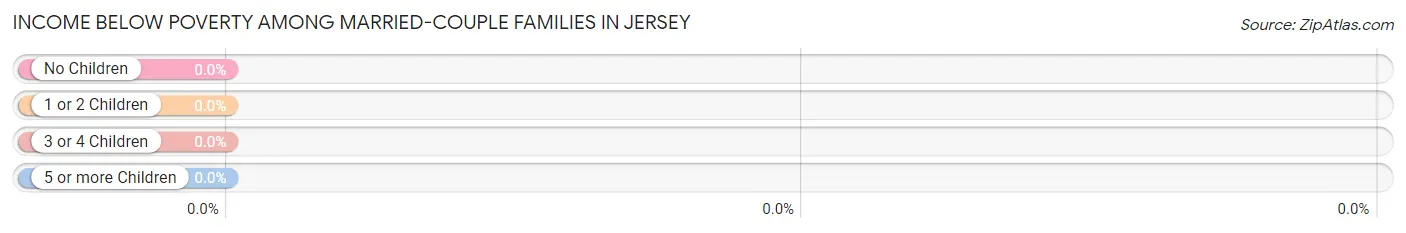
| Children | Above Poverty | Below Poverty |
| No Children | 4 (100.0%) | 0 (0.0%) |
| 1 or 2 Children | 15 (100.0%) | 0 (0.0%) |
| 3 or 4 Children | 4 (100.0%) | 0 (0.0%) |
| 5 or more Children | 0 (0.0%) | 0 (0.0%) |
| Total | 23 (100.0%) | 0 (0.0%) |
Income Below Poverty Among Single-Parent Households in Jersey
| Children | Single Father | Single Mother |
| No Children | 0 (0.0%) | 0 (0.0%) |
| 1 or 2 Children | 0 (0.0%) | 0 (0.0%) |
| 3 or 4 Children | 0 (0.0%) | 0 (0.0%) |
| 5 or more Children | 0 (0.0%) | 0 (0.0%) |
| Total | 0 (0.0%) | 0 (0.0%) |
Income Below Poverty Among Married-Couple vs Single-Parent Households in Jersey
| Children | Married-Couple Families | Single-Parent Households |
| No Children | 0 (0.0%) | 0 (0.0%) |
| 1 or 2 Children | 0 (0.0%) | 0 (0.0%) |
| 3 or 4 Children | 0 (0.0%) | 0 (0.0%) |
| 5 or more Children | 0 (0.0%) | 0 (0.0%) |
| Total | 0 (0.0%) | 0 (0.0%) |
Race in Jersey
The most populous races in Jersey are , and White / Caucasian (164 | 100.0%).
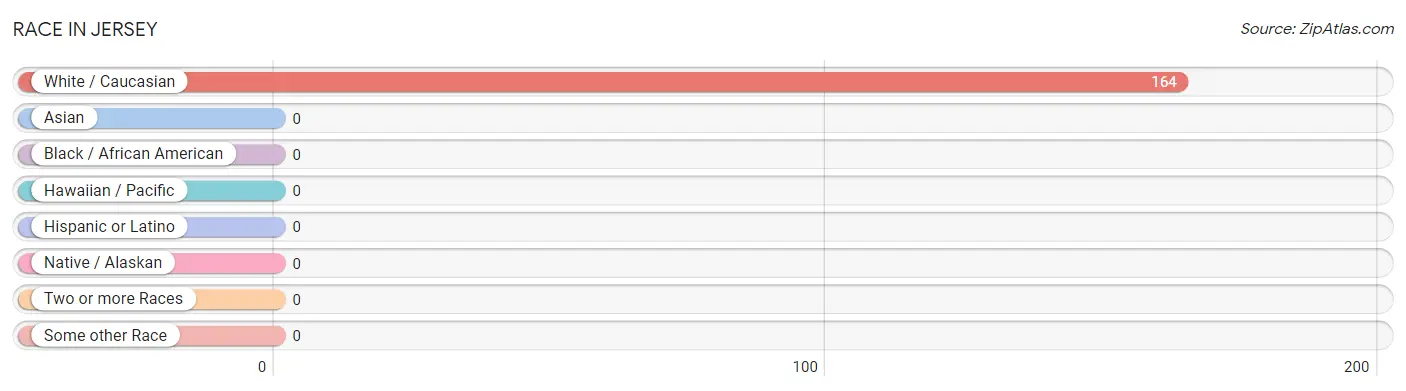
| Race | # Population | % Population |
| Asian | 0 | 0.0% |
| Black / African American | 0 | 0.0% |
| Hawaiian / Pacific | 0 | 0.0% |
| Hispanic or Latino | 0 | 0.0% |
| Native / Alaskan | 0 | 0.0% |
| White / Caucasian | 164 | 100.0% |
| Two or more Races | 0 | 0.0% |
| Some other Race | 0 | 0.0% |
| Total | 164 | 100.0% |
Ancestry in Jersey
The most populous ancestries reported in Jersey are English (58 | 35.4%), Irish (53 | 32.3%), American (33 | 20.1%), German (20 | 12.2%), and Italian (12 | 7.3%), together accounting for 107.3% of all Jersey residents.
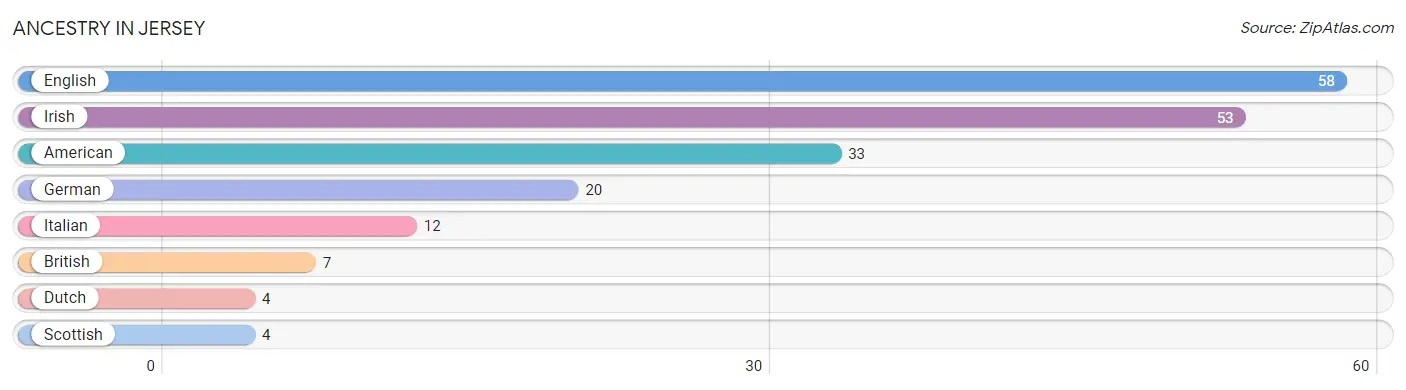
| Ancestry | # Population | % Population |
| American | 33 | 20.1% |
| British | 7 | 4.3% |
| Dutch | 4 | 2.4% |
| English | 58 | 35.4% |
| German | 20 | 12.2% |
| Irish | 53 | 32.3% |
| Italian | 12 | 7.3% |
| Scottish | 4 | 2.4% | View All 8 Rows |
Immigrants in Jersey

| Immigration Origin | # Population | % Population | View All 0 Rows |
Sex and Age in Jersey
Sex and Age in Jersey
The most populous age groups in Jersey are 35 to 39 Years (16 | 19.8%) for men and 30 to 34 Years (19 | 22.9%) for women.
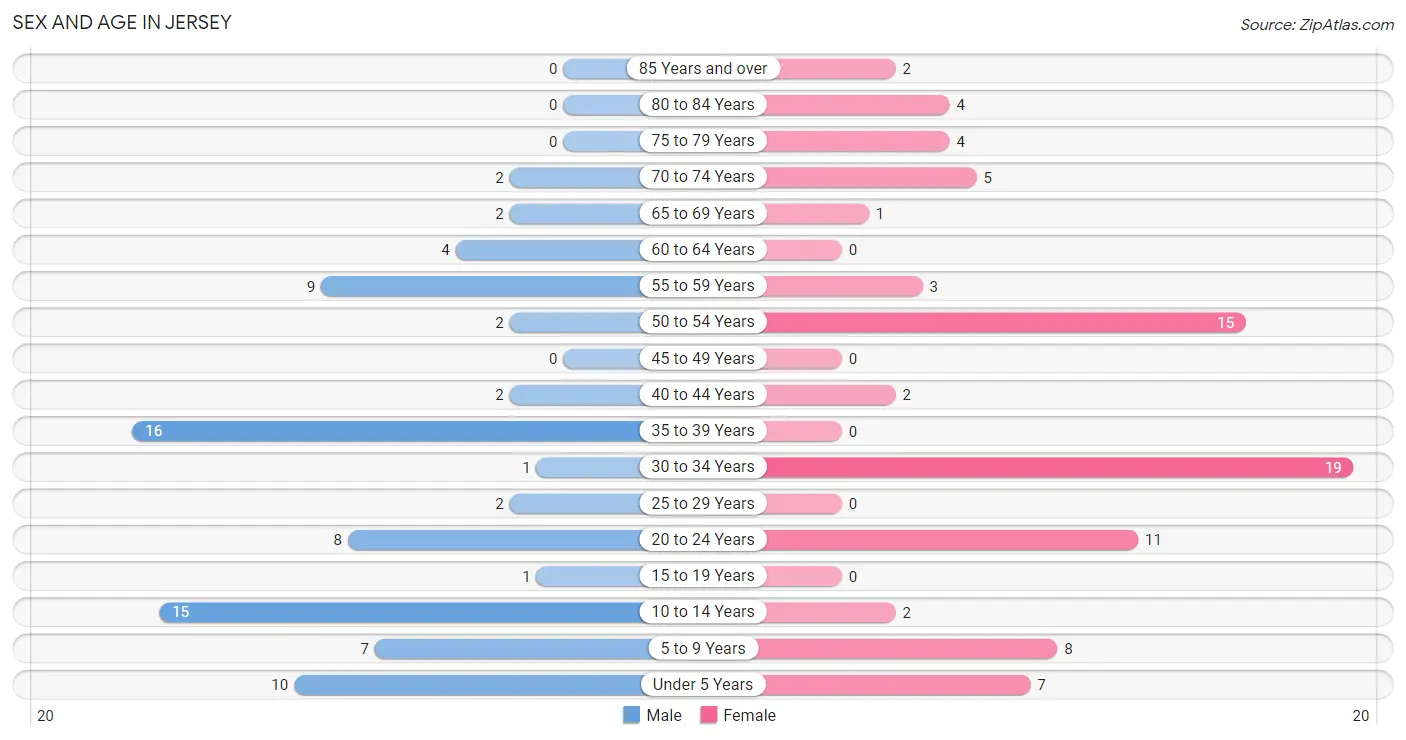
| Age Bracket | Male | Female |
| Under 5 Years | 10 (12.3%) | 7 (8.4%) |
| 5 to 9 Years | 7 (8.6%) | 8 (9.6%) |
| 10 to 14 Years | 15 (18.5%) | 2 (2.4%) |
| 15 to 19 Years | 1 (1.2%) | 0 (0.0%) |
| 20 to 24 Years | 8 (9.9%) | 11 (13.3%) |
| 25 to 29 Years | 2 (2.5%) | 0 (0.0%) |
| 30 to 34 Years | 1 (1.2%) | 19 (22.9%) |
| 35 to 39 Years | 16 (19.8%) | 0 (0.0%) |
| 40 to 44 Years | 2 (2.5%) | 2 (2.4%) |
| 45 to 49 Years | 0 (0.0%) | 0 (0.0%) |
| 50 to 54 Years | 2 (2.5%) | 15 (18.1%) |
| 55 to 59 Years | 9 (11.1%) | 3 (3.6%) |
| 60 to 64 Years | 4 (4.9%) | 0 (0.0%) |
| 65 to 69 Years | 2 (2.5%) | 1 (1.2%) |
| 70 to 74 Years | 2 (2.5%) | 5 (6.0%) |
| 75 to 79 Years | 0 (0.0%) | 4 (4.8%) |
| 80 to 84 Years | 0 (0.0%) | 4 (4.8%) |
| 85 Years and over | 0 (0.0%) | 2 (2.4%) |
| Total | 81 (100.0%) | 83 (100.0%) |
Families and Households in Jersey
Median Family Size in Jersey
The median family size in Jersey is 3.79 persons per family, with married-couple families (23 | 67.6%) accounting for the largest median family size of 4.43 persons per family. On the other hand, single male/father families (6 | 17.6%) represent the smallest median family size with 1.67 persons per family.
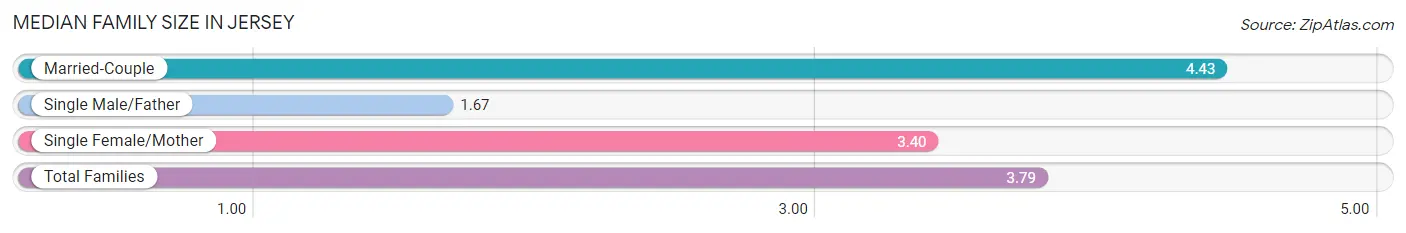
| Family Type | # Families | Family Size |
| Married-Couple | 23 (67.6%) | 4.43 |
| Single Male/Father | 6 (17.6%) | 1.67 |
| Single Female/Mother | 5 (14.7%) | 3.40 |
| Total Families | 34 (100.0%) | 3.79 |
Median Household Size in Jersey
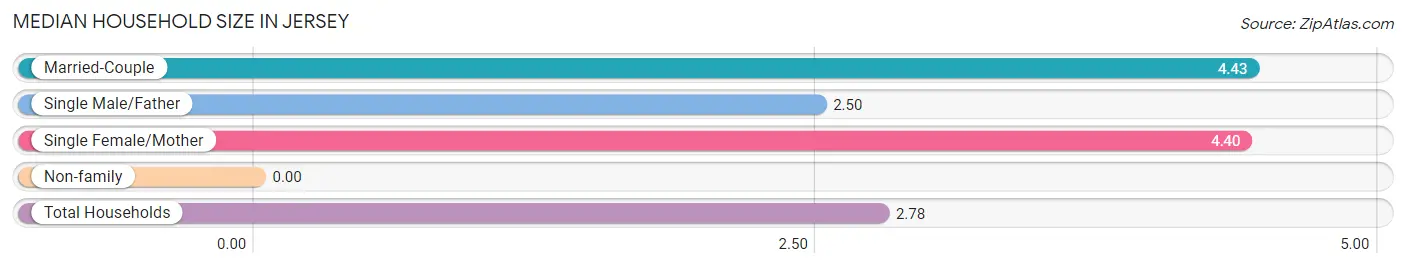
| Household Type | # Households | Household Size |
| Married-Couple | 23 (39.0%) | 4.43 |
| Single Male/Father | 6 (10.2%) | 2.50 |
| Single Female/Mother | 5 (8.5%) | 4.40 |
| Non-family | 25 (42.4%) | - |
| Total Households | 59 (100.0%) | 2.78 |
Household Size by Marriage Status in Jersey
Out of a total of 59 households in Jersey, 34 (57.6%) are family households, while 25 (42.4%) are nonfamily households. The most numerous type of family households are 5-person households, comprising 16, and the most common type of nonfamily households are 1-person households, comprising 25.
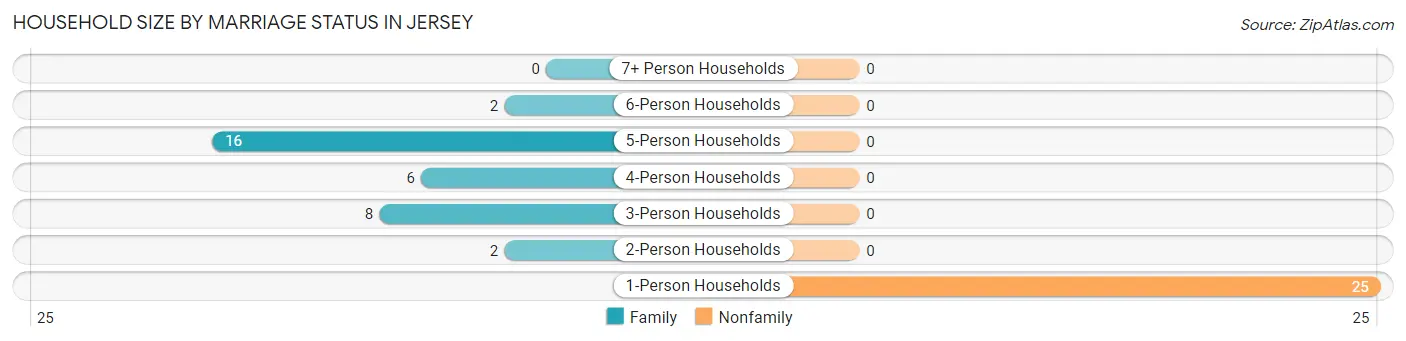
| Household Size | Family Households | Nonfamily Households |
| 1-Person Households | - | 25 (42.4%) |
| 2-Person Households | 2 (3.4%) | 0 (0.0%) |
| 3-Person Households | 8 (13.6%) | 0 (0.0%) |
| 4-Person Households | 6 (10.2%) | 0 (0.0%) |
| 5-Person Households | 16 (27.1%) | 0 (0.0%) |
| 6-Person Households | 2 (3.4%) | 0 (0.0%) |
| 7+ Person Households | 0 (0.0%) | 0 (0.0%) |
| Total | 34 (57.6%) | 25 (42.4%) |
Female Fertility in Jersey
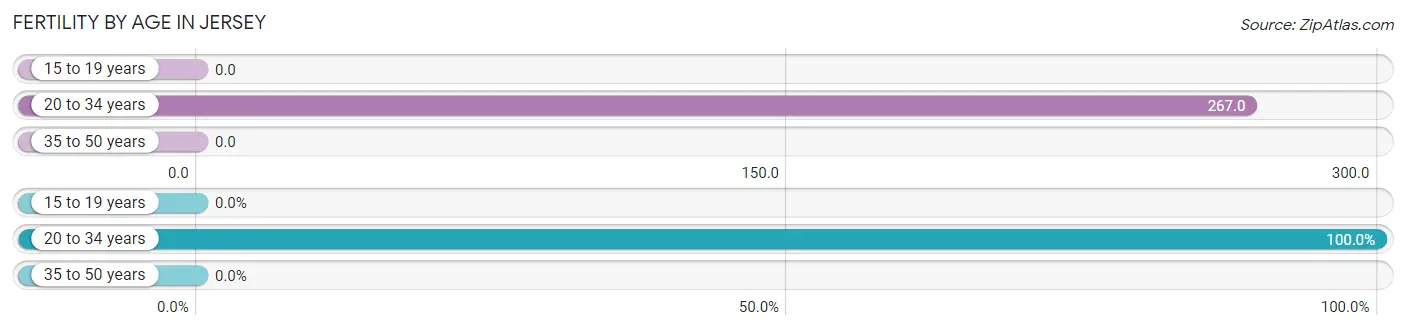
Fertility by Age in Jersey
Average fertility rate in Jersey is 229.0 births per 1,000 women. Women in the age bracket of 20 to 34 years have the highest fertility rate with 267.0 births per 1,000 women. Women in the age bracket of 20 to 34 years acount for 100.0% of all women with births.
| Age Bracket | Women with Births | Births / 1,000 Women |
| 15 to 19 years | 0 (0.0%) | 0.0 |
| 20 to 34 years | 8 (100.0%) | 267.0 |
| 35 to 50 years | 0 (0.0%) | 0.0 |
| Total | 8 (100.0%) | 229.0 |
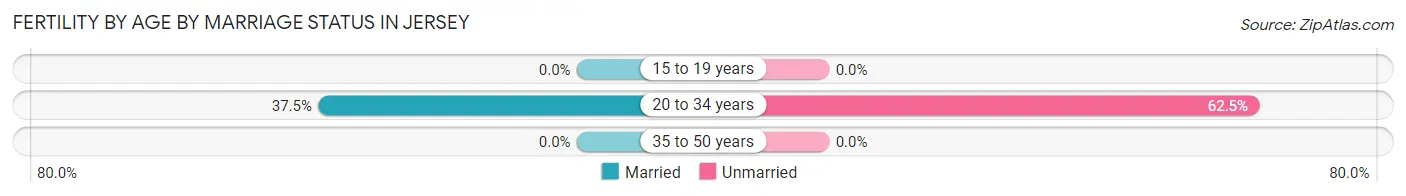
Fertility by Age by Marriage Status in Jersey
37.5% of women with births (8) in Jersey are married. The highest percentage of unmarried women with births falls into 20 to 34 years age bracket with 62.5% of them unmarried at the time of birth, while the lowest percentage of unmarried women with births belong to 20 to 34 years age bracket with 62.5% of them unmarried.
| Age Bracket | Married | Unmarried |
| 15 to 19 years | 0 (0.0%) | 0 (0.0%) |
| 20 to 34 years | 3 (37.5%) | 5 (62.5%) |
| 35 to 50 years | 0 (0.0%) | 0 (0.0%) |
| Total | 3 (37.5%) | 5 (62.5%) |
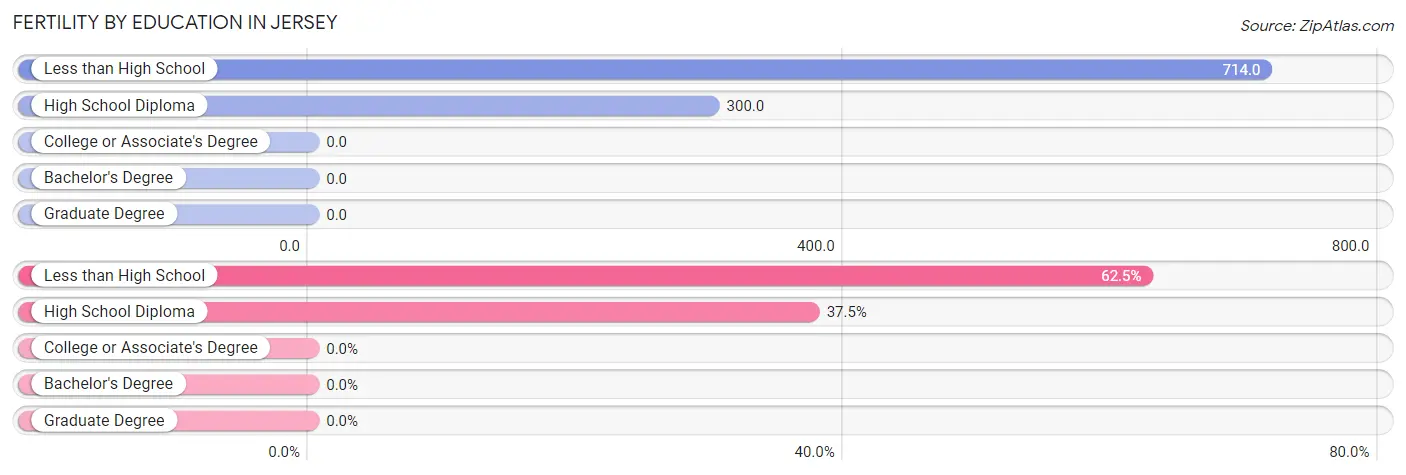
Fertility by Education in Jersey
| Educational Attainment | Women with Births | Births / 1,000 Women |
| Less than High School | 5 (62.5%) | 714.0 |
| High School Diploma | 3 (37.5%) | 300.0 |
| College or Associate's Degree | 0 (0.0%) | 0.0 |
| Bachelor's Degree | 0 (0.0%) | 0.0 |
| Graduate Degree | 0 (0.0%) | 0.0 |
| Total | 8 (100.0%) | 229.0 |
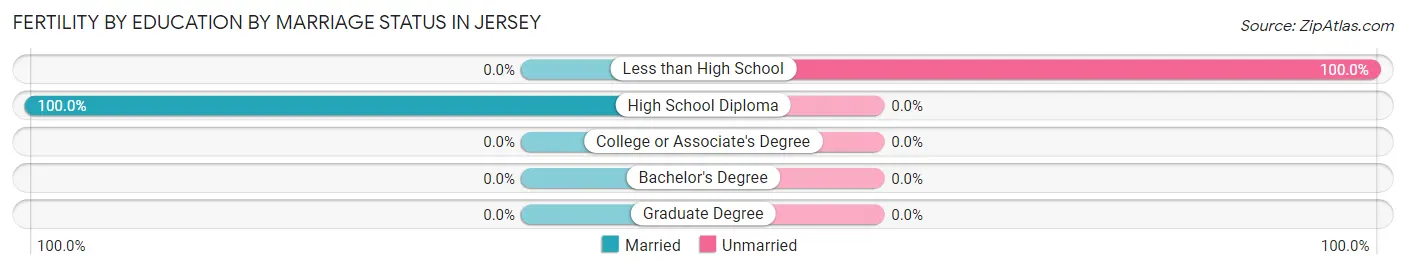
Fertility by Education by Marriage Status in Jersey
62.5% of women with births in Jersey are unmarried. Women with the educational attainment of high school diploma are most likely to be married with 100.0% of them married at childbirth, while women with the educational attainment of less than high school are least likely to be married with 100.0% of them unmarried at childbirth.
| Educational Attainment | Married | Unmarried |
| Less than High School | 0 (0.0%) | 5 (100.0%) |
| High School Diploma | 3 (100.0%) | 0 (0.0%) |
| College or Associate's Degree | 0 (0.0%) | 0 (0.0%) |
| Bachelor's Degree | 0 (0.0%) | 0 (0.0%) |
| Graduate Degree | 0 (0.0%) | 0 (0.0%) |
| Total | 3 (37.5%) | 5 (62.5%) |
Employment Characteristics in Jersey
Employment by Class of Employer in Jersey
Among the 60 employed individuals in Jersey, private company employees (44 | 73.3%), state government employees (12 | 20.0%), and self-employed (incorporated) (2 | 3.3%) make up the most common classes of employment.
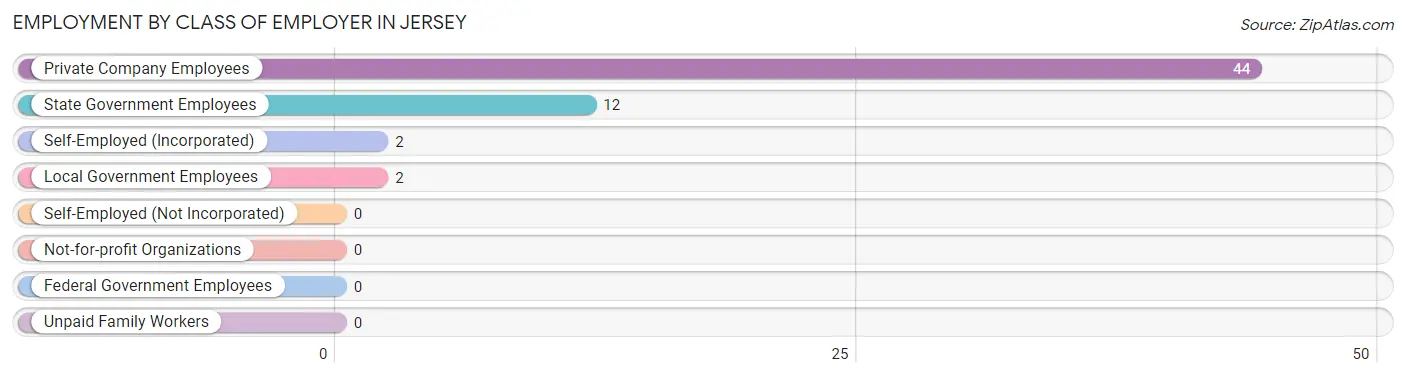
| Employer Class | # Employees | % Employees |
| Private Company Employees | 44 | 73.3% |
| Self-Employed (Incorporated) | 2 | 3.3% |
| Self-Employed (Not Incorporated) | 0 | 0.0% |
| Not-for-profit Organizations | 0 | 0.0% |
| Local Government Employees | 2 | 3.3% |
| State Government Employees | 12 | 20.0% |
| Federal Government Employees | 0 | 0.0% |
| Unpaid Family Workers | 0 | 0.0% |
| Total | 60 | 100.0% |
Employment Status by Age in Jersey
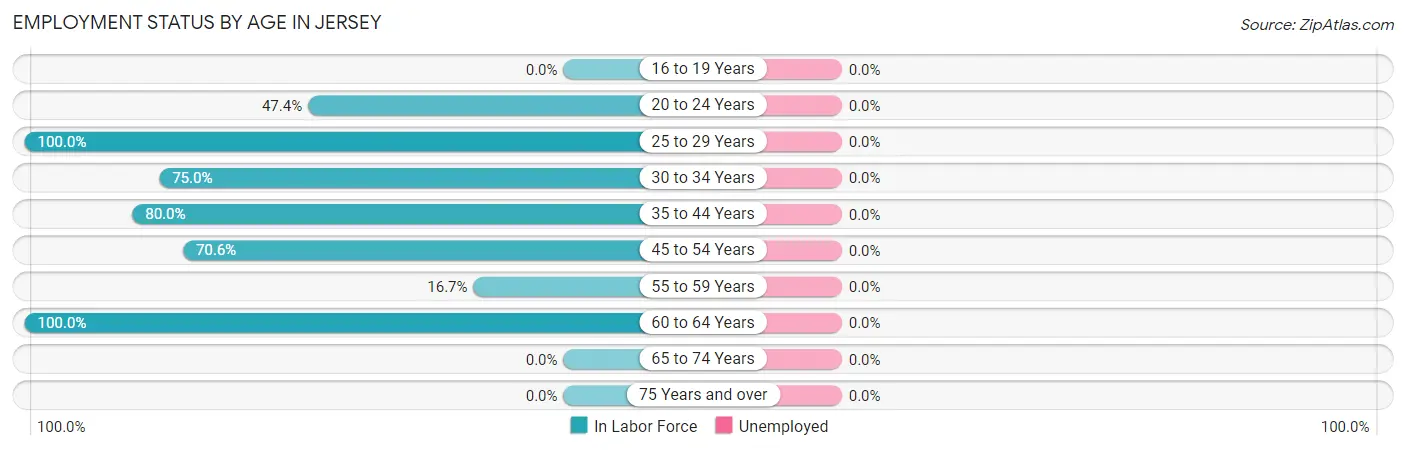
| Age Bracket | In Labor Force | Unemployed |
| 16 to 19 Years | 0 (0.0%) | 0 (0.0%) |
| 20 to 24 Years | 9 (47.4%) | 0 (0.0%) |
| 25 to 29 Years | 2 (100.0%) | 0 (0.0%) |
| 30 to 34 Years | 15 (75.0%) | 0 (0.0%) |
| 35 to 44 Years | 16 (80.0%) | 0 (0.0%) |
| 45 to 54 Years | 12 (70.6%) | 0 (0.0%) |
| 55 to 59 Years | 2 (16.7%) | 0 (0.0%) |
| 60 to 64 Years | 4 (100.0%) | 0 (0.0%) |
| 65 to 74 Years | 0 (0.0%) | 0 (0.0%) |
| 75 Years and over | 0 (0.0%) | 0 (0.0%) |
| Total | 60 (52.2%) | 0 (0.0%) |
Employment Status by Educational Attainment in Jersey
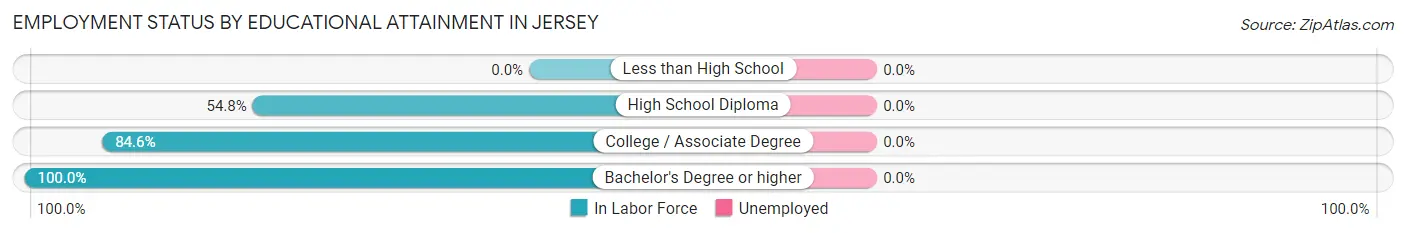
| Educational Attainment | In Labor Force | Unemployed |
| Less than High School | 0 (0.0%) | 0 (0.0%) |
| High School Diploma | 17 (54.8%) | 0 (0.0%) |
| College / Associate Degree | 22 (84.6%) | 0 (0.0%) |
| Bachelor's Degree or higher | 12 (100.0%) | 0 (0.0%) |
| Total | 51 (68.0%) | 0 (0.0%) |
Employment Occupations by Sex in Jersey
Management, Business, Science and Arts Occupations
The most common Management, Business, Science and Arts occupations in Jersey are , and Management (12 | 20.0%).
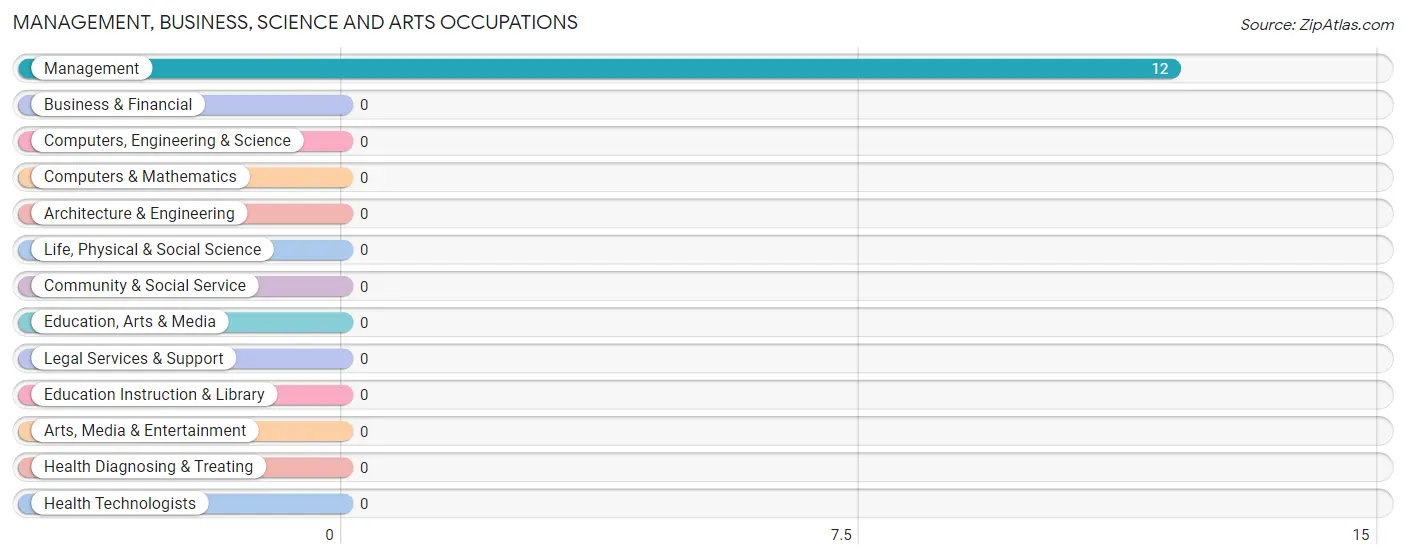
Management, Business, Science and Arts Occupations by Sex
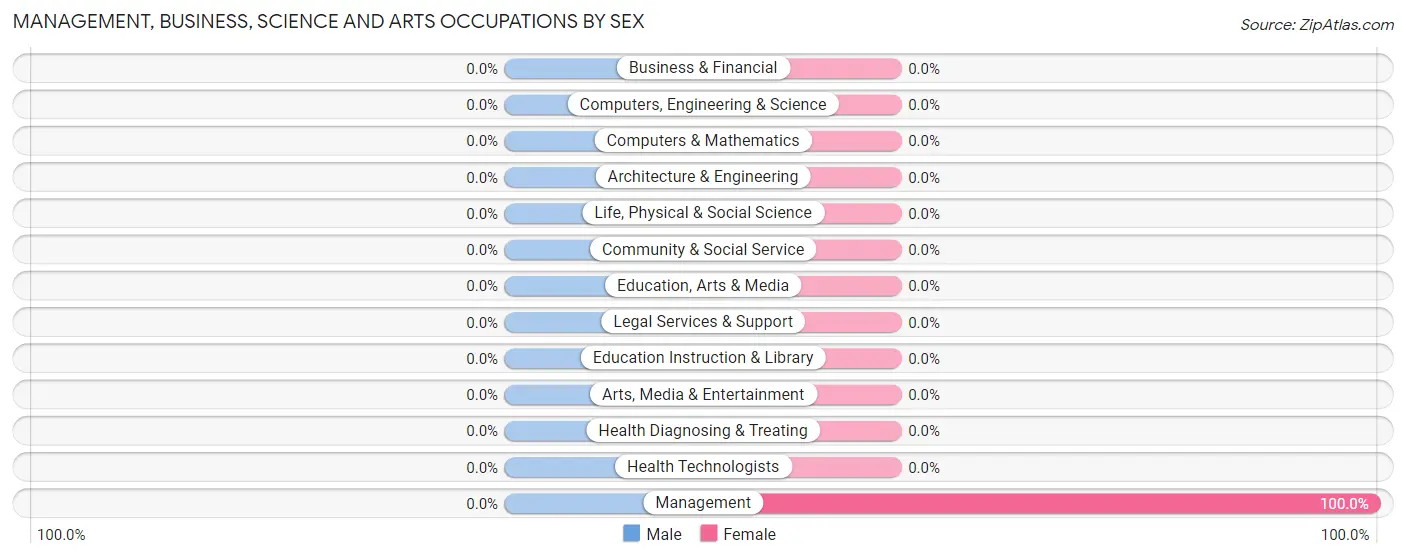
| Occupation | Male | Female |
| Management | 0 (0.0%) | 12 (100.0%) |
| Business & Financial | 0 (0.0%) | 0 (0.0%) |
| Computers, Engineering & Science | 0 (0.0%) | 0 (0.0%) |
| Computers & Mathematics | 0 (0.0%) | 0 (0.0%) |
| Architecture & Engineering | 0 (0.0%) | 0 (0.0%) |
| Life, Physical & Social Science | 0 (0.0%) | 0 (0.0%) |
| Community & Social Service | 0 (0.0%) | 0 (0.0%) |
| Education, Arts & Media | 0 (0.0%) | 0 (0.0%) |
| Legal Services & Support | 0 (0.0%) | 0 (0.0%) |
| Education Instruction & Library | 0 (0.0%) | 0 (0.0%) |
| Arts, Media & Entertainment | 0 (0.0%) | 0 (0.0%) |
| Health Diagnosing & Treating | 0 (0.0%) | 0 (0.0%) |
| Health Technologists | 0 (0.0%) | 0 (0.0%) |
| Total (Category) | 0 (0.0%) | 12 (100.0%) |
| Total (Overall) | 29 (48.3%) | 31 (51.7%) |
Services Occupations
Services Occupations by Sex
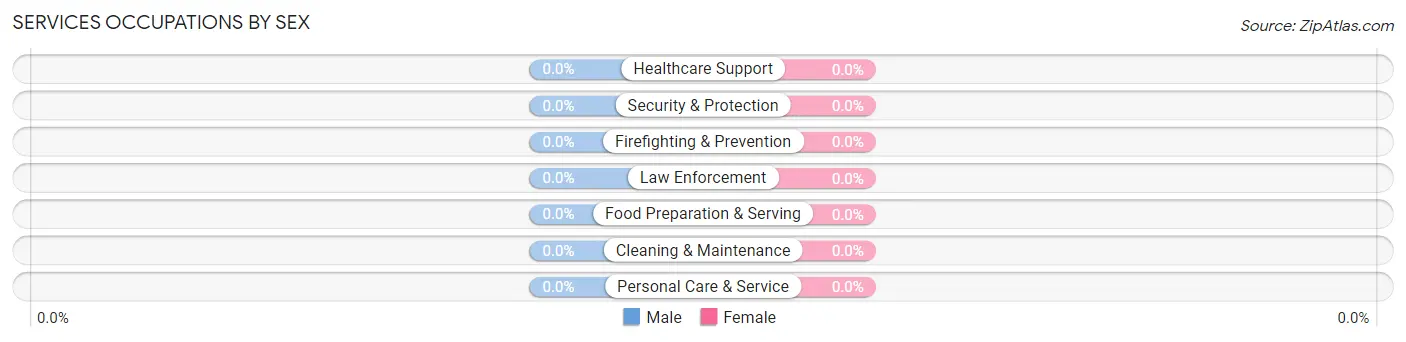
| Occupation | Male | Female |
| Healthcare Support | 0 (0.0%) | 0 (0.0%) |
| Security & Protection | 0 (0.0%) | 0 (0.0%) |
| Firefighting & Prevention | 0 (0.0%) | 0 (0.0%) |
| Law Enforcement | 0 (0.0%) | 0 (0.0%) |
| Food Preparation & Serving | 0 (0.0%) | 0 (0.0%) |
| Cleaning & Maintenance | 0 (0.0%) | 0 (0.0%) |
| Personal Care & Service | 0 (0.0%) | 0 (0.0%) |
| Total (Category) | 0 (0.0%) | 0 (0.0%) |
| Total (Overall) | 29 (48.3%) | 31 (51.7%) |
Sales and Office Occupations
The most common Sales and Office occupations in Jersey are Office & Administration (16 | 26.7%), and Sales & Related (3 | 5.0%).

Sales and Office Occupations by Sex

| Occupation | Male | Female |
| Sales & Related | 0 (0.0%) | 3 (100.0%) |
| Office & Administration | 14 (87.5%) | 2 (12.5%) |
| Total (Category) | 14 (73.7%) | 5 (26.3%) |
| Total (Overall) | 29 (48.3%) | 31 (51.7%) |
Natural Resources, Construction and Maintenance Occupations
The most common Natural Resources, Construction and Maintenance occupations in Jersey are Construction & Extraction (5 | 8.3%), and Farming, Fishing & Forestry (2 | 3.3%).
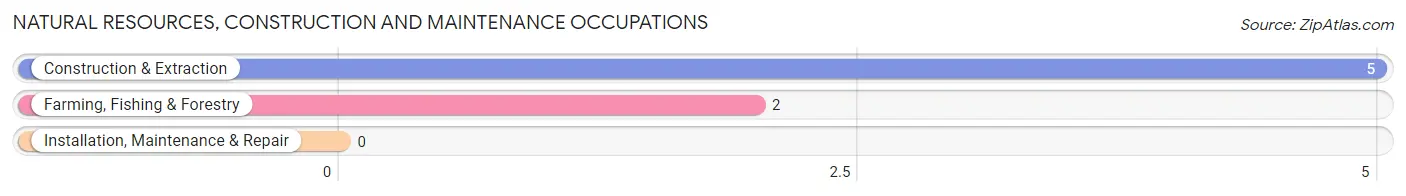
Natural Resources, Construction and Maintenance Occupations by Sex
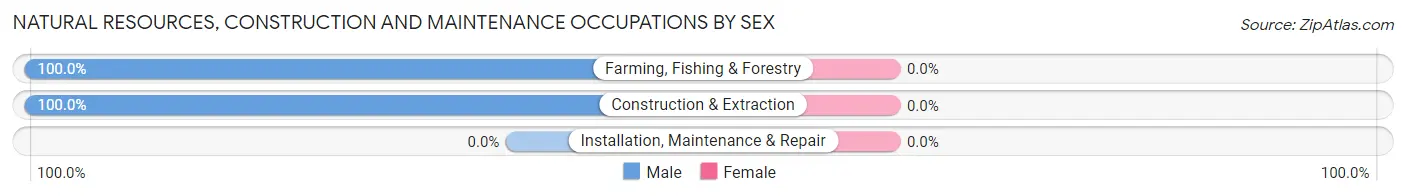
| Occupation | Male | Female |
| Farming, Fishing & Forestry | 2 (100.0%) | 0 (0.0%) |
| Construction & Extraction | 5 (100.0%) | 0 (0.0%) |
| Installation, Maintenance & Repair | 0 (0.0%) | 0 (0.0%) |
| Total (Category) | 7 (100.0%) | 0 (0.0%) |
| Total (Overall) | 29 (48.3%) | 31 (51.7%) |
Production, Transportation and Moving Occupations
The most common Production, Transportation and Moving occupations in Jersey are Material Moving (14 | 23.3%), and Production (8 | 13.3%).
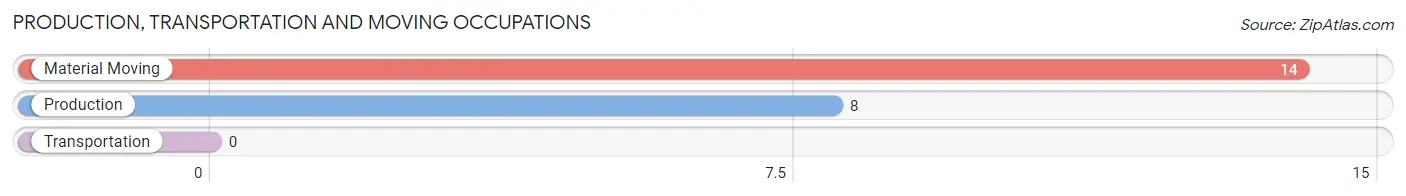
Production, Transportation and Moving Occupations by Sex
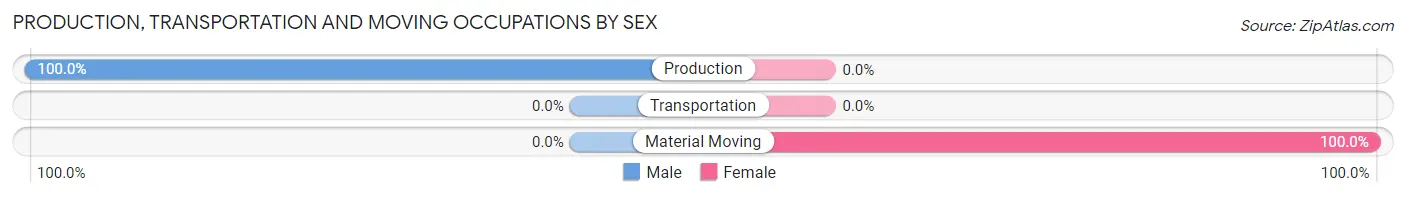
| Occupation | Male | Female |
| Production | 8 (100.0%) | 0 (0.0%) |
| Transportation | 0 (0.0%) | 0 (0.0%) |
| Material Moving | 0 (0.0%) | 14 (100.0%) |
| Total (Category) | 8 (36.4%) | 14 (63.6%) |
| Total (Overall) | 29 (48.3%) | 31 (51.7%) |
Employment Industries by Sex in Jersey
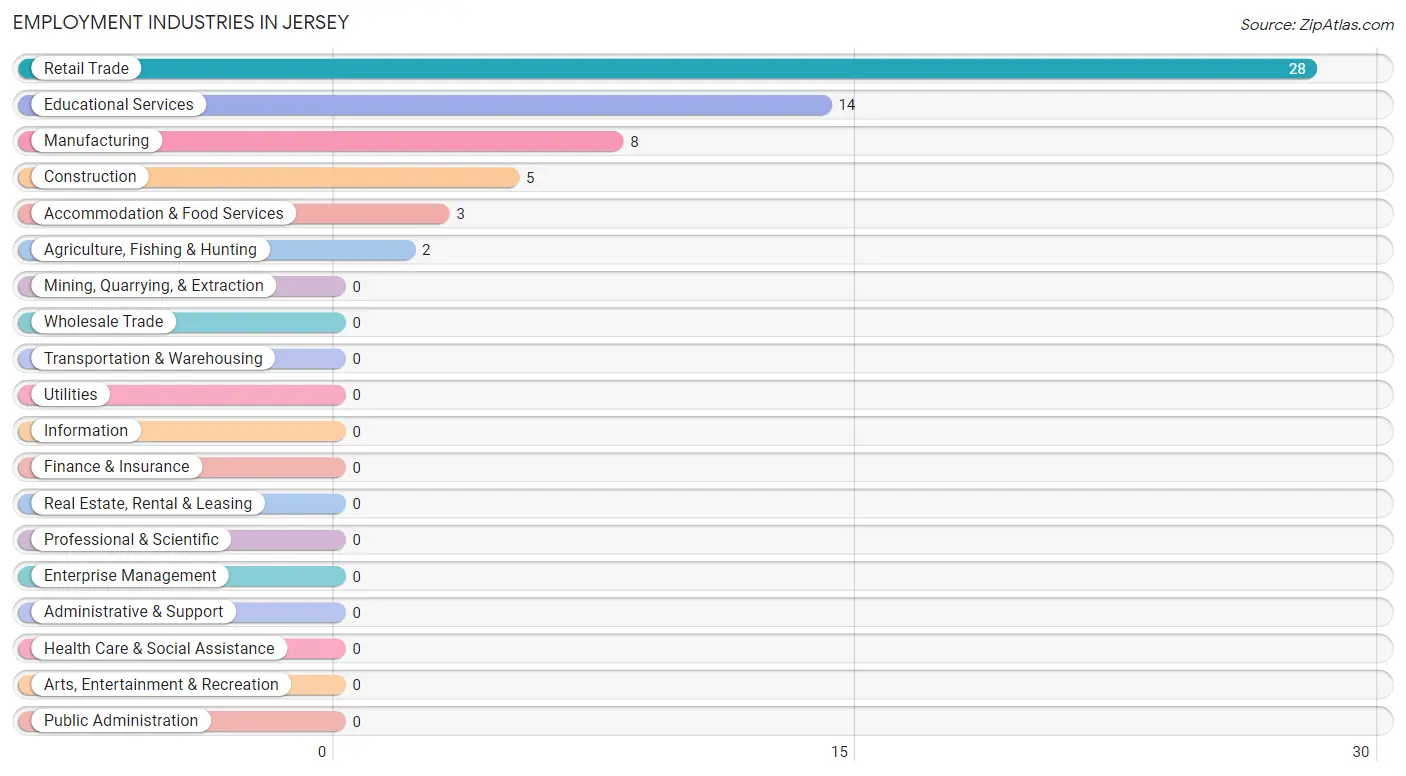
Employment Industries in Jersey
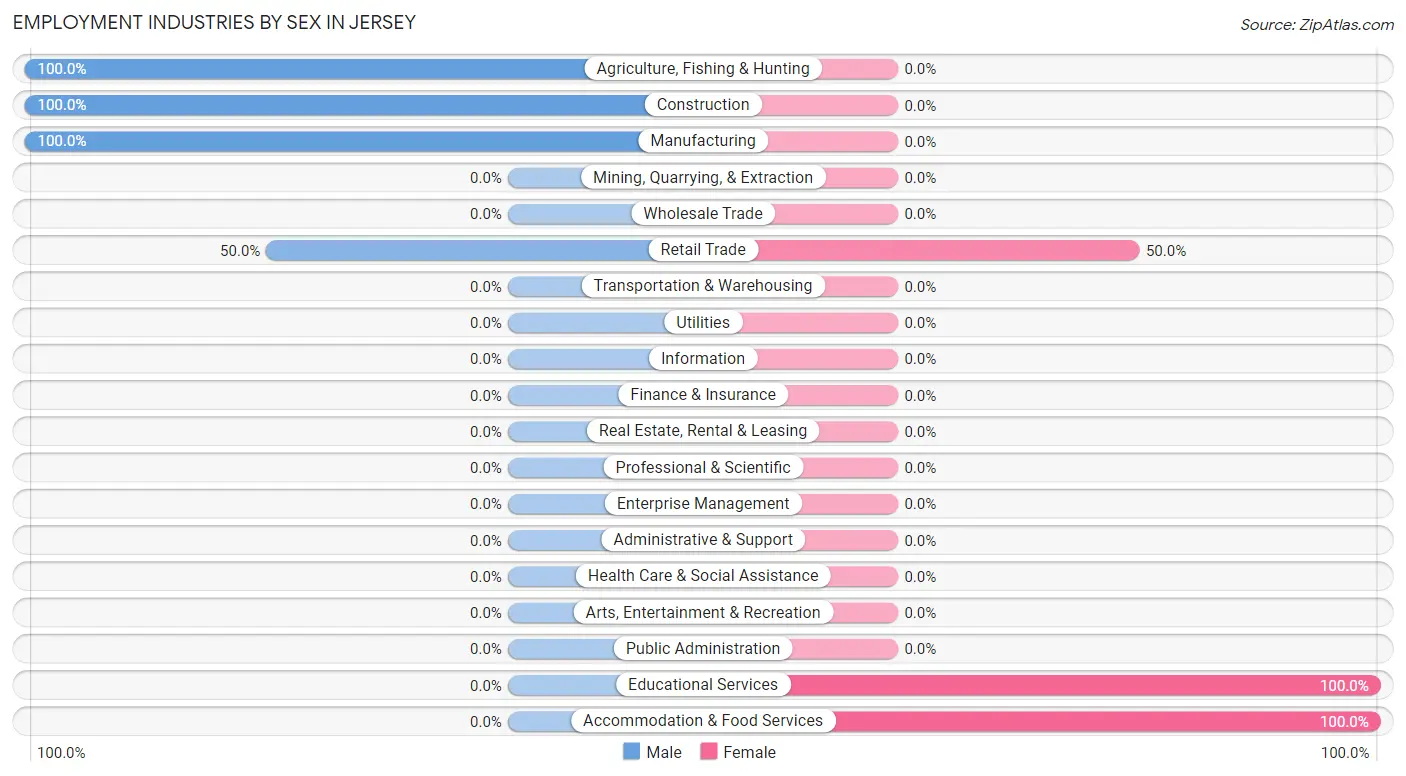
The major employment industries in Jersey include Retail Trade (28 | 46.7%), Educational Services (14 | 23.3%), Manufacturing (8 | 13.3%), Construction (5 | 8.3%), and Accommodation & Food Services (3 | 5.0%).
Employment Industries by Sex in Jersey
The Jersey industries that see more men than women are Agriculture, Fishing & Hunting (100.0%), Construction (100.0%), and Manufacturing (100.0%), whereas the industries that tend to have a higher number of women are Educational Services (100.0%), Accommodation & Food Services (100.0%), and Retail Trade (50.0%).
| Industry | Male | Female |
| Agriculture, Fishing & Hunting | 2 (100.0%) | 0 (0.0%) |
| Mining, Quarrying, & Extraction | 0 (0.0%) | 0 (0.0%) |
| Construction | 5 (100.0%) | 0 (0.0%) |
| Manufacturing | 8 (100.0%) | 0 (0.0%) |
| Wholesale Trade | 0 (0.0%) | 0 (0.0%) |
| Retail Trade | 14 (50.0%) | 14 (50.0%) |
| Transportation & Warehousing | 0 (0.0%) | 0 (0.0%) |
| Utilities | 0 (0.0%) | 0 (0.0%) |
| Information | 0 (0.0%) | 0 (0.0%) |
| Finance & Insurance | 0 (0.0%) | 0 (0.0%) |
| Real Estate, Rental & Leasing | 0 (0.0%) | 0 (0.0%) |
| Professional & Scientific | 0 (0.0%) | 0 (0.0%) |
| Enterprise Management | 0 (0.0%) | 0 (0.0%) |
| Administrative & Support | 0 (0.0%) | 0 (0.0%) |
| Educational Services | 0 (0.0%) | 14 (100.0%) |
| Health Care & Social Assistance | 0 (0.0%) | 0 (0.0%) |
| Arts, Entertainment & Recreation | 0 (0.0%) | 0 (0.0%) |
| Accommodation & Food Services | 0 (0.0%) | 3 (100.0%) |
| Public Administration | 0 (0.0%) | 0 (0.0%) |
| Total | 29 (48.3%) | 31 (51.7%) |
Education in Jersey
School Enrollment in Jersey
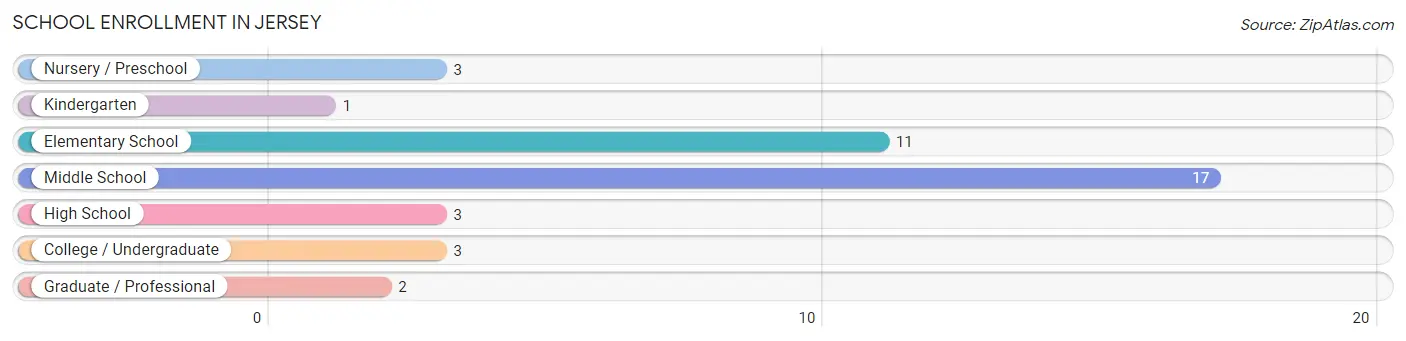
The most common levels of schooling among the 40 students in Jersey are middle school (17 | 42.5%), elementary school (11 | 27.5%), and nursery / preschool (3 | 7.5%).
| School Level | # Students | % Students |
| Nursery / Preschool | 3 | 7.5% |
| Kindergarten | 1 | 2.5% |
| Elementary School | 11 | 27.5% |
| Middle School | 17 | 42.5% |
| High School | 3 | 7.5% |
| College / Undergraduate | 3 | 7.5% |
| Graduate / Professional | 2 | 5.0% |
| Total | 40 | 100.0% |
School Enrollment by Age by Funding Source in Jersey
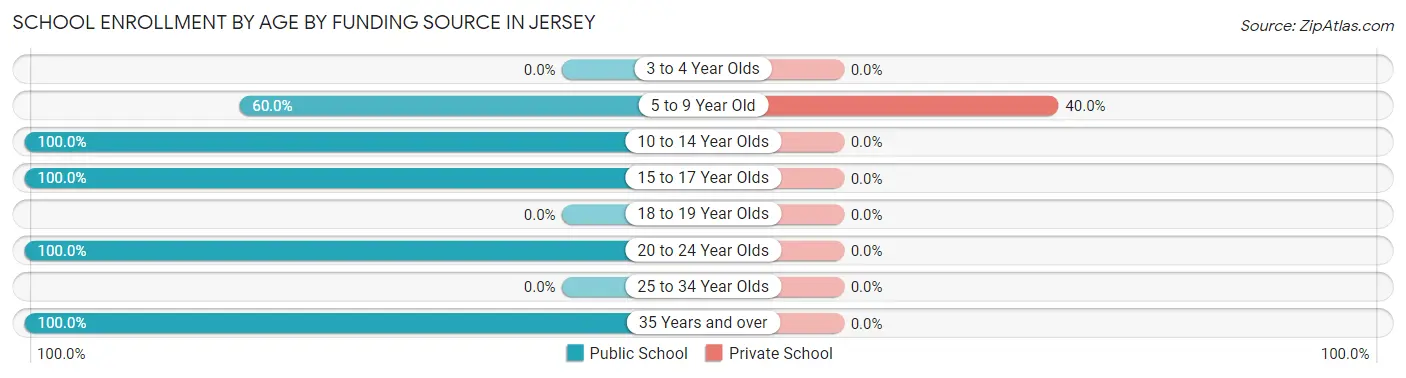
Out of a total of 40 students who are enrolled in schools in Jersey, 6 (15.0%) attend a private institution, while the remaining 34 (85.0%) are enrolled in public schools. The age group of 5 to 9 year old has the highest likelihood of being enrolled in private schools, with 6 (40.0% in the age bracket) enrolled. Conversely, the age group of 10 to 14 year olds has the lowest likelihood of being enrolled in a private school, with 17 (100.0% in the age bracket) attending a public institution.
| Age Bracket | Public School | Private School |
| 3 to 4 Year Olds | 0 (0.0%) | 0 (0.0%) |
| 5 to 9 Year Old | 9 (60.0%) | 6 (40.0%) |
| 10 to 14 Year Olds | 17 (100.0%) | 0 (0.0%) |
| 15 to 17 Year Olds | 1 (100.0%) | 0 (0.0%) |
| 18 to 19 Year Olds | 0 (0.0%) | 0 (0.0%) |
| 20 to 24 Year Olds | 5 (100.0%) | 0 (0.0%) |
| 25 to 34 Year Olds | 0 (0.0%) | 0 (0.0%) |
| 35 Years and over | 2 (100.0%) | 0 (0.0%) |
| Total | 34 (85.0%) | 6 (15.0%) |
Educational Attainment by Field of Study in Jersey
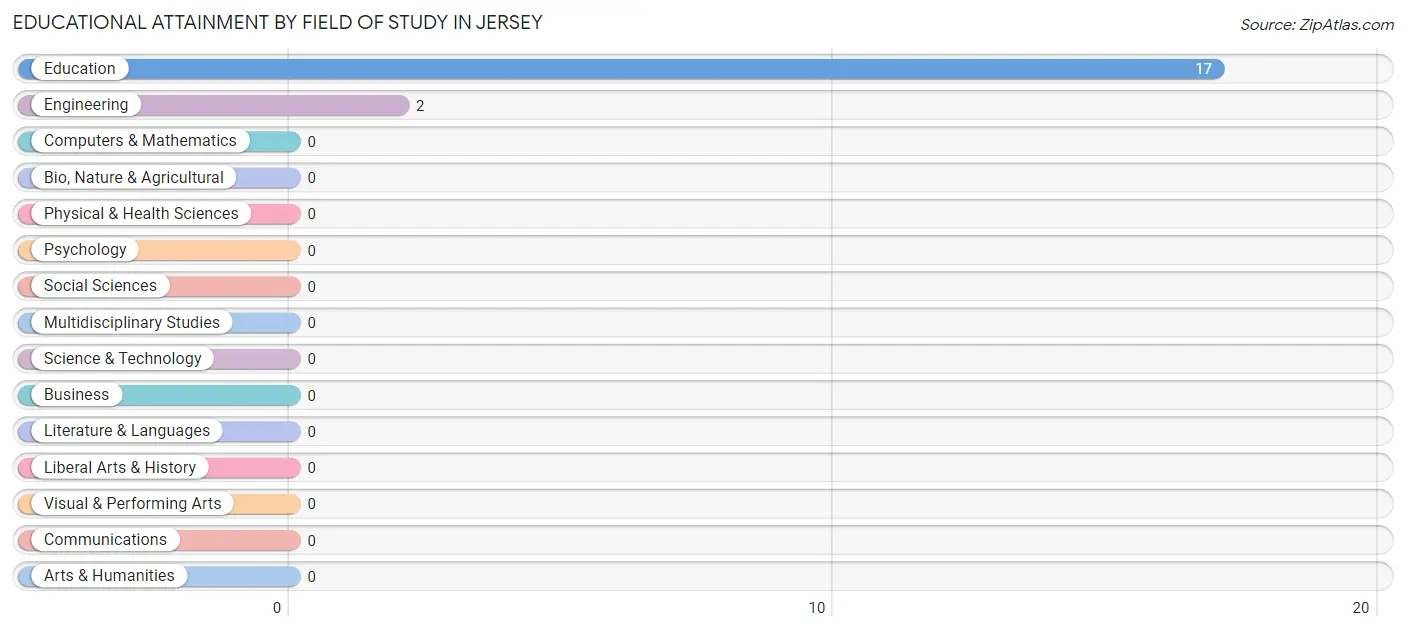
Education (17 | 89.5%), and engineering (2 | 10.5%) are the most common fields of study among 19 individuals in Jersey who have obtained a bachelor's degree or higher.
| Field of Study | # Graduates | % Graduates |
| Computers & Mathematics | 0 | 0.0% |
| Bio, Nature & Agricultural | 0 | 0.0% |
| Physical & Health Sciences | 0 | 0.0% |
| Psychology | 0 | 0.0% |
| Social Sciences | 0 | 0.0% |
| Engineering | 2 | 10.5% |
| Multidisciplinary Studies | 0 | 0.0% |
| Science & Technology | 0 | 0.0% |
| Business | 0 | 0.0% |
| Education | 17 | 89.5% |
| Literature & Languages | 0 | 0.0% |
| Liberal Arts & History | 0 | 0.0% |
| Visual & Performing Arts | 0 | 0.0% |
| Communications | 0 | 0.0% |
| Arts & Humanities | 0 | 0.0% |
| Total | 19 | 100.0% |
Transportation & Commute in Jersey
Vehicle Availability by Sex in Jersey
The most prevalent vehicle ownership categories in Jersey are males with 2 vehicles (15, accounting for 51.7%) and females with 2 vehicles (0, making up 48.4%).
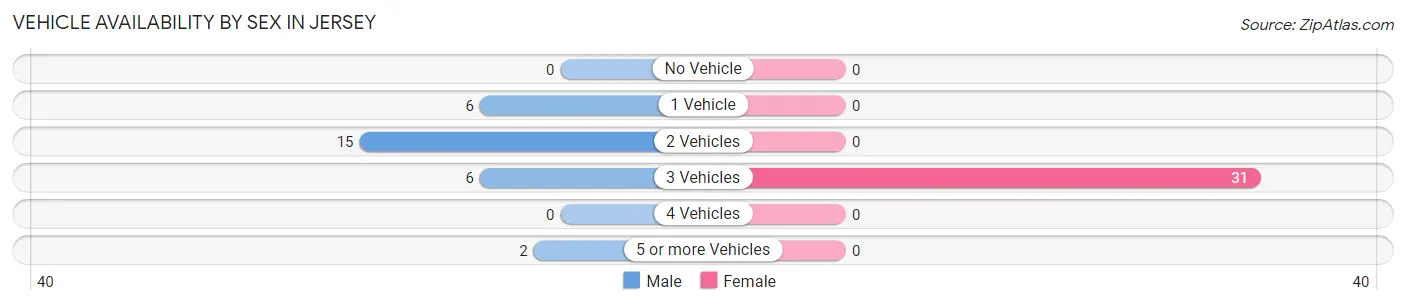
| Vehicles Available | Male | Female |
| No Vehicle | 0 (0.0%) | 0 (0.0%) |
| 1 Vehicle | 6 (20.7%) | 0 (0.0%) |
| 2 Vehicles | 15 (51.7%) | 0 (0.0%) |
| 3 Vehicles | 6 (20.7%) | 31 (100.0%) |
| 4 Vehicles | 0 (0.0%) | 0 (0.0%) |
| 5 or more Vehicles | 2 (6.9%) | 0 (0.0%) |
| Total | 29 (100.0%) | 31 (100.0%) |
Commute Time in Jersey
The most frequently occuring commute durations in Jersey are 20 to 24 minutes (28 commuters, 46.7%), 25 to 29 minutes (12 commuters, 20.0%), and 15 to 19 minutes (6 commuters, 10.0%).
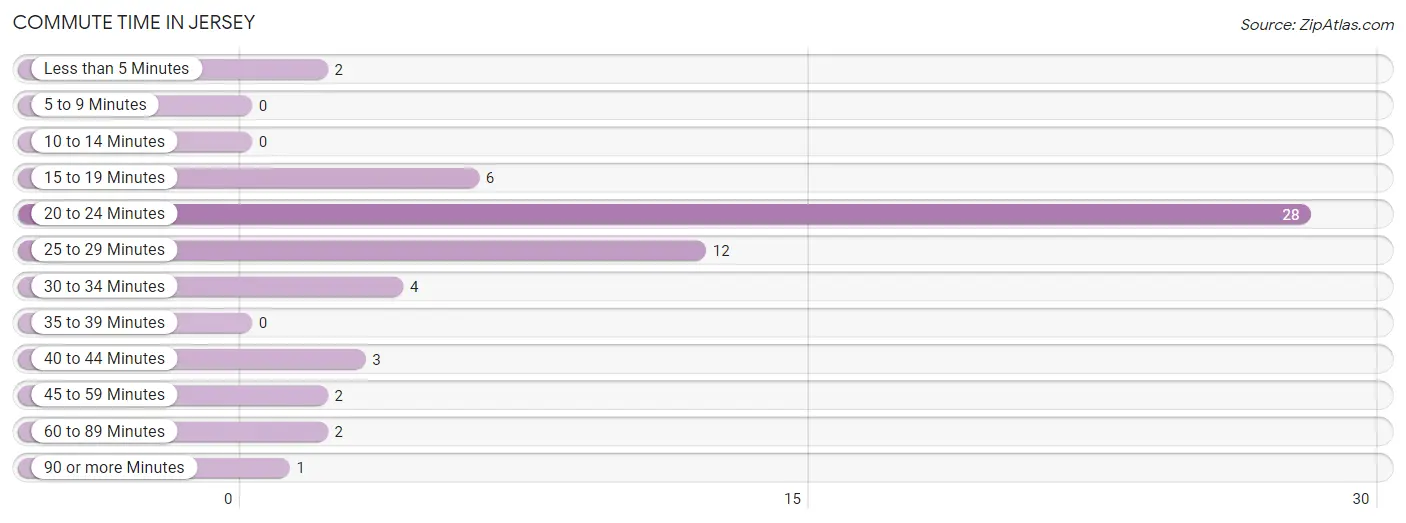
| Commute Time | # Commuters | % Commuters |
| Less than 5 Minutes | 2 | 3.3% |
| 5 to 9 Minutes | 0 | 0.0% |
| 10 to 14 Minutes | 0 | 0.0% |
| 15 to 19 Minutes | 6 | 10.0% |
| 20 to 24 Minutes | 28 | 46.7% |
| 25 to 29 Minutes | 12 | 20.0% |
| 30 to 34 Minutes | 4 | 6.7% |
| 35 to 39 Minutes | 0 | 0.0% |
| 40 to 44 Minutes | 3 | 5.0% |
| 45 to 59 Minutes | 2 | 3.3% |
| 60 to 89 Minutes | 2 | 3.3% |
| 90 or more Minutes | 1 | 1.7% |
Commute Time by Sex in Jersey
The most common commute times in Jersey are 25 to 29 minutes (12 commuters, 41.4%) for males and 20 to 24 minutes (28 commuters, 90.3%) for females.
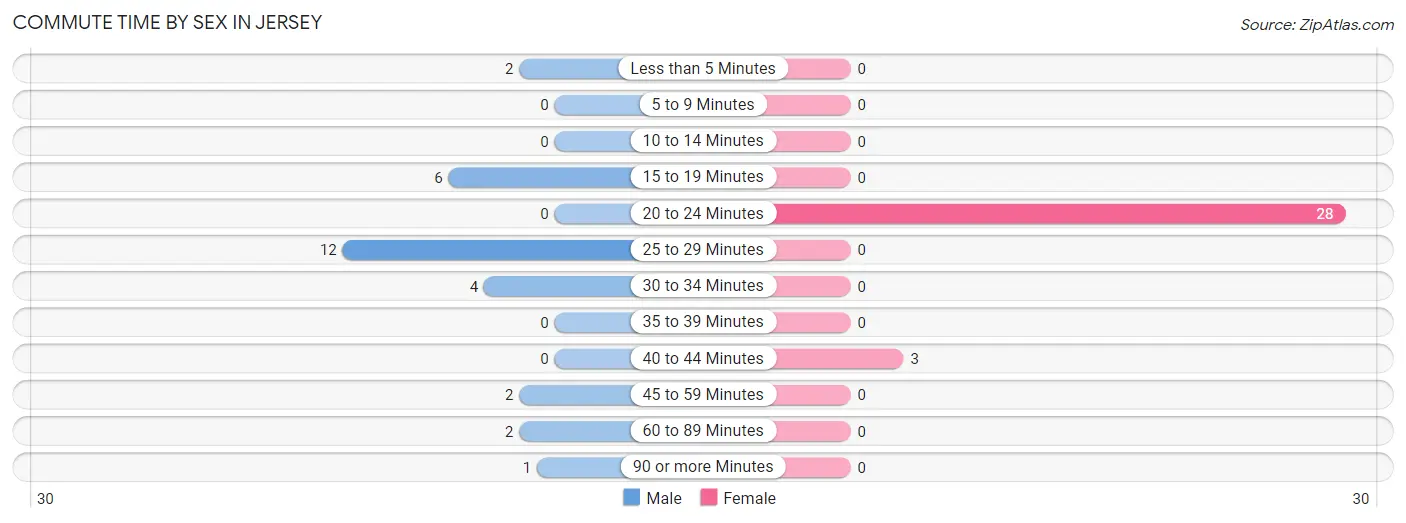
| Commute Time | Male | Female |
| Less than 5 Minutes | 2 (6.9%) | 0 (0.0%) |
| 5 to 9 Minutes | 0 (0.0%) | 0 (0.0%) |
| 10 to 14 Minutes | 0 (0.0%) | 0 (0.0%) |
| 15 to 19 Minutes | 6 (20.7%) | 0 (0.0%) |
| 20 to 24 Minutes | 0 (0.0%) | 28 (90.3%) |
| 25 to 29 Minutes | 12 (41.4%) | 0 (0.0%) |
| 30 to 34 Minutes | 4 (13.8%) | 0 (0.0%) |
| 35 to 39 Minutes | 0 (0.0%) | 0 (0.0%) |
| 40 to 44 Minutes | 0 (0.0%) | 3 (9.7%) |
| 45 to 59 Minutes | 2 (6.9%) | 0 (0.0%) |
| 60 to 89 Minutes | 2 (6.9%) | 0 (0.0%) |
| 90 or more Minutes | 1 (3.5%) | 0 (0.0%) |
Time of Departure to Work by Sex in Jersey
The most frequent times of departure to work in Jersey are 12:00 AM to 4:59 AM (12, 41.4%) for males and 7:00 AM to 7:29 AM (15, 48.4%) for females.
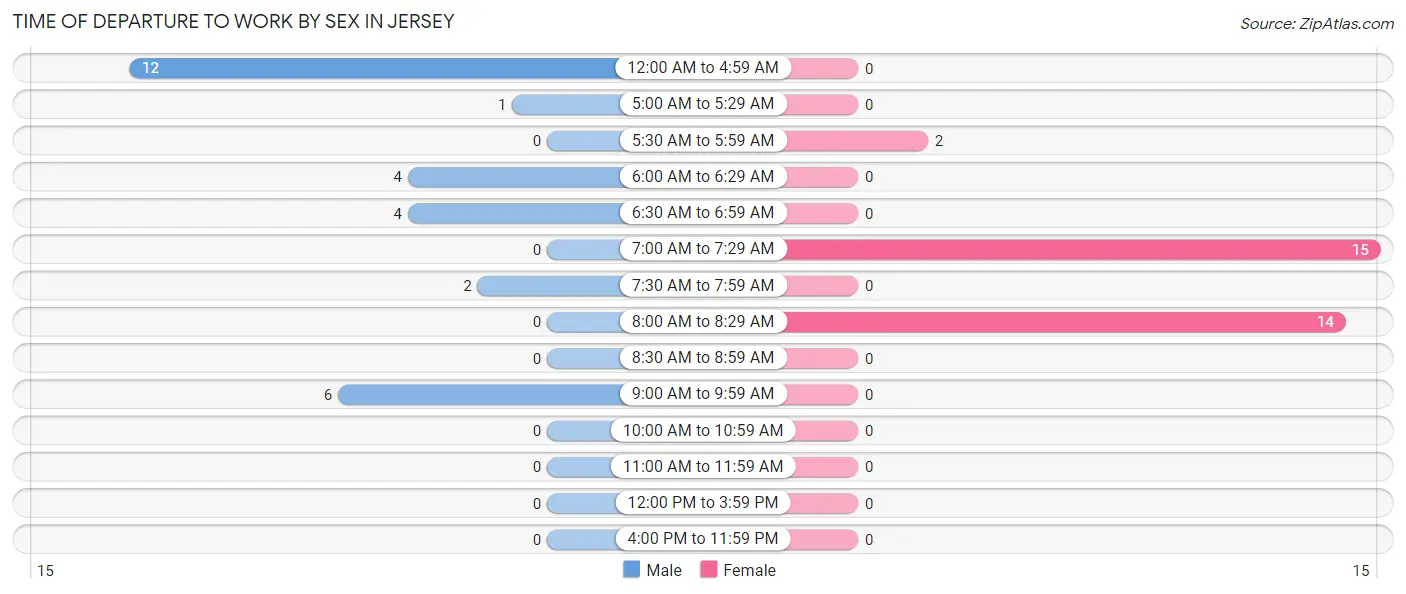
| Time of Departure | Male | Female |
| 12:00 AM to 4:59 AM | 12 (41.4%) | 0 (0.0%) |
| 5:00 AM to 5:29 AM | 1 (3.5%) | 0 (0.0%) |
| 5:30 AM to 5:59 AM | 0 (0.0%) | 2 (6.5%) |
| 6:00 AM to 6:29 AM | 4 (13.8%) | 0 (0.0%) |
| 6:30 AM to 6:59 AM | 4 (13.8%) | 0 (0.0%) |
| 7:00 AM to 7:29 AM | 0 (0.0%) | 15 (48.4%) |
| 7:30 AM to 7:59 AM | 2 (6.9%) | 0 (0.0%) |
| 8:00 AM to 8:29 AM | 0 (0.0%) | 14 (45.2%) |
| 8:30 AM to 8:59 AM | 0 (0.0%) | 0 (0.0%) |
| 9:00 AM to 9:59 AM | 6 (20.7%) | 0 (0.0%) |
| 10:00 AM to 10:59 AM | 0 (0.0%) | 0 (0.0%) |
| 11:00 AM to 11:59 AM | 0 (0.0%) | 0 (0.0%) |
| 12:00 PM to 3:59 PM | 0 (0.0%) | 0 (0.0%) |
| 4:00 PM to 11:59 PM | 0 (0.0%) | 0 (0.0%) |
| Total | 29 (100.0%) | 31 (100.0%) |
Housing Occupancy in Jersey
Occupancy by Ownership in Jersey
Of the total 59 dwellings in Jersey, owner-occupied units account for 34 (57.6%), while renter-occupied units make up 25 (42.4%).
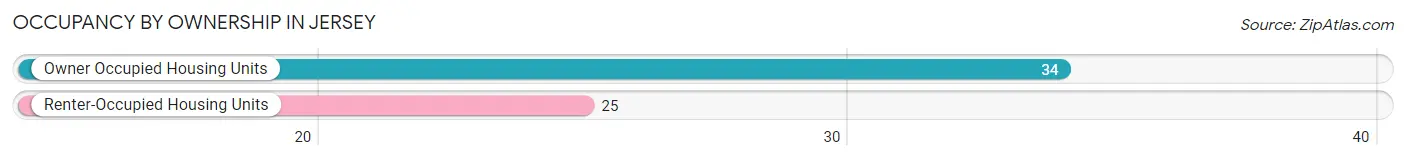
| Occupancy | # Housing Units | % Housing Units |
| Owner Occupied Housing Units | 34 | 57.6% |
| Renter-Occupied Housing Units | 25 | 42.4% |
| Total Occupied Housing Units | 59 | 100.0% |
Occupancy by Household Size in Jersey
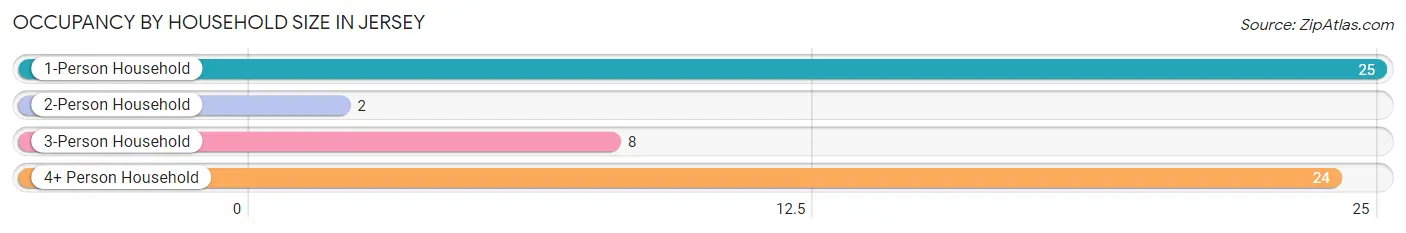
| Household Size | # Housing Units | % Housing Units |
| 1-Person Household | 25 | 42.4% |
| 2-Person Household | 2 | 3.4% |
| 3-Person Household | 8 | 13.6% |
| 4+ Person Household | 24 | 40.7% |
| Total Housing Units | 59 | 100.0% |
Occupancy by Ownership by Household Size in Jersey
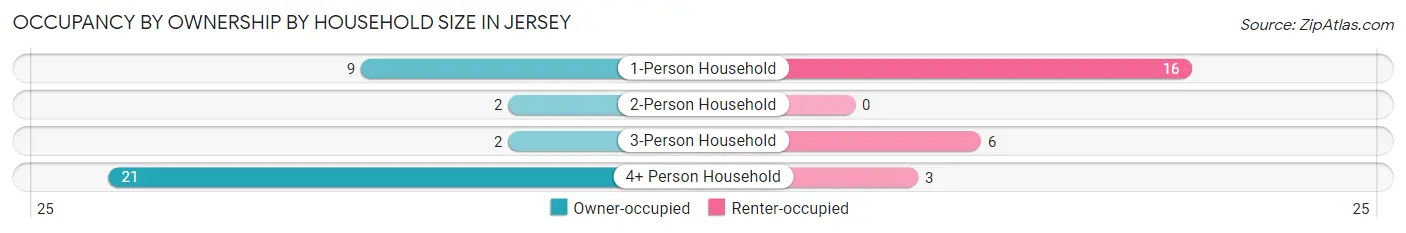
| Household Size | Owner-occupied | Renter-occupied |
| 1-Person Household | 9 (36.0%) | 16 (64.0%) |
| 2-Person Household | 2 (100.0%) | 0 (0.0%) |
| 3-Person Household | 2 (25.0%) | 6 (75.0%) |
| 4+ Person Household | 21 (87.5%) | 3 (12.5%) |
| Total Housing Units | 34 (57.6%) | 25 (42.4%) |
Occupancy by Educational Attainment in Jersey
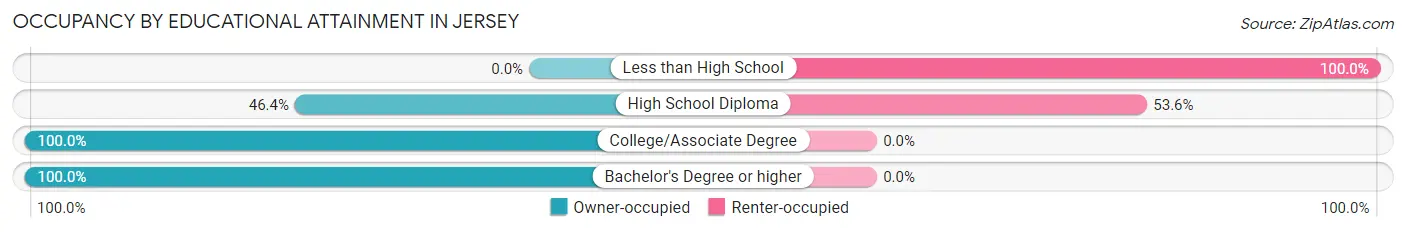
| Household Size | Owner-occupied | Renter-occupied |
| Less than High School | 0 (0.0%) | 10 (100.0%) |
| High School Diploma | 13 (46.4%) | 15 (53.6%) |
| College/Associate Degree | 4 (100.0%) | 0 (0.0%) |
| Bachelor's Degree or higher | 17 (100.0%) | 0 (0.0%) |
Occupancy by Age of Householder in Jersey
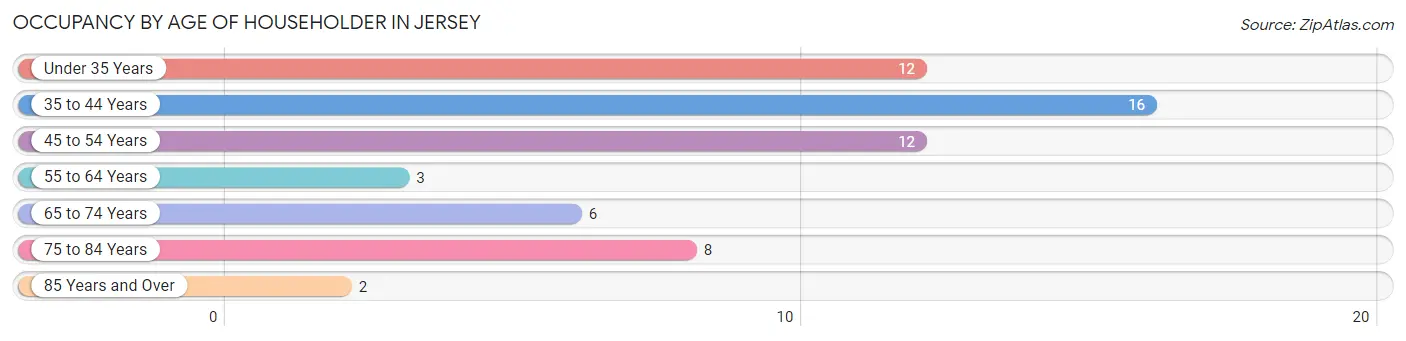
| Age Bracket | # Households | % Households |
| Under 35 Years | 12 | 20.3% |
| 35 to 44 Years | 16 | 27.1% |
| 45 to 54 Years | 12 | 20.3% |
| 55 to 64 Years | 3 | 5.1% |
| 65 to 74 Years | 6 | 10.2% |
| 75 to 84 Years | 8 | 13.6% |
| 85 Years and Over | 2 | 3.4% |
| Total | 59 | 100.0% |
Housing Finances in Jersey
Median Income by Occupancy in Jersey
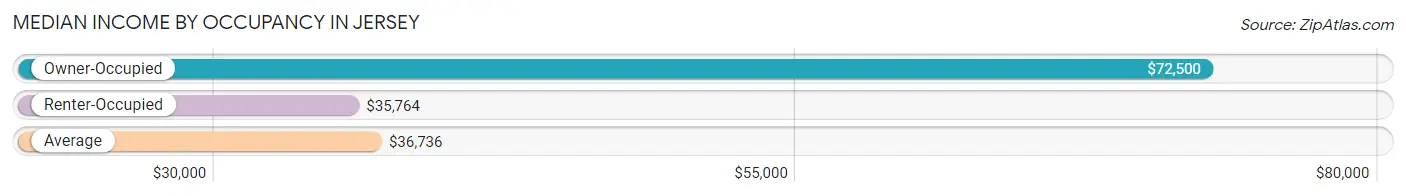
| Occupancy Type | # Households | Median Income |
| Owner-Occupied | 34 (57.6%) | $72,500 |
| Renter-Occupied | 25 (42.4%) | $35,764 |
| Average | 59 (100.0%) | $36,736 |
Occupancy by Householder Income Bracket in Jersey
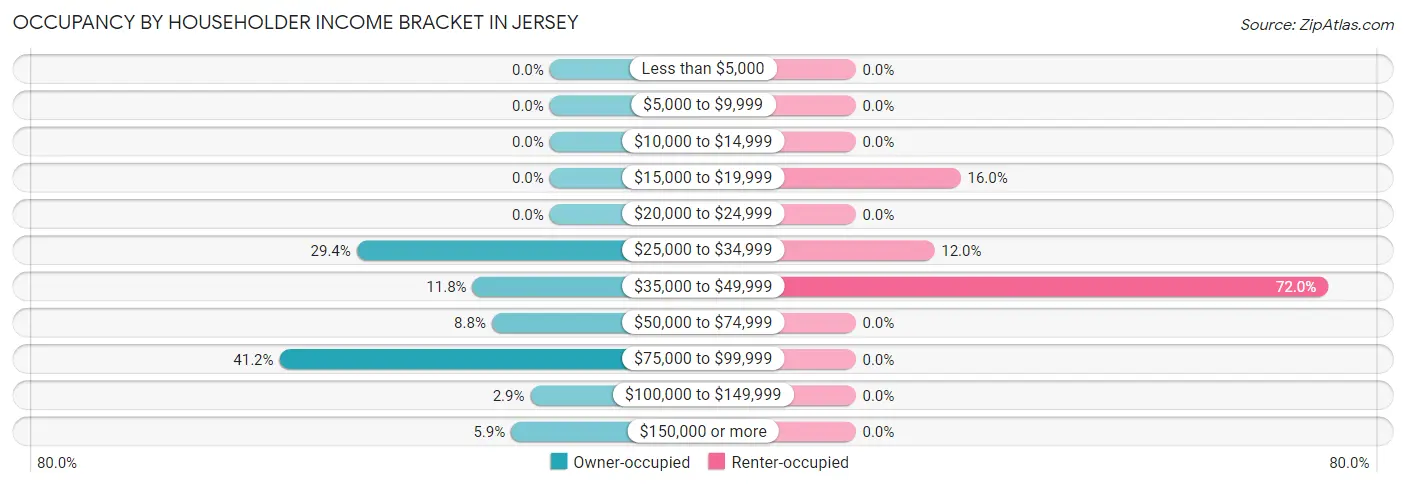
| Income Bracket | Owner-occupied | Renter-occupied |
| Less than $5,000 | 0 (0.0%) | 0 (0.0%) |
| $5,000 to $9,999 | 0 (0.0%) | 0 (0.0%) |
| $10,000 to $14,999 | 0 (0.0%) | 0 (0.0%) |
| $15,000 to $19,999 | 0 (0.0%) | 4 (16.0%) |
| $20,000 to $24,999 | 0 (0.0%) | 0 (0.0%) |
| $25,000 to $34,999 | 10 (29.4%) | 3 (12.0%) |
| $35,000 to $49,999 | 4 (11.8%) | 18 (72.0%) |
| $50,000 to $74,999 | 3 (8.8%) | 0 (0.0%) |
| $75,000 to $99,999 | 14 (41.2%) | 0 (0.0%) |
| $100,000 to $149,999 | 1 (2.9%) | 0 (0.0%) |
| $150,000 or more | 2 (5.9%) | 0 (0.0%) |
| Total | 34 (100.0%) | 25 (100.0%) |
Monthly Housing Cost Tiers in Jersey
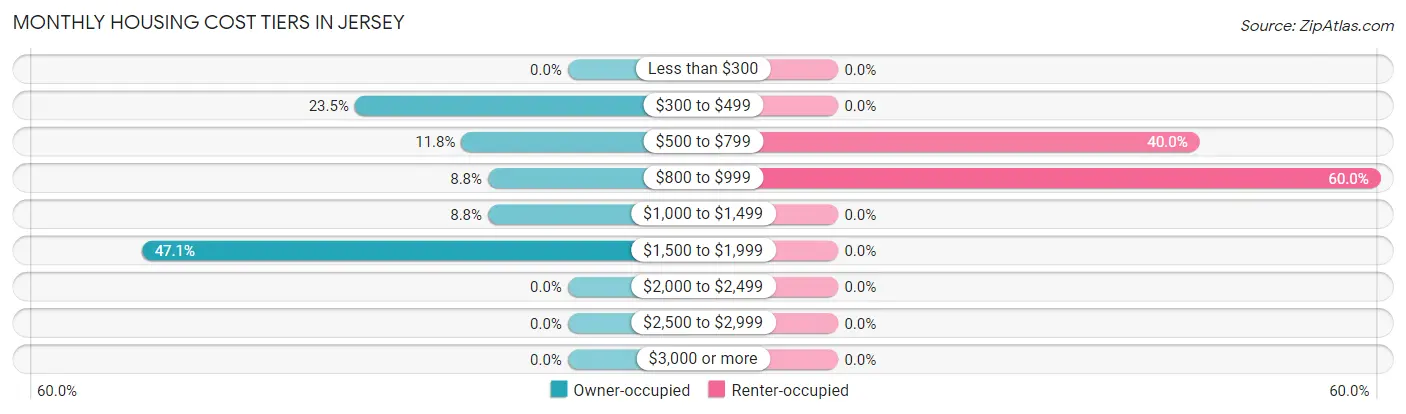
| Monthly Cost | Owner-occupied | Renter-occupied |
| Less than $300 | 0 (0.0%) | 0 (0.0%) |
| $300 to $499 | 8 (23.5%) | 0 (0.0%) |
| $500 to $799 | 4 (11.8%) | 10 (40.0%) |
| $800 to $999 | 3 (8.8%) | 15 (60.0%) |
| $1,000 to $1,499 | 3 (8.8%) | 0 (0.0%) |
| $1,500 to $1,999 | 16 (47.1%) | 0 (0.0%) |
| $2,000 to $2,499 | 0 (0.0%) | 0 (0.0%) |
| $2,500 to $2,999 | 0 (0.0%) | 0 (0.0%) |
| $3,000 or more | 0 (0.0%) | 0 (0.0%) |
| Total | 34 (100.0%) | 25 (100.0%) |
Physical Housing Characteristics in Jersey
Housing Structures in Jersey
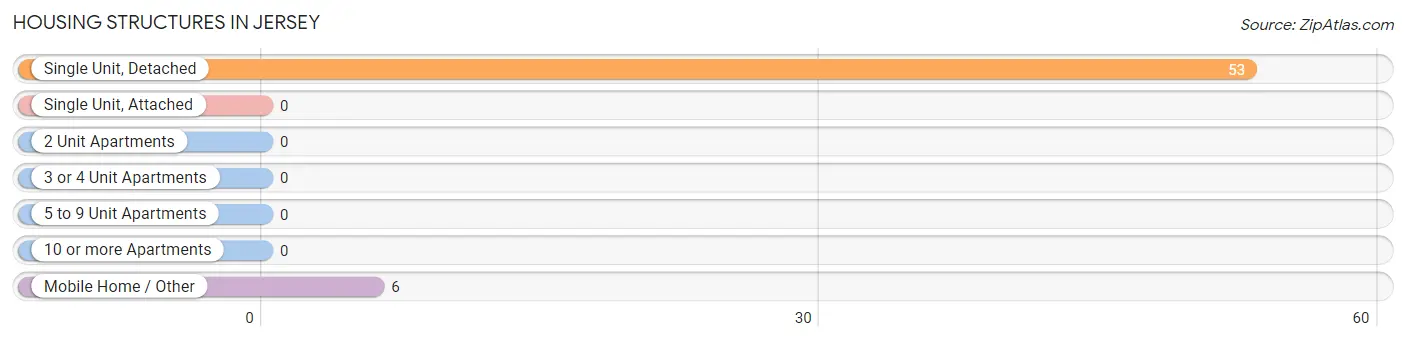
| Structure Type | # Housing Units | % Housing Units |
| Single Unit, Detached | 53 | 89.8% |
| Single Unit, Attached | 0 | 0.0% |
| 2 Unit Apartments | 0 | 0.0% |
| 3 or 4 Unit Apartments | 0 | 0.0% |
| 5 to 9 Unit Apartments | 0 | 0.0% |
| 10 or more Apartments | 0 | 0.0% |
| Mobile Home / Other | 6 | 10.2% |
| Total | 59 | 100.0% |
Housing Structures by Occupancy in Jersey
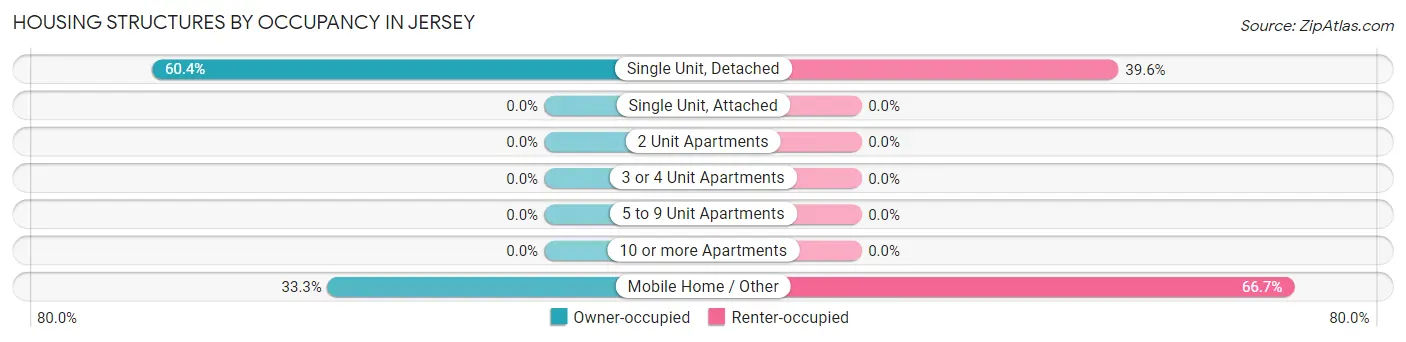
| Structure Type | Owner-occupied | Renter-occupied |
| Single Unit, Detached | 32 (60.4%) | 21 (39.6%) |
| Single Unit, Attached | 0 (0.0%) | 0 (0.0%) |
| 2 Unit Apartments | 0 (0.0%) | 0 (0.0%) |
| 3 or 4 Unit Apartments | 0 (0.0%) | 0 (0.0%) |
| 5 to 9 Unit Apartments | 0 (0.0%) | 0 (0.0%) |
| 10 or more Apartments | 0 (0.0%) | 0 (0.0%) |
| Mobile Home / Other | 2 (33.3%) | 4 (66.7%) |
| Total | 34 (57.6%) | 25 (42.4%) |
Housing Structures by Number of Rooms in Jersey
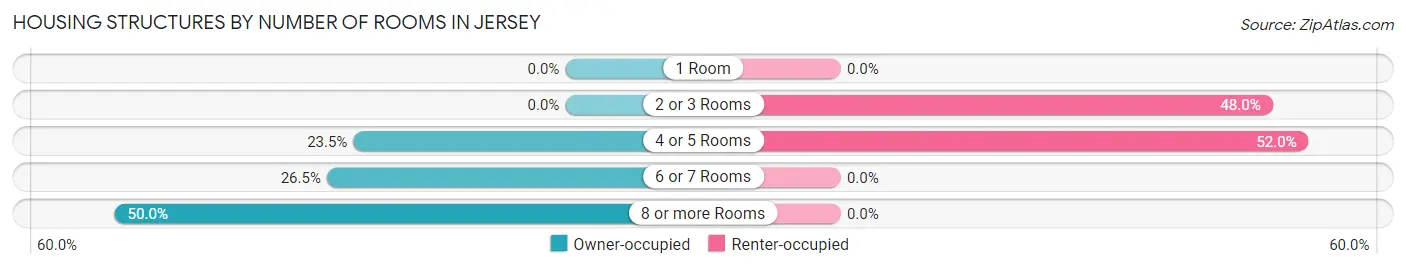
| Number of Rooms | Owner-occupied | Renter-occupied |
| 1 Room | 0 (0.0%) | 0 (0.0%) |
| 2 or 3 Rooms | 0 (0.0%) | 12 (48.0%) |
| 4 or 5 Rooms | 8 (23.5%) | 13 (52.0%) |
| 6 or 7 Rooms | 9 (26.5%) | 0 (0.0%) |
| 8 or more Rooms | 17 (50.0%) | 0 (0.0%) |
| Total | 34 (100.0%) | 25 (100.0%) |
Housing Structure by Heating Type in Jersey
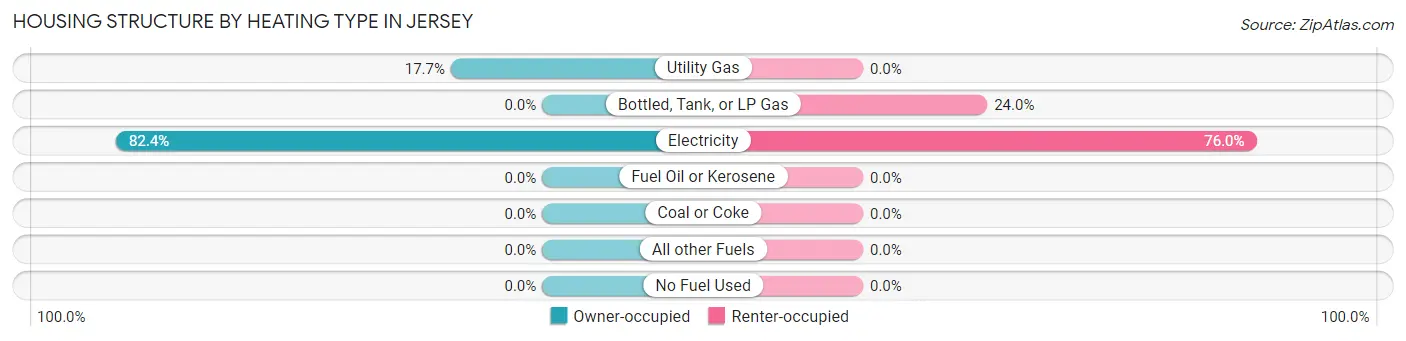
| Heating Type | Owner-occupied | Renter-occupied |
| Utility Gas | 6 (17.6%) | 0 (0.0%) |
| Bottled, Tank, or LP Gas | 0 (0.0%) | 6 (24.0%) |
| Electricity | 28 (82.4%) | 19 (76.0%) |
| Fuel Oil or Kerosene | 0 (0.0%) | 0 (0.0%) |
| Coal or Coke | 0 (0.0%) | 0 (0.0%) |
| All other Fuels | 0 (0.0%) | 0 (0.0%) |
| No Fuel Used | 0 (0.0%) | 0 (0.0%) |
| Total | 34 (100.0%) | 25 (100.0%) |
Household Vehicle Usage in Jersey
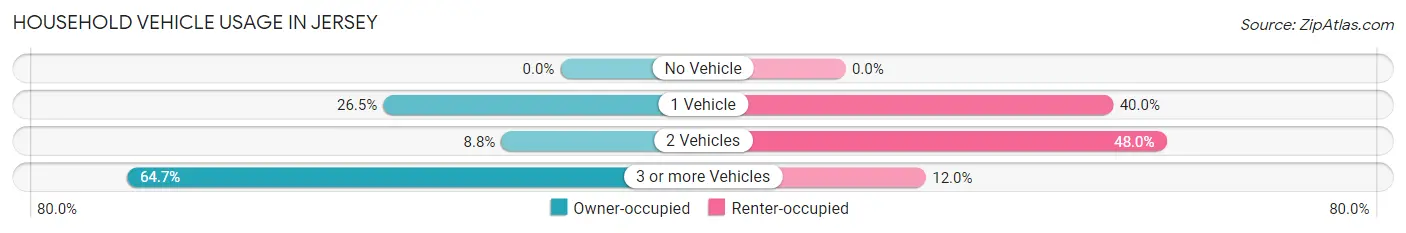
| Vehicles per Household | Owner-occupied | Renter-occupied |
| No Vehicle | 0 (0.0%) | 0 (0.0%) |
| 1 Vehicle | 9 (26.5%) | 10 (40.0%) |
| 2 Vehicles | 3 (8.8%) | 12 (48.0%) |
| 3 or more Vehicles | 22 (64.7%) | 3 (12.0%) |
| Total | 34 (100.0%) | 25 (100.0%) |
Real Estate & Mortgages in Jersey
Real Estate and Mortgage Overview in Jersey
| Characteristic | Without Mortgage | With Mortgage |
| Housing Units | 12 | 22 |
| Median Property Value | $195,000 | $268,800 |
| Median Household Income | $33,000 | $2 |
| Monthly Housing Costs | $367 | $0 |
| Real Estate Taxes | - | - |
Property Value by Mortgage Status in Jersey
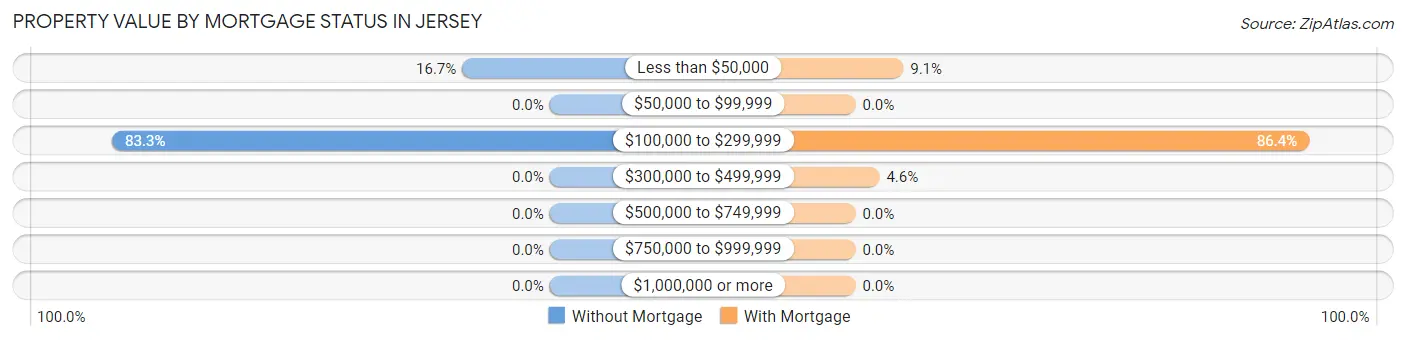
| Property Value | Without Mortgage | With Mortgage |
| Less than $50,000 | 2 (16.7%) | 2 (9.1%) |
| $50,000 to $99,999 | 0 (0.0%) | 0 (0.0%) |
| $100,000 to $299,999 | 10 (83.3%) | 19 (86.4%) |
| $300,000 to $499,999 | 0 (0.0%) | 1 (4.5%) |
| $500,000 to $749,999 | 0 (0.0%) | 0 (0.0%) |
| $750,000 to $999,999 | 0 (0.0%) | 0 (0.0%) |
| $1,000,000 or more | 0 (0.0%) | 0 (0.0%) |
| Total | 12 (100.0%) | 22 (100.0%) |
Household Income by Mortgage Status in Jersey
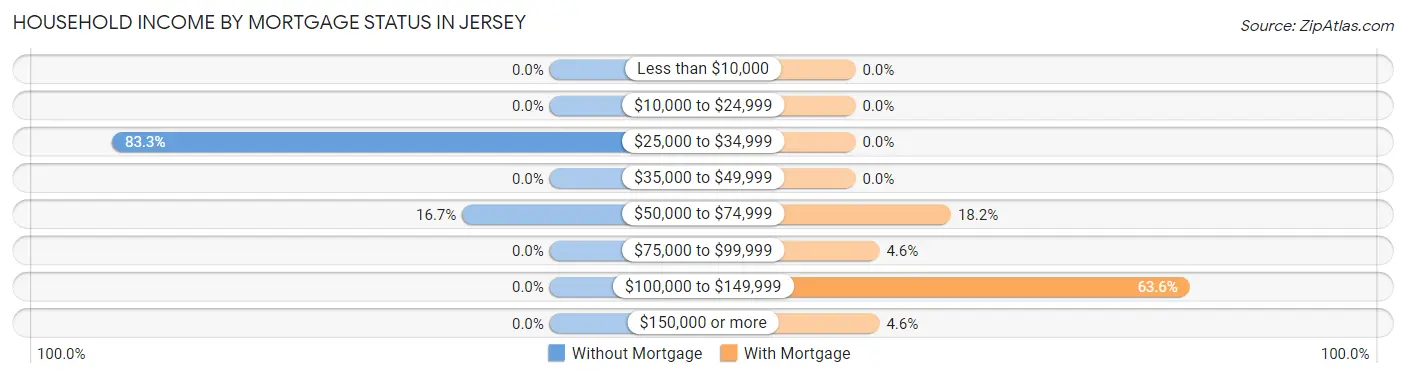
| Household Income | Without Mortgage | With Mortgage |
| Less than $10,000 | 0 (0.0%) | 0 (0.0%) |
| $10,000 to $24,999 | 0 (0.0%) | 0 (0.0%) |
| $25,000 to $34,999 | 10 (83.3%) | 0 (0.0%) |
| $35,000 to $49,999 | 0 (0.0%) | 0 (0.0%) |
| $50,000 to $74,999 | 2 (16.7%) | 4 (18.2%) |
| $75,000 to $99,999 | 0 (0.0%) | 1 (4.5%) |
| $100,000 to $149,999 | 0 (0.0%) | 14 (63.6%) |
| $150,000 or more | 0 (0.0%) | 1 (4.5%) |
| Total | 12 (100.0%) | 22 (100.0%) |
Property Value to Household Income Ratio in Jersey
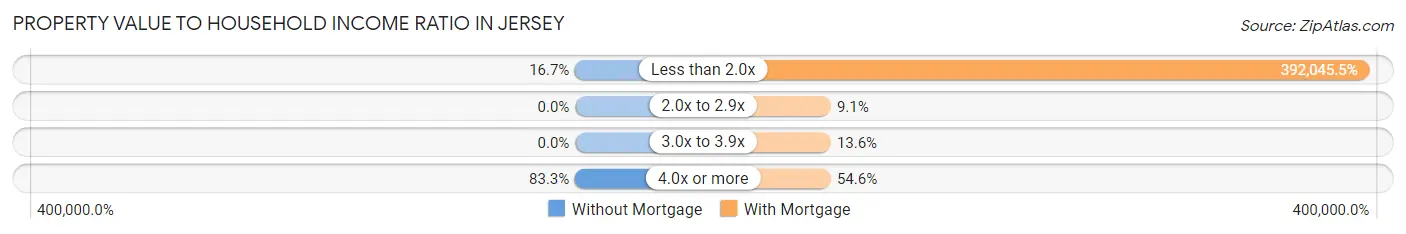
| Value-to-Income Ratio | Without Mortgage | With Mortgage |
| Less than 2.0x | 2 (16.7%) | 86,250 (392,045.4%) |
| 2.0x to 2.9x | 0 (0.0%) | 2 (9.1%) |
| 3.0x to 3.9x | 0 (0.0%) | 3 (13.6%) |
| 4.0x or more | 10 (83.3%) | 12 (54.5%) |
| Total | 12 (100.0%) | 22 (100.0%) |
Real Estate Taxes by Mortgage Status in Jersey
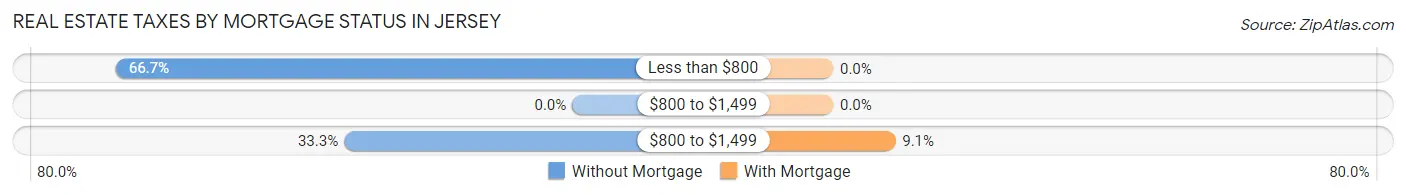
| Property Taxes | Without Mortgage | With Mortgage |
| Less than $800 | 8 (66.7%) | 0 (0.0%) |
| $800 to $1,499 | 0 (0.0%) | 0 (0.0%) |
| $800 to $1,499 | 4 (33.3%) | 2 (9.1%) |
| Total | 12 (100.0%) | 22 (100.0%) |
Health & Disability in Jersey
Health Insurance Coverage by Age in Jersey
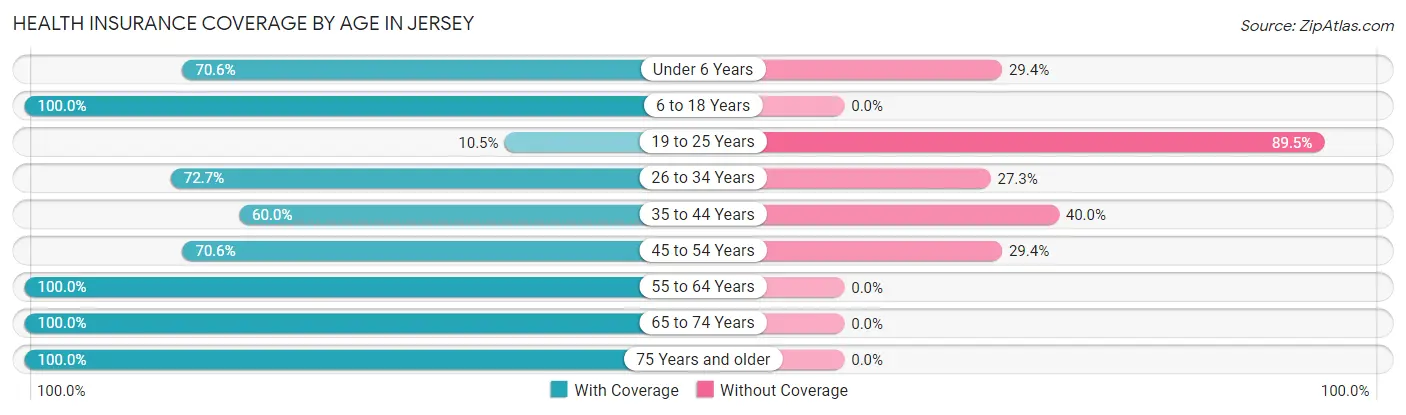
| Age Bracket | With Coverage | Without Coverage |
| Under 6 Years | 12 (70.6%) | 5 (29.4%) |
| 6 to 18 Years | 33 (100.0%) | 0 (0.0%) |
| 19 to 25 Years | 2 (10.5%) | 17 (89.5%) |
| 26 to 34 Years | 16 (72.7%) | 6 (27.3%) |
| 35 to 44 Years | 12 (60.0%) | 8 (40.0%) |
| 45 to 54 Years | 12 (70.6%) | 5 (29.4%) |
| 55 to 64 Years | 16 (100.0%) | 0 (0.0%) |
| 65 to 74 Years | 10 (100.0%) | 0 (0.0%) |
| 75 Years and older | 10 (100.0%) | 0 (0.0%) |
| Total | 123 (75.0%) | 41 (25.0%) |
Health Insurance Coverage by Citizenship Status in Jersey
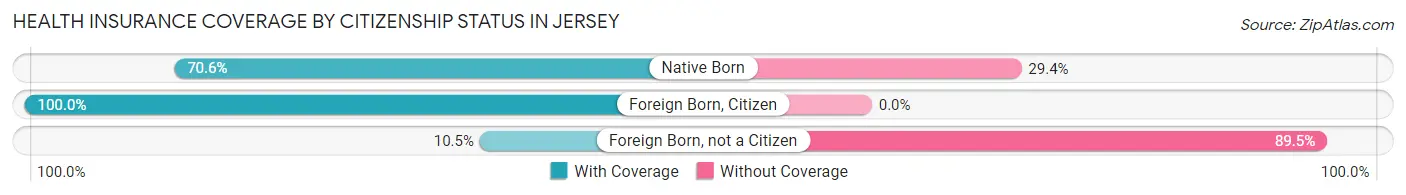
| Citizenship Status | With Coverage | Without Coverage |
| Native Born | 12 (70.6%) | 5 (29.4%) |
| Foreign Born, Citizen | 33 (100.0%) | 0 (0.0%) |
| Foreign Born, not a Citizen | 2 (10.5%) | 17 (89.5%) |
Health Insurance Coverage by Household Income in Jersey
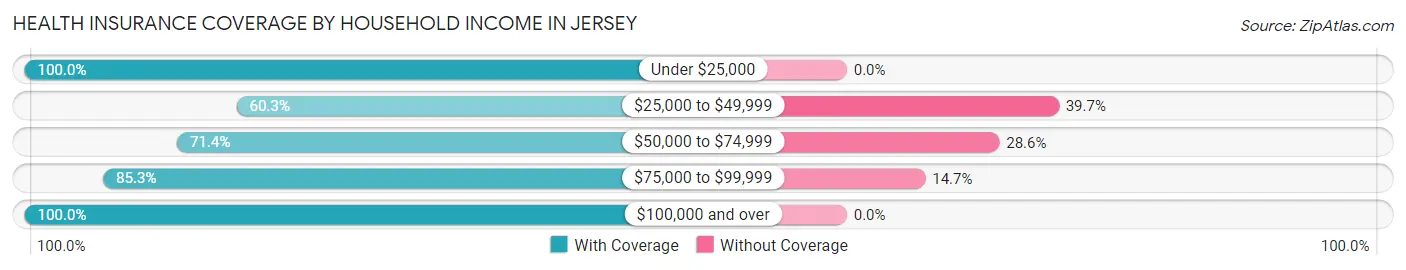
| Household Income | With Coverage | Without Coverage |
| Under $25,000 | 4 (100.0%) | 0 (0.0%) |
| $25,000 to $49,999 | 41 (60.3%) | 27 (39.7%) |
| $50,000 to $74,999 | 10 (71.4%) | 4 (28.6%) |
| $75,000 to $99,999 | 58 (85.3%) | 10 (14.7%) |
| $100,000 and over | 10 (100.0%) | 0 (0.0%) |
Public vs Private Health Insurance Coverage by Age in Jersey
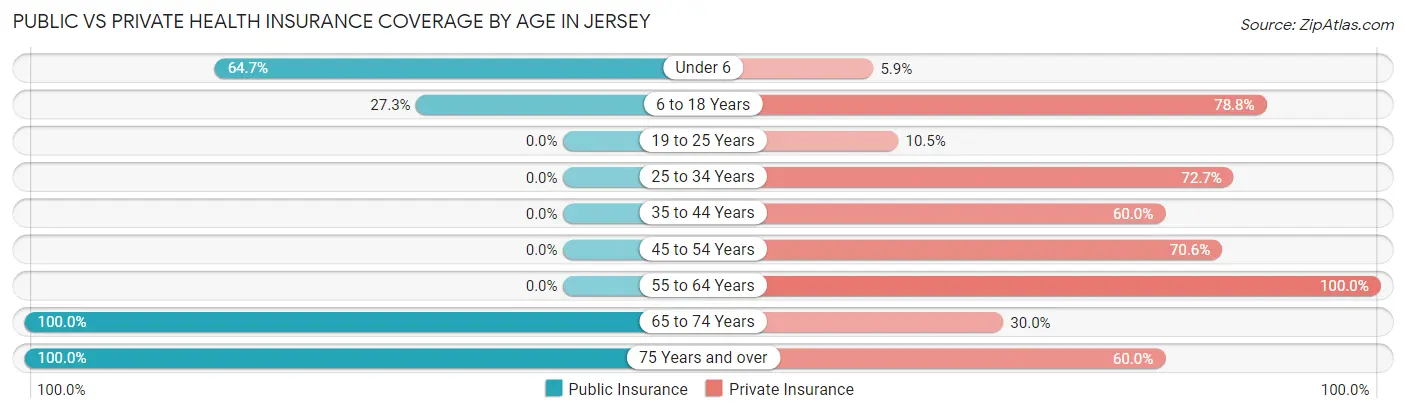
| Age Bracket | Public Insurance | Private Insurance |
| Under 6 | 11 (64.7%) | 1 (5.9%) |
| 6 to 18 Years | 9 (27.3%) | 26 (78.8%) |
| 19 to 25 Years | 0 (0.0%) | 2 (10.5%) |
| 25 to 34 Years | 0 (0.0%) | 16 (72.7%) |
| 35 to 44 Years | 0 (0.0%) | 12 (60.0%) |
| 45 to 54 Years | 0 (0.0%) | 12 (70.6%) |
| 55 to 64 Years | 0 (0.0%) | 16 (100.0%) |
| 65 to 74 Years | 10 (100.0%) | 3 (30.0%) |
| 75 Years and over | 10 (100.0%) | 6 (60.0%) |
| Total | 40 (24.4%) | 94 (57.3%) |
Disability Status by Sex by Age in Jersey
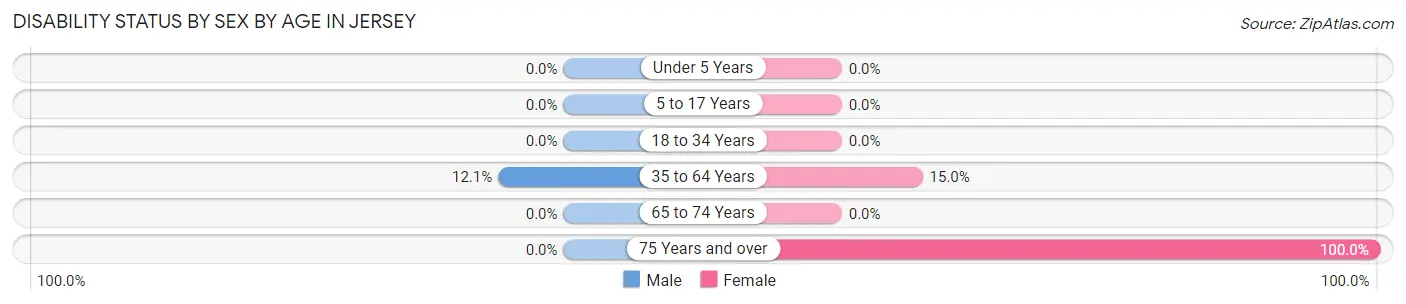
| Age Bracket | Male | Female |
| Under 5 Years | 0 (0.0%) | 0 (0.0%) |
| 5 to 17 Years | 0 (0.0%) | 0 (0.0%) |
| 18 to 34 Years | 0 (0.0%) | 0 (0.0%) |
| 35 to 64 Years | 4 (12.1%) | 3 (15.0%) |
| 65 to 74 Years | 0 (0.0%) | 0 (0.0%) |
| 75 Years and over | 0 (0.0%) | 10 (100.0%) |
Disability Class by Sex by Age in Jersey
Disability Class: Hearing Difficulty
| Age Bracket | Male | Female |
| Under 5 Years | 0 (0.0%) | 0 (0.0%) |
| 5 to 17 Years | 0 (0.0%) | 0 (0.0%) |
| 18 to 34 Years | 0 (0.0%) | 0 (0.0%) |
| 35 to 64 Years | 0 (0.0%) | 0 (0.0%) |
| 65 to 74 Years | 0 (0.0%) | 0 (0.0%) |
| 75 Years and over | 0 (0.0%) | 0 (0.0%) |
Disability Class: Vision Difficulty
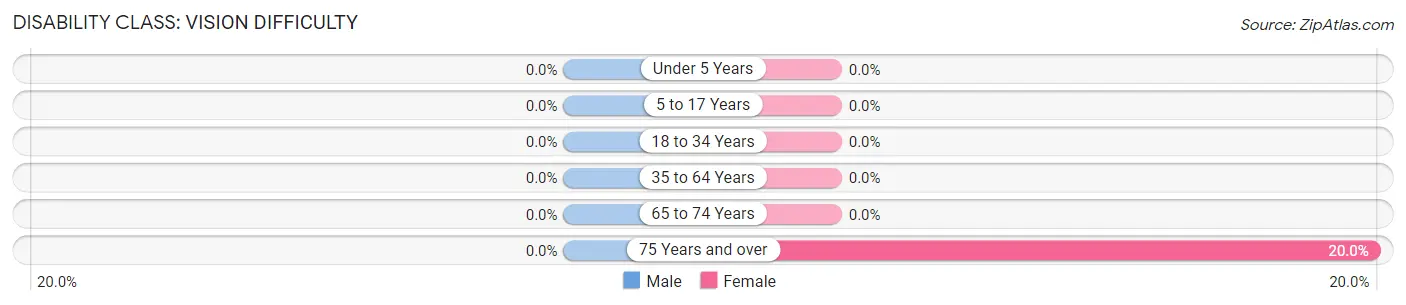
| Age Bracket | Male | Female |
| Under 5 Years | 0 (0.0%) | 0 (0.0%) |
| 5 to 17 Years | 0 (0.0%) | 0 (0.0%) |
| 18 to 34 Years | 0 (0.0%) | 0 (0.0%) |
| 35 to 64 Years | 0 (0.0%) | 0 (0.0%) |
| 65 to 74 Years | 0 (0.0%) | 0 (0.0%) |
| 75 Years and over | 0 (0.0%) | 2 (20.0%) |
Disability Class: Cognitive Difficulty
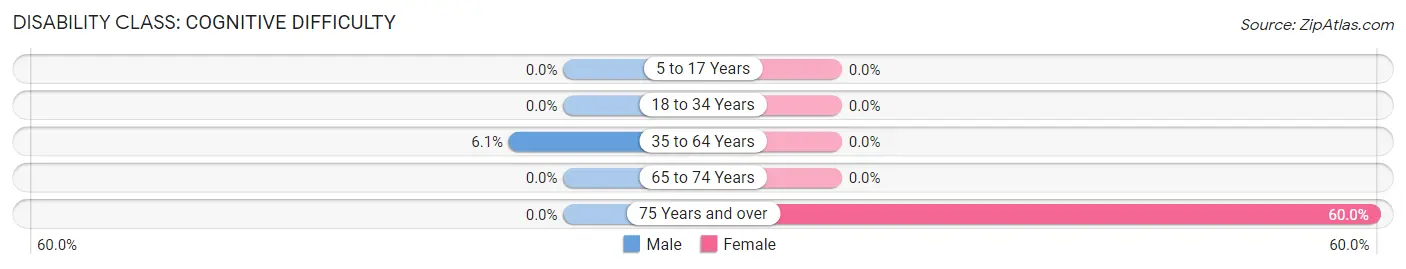
| Age Bracket | Male | Female |
| 5 to 17 Years | 0 (0.0%) | 0 (0.0%) |
| 18 to 34 Years | 0 (0.0%) | 0 (0.0%) |
| 35 to 64 Years | 2 (6.1%) | 0 (0.0%) |
| 65 to 74 Years | 0 (0.0%) | 0 (0.0%) |
| 75 Years and over | 0 (0.0%) | 6 (60.0%) |
Disability Class: Ambulatory Difficulty
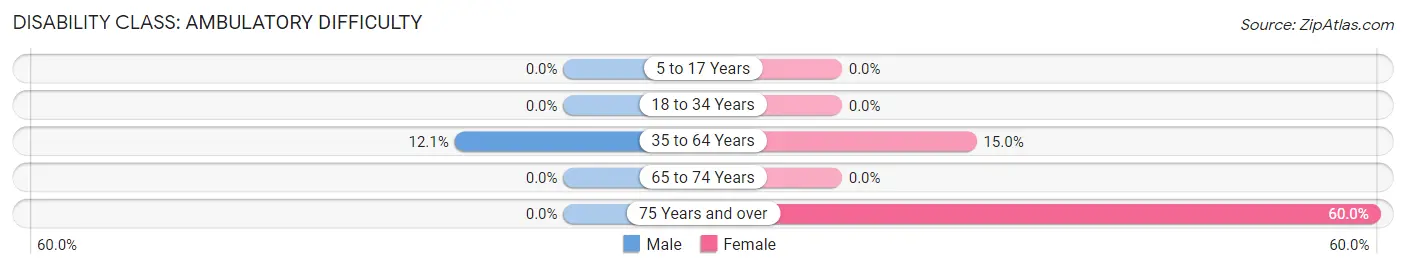
| Age Bracket | Male | Female |
| 5 to 17 Years | 0 (0.0%) | 0 (0.0%) |
| 18 to 34 Years | 0 (0.0%) | 0 (0.0%) |
| 35 to 64 Years | 4 (12.1%) | 3 (15.0%) |
| 65 to 74 Years | 0 (0.0%) | 0 (0.0%) |
| 75 Years and over | 0 (0.0%) | 6 (60.0%) |
Disability Class: Self-Care Difficulty
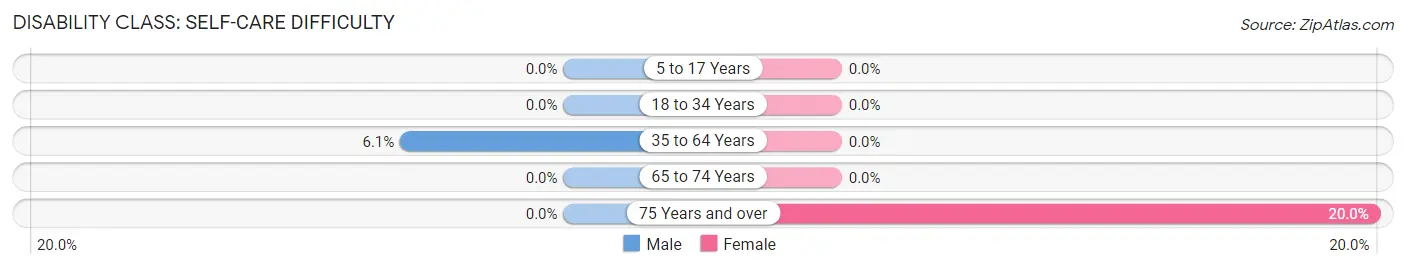
| Age Bracket | Male | Female |
| 5 to 17 Years | 0 (0.0%) | 0 (0.0%) |
| 18 to 34 Years | 0 (0.0%) | 0 (0.0%) |
| 35 to 64 Years | 2 (6.1%) | 0 (0.0%) |
| 65 to 74 Years | 0 (0.0%) | 0 (0.0%) |
| 75 Years and over | 0 (0.0%) | 2 (20.0%) |
Technology Access in Jersey
Computing Device Access in Jersey
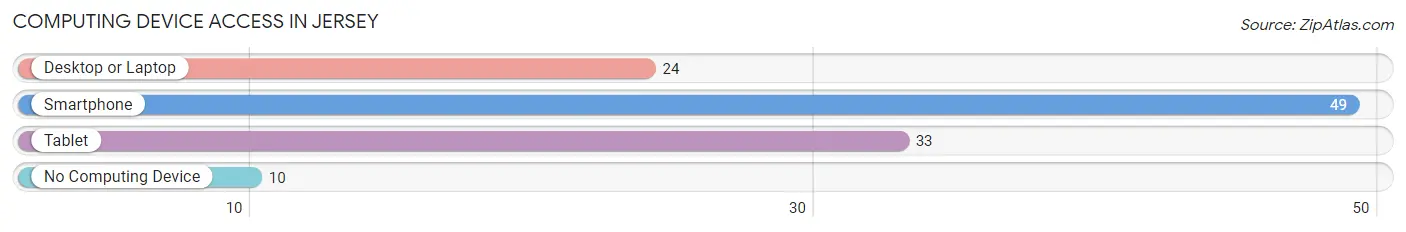
| Device Type | # Households | % Households |
| Desktop or Laptop | 24 | 40.7% |
| Smartphone | 49 | 83.1% |
| Tablet | 33 | 55.9% |
| No Computing Device | 10 | 17.0% |
| Total | 59 | 100.0% |
Internet Access in Jersey
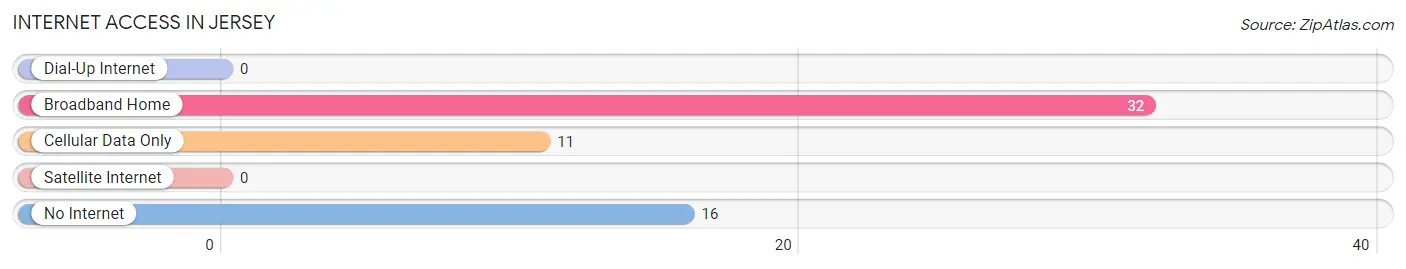
| Internet Type | # Households | % Households |
| Dial-Up Internet | 0 | 0.0% |
| Broadband Home | 32 | 54.2% |
| Cellular Data Only | 11 | 18.6% |
| Satellite Internet | 0 | 0.0% |
| No Internet | 16 | 27.1% |
| Total | 59 | 100.0% |
Jersey Summary
Jersey is a small town located in the state of Georgia, United States. It is situated in the southeastern part of the state, in the county of Tattnall. The town has a population of around 1,000 people, according to the 2010 census.
Geography
Jersey is located in the southeastern part of Georgia, in Tattnall County. It is situated at an elevation of around 200 feet above sea level. The town is located on the banks of the Ohoopee River, which is a tributary of the Altamaha River. The town is surrounded by a number of small towns and villages, including Reidsville, Glennville, and Collins. The nearest major city is Savannah, which is located around 50 miles away.
Climate
Jersey has a humid subtropical climate, with hot and humid summers and mild winters. The average temperature in the summer months is around 80°F, while in the winter months it is around 50°F. The town receives an average of around 50 inches of rainfall per year, with most of it occurring in the summer months.
Economy
The economy of Jersey is largely based on agriculture. The town is home to a number of farms, which produce a variety of crops, including corn, soybeans, cotton, and peanuts. The town also has a number of small businesses, including restaurants, stores, and other services.
Demographics
According to the 2010 census, the population of Jersey was 1,000 people. The town is predominantly white, with around 90% of the population being white. The remaining 10% of the population is made up of African Americans, Hispanics, and other ethnicities. The median household income in the town is around $30,000, and the median age is around 40 years old.
Conclusion
Jersey is a small town located in the southeastern part of Georgia. It has a population of around 1,000 people, and the economy is largely based on agriculture. The town is predominantly white, with around 90% of the population being white. The median household income in the town is around $30,000, and the median age is around 40 years old.
Common Questions
What is Per Capita Income in Jersey?
Per Capita income in Jersey is $20,735.
What is the Median Family Income in Jersey?
Median Family Income in Jersey is $72,500.
What is the Median Household income in Jersey?
Median Household Income in Jersey is $36,736.
What is Inequality or Gini Index in Jersey?
Inequality or Gini Index in Jersey is 0.33.
What is the Total Population of Jersey?
Total Population of Jersey is 164.
What is the Total Male Population of Jersey?
Total Male Population of Jersey is 81.
What is the Total Female Population of Jersey?
Total Female Population of Jersey is 83.
What is the Ratio of Males per 100 Females in Jersey?
There are 97.59 Males per 100 Females in Jersey.
What is the Ratio of Females per 100 Males in Jersey?
There are 102.47 Females per 100 Males in Jersey.
What is the Median Population Age in Jersey?
Median Population Age in Jersey is 30.8 Years.
What is the Average Family Size in Jersey
Average Family Size in Jersey is 3.8 People.
What is the Average Household Size in Jersey
Average Household Size in Jersey is 2.8 People.
How Large is the Labor Force in Jersey?
There are 60 People in the Labor Forcein in Jersey.
What is the Percentage of People in the Labor Force in Jersey?
52.2% of People are in the Labor Force in Jersey.