Summerville, GA Map & Demographics
Summerville Map
Summerville Overview
$18,095
PER CAPITA INCOME
$48,246
AVG FAMILY INCOME
$27,694
AVG HOUSEHOLD INCOME
20.1%
WAGE / INCOME GAP [ % ]
79.9¢/ $1
WAGE / INCOME GAP [ $ ]
0.44
INEQUALITY / GINI INDEX
4,381
TOTAL POPULATION
1,971
MALE POPULATION
2,410
FEMALE POPULATION
81.78
MALES / 100 FEMALES
122.27
FEMALES / 100 MALES
45.6
MEDIAN AGE
2.7
AVG FAMILY SIZE
2.1
AVG HOUSEHOLD SIZE
1,432
LABOR FORCE [ PEOPLE ]
42.5%
PERCENT IN LABOR FORCE
4.7%
UNEMPLOYMENT RATE
Summerville Zip Codes
Summerville Area Codes
Income in Summerville
Income Overview in Summerville
Per Capita Income in Summerville is $18,095, while median incomes of families and households are $48,246 and $27,694 respectively.
| Characteristic | Number | Measure |
| Per Capita Income | 4,381 | $18,095 |
| Median Family Income | 1,066 | $48,246 |
| Mean Family Income | 1,066 | $51,526 |
| Median Household Income | 1,945 | $27,694 |
| Mean Household Income | 1,945 | $39,925 |
| Income Deficit | 1,066 | $0 |
| Wage / Income Gap (%) | 4,381 | 20.12% |
| Wage / Income Gap ($) | 4,381 | 79.88¢ per $1 |
| Gini / Inequality Index | 4,381 | 0.44 |
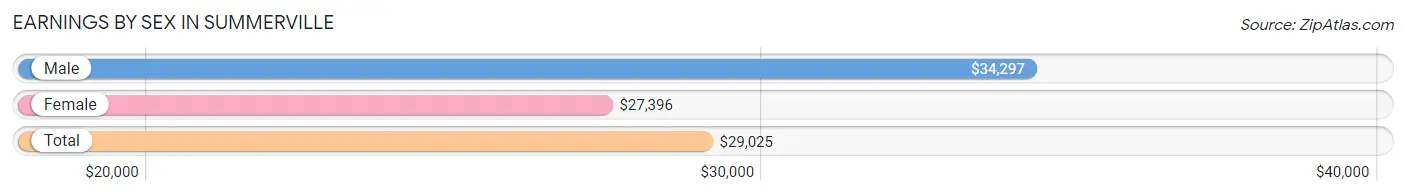
Earnings by Sex in Summerville
Average Earnings in Summerville are $29,025, $34,297 for men and $27,396 for women, a difference of 20.1%.
| Sex | Number | Average Earnings |
| Male | 579 (39.7%) | $34,297 |
| Female | 881 (60.3%) | $27,396 |
| Total | 1,460 (100.0%) | $29,025 |
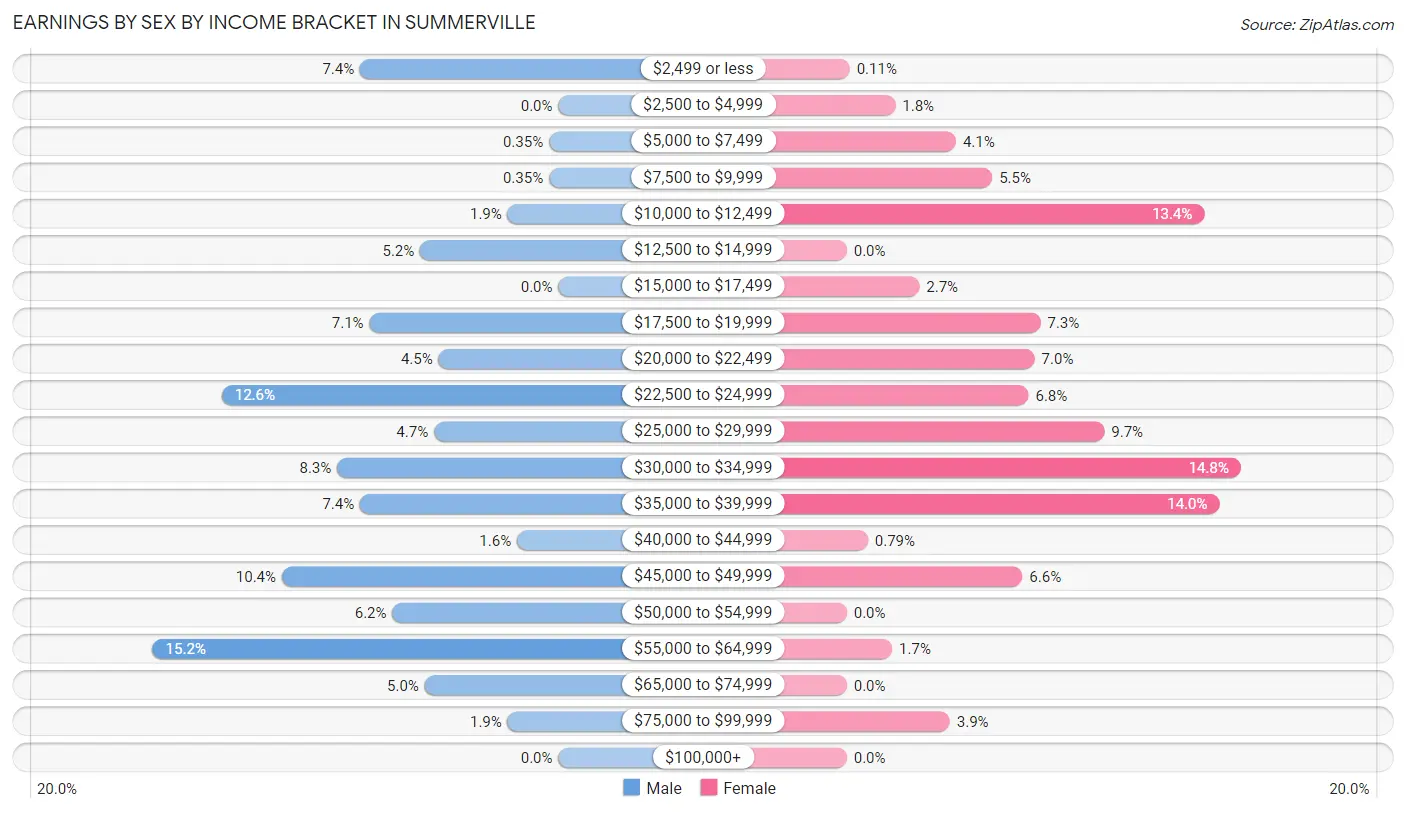
Earnings by Sex by Income Bracket in Summerville
The most common earnings brackets in Summerville are $55,000 to $64,999 for men (88 | 15.2%) and $30,000 to $34,999 for women (130 | 14.8%).
| Income | Male | Female |
| $2,499 or less | 43 (7.4%) | 1 (0.1%) |
| $2,500 to $4,999 | 0 (0.0%) | 16 (1.8%) |
| $5,000 to $7,499 | 2 (0.4%) | 36 (4.1%) |
| $7,500 to $9,999 | 2 (0.4%) | 48 (5.4%) |
| $10,000 to $12,499 | 11 (1.9%) | 118 (13.4%) |
| $12,500 to $14,999 | 30 (5.2%) | 0 (0.0%) |
| $15,000 to $17,499 | 0 (0.0%) | 24 (2.7%) |
| $17,500 to $19,999 | 41 (7.1%) | 64 (7.3%) |
| $20,000 to $22,499 | 26 (4.5%) | 62 (7.0%) |
| $22,500 to $24,999 | 73 (12.6%) | 60 (6.8%) |
| $25,000 to $29,999 | 27 (4.7%) | 85 (9.7%) |
| $30,000 to $34,999 | 48 (8.3%) | 130 (14.8%) |
| $35,000 to $39,999 | 43 (7.4%) | 123 (14.0%) |
| $40,000 to $44,999 | 9 (1.5%) | 7 (0.8%) |
| $45,000 to $49,999 | 60 (10.4%) | 58 (6.6%) |
| $50,000 to $54,999 | 36 (6.2%) | 0 (0.0%) |
| $55,000 to $64,999 | 88 (15.2%) | 15 (1.7%) |
| $65,000 to $74,999 | 29 (5.0%) | 0 (0.0%) |
| $75,000 to $99,999 | 11 (1.9%) | 34 (3.9%) |
| $100,000+ | 0 (0.0%) | 0 (0.0%) |
| Total | 579 (100.0%) | 881 (100.0%) |
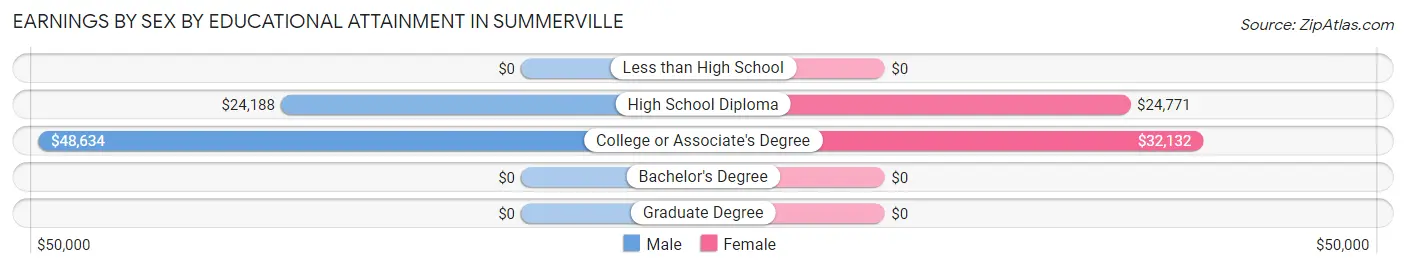
Earnings by Sex by Educational Attainment in Summerville
Average earnings in Summerville are $40,139 for men and $28,085 for women, a difference of 30.0%. Men with an educational attainment of college or associate's degree enjoy the highest average annual earnings of $48,634, while those with high school diploma education earn the least with $24,188. Women with an educational attainment of college or associate's degree earn the most with the average annual earnings of $32,132, while those with high school diploma education have the smallest earnings of $24,771.
| Educational Attainment | Male Income | Female Income |
| Less than High School | - | - |
| High School Diploma | $24,188 | $24,771 |
| College or Associate's Degree | $48,634 | $32,132 |
| Bachelor's Degree | - | - |
| Graduate Degree | - | - |
| Total | $40,139 | $28,085 |
Family Income in Summerville
Family Income Brackets in Summerville
According to the Summerville family income data, there are 294 families falling into the $50,000 to $74,999 income range, which is the most common income bracket and makes up 27.6% of all families.
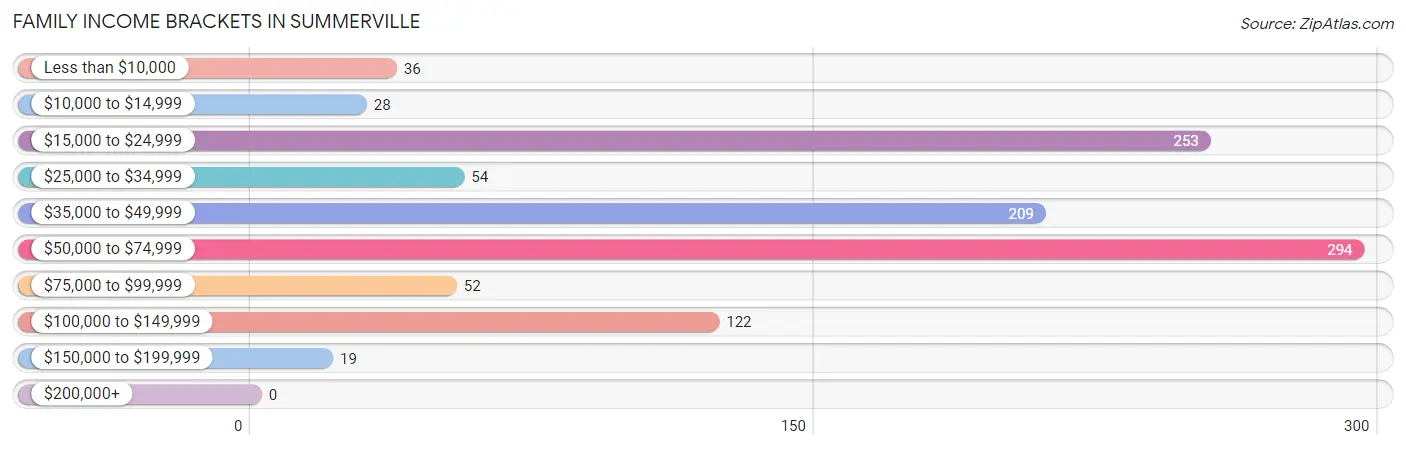
| Income Bracket | # Families | % Families |
| Less than $10,000 | 36 | 3.4% |
| $10,000 to $14,999 | 28 | 2.6% |
| $15,000 to $24,999 | 253 | 23.7% |
| $25,000 to $34,999 | 54 | 5.1% |
| $35,000 to $49,999 | 209 | 19.6% |
| $50,000 to $74,999 | 294 | 27.6% |
| $75,000 to $99,999 | 52 | 4.9% |
| $100,000 to $149,999 | 122 | 11.4% |
| $150,000 to $199,999 | 19 | 1.8% |
| $200,000+ | 0 | 0.0% |
Family Income by Famaliy Size in Summerville
4-person families (78 | 7.3%) account for the highest median family income in Summerville with $78,000 per family, while 2-person families (543 | 50.9%) have the highest median income of $23,906 per family member.
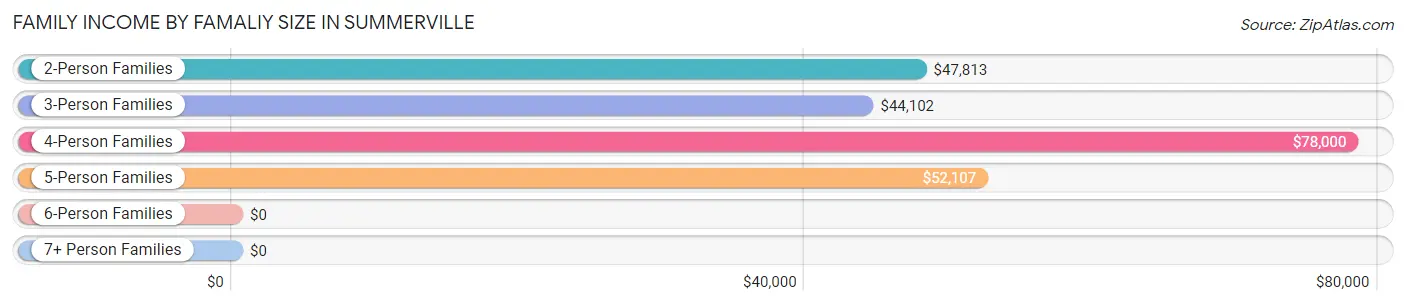
| Income Bracket | # Families | Median Income |
| 2-Person Families | 543 (50.9%) | $47,813 |
| 3-Person Families | 356 (33.4%) | $44,102 |
| 4-Person Families | 78 (7.3%) | $78,000 |
| 5-Person Families | 81 (7.6%) | $52,107 |
| 6-Person Families | 8 (0.7%) | $0 |
| 7+ Person Families | 0 (0.0%) | $0 |
| Total | 1,066 (100.0%) | $48,246 |
Family Income by Number of Earners in Summerville
The median family income in Summerville is $48,246, with families comprising 3+ earners (32) having the highest median family income of $125,000, while families with no earners (223) have the lowest median family income of $23,237, accounting for 3.0% and 20.9% of families, respectively.
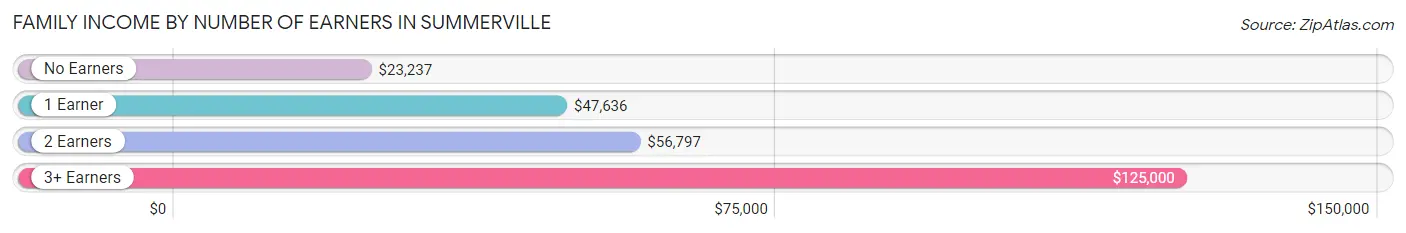
| Number of Earners | # Families | Median Income |
| No Earners | 223 (20.9%) | $23,237 |
| 1 Earner | 522 (49.0%) | $47,636 |
| 2 Earners | 289 (27.1%) | $56,797 |
| 3+ Earners | 32 (3.0%) | $125,000 |
| Total | 1,066 (100.0%) | $48,246 |
Household Income in Summerville
Household Income Brackets in Summerville
With 488 households falling in the category, the $15,000 to $24,999 income range is the most frequent in Summerville, accounting for 25.1% of all households. In contrast, only 6 households (0.3%) fall into the $200,000+ income bracket, making it the least populous group.
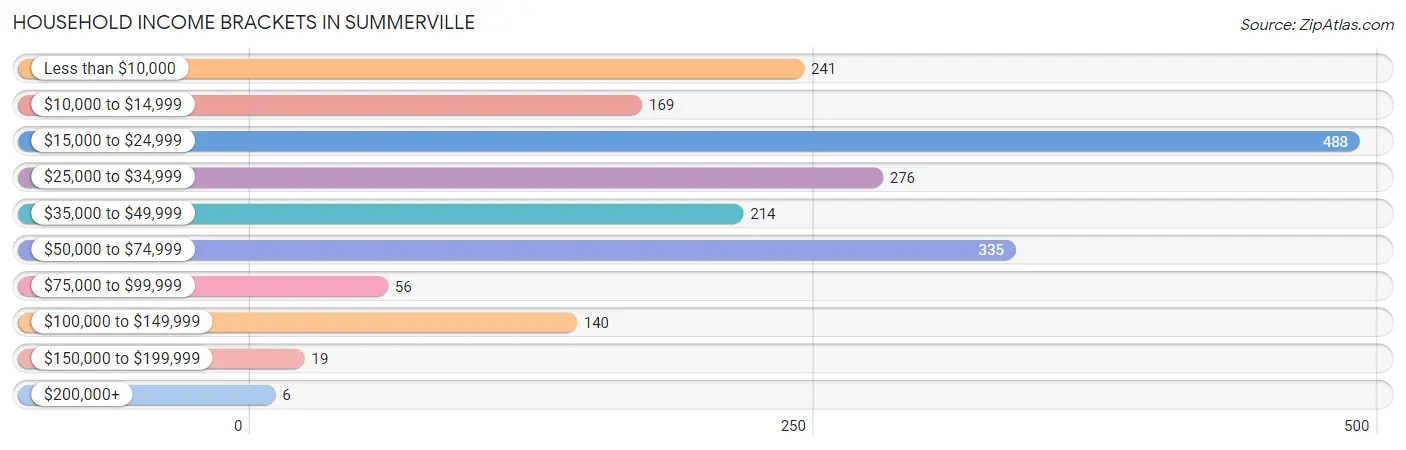
| Income Bracket | # Households | % Households |
| Less than $10,000 | 241 | 12.4% |
| $10,000 to $14,999 | 169 | 8.7% |
| $15,000 to $24,999 | 488 | 25.1% |
| $25,000 to $34,999 | 276 | 14.2% |
| $35,000 to $49,999 | 214 | 11.0% |
| $50,000 to $74,999 | 335 | 17.2% |
| $75,000 to $99,999 | 56 | 2.9% |
| $100,000 to $149,999 | 140 | 7.2% |
| $150,000 to $199,999 | 19 | 1.0% |
| $200,000+ | 6 | 0.3% |
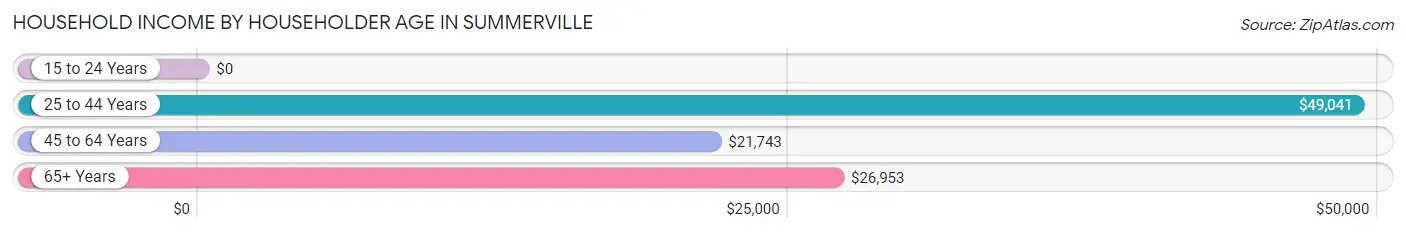
Household Income by Householder Age in Summerville
The median household income in Summerville is $27,694, with the highest median household income of $49,041 found in the 25 to 44 years age bracket for the primary householder. A total of 353 households (18.1%) fall into this category. Meanwhile, the 15 to 24 years age bracket for the primary householder has the lowest median household income of $0, with 74 households (3.8%) in this group.
| Income Bracket | # Households | Median Income |
| 15 to 24 Years | 74 (3.8%) | $0 |
| 25 to 44 Years | 353 (18.1%) | $49,041 |
| 45 to 64 Years | 962 (49.5%) | $21,743 |
| 65+ Years | 556 (28.6%) | $26,953 |
| Total | 1,945 (100.0%) | $27,694 |
Poverty in Summerville
Income Below Poverty by Sex and Age in Summerville
With 26.5% poverty level for males and 27.6% for females among the residents of Summerville, under 5 year old males and 15 year old females are the most vulnerable to poverty, with 144 males (62.1%) and 23 females (100.0%) in their respective age groups living below the poverty level.
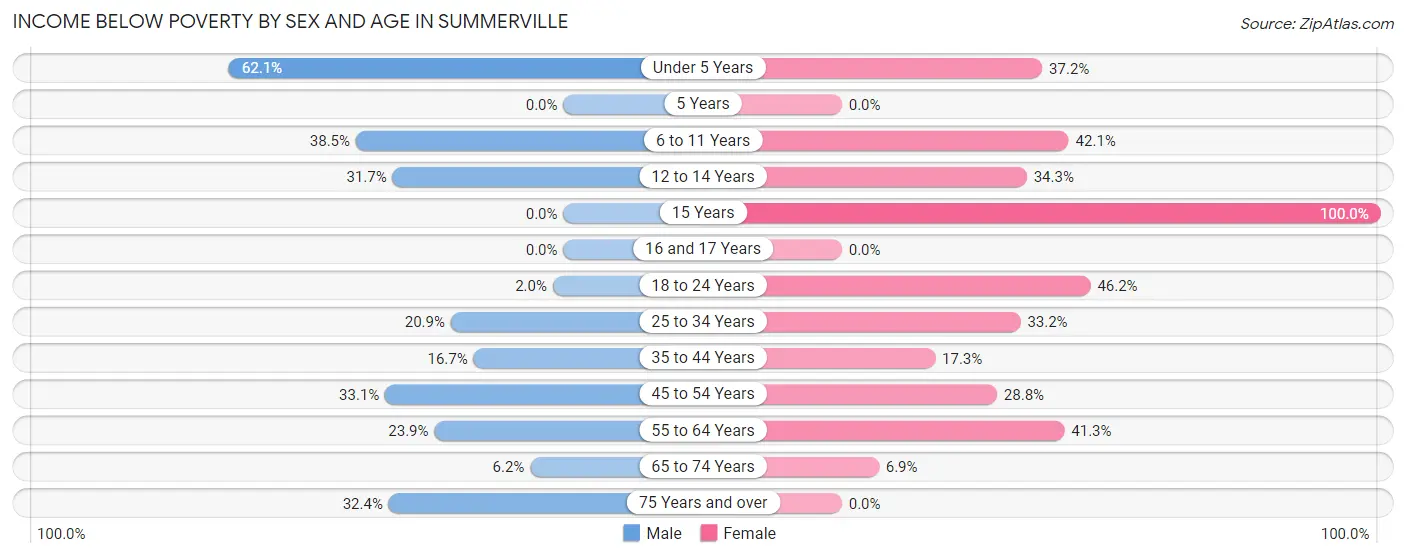
| Age Bracket | Male | Female |
| Under 5 Years | 144 (62.1%) | 45 (37.2%) |
| 5 Years | 0 (0.0%) | 0 (0.0%) |
| 6 to 11 Years | 67 (38.5%) | 24 (42.1%) |
| 12 to 14 Years | 26 (31.7%) | 23 (34.3%) |
| 15 Years | 0 (0.0%) | 23 (100.0%) |
| 16 and 17 Years | 0 (0.0%) | 0 (0.0%) |
| 18 to 24 Years | 2 (2.0%) | 78 (46.2%) |
| 25 to 34 Years | 33 (20.9%) | 62 (33.2%) |
| 35 to 44 Years | 40 (16.7%) | 31 (17.3%) |
| 45 to 54 Years | 44 (33.1%) | 114 (28.8%) |
| 55 to 64 Years | 79 (23.9%) | 195 (41.3%) |
| 65 to 74 Years | 11 (6.1%) | 14 (6.9%) |
| 75 Years and over | 35 (32.4%) | 0 (0.0%) |
| Total | 481 (26.5%) | 609 (27.6%) |
Income Above Poverty by Sex and Age in Summerville
According to the poverty statistics in Summerville, males aged 15 years and females aged 5 years are the age groups that are most secure financially, with 100.0% of males and 100.0% of females in these age groups living above the poverty line.
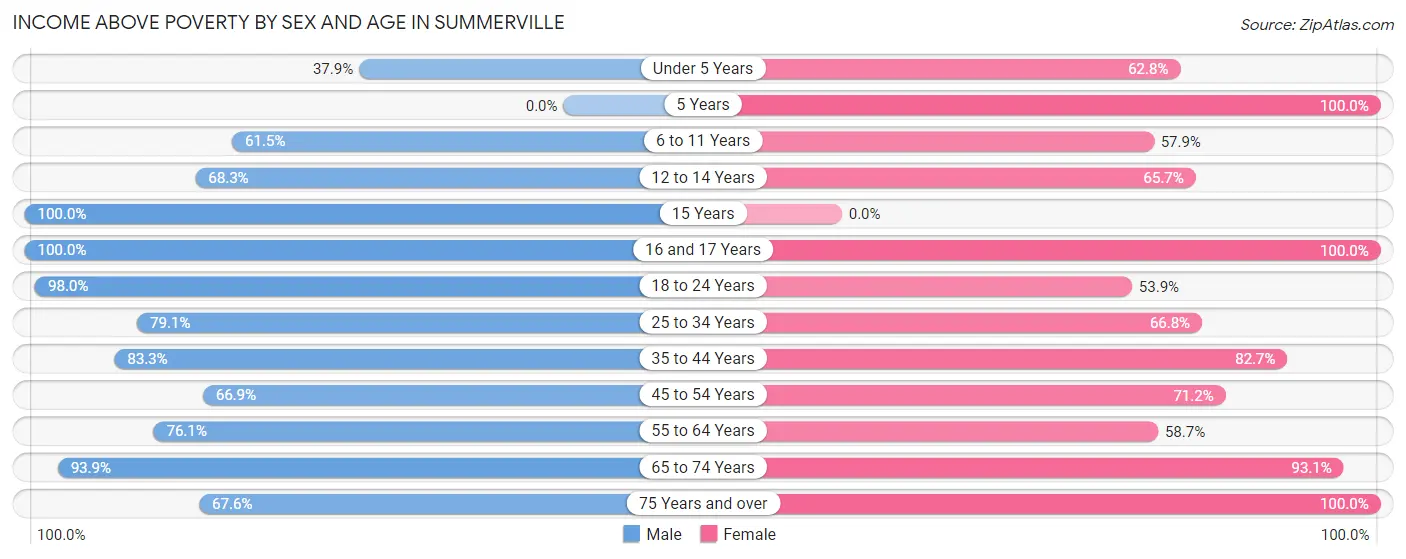
| Age Bracket | Male | Female |
| Under 5 Years | 88 (37.9%) | 76 (62.8%) |
| 5 Years | 0 (0.0%) | 48 (100.0%) |
| 6 to 11 Years | 107 (61.5%) | 33 (57.9%) |
| 12 to 14 Years | 56 (68.3%) | 44 (65.7%) |
| 15 Years | 66 (100.0%) | 0 (0.0%) |
| 16 and 17 Years | 12 (100.0%) | 34 (100.0%) |
| 18 to 24 Years | 100 (98.0%) | 91 (53.8%) |
| 25 to 34 Years | 125 (79.1%) | 125 (66.8%) |
| 35 to 44 Years | 200 (83.3%) | 148 (82.7%) |
| 45 to 54 Years | 89 (66.9%) | 282 (71.2%) |
| 55 to 64 Years | 251 (76.1%) | 277 (58.7%) |
| 65 to 74 Years | 168 (93.9%) | 190 (93.1%) |
| 75 Years and over | 73 (67.6%) | 247 (100.0%) |
| Total | 1,335 (73.5%) | 1,595 (72.4%) |
Income Below Poverty Among Married-Couple Families in Summerville
The poverty statistics for married-couple families in Summerville show that 2.7% or 14 of the total 514 families live below the poverty line. Families with 1 or 2 children have the highest poverty rate of 6.6%, comprising of 11 families. On the other hand, families with no children have the lowest poverty rate of 0.9%, which includes 3 families.
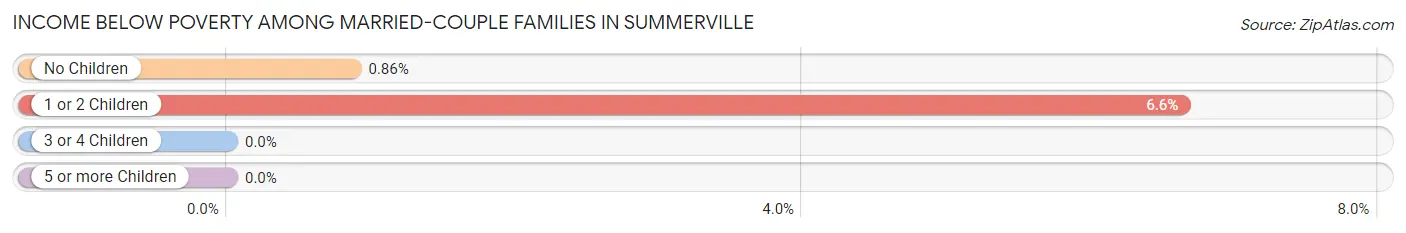
| Children | Above Poverty | Below Poverty |
| No Children | 345 (99.1%) | 3 (0.9%) |
| 1 or 2 Children | 155 (93.4%) | 11 (6.6%) |
| 3 or 4 Children | 0 (0.0%) | 0 (0.0%) |
| 5 or more Children | 0 (0.0%) | 0 (0.0%) |
| Total | 500 (97.3%) | 14 (2.7%) |
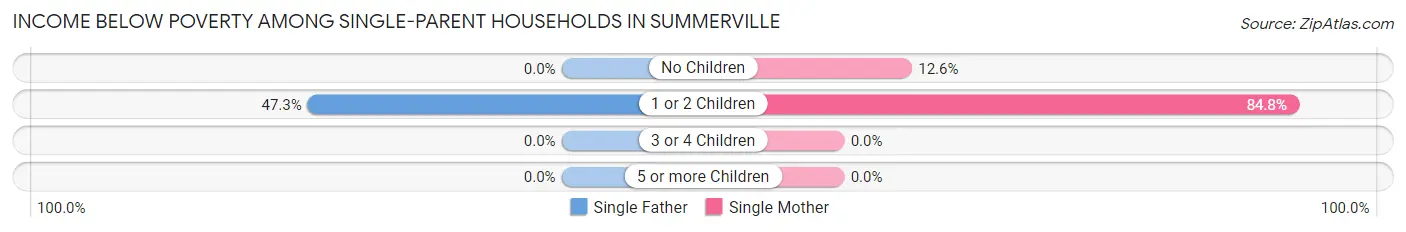
Income Below Poverty Among Single-Parent Households in Summerville
According to the poverty data in Summerville, 39.8% or 105 single-father households and 40.6% or 117 single-mother households are living below the poverty line. Among single-father households, those with 1 or 2 children have the highest poverty rate, with 105 households (47.3%) experiencing poverty. Likewise, among single-mother households, those with 1 or 2 children have the highest poverty rate, with 100 households (84.8%) falling below the poverty line.
| Children | Single Father | Single Mother |
| No Children | 0 (0.0%) | 17 (12.6%) |
| 1 or 2 Children | 105 (47.3%) | 100 (84.8%) |
| 3 or 4 Children | 0 (0.0%) | 0 (0.0%) |
| 5 or more Children | 0 (0.0%) | 0 (0.0%) |
| Total | 105 (39.8%) | 117 (40.6%) |
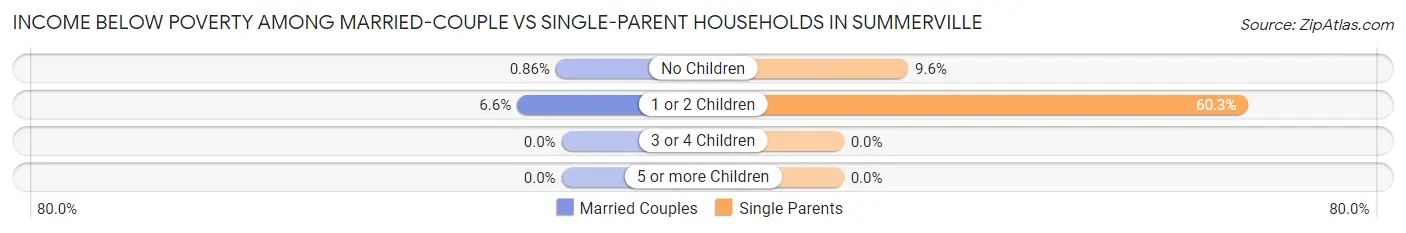
Income Below Poverty Among Married-Couple vs Single-Parent Households in Summerville
The poverty data for Summerville shows that 14 of the married-couple family households (2.7%) and 222 of the single-parent households (40.2%) are living below the poverty level. Within the married-couple family households, those with 1 or 2 children have the highest poverty rate, with 11 households (6.6%) falling below the poverty line. Among the single-parent households, those with 1 or 2 children have the highest poverty rate, with 205 household (60.3%) living below poverty.
| Children | Married-Couple Families | Single-Parent Households |
| No Children | 3 (0.9%) | 17 (9.6%) |
| 1 or 2 Children | 11 (6.6%) | 205 (60.3%) |
| 3 or 4 Children | 0 (0.0%) | 0 (0.0%) |
| 5 or more Children | 0 (0.0%) | 0 (0.0%) |
| Total | 14 (2.7%) | 222 (40.2%) |
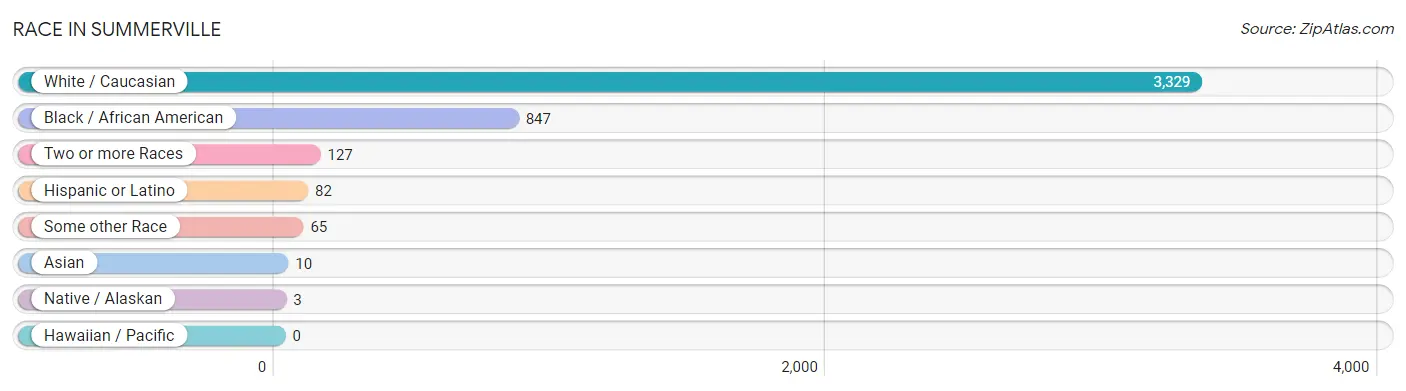
Race in Summerville
The most populous races in Summerville are White / Caucasian (3,329 | 76.0%), Black / African American (847 | 19.3%), and Two or more Races (127 | 2.9%).
| Race | # Population | % Population |
| Asian | 10 | 0.2% |
| Black / African American | 847 | 19.3% |
| Hawaiian / Pacific | 0 | 0.0% |
| Hispanic or Latino | 82 | 1.9% |
| Native / Alaskan | 3 | 0.1% |
| White / Caucasian | 3,329 | 76.0% |
| Two or more Races | 127 | 2.9% |
| Some other Race | 65 | 1.5% |
| Total | 4,381 | 100.0% |
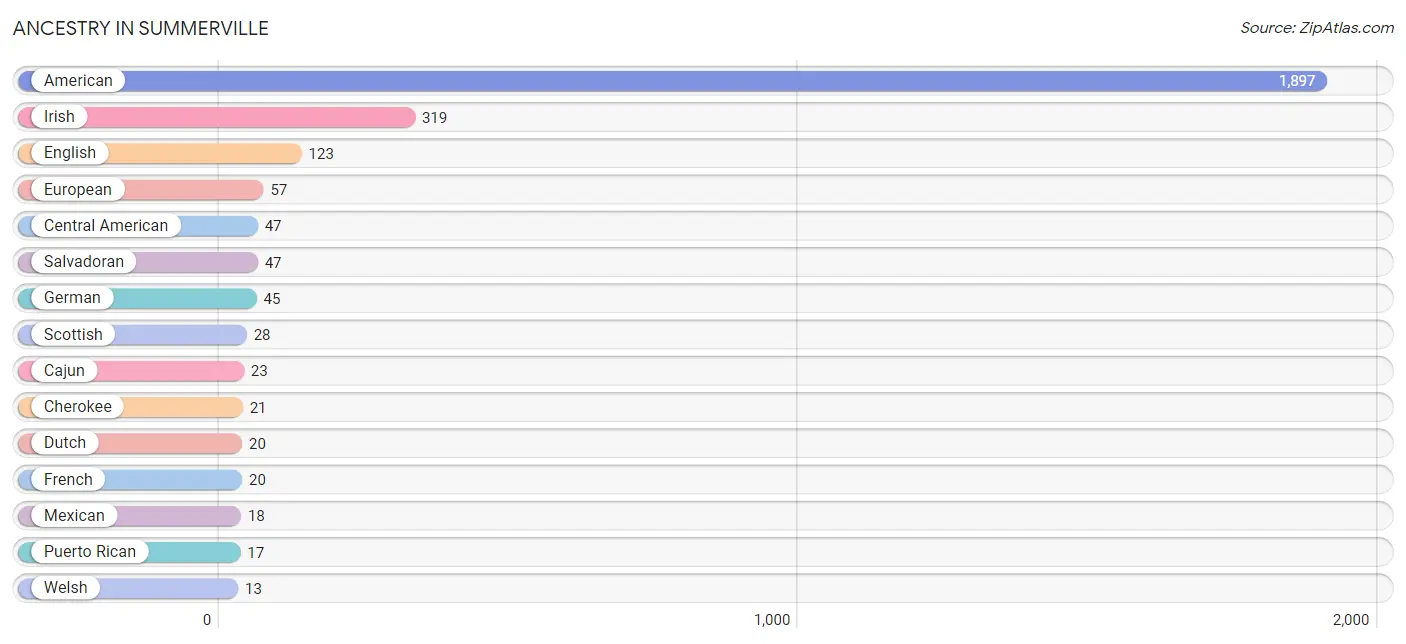
Ancestry in Summerville
The most populous ancestries reported in Summerville are American (1,897 | 43.3%), Irish (319 | 7.3%), English (123 | 2.8%), European (57 | 1.3%), and Central American (47 | 1.1%), together accounting for 55.8% of all Summerville residents.
| Ancestry | # Population | % Population |
| American | 1,897 | 43.3% |
| Cajun | 23 | 0.5% |
| Central American | 47 | 1.1% |
| Cherokee | 21 | 0.5% |
| Dutch | 20 | 0.5% |
| English | 123 | 2.8% |
| European | 57 | 1.3% |
| French | 20 | 0.5% |
| German | 45 | 1.0% |
| Irish | 319 | 7.3% |
| Italian | 8 | 0.2% |
| Mexican | 18 | 0.4% |
| Puerto Rican | 17 | 0.4% |
| Salvadoran | 47 | 1.1% |
| Scottish | 28 | 0.6% |
| Sri Lankan | 10 | 0.2% |
| Welsh | 13 | 0.3% | View All 17 Rows |
Immigrants in Summerville
The most numerous immigrant groups reported in Summerville came from Europe (67 | 1.5%), Bosnia and Herzegovina (59 | 1.3%), Eastern Europe (59 | 1.3%), Central America (55 | 1.3%), and Latin America (55 | 1.3%), together accounting for 6.8% of all Summerville residents.
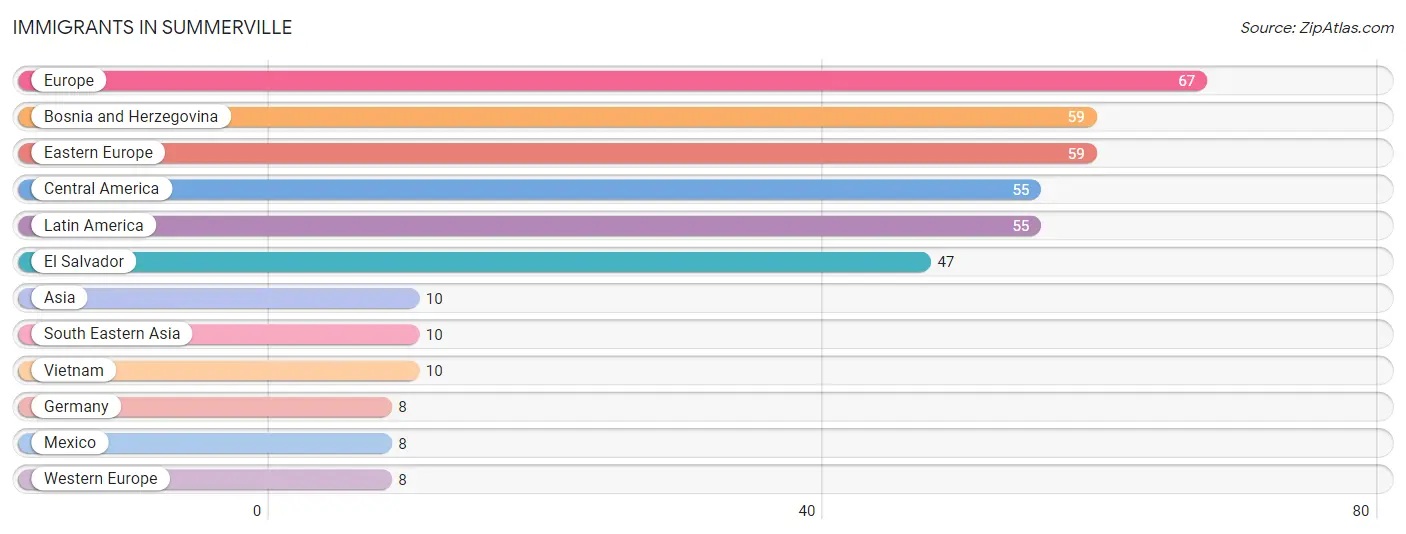
| Immigration Origin | # Population | % Population |
| Asia | 10 | 0.2% |
| Bosnia and Herzegovina | 59 | 1.3% |
| Central America | 55 | 1.3% |
| Eastern Europe | 59 | 1.3% |
| El Salvador | 47 | 1.1% |
| Europe | 67 | 1.5% |
| Germany | 8 | 0.2% |
| Latin America | 55 | 1.3% |
| Mexico | 8 | 0.2% |
| South Eastern Asia | 10 | 0.2% |
| Vietnam | 10 | 0.2% |
| Western Europe | 8 | 0.2% | View All 12 Rows |
Sex and Age in Summerville
Sex and Age in Summerville
The most populous age groups in Summerville are Under 5 Years (232 | 11.8%) for men and 60 to 64 Years (297 | 12.3%) for women.
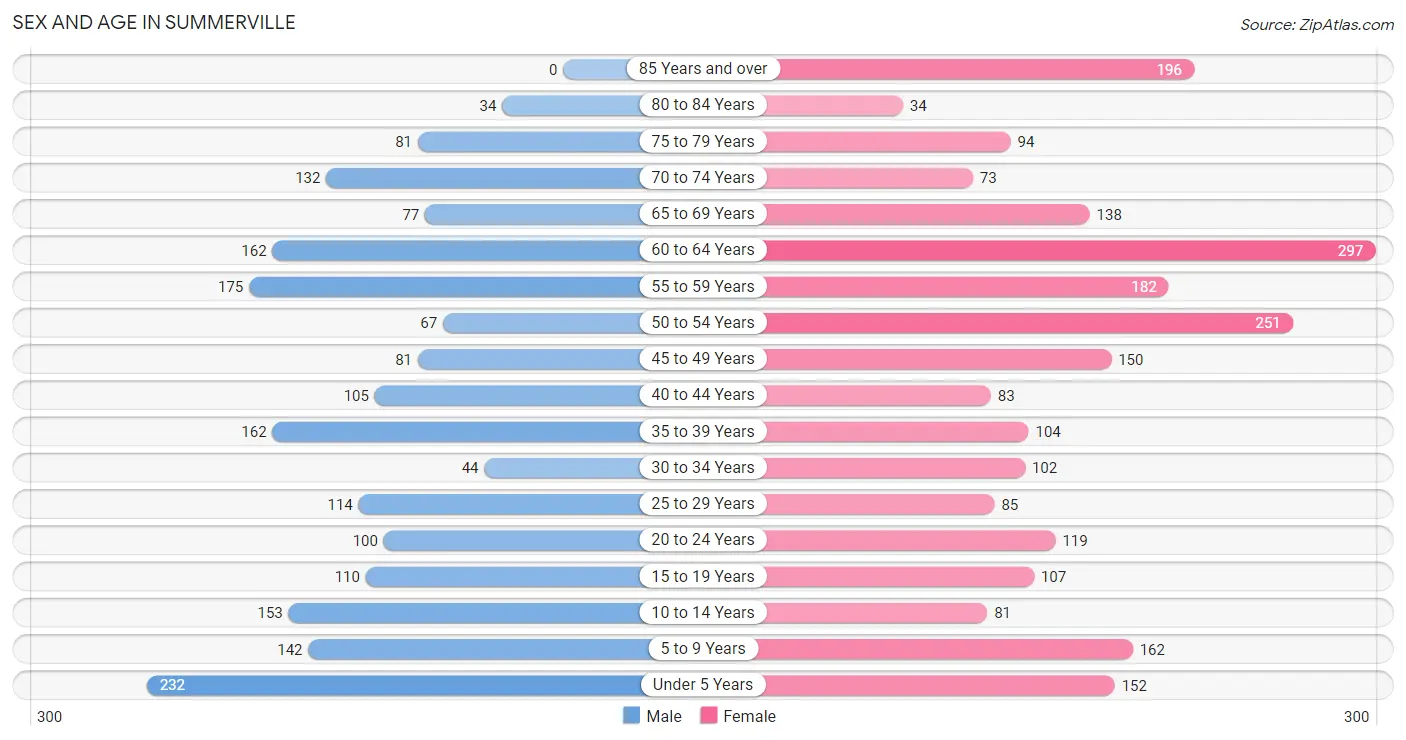
| Age Bracket | Male | Female |
| Under 5 Years | 232 (11.8%) | 152 (6.3%) |
| 5 to 9 Years | 142 (7.2%) | 162 (6.7%) |
| 10 to 14 Years | 153 (7.8%) | 81 (3.4%) |
| 15 to 19 Years | 110 (5.6%) | 107 (4.4%) |
| 20 to 24 Years | 100 (5.1%) | 119 (4.9%) |
| 25 to 29 Years | 114 (5.8%) | 85 (3.5%) |
| 30 to 34 Years | 44 (2.2%) | 102 (4.2%) |
| 35 to 39 Years | 162 (8.2%) | 104 (4.3%) |
| 40 to 44 Years | 105 (5.3%) | 83 (3.4%) |
| 45 to 49 Years | 81 (4.1%) | 150 (6.2%) |
| 50 to 54 Years | 67 (3.4%) | 251 (10.4%) |
| 55 to 59 Years | 175 (8.9%) | 182 (7.5%) |
| 60 to 64 Years | 162 (8.2%) | 297 (12.3%) |
| 65 to 69 Years | 77 (3.9%) | 138 (5.7%) |
| 70 to 74 Years | 132 (6.7%) | 73 (3.0%) |
| 75 to 79 Years | 81 (4.1%) | 94 (3.9%) |
| 80 to 84 Years | 34 (1.7%) | 34 (1.4%) |
| 85 Years and over | 0 (0.0%) | 196 (8.1%) |
| Total | 1,971 (100.0%) | 2,410 (100.0%) |
Families and Households in Summerville
Median Family Size in Summerville
The median family size in Summerville is 2.73 persons per family, with single male/father families (264 | 24.8%) accounting for the largest median family size of 2.82 persons per family. On the other hand, single female/mother families (288 | 27.0%) represent the smallest median family size with 2.69 persons per family.
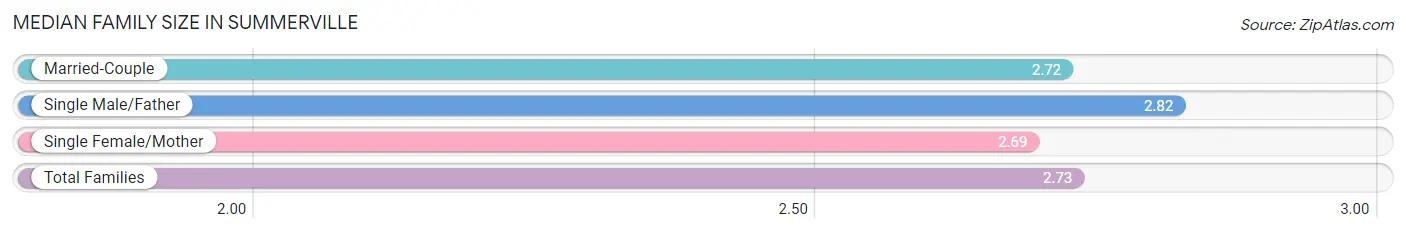
| Family Type | # Families | Family Size |
| Married-Couple | 514 (48.2%) | 2.72 |
| Single Male/Father | 264 (24.8%) | 2.82 |
| Single Female/Mother | 288 (27.0%) | 2.69 |
| Total Families | 1,066 (100.0%) | 2.73 |
Median Household Size in Summerville
The median household size in Summerville is 2.14 persons per household, with single male/father households (264 | 13.6%) accounting for the largest median household size of 4.1 persons per household. non-family households (879 | 45.2%) represent the smallest median household size with 1.03 persons per household.
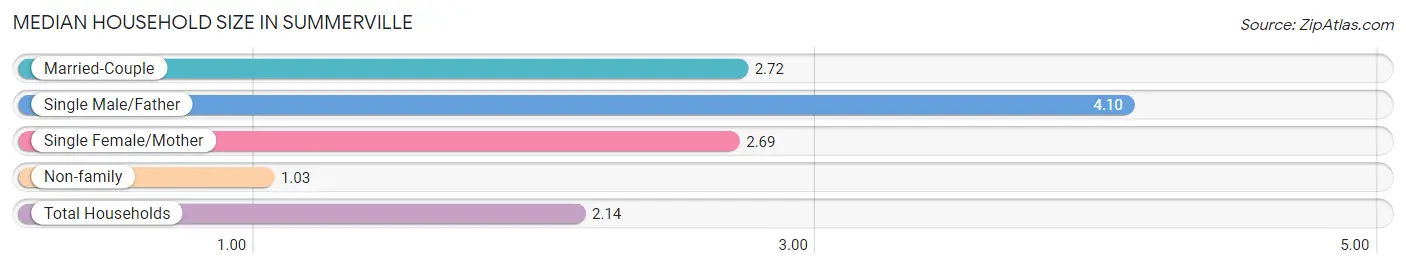
| Household Type | # Households | Household Size |
| Married-Couple | 514 (26.4%) | 2.72 |
| Single Male/Father | 264 (13.6%) | 4.10 |
| Single Female/Mother | 288 (14.8%) | 2.69 |
| Non-family | 879 (45.2%) | 1.03 |
| Total Households | 1,945 (100.0%) | 2.14 |
Household Size by Marriage Status in Summerville
Out of a total of 1,945 households in Summerville, 1,066 (54.8%) are family households, while 879 (45.2%) are nonfamily households. The most numerous type of family households are 2-person households, comprising 490, and the most common type of nonfamily households are 1-person households, comprising 857.
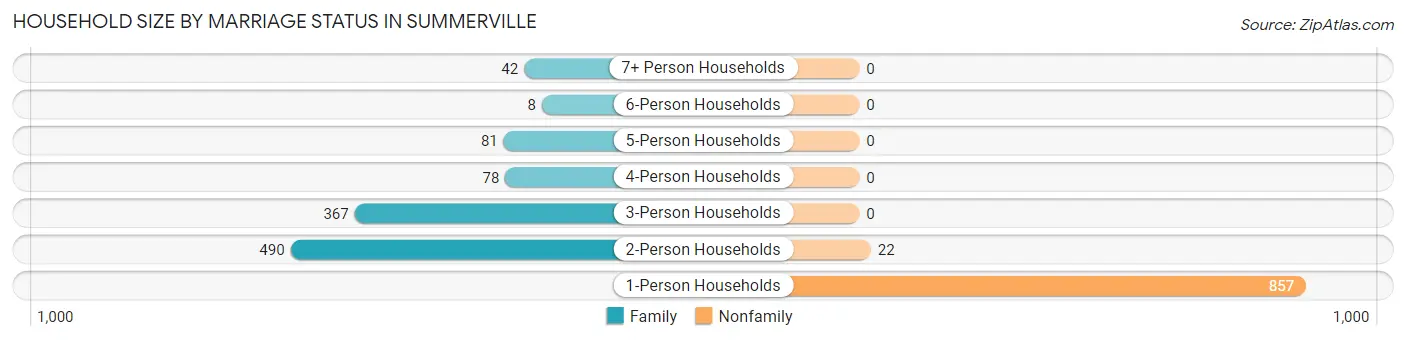
| Household Size | Family Households | Nonfamily Households |
| 1-Person Households | - | 857 (44.1%) |
| 2-Person Households | 490 (25.2%) | 22 (1.1%) |
| 3-Person Households | 367 (18.9%) | 0 (0.0%) |
| 4-Person Households | 78 (4.0%) | 0 (0.0%) |
| 5-Person Households | 81 (4.2%) | 0 (0.0%) |
| 6-Person Households | 8 (0.4%) | 0 (0.0%) |
| 7+ Person Households | 42 (2.2%) | 0 (0.0%) |
| Total | 1,066 (54.8%) | 879 (45.2%) |
Female Fertility in Summerville
Fertility by Age in Summerville
Average fertility rate in Summerville is 128.0 births per 1,000 women. Women in the age bracket of 20 to 34 years have the highest fertility rate with 324.0 births per 1,000 women. Women in the age bracket of 20 to 34 years acount for 100.0% of all women with births.
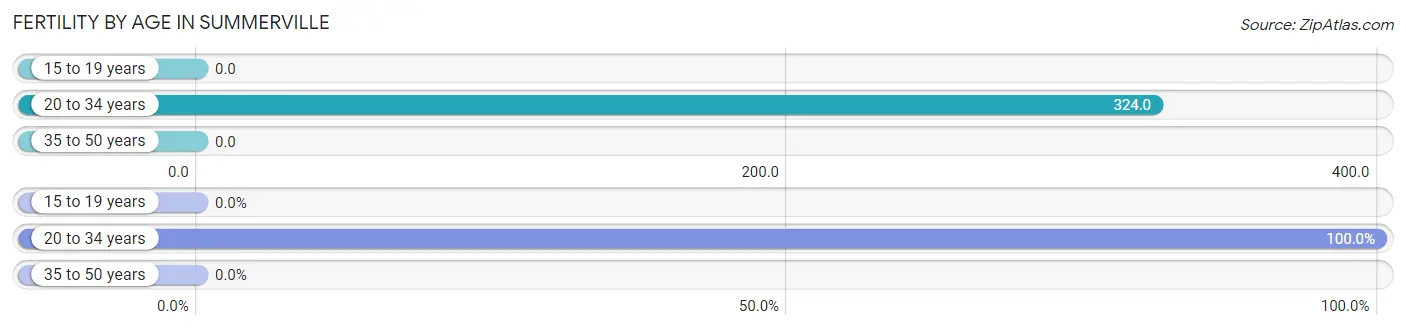
| Age Bracket | Women with Births | Births / 1,000 Women |
| 15 to 19 years | 0 (0.0%) | 0.0 |
| 20 to 34 years | 99 (100.0%) | 324.0 |
| 35 to 50 years | 0 (0.0%) | 0.0 |
| Total | 99 (100.0%) | 128.0 |
Fertility by Age by Marriage Status in Summerville
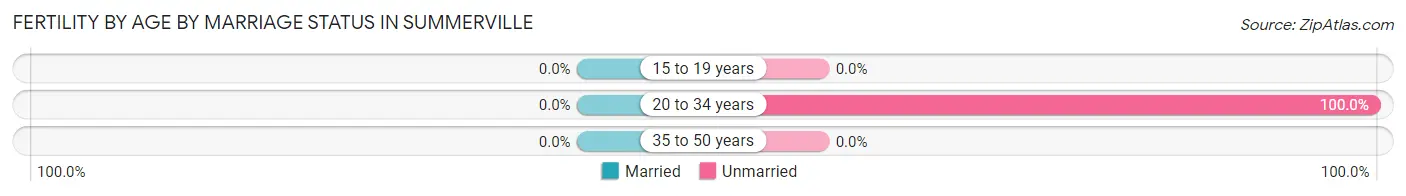
| Age Bracket | Married | Unmarried |
| 15 to 19 years | 0 (0.0%) | 0 (0.0%) |
| 20 to 34 years | 0 (0.0%) | 99 (100.0%) |
| 35 to 50 years | 0 (0.0%) | 0 (0.0%) |
| Total | 0 (0.0%) | 99 (100.0%) |
Fertility by Education in Summerville
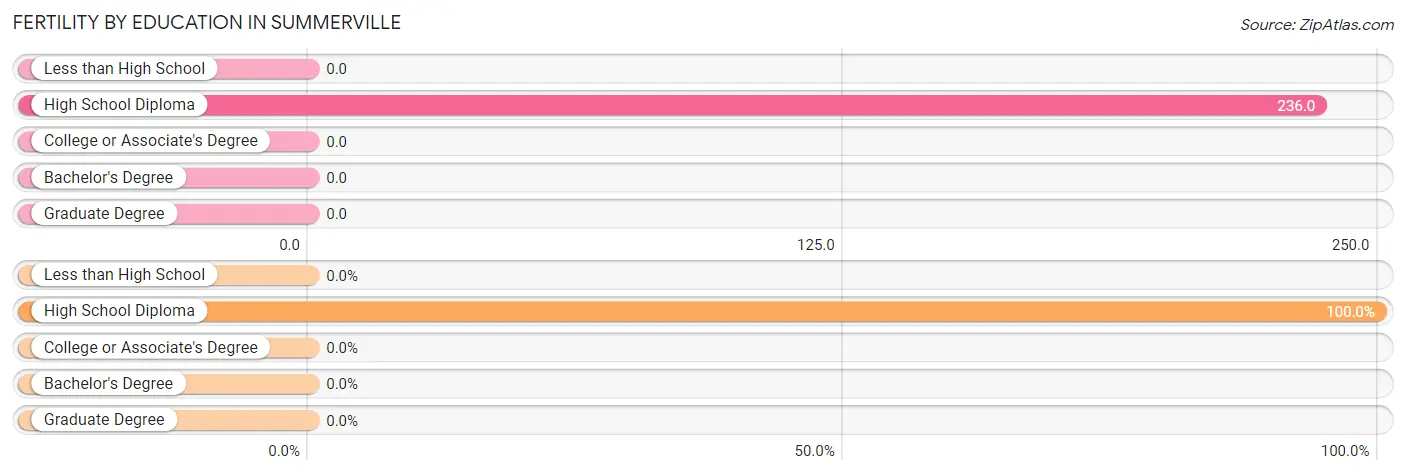
| Educational Attainment | Women with Births | Births / 1,000 Women |
| Less than High School | 0 (0.0%) | 0.0 |
| High School Diploma | 99 (100.0%) | 236.0 |
| College or Associate's Degree | 0 (0.0%) | 0.0 |
| Bachelor's Degree | 0 (0.0%) | 0.0 |
| Graduate Degree | 0 (0.0%) | 0.0 |
| Total | 99 (100.0%) | 128.0 |
Fertility by Education by Marriage Status in Summerville
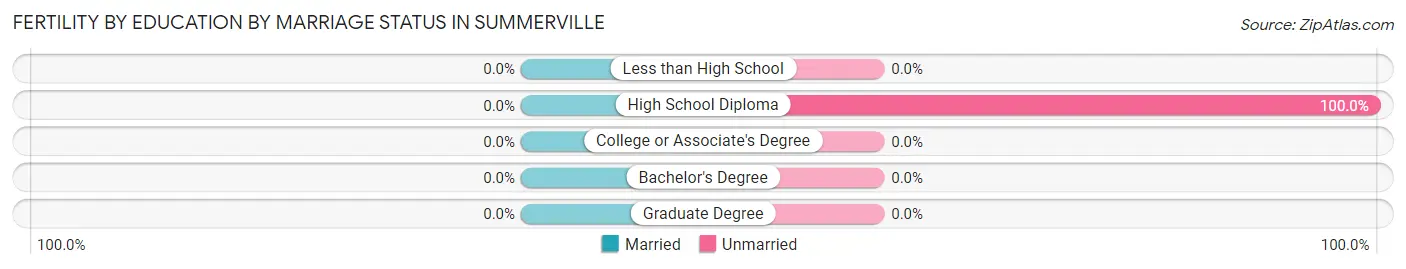
| Educational Attainment | Married | Unmarried |
| Less than High School | 0 (0.0%) | 0 (0.0%) |
| High School Diploma | 0 (0.0%) | 99 (100.0%) |
| College or Associate's Degree | 0 (0.0%) | 0 (0.0%) |
| Bachelor's Degree | 0 (0.0%) | 0 (0.0%) |
| Graduate Degree | 0 (0.0%) | 0 (0.0%) |
| Total | 0 (0.0%) | 99 (100.0%) |
Employment Characteristics in Summerville
Employment by Class of Employer in Summerville
Among the 1,349 employed individuals in Summerville, private company employees (1,180 | 87.5%), state government employees (64 | 4.7%), and local government employees (51 | 3.8%) make up the most common classes of employment.
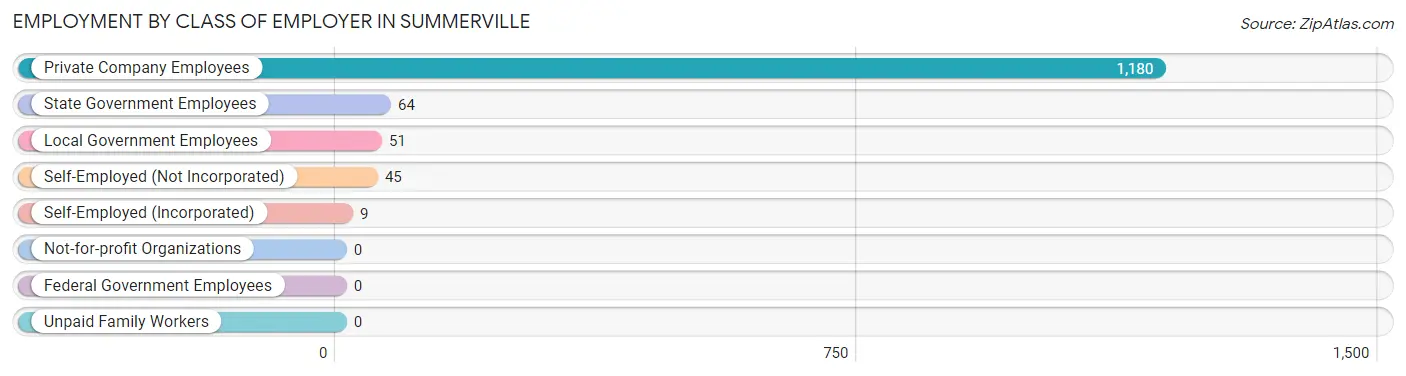
| Employer Class | # Employees | % Employees |
| Private Company Employees | 1,180 | 87.5% |
| Self-Employed (Incorporated) | 9 | 0.7% |
| Self-Employed (Not Incorporated) | 45 | 3.3% |
| Not-for-profit Organizations | 0 | 0.0% |
| Local Government Employees | 51 | 3.8% |
| State Government Employees | 64 | 4.7% |
| Federal Government Employees | 0 | 0.0% |
| Unpaid Family Workers | 0 | 0.0% |
| Total | 1,349 | 100.0% |
Employment Status by Age in Summerville
According to the labor force statistics for Summerville, out of the total population over 16 years of age (3,370), 42.5% or 1,432 individuals are in the labor force, with 4.7% or 67 of them unemployed. The age group with the highest labor force participation rate is 25 to 29 years, with 96.5% or 192 individuals in the labor force. Within the labor force, the 55 to 59 years age range has the highest percentage of unemployed individuals, with 16.7% or 14 of them being unemployed.
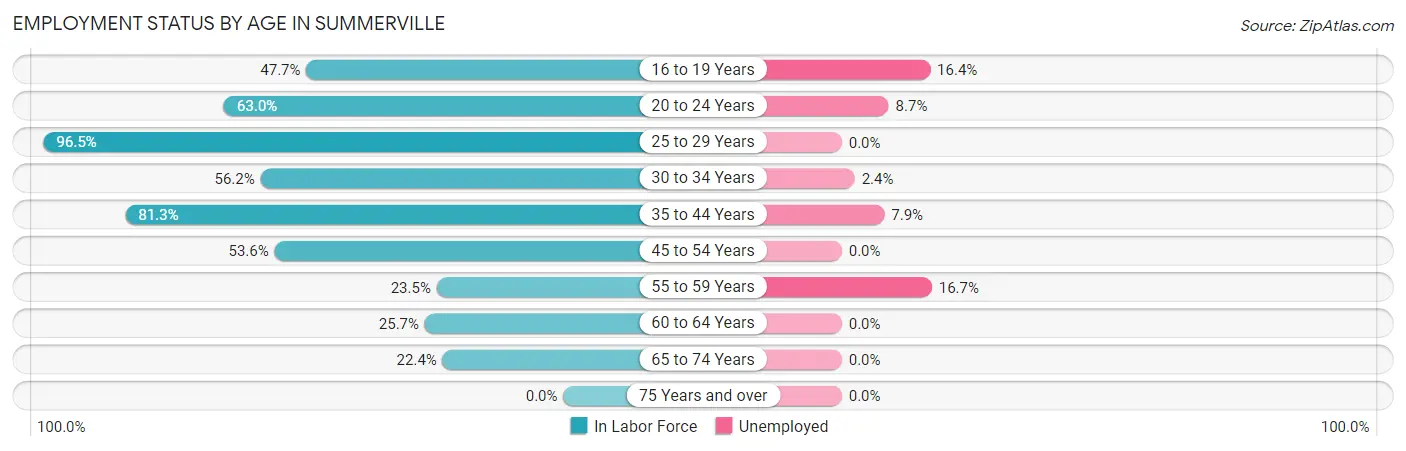
| Age Bracket | In Labor Force | Unemployed |
| 16 to 19 Years | 61 (47.7%) | 10 (16.4%) |
| 20 to 24 Years | 138 (63.0%) | 12 (8.7%) |
| 25 to 29 Years | 192 (96.5%) | 0 (0.0%) |
| 30 to 34 Years | 82 (56.2%) | 2 (2.4%) |
| 35 to 44 Years | 369 (81.3%) | 29 (7.9%) |
| 45 to 54 Years | 294 (53.6%) | 0 (0.0%) |
| 55 to 59 Years | 84 (23.5%) | 14 (16.7%) |
| 60 to 64 Years | 118 (25.7%) | 0 (0.0%) |
| 65 to 74 Years | 94 (22.4%) | 0 (0.0%) |
| 75 Years and over | 0 (0.0%) | 0 (0.0%) |
| Total | 1,432 (42.5%) | 67 (4.7%) |
Employment Status by Educational Attainment in Summerville
According to labor force statistics for Summerville, 52.6% of individuals (1,138) out of the total population between 25 and 64 years of age (2,164) are in the labor force, with 4.0% or 46 of them being unemployed. The group with the highest labor force participation rate are those with the educational attainment of bachelor's degree or higher, with 92.8% or 64 individuals in the labor force. Within the labor force, individuals with less than high school education have the highest percentage of unemployment, with 14.2% or 18 of them being unemployed.
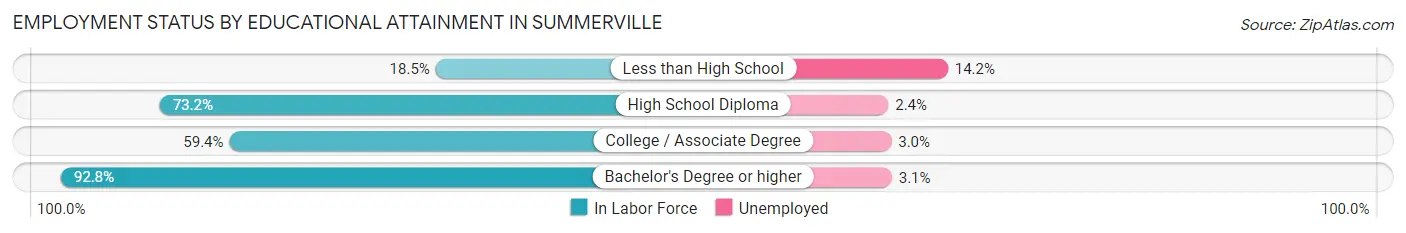
| Educational Attainment | In Labor Force | Unemployed |
| Less than High School | 127 (18.5%) | 97 (14.2%) |
| High School Diploma | 587 (73.2%) | 19 (2.4%) |
| College / Associate Degree | 361 (59.4%) | 18 (3.0%) |
| Bachelor's Degree or higher | 64 (92.8%) | 2 (3.1%) |
| Total | 1,138 (52.6%) | 87 (4.0%) |
Employment Occupations by Sex in Summerville
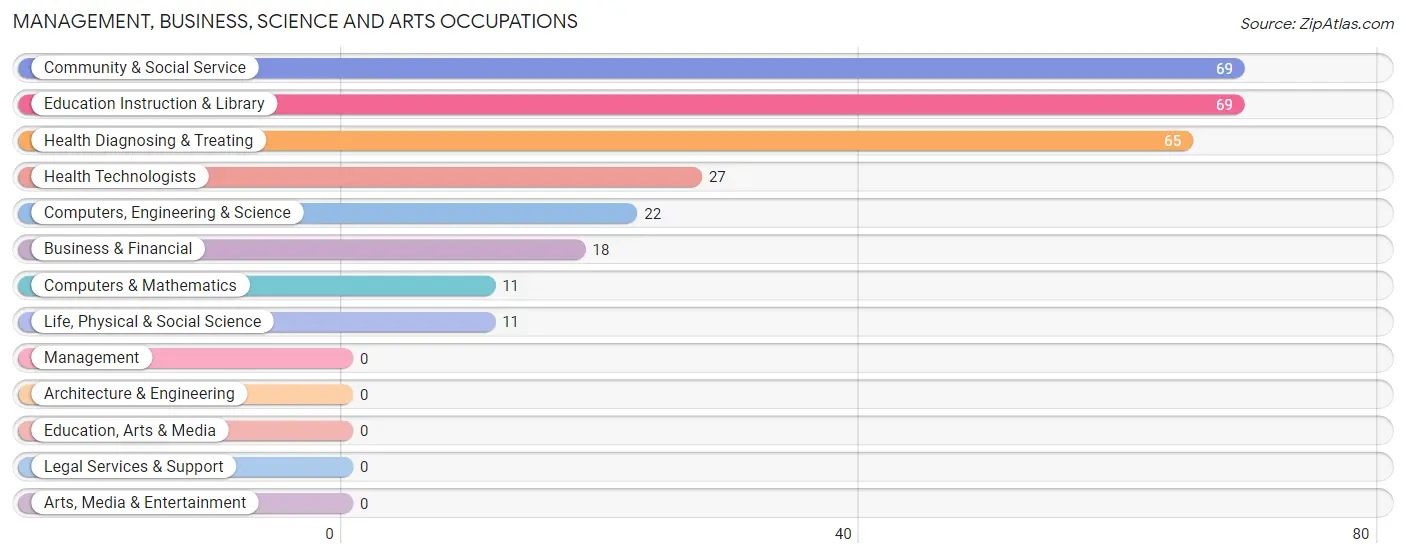
Management, Business, Science and Arts Occupations
The most common Management, Business, Science and Arts occupations in Summerville are Community & Social Service (69 | 5.1%), Education Instruction & Library (69 | 5.1%), Health Diagnosing & Treating (65 | 4.8%), Health Technologists (27 | 2.0%), and Computers, Engineering & Science (22 | 1.6%).
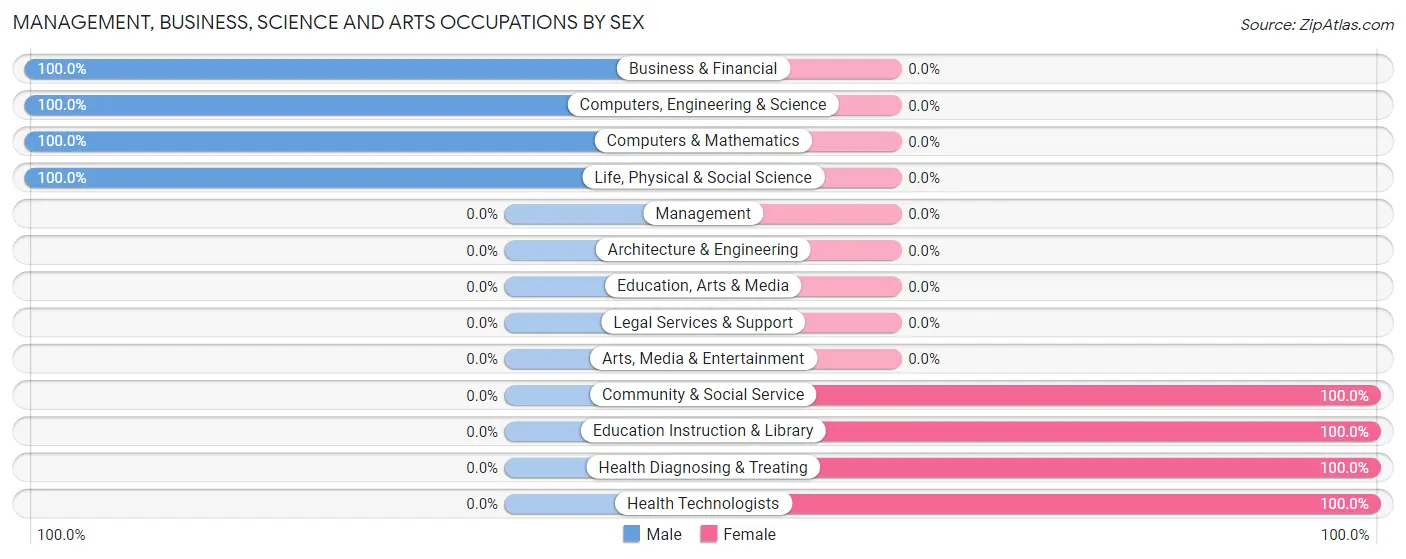
Management, Business, Science and Arts Occupations by Sex
Within the Management, Business, Science and Arts occupations in Summerville, the most male-oriented occupations are Business & Financial (100.0%), Computers, Engineering & Science (100.0%), and Computers & Mathematics (100.0%), while the most female-oriented occupations are Community & Social Service (100.0%), Education Instruction & Library (100.0%), and Health Diagnosing & Treating (100.0%).
| Occupation | Male | Female |
| Management | 0 (0.0%) | 0 (0.0%) |
| Business & Financial | 18 (100.0%) | 0 (0.0%) |
| Computers, Engineering & Science | 22 (100.0%) | 0 (0.0%) |
| Computers & Mathematics | 11 (100.0%) | 0 (0.0%) |
| Architecture & Engineering | 0 (0.0%) | 0 (0.0%) |
| Life, Physical & Social Science | 11 (100.0%) | 0 (0.0%) |
| Community & Social Service | 0 (0.0%) | 69 (100.0%) |
| Education, Arts & Media | 0 (0.0%) | 0 (0.0%) |
| Legal Services & Support | 0 (0.0%) | 0 (0.0%) |
| Education Instruction & Library | 0 (0.0%) | 69 (100.0%) |
| Arts, Media & Entertainment | 0 (0.0%) | 0 (0.0%) |
| Health Diagnosing & Treating | 0 (0.0%) | 65 (100.0%) |
| Health Technologists | 0 (0.0%) | 27 (100.0%) |
| Total (Category) | 40 (23.0%) | 134 (77.0%) |
| Total (Overall) | 534 (39.1%) | 831 (60.9%) |
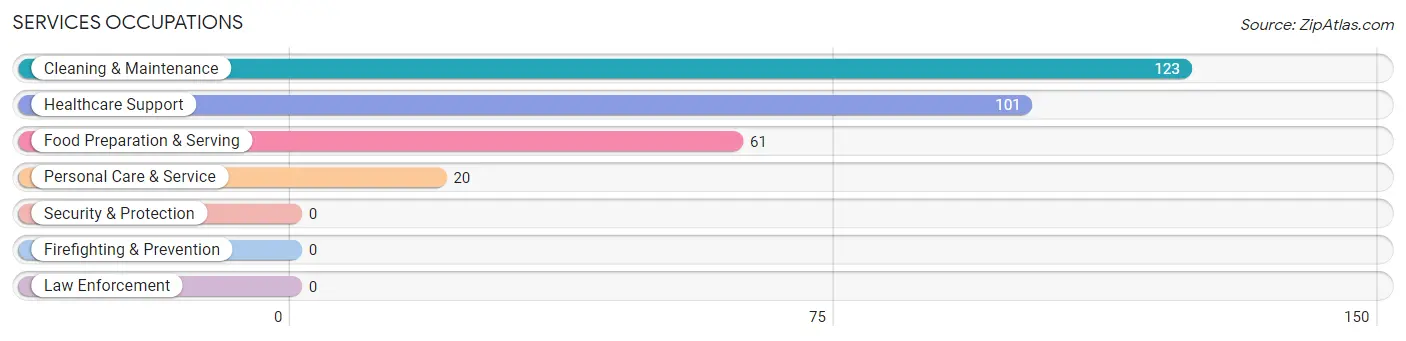
Services Occupations
The most common Services occupations in Summerville are Cleaning & Maintenance (123 | 9.0%), Healthcare Support (101 | 7.4%), Food Preparation & Serving (61 | 4.5%), and Personal Care & Service (20 | 1.5%).
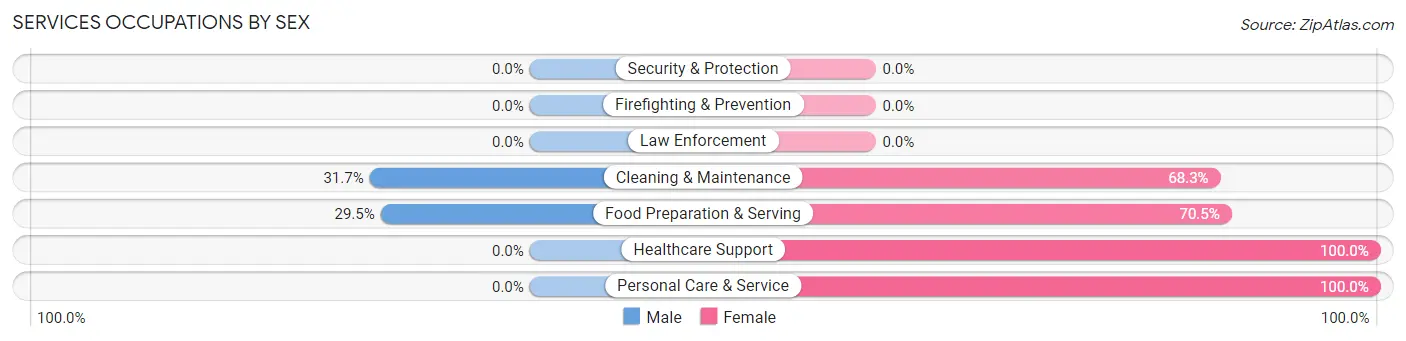
Services Occupations by Sex
Within the Services occupations in Summerville, the most male-oriented occupations are Cleaning & Maintenance (31.7%), and Food Preparation & Serving (29.5%), while the most female-oriented occupations are Healthcare Support (100.0%), Personal Care & Service (100.0%), and Food Preparation & Serving (70.5%).
| Occupation | Male | Female |
| Healthcare Support | 0 (0.0%) | 101 (100.0%) |
| Security & Protection | 0 (0.0%) | 0 (0.0%) |
| Firefighting & Prevention | 0 (0.0%) | 0 (0.0%) |
| Law Enforcement | 0 (0.0%) | 0 (0.0%) |
| Food Preparation & Serving | 18 (29.5%) | 43 (70.5%) |
| Cleaning & Maintenance | 39 (31.7%) | 84 (68.3%) |
| Personal Care & Service | 0 (0.0%) | 20 (100.0%) |
| Total (Category) | 57 (18.7%) | 248 (81.3%) |
| Total (Overall) | 534 (39.1%) | 831 (60.9%) |
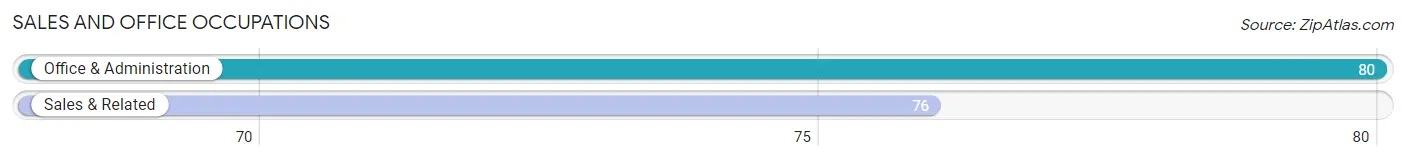
Sales and Office Occupations
The most common Sales and Office occupations in Summerville are Office & Administration (80 | 5.9%), and Sales & Related (76 | 5.6%).
Sales and Office Occupations by Sex

| Occupation | Male | Female |
| Sales & Related | 20 (26.3%) | 56 (73.7%) |
| Office & Administration | 15 (18.8%) | 65 (81.2%) |
| Total (Category) | 35 (22.4%) | 121 (77.6%) |
| Total (Overall) | 534 (39.1%) | 831 (60.9%) |
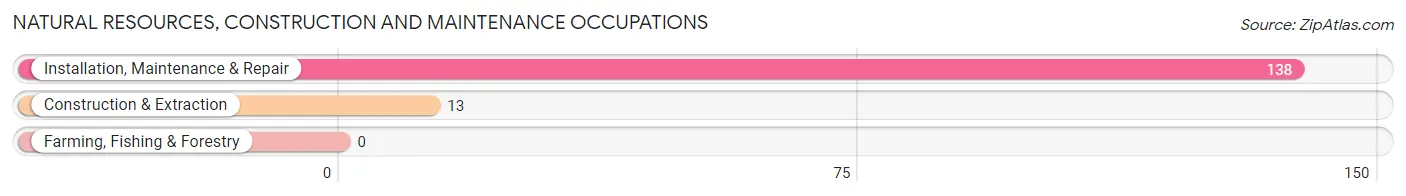
Natural Resources, Construction and Maintenance Occupations
The most common Natural Resources, Construction and Maintenance occupations in Summerville are Installation, Maintenance & Repair (138 | 10.1%), and Construction & Extraction (13 | 0.9%).
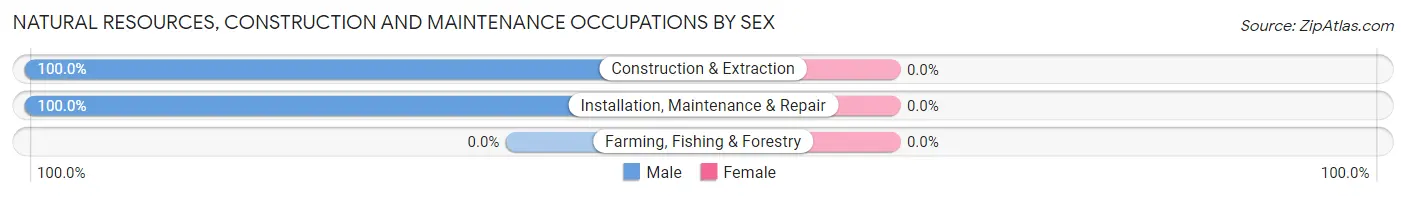
Natural Resources, Construction and Maintenance Occupations by Sex
| Occupation | Male | Female |
| Farming, Fishing & Forestry | 0 (0.0%) | 0 (0.0%) |
| Construction & Extraction | 13 (100.0%) | 0 (0.0%) |
| Installation, Maintenance & Repair | 138 (100.0%) | 0 (0.0%) |
| Total (Category) | 151 (100.0%) | 0 (0.0%) |
| Total (Overall) | 534 (39.1%) | 831 (60.9%) |
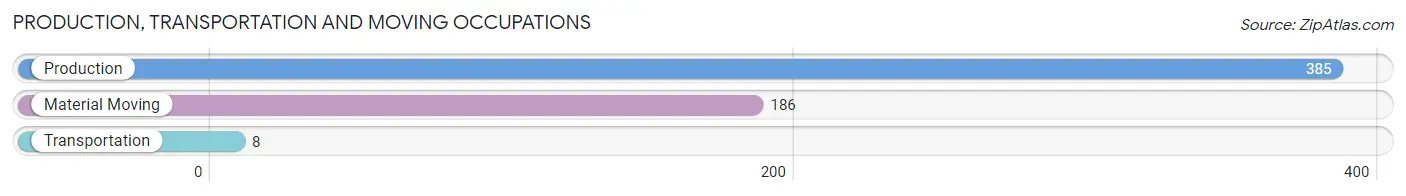
Production, Transportation and Moving Occupations
The most common Production, Transportation and Moving occupations in Summerville are Production (385 | 28.2%), Material Moving (186 | 13.6%), and Transportation (8 | 0.6%).
Production, Transportation and Moving Occupations by Sex
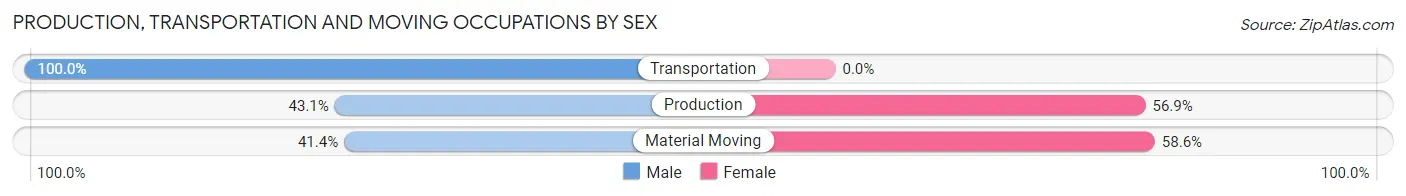
| Occupation | Male | Female |
| Production | 166 (43.1%) | 219 (56.9%) |
| Transportation | 8 (100.0%) | 0 (0.0%) |
| Material Moving | 77 (41.4%) | 109 (58.6%) |
| Total (Category) | 251 (43.3%) | 328 (56.7%) |
| Total (Overall) | 534 (39.1%) | 831 (60.9%) |
Employment Industries by Sex in Summerville
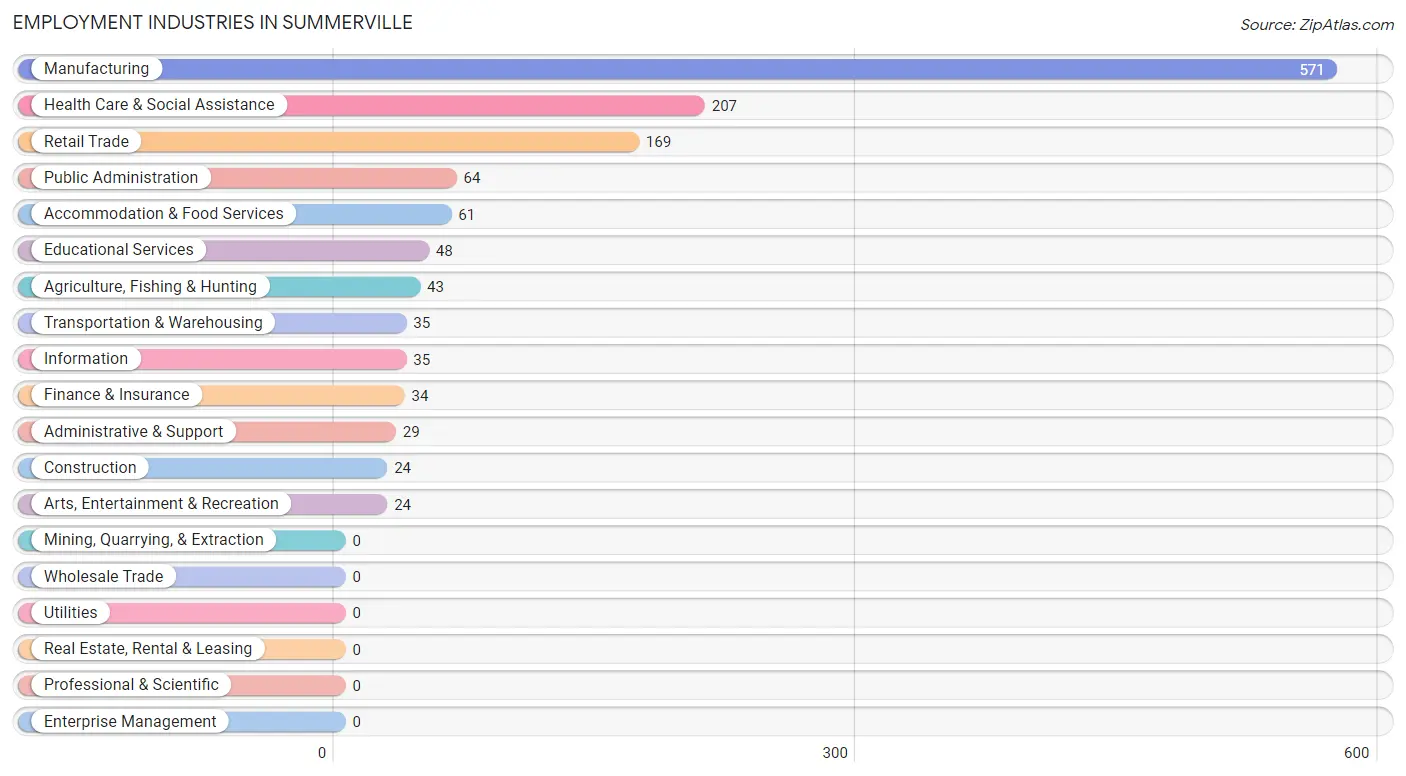
Employment Industries in Summerville
The major employment industries in Summerville include Manufacturing (571 | 41.8%), Health Care & Social Assistance (207 | 15.2%), Retail Trade (169 | 12.4%), Public Administration (64 | 4.7%), and Accommodation & Food Services (61 | 4.5%).
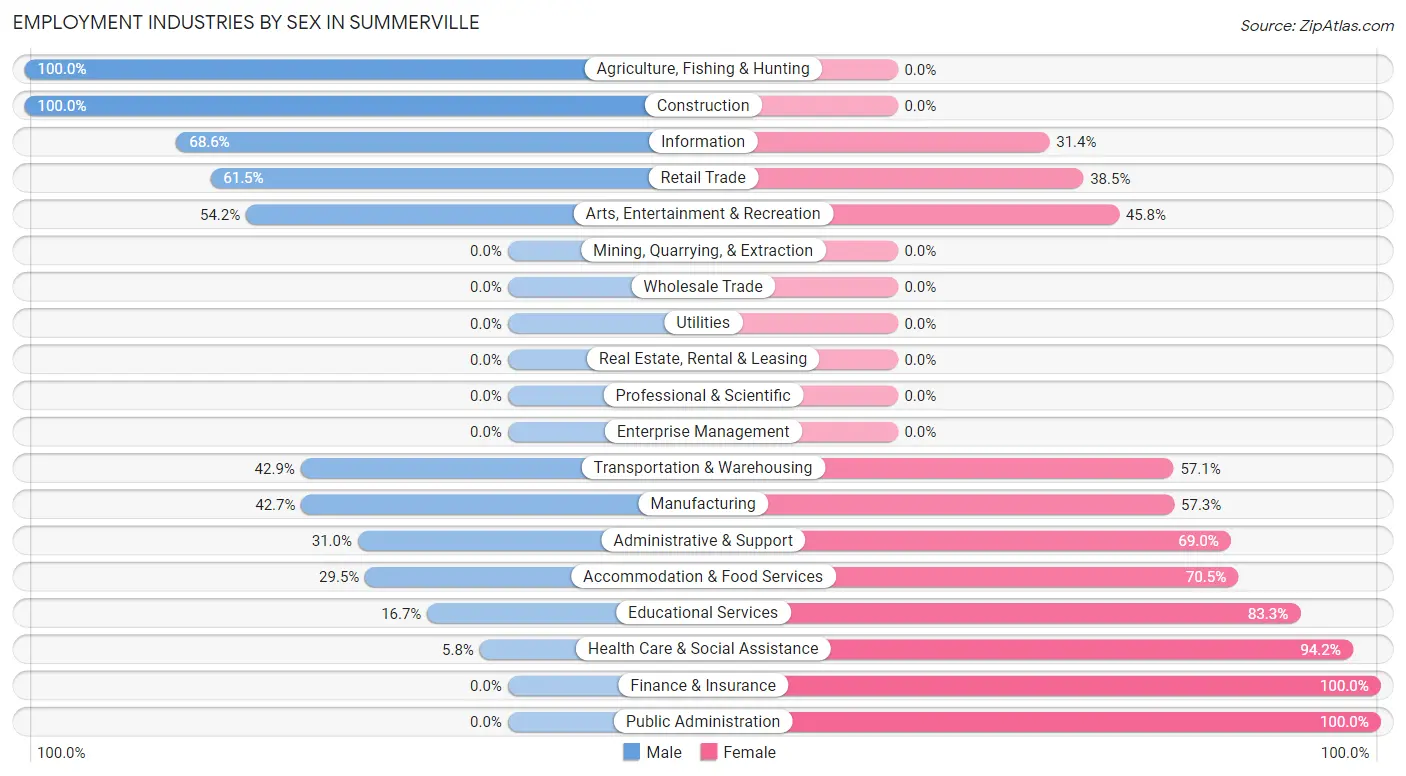
Employment Industries by Sex in Summerville
The Summerville industries that see more men than women are Agriculture, Fishing & Hunting (100.0%), Construction (100.0%), and Information (68.6%), whereas the industries that tend to have a higher number of women are Finance & Insurance (100.0%), Public Administration (100.0%), and Health Care & Social Assistance (94.2%).
| Industry | Male | Female |
| Agriculture, Fishing & Hunting | 43 (100.0%) | 0 (0.0%) |
| Mining, Quarrying, & Extraction | 0 (0.0%) | 0 (0.0%) |
| Construction | 24 (100.0%) | 0 (0.0%) |
| Manufacturing | 244 (42.7%) | 327 (57.3%) |
| Wholesale Trade | 0 (0.0%) | 0 (0.0%) |
| Retail Trade | 104 (61.5%) | 65 (38.5%) |
| Transportation & Warehousing | 15 (42.9%) | 20 (57.1%) |
| Utilities | 0 (0.0%) | 0 (0.0%) |
| Information | 24 (68.6%) | 11 (31.4%) |
| Finance & Insurance | 0 (0.0%) | 34 (100.0%) |
| Real Estate, Rental & Leasing | 0 (0.0%) | 0 (0.0%) |
| Professional & Scientific | 0 (0.0%) | 0 (0.0%) |
| Enterprise Management | 0 (0.0%) | 0 (0.0%) |
| Administrative & Support | 9 (31.0%) | 20 (69.0%) |
| Educational Services | 8 (16.7%) | 40 (83.3%) |
| Health Care & Social Assistance | 12 (5.8%) | 195 (94.2%) |
| Arts, Entertainment & Recreation | 13 (54.2%) | 11 (45.8%) |
| Accommodation & Food Services | 18 (29.5%) | 43 (70.5%) |
| Public Administration | 0 (0.0%) | 64 (100.0%) |
| Total | 534 (39.1%) | 831 (60.9%) |
Education in Summerville
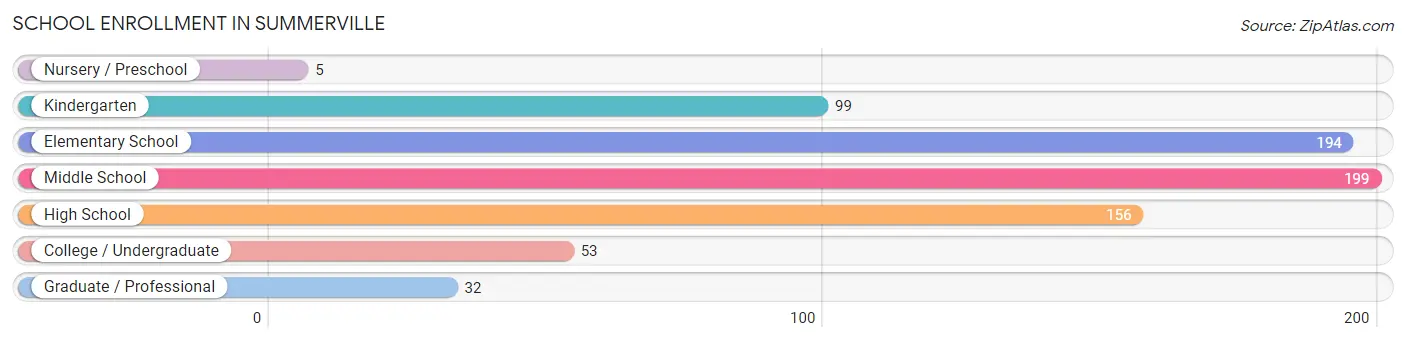
School Enrollment in Summerville
The most common levels of schooling among the 738 students in Summerville are middle school (199 | 27.0%), elementary school (194 | 26.3%), and high school (156 | 21.1%).
| School Level | # Students | % Students |
| Nursery / Preschool | 5 | 0.7% |
| Kindergarten | 99 | 13.4% |
| Elementary School | 194 | 26.3% |
| Middle School | 199 | 27.0% |
| High School | 156 | 21.1% |
| College / Undergraduate | 53 | 7.2% |
| Graduate / Professional | 32 | 4.3% |
| Total | 738 | 100.0% |
School Enrollment by Age by Funding Source in Summerville
Out of a total of 738 students who are enrolled in schools in Summerville, 31 (4.2%) attend a private institution, while the remaining 707 (95.8%) are enrolled in public schools. The age group of 18 to 19 year olds has the highest likelihood of being enrolled in private schools, with 9 (56.2% in the age bracket) enrolled. Conversely, the age group of 3 to 4 year olds has the lowest likelihood of being enrolled in a private school, with 5 (100.0% in the age bracket) attending a public institution.
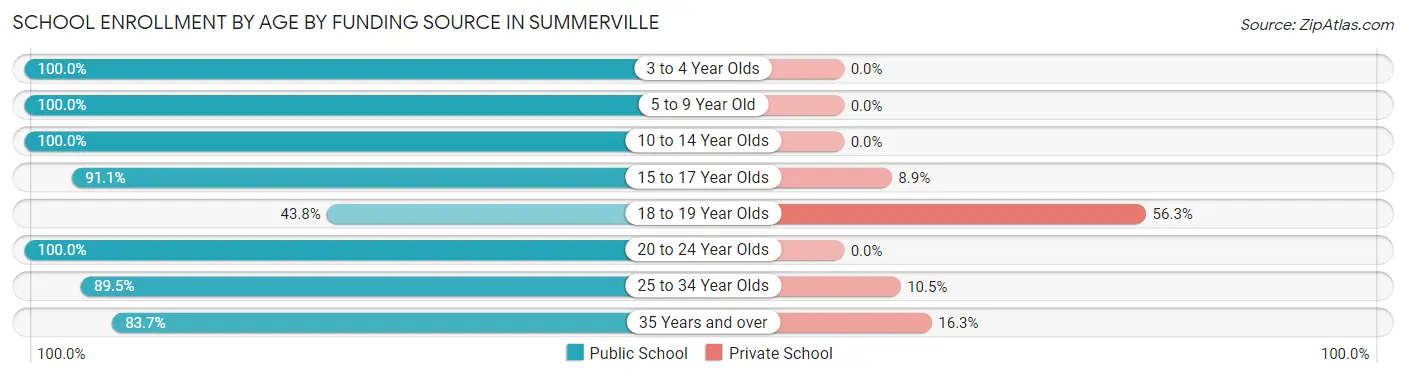
| Age Bracket | Public School | Private School |
| 3 to 4 Year Olds | 5 (100.0%) | 0 (0.0%) |
| 5 to 9 Year Old | 279 (100.0%) | 0 (0.0%) |
| 10 to 14 Year Olds | 234 (100.0%) | 0 (0.0%) |
| 15 to 17 Year Olds | 123 (91.1%) | 12 (8.9%) |
| 18 to 19 Year Olds | 7 (43.8%) | 9 (56.2%) |
| 20 to 24 Year Olds | 1 (100.0%) | 0 (0.0%) |
| 25 to 34 Year Olds | 17 (89.5%) | 2 (10.5%) |
| 35 Years and over | 41 (83.7%) | 8 (16.3%) |
| Total | 707 (95.8%) | 31 (4.2%) |
Educational Attainment by Field of Study in Summerville
Science & technology (39 | 27.3%), business (34 | 23.8%), psychology (29 | 20.3%), education (27 | 18.9%), and engineering (7 | 4.9%) are the most common fields of study among 143 individuals in Summerville who have obtained a bachelor's degree or higher.
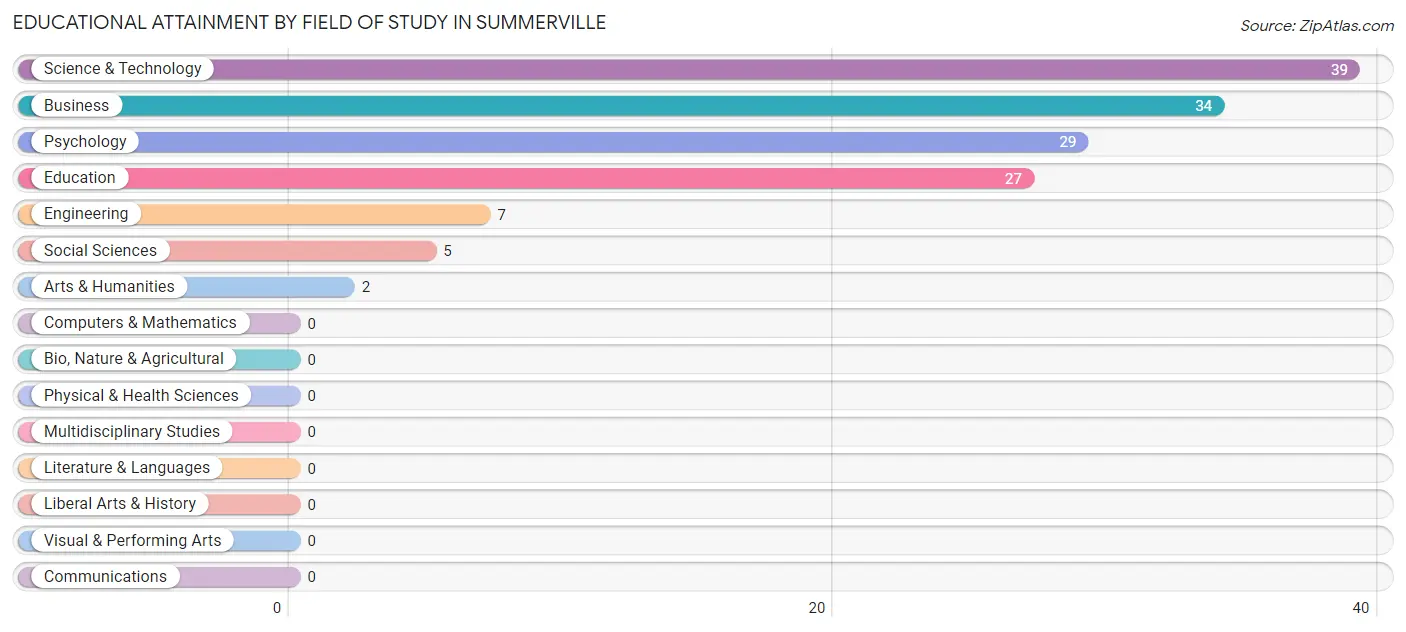
| Field of Study | # Graduates | % Graduates |
| Computers & Mathematics | 0 | 0.0% |
| Bio, Nature & Agricultural | 0 | 0.0% |
| Physical & Health Sciences | 0 | 0.0% |
| Psychology | 29 | 20.3% |
| Social Sciences | 5 | 3.5% |
| Engineering | 7 | 4.9% |
| Multidisciplinary Studies | 0 | 0.0% |
| Science & Technology | 39 | 27.3% |
| Business | 34 | 23.8% |
| Education | 27 | 18.9% |
| Literature & Languages | 0 | 0.0% |
| Liberal Arts & History | 0 | 0.0% |
| Visual & Performing Arts | 0 | 0.0% |
| Communications | 0 | 0.0% |
| Arts & Humanities | 2 | 1.4% |
| Total | 143 | 100.0% |
Transportation & Commute in Summerville
Vehicle Availability by Sex in Summerville
The most prevalent vehicle ownership categories in Summerville are males with 2 vehicles (261, accounting for 48.9%) and females with 2 vehicles (382, making up 32.0%).
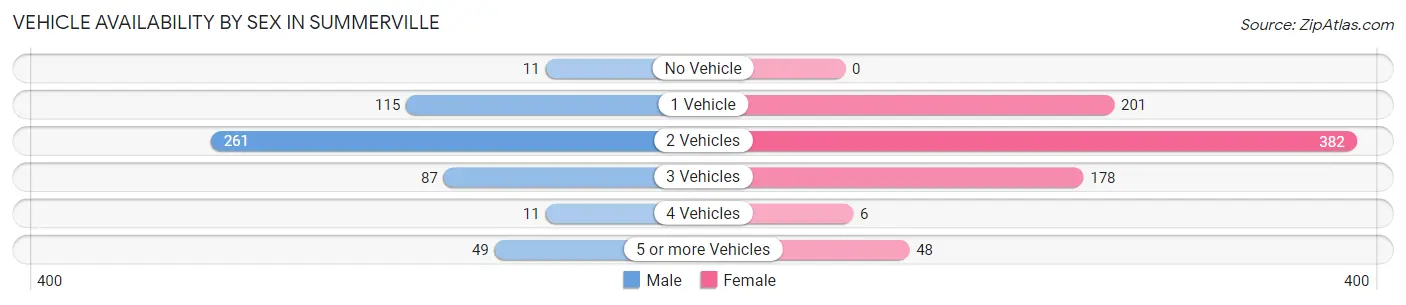
| Vehicles Available | Male | Female |
| No Vehicle | 11 (2.1%) | 0 (0.0%) |
| 1 Vehicle | 115 (21.5%) | 201 (24.7%) |
| 2 Vehicles | 261 (48.9%) | 382 (46.9%) |
| 3 Vehicles | 87 (16.3%) | 178 (21.8%) |
| 4 Vehicles | 11 (2.1%) | 6 (0.7%) |
| 5 or more Vehicles | 49 (9.2%) | 48 (5.9%) |
| Total | 534 (100.0%) | 815 (100.0%) |
Commute Time in Summerville
The most frequently occuring commute durations in Summerville are 15 to 19 minutes (281 commuters, 20.8%), 45 to 59 minutes (217 commuters, 16.1%), and 30 to 34 minutes (183 commuters, 13.6%).
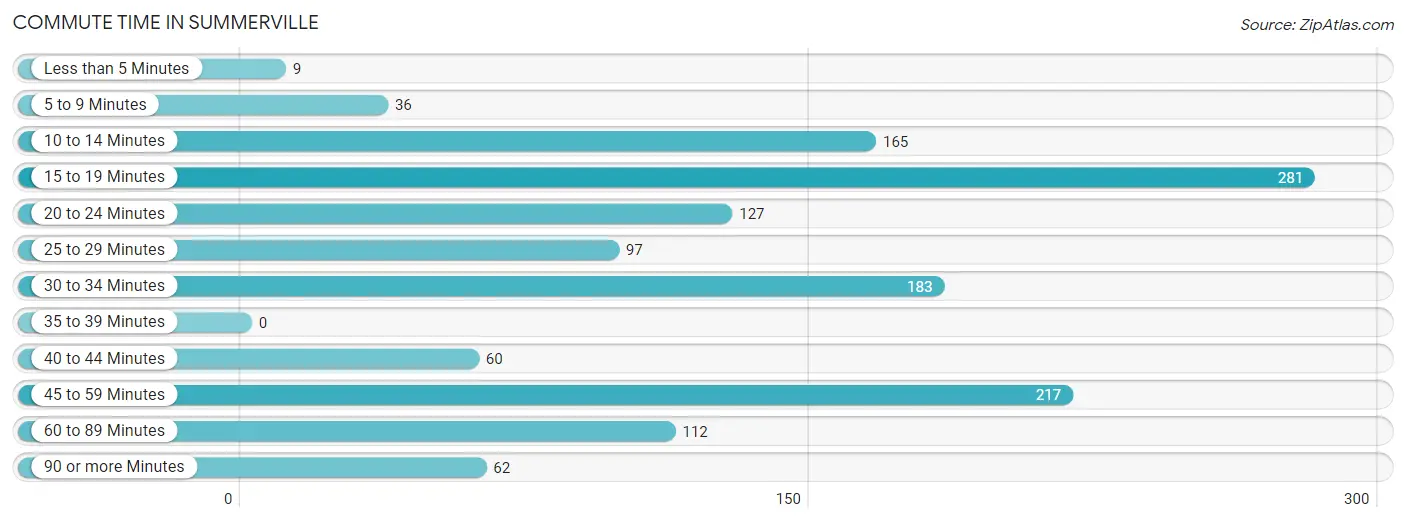
| Commute Time | # Commuters | % Commuters |
| Less than 5 Minutes | 9 | 0.7% |
| 5 to 9 Minutes | 36 | 2.7% |
| 10 to 14 Minutes | 165 | 12.2% |
| 15 to 19 Minutes | 281 | 20.8% |
| 20 to 24 Minutes | 127 | 9.4% |
| 25 to 29 Minutes | 97 | 7.2% |
| 30 to 34 Minutes | 183 | 13.6% |
| 35 to 39 Minutes | 0 | 0.0% |
| 40 to 44 Minutes | 60 | 4.4% |
| 45 to 59 Minutes | 217 | 16.1% |
| 60 to 89 Minutes | 112 | 8.3% |
| 90 or more Minutes | 62 | 4.6% |
Commute Time by Sex in Summerville
The most common commute times in Summerville are 15 to 19 minutes (125 commuters, 23.4%) for males and 15 to 19 minutes (156 commuters, 19.1%) for females.
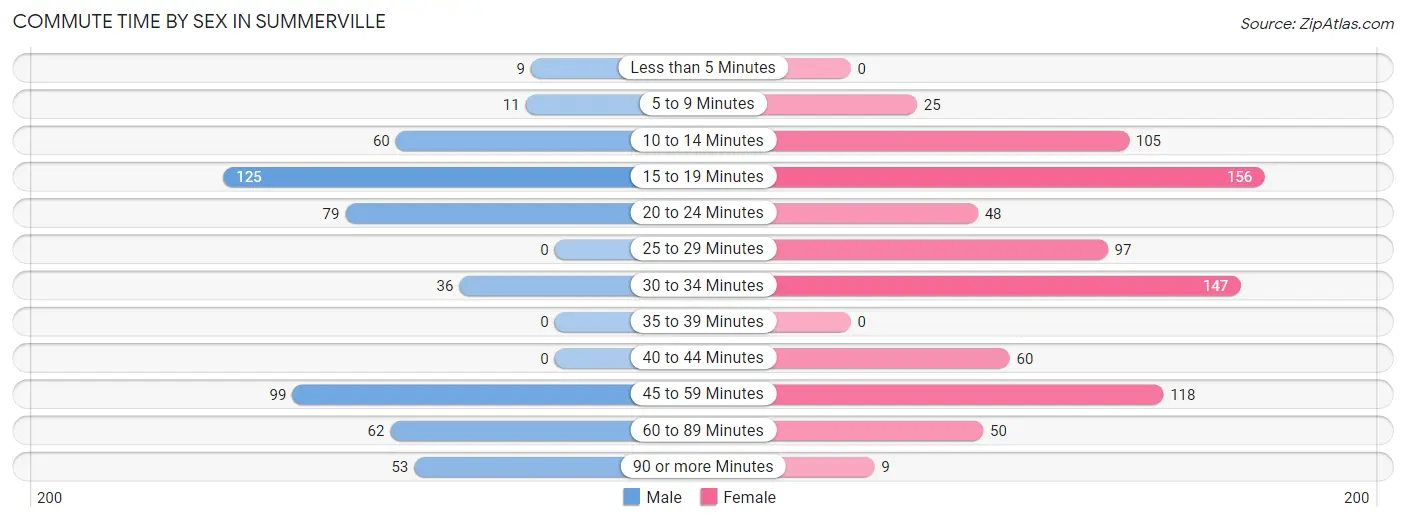
| Commute Time | Male | Female |
| Less than 5 Minutes | 9 (1.7%) | 0 (0.0%) |
| 5 to 9 Minutes | 11 (2.1%) | 25 (3.1%) |
| 10 to 14 Minutes | 60 (11.2%) | 105 (12.9%) |
| 15 to 19 Minutes | 125 (23.4%) | 156 (19.1%) |
| 20 to 24 Minutes | 79 (14.8%) | 48 (5.9%) |
| 25 to 29 Minutes | 0 (0.0%) | 97 (11.9%) |
| 30 to 34 Minutes | 36 (6.7%) | 147 (18.0%) |
| 35 to 39 Minutes | 0 (0.0%) | 0 (0.0%) |
| 40 to 44 Minutes | 0 (0.0%) | 60 (7.4%) |
| 45 to 59 Minutes | 99 (18.5%) | 118 (14.5%) |
| 60 to 89 Minutes | 62 (11.6%) | 50 (6.1%) |
| 90 or more Minutes | 53 (9.9%) | 9 (1.1%) |
Time of Departure to Work by Sex in Summerville
The most frequent times of departure to work in Summerville are 6:00 AM to 6:29 AM (96, 18.0%) for males and 7:00 AM to 7:29 AM (150, 18.4%) for females.
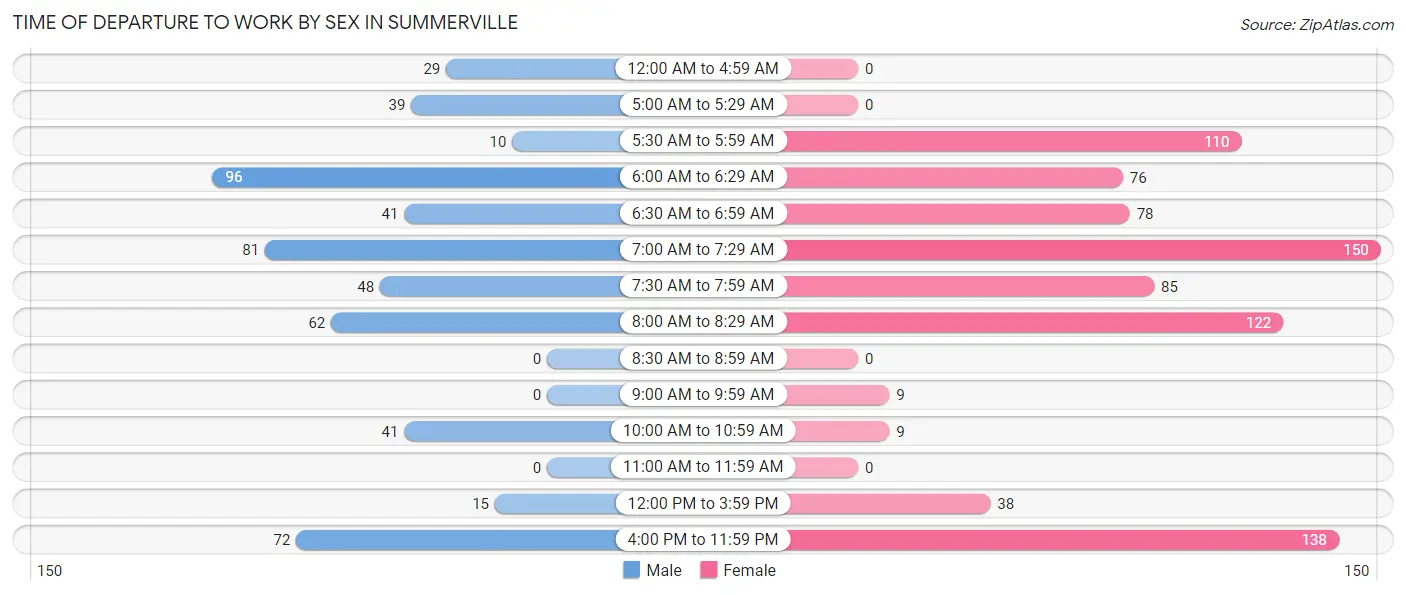
| Time of Departure | Male | Female |
| 12:00 AM to 4:59 AM | 29 (5.4%) | 0 (0.0%) |
| 5:00 AM to 5:29 AM | 39 (7.3%) | 0 (0.0%) |
| 5:30 AM to 5:59 AM | 10 (1.9%) | 110 (13.5%) |
| 6:00 AM to 6:29 AM | 96 (18.0%) | 76 (9.3%) |
| 6:30 AM to 6:59 AM | 41 (7.7%) | 78 (9.6%) |
| 7:00 AM to 7:29 AM | 81 (15.2%) | 150 (18.4%) |
| 7:30 AM to 7:59 AM | 48 (9.0%) | 85 (10.4%) |
| 8:00 AM to 8:29 AM | 62 (11.6%) | 122 (15.0%) |
| 8:30 AM to 8:59 AM | 0 (0.0%) | 0 (0.0%) |
| 9:00 AM to 9:59 AM | 0 (0.0%) | 9 (1.1%) |
| 10:00 AM to 10:59 AM | 41 (7.7%) | 9 (1.1%) |
| 11:00 AM to 11:59 AM | 0 (0.0%) | 0 (0.0%) |
| 12:00 PM to 3:59 PM | 15 (2.8%) | 38 (4.7%) |
| 4:00 PM to 11:59 PM | 72 (13.5%) | 138 (16.9%) |
| Total | 534 (100.0%) | 815 (100.0%) |
Housing Occupancy in Summerville
Occupancy by Ownership in Summerville
Of the total 1,945 dwellings in Summerville, owner-occupied units account for 827 (42.5%), while renter-occupied units make up 1,118 (57.5%).
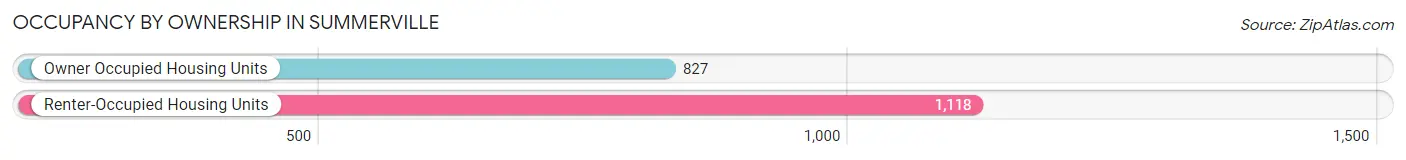
| Occupancy | # Housing Units | % Housing Units |
| Owner Occupied Housing Units | 827 | 42.5% |
| Renter-Occupied Housing Units | 1,118 | 57.5% |
| Total Occupied Housing Units | 1,945 | 100.0% |
Occupancy by Household Size in Summerville
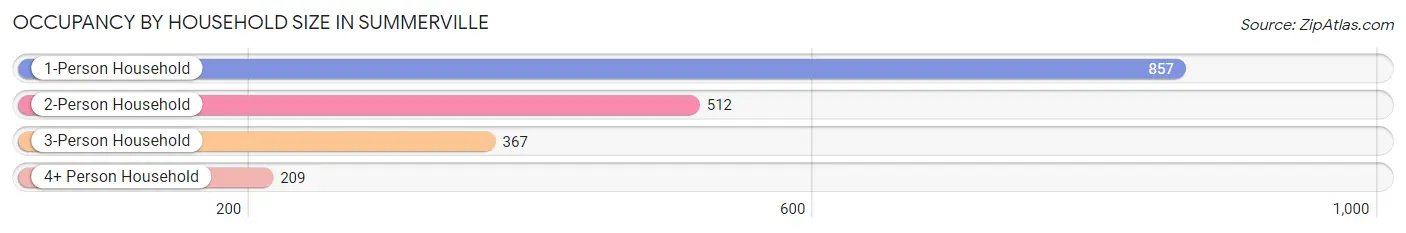
| Household Size | # Housing Units | % Housing Units |
| 1-Person Household | 857 | 44.1% |
| 2-Person Household | 512 | 26.3% |
| 3-Person Household | 367 | 18.9% |
| 4+ Person Household | 209 | 10.7% |
| Total Housing Units | 1,945 | 100.0% |
Occupancy by Ownership by Household Size in Summerville
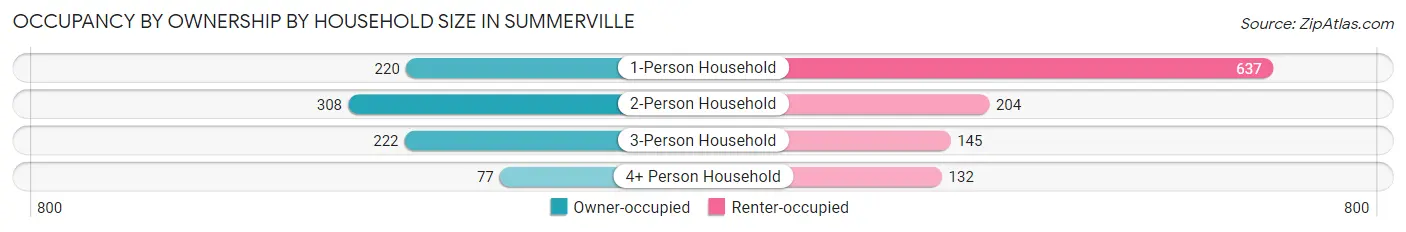
| Household Size | Owner-occupied | Renter-occupied |
| 1-Person Household | 220 (25.7%) | 637 (74.3%) |
| 2-Person Household | 308 (60.2%) | 204 (39.8%) |
| 3-Person Household | 222 (60.5%) | 145 (39.5%) |
| 4+ Person Household | 77 (36.8%) | 132 (63.2%) |
| Total Housing Units | 827 (42.5%) | 1,118 (57.5%) |
Occupancy by Educational Attainment in Summerville
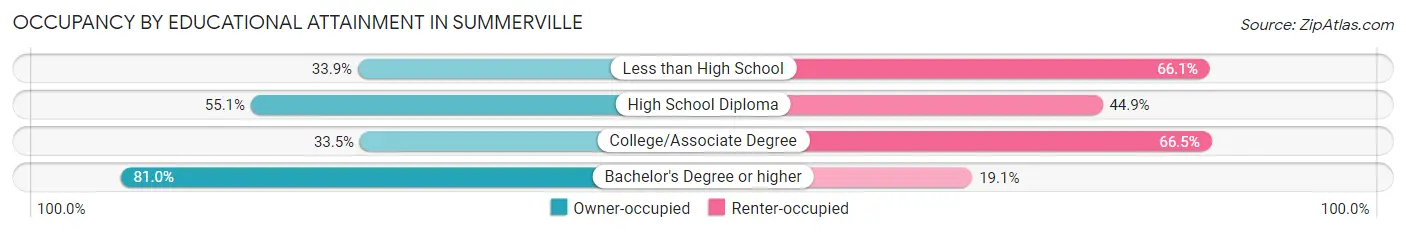
| Household Size | Owner-occupied | Renter-occupied |
| Less than High School | 231 (33.9%) | 450 (66.1%) |
| High School Diploma | 338 (55.1%) | 275 (44.9%) |
| College/Associate Degree | 190 (33.5%) | 377 (66.5%) |
| Bachelor's Degree or higher | 68 (80.9%) | 16 (19.1%) |
Occupancy by Age of Householder in Summerville
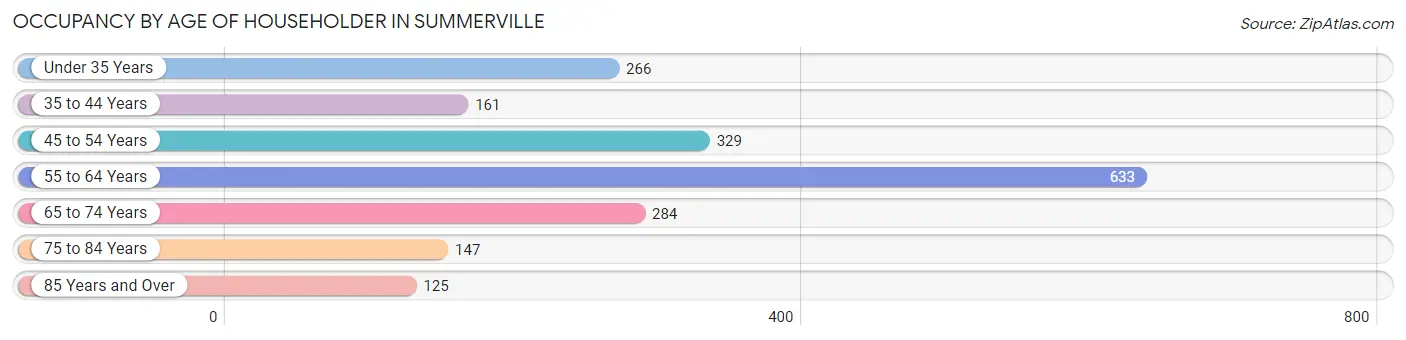
| Age Bracket | # Households | % Households |
| Under 35 Years | 266 | 13.7% |
| 35 to 44 Years | 161 | 8.3% |
| 45 to 54 Years | 329 | 16.9% |
| 55 to 64 Years | 633 | 32.5% |
| 65 to 74 Years | 284 | 14.6% |
| 75 to 84 Years | 147 | 7.6% |
| 85 Years and Over | 125 | 6.4% |
| Total | 1,945 | 100.0% |
Housing Finances in Summerville
Median Income by Occupancy in Summerville
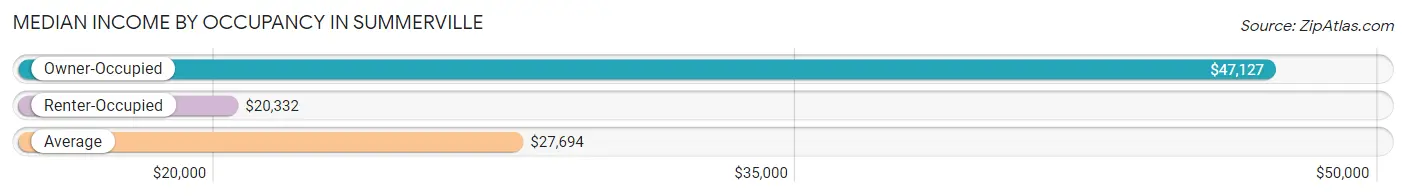
| Occupancy Type | # Households | Median Income |
| Owner-Occupied | 827 (42.5%) | $47,127 |
| Renter-Occupied | 1,118 (57.5%) | $20,332 |
| Average | 1,945 (100.0%) | $27,694 |
Occupancy by Householder Income Bracket in Summerville
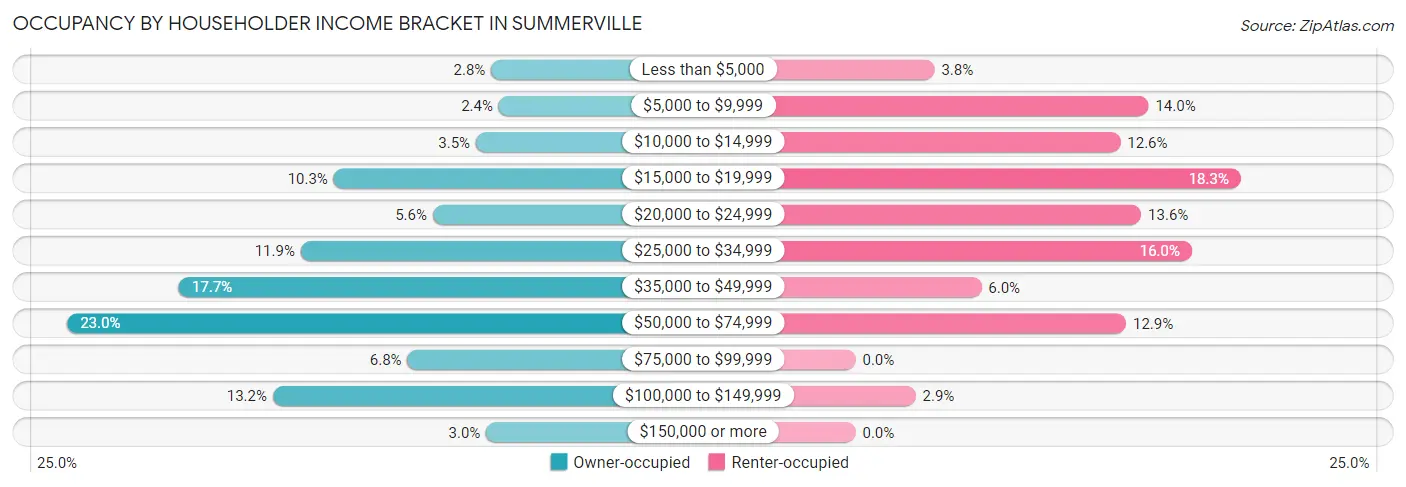
| Income Bracket | Owner-occupied | Renter-occupied |
| Less than $5,000 | 23 (2.8%) | 42 (3.8%) |
| $5,000 to $9,999 | 20 (2.4%) | 156 (14.0%) |
| $10,000 to $14,999 | 29 (3.5%) | 141 (12.6%) |
| $15,000 to $19,999 | 85 (10.3%) | 205 (18.3%) |
| $20,000 to $24,999 | 46 (5.6%) | 152 (13.6%) |
| $25,000 to $34,999 | 98 (11.8%) | 179 (16.0%) |
| $35,000 to $49,999 | 146 (17.6%) | 67 (6.0%) |
| $50,000 to $74,999 | 190 (23.0%) | 144 (12.9%) |
| $75,000 to $99,999 | 56 (6.8%) | 0 (0.0%) |
| $100,000 to $149,999 | 109 (13.2%) | 32 (2.9%) |
| $150,000 or more | 25 (3.0%) | 0 (0.0%) |
| Total | 827 (100.0%) | 1,118 (100.0%) |
Monthly Housing Cost Tiers in Summerville
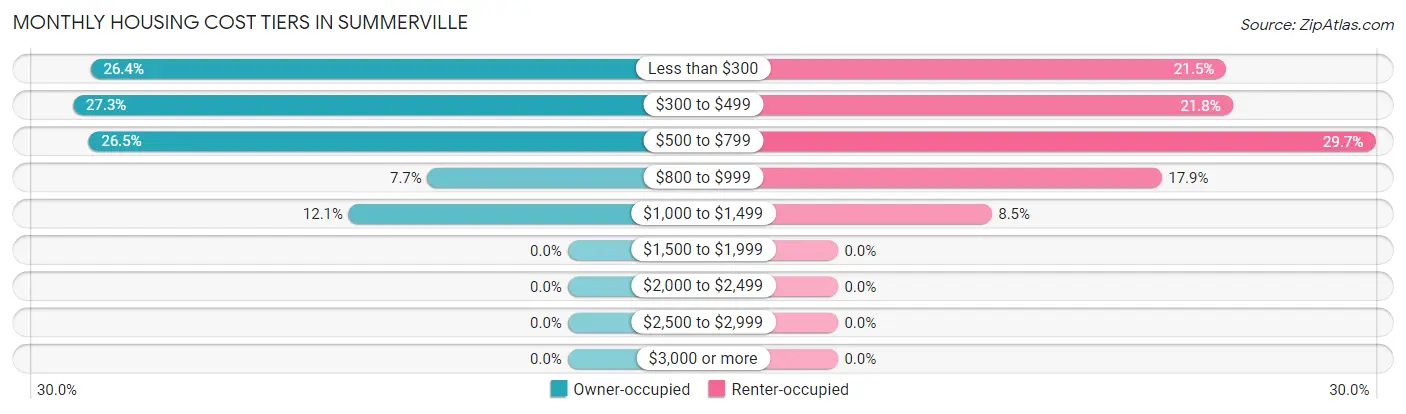
| Monthly Cost | Owner-occupied | Renter-occupied |
| Less than $300 | 218 (26.4%) | 240 (21.5%) |
| $300 to $499 | 226 (27.3%) | 244 (21.8%) |
| $500 to $799 | 219 (26.5%) | 332 (29.7%) |
| $800 to $999 | 64 (7.7%) | 200 (17.9%) |
| $1,000 to $1,499 | 100 (12.1%) | 95 (8.5%) |
| $1,500 to $1,999 | 0 (0.0%) | 0 (0.0%) |
| $2,000 to $2,499 | 0 (0.0%) | 0 (0.0%) |
| $2,500 to $2,999 | 0 (0.0%) | 0 (0.0%) |
| $3,000 or more | 0 (0.0%) | 0 (0.0%) |
| Total | 827 (100.0%) | 1,118 (100.0%) |
Physical Housing Characteristics in Summerville
Housing Structures in Summerville
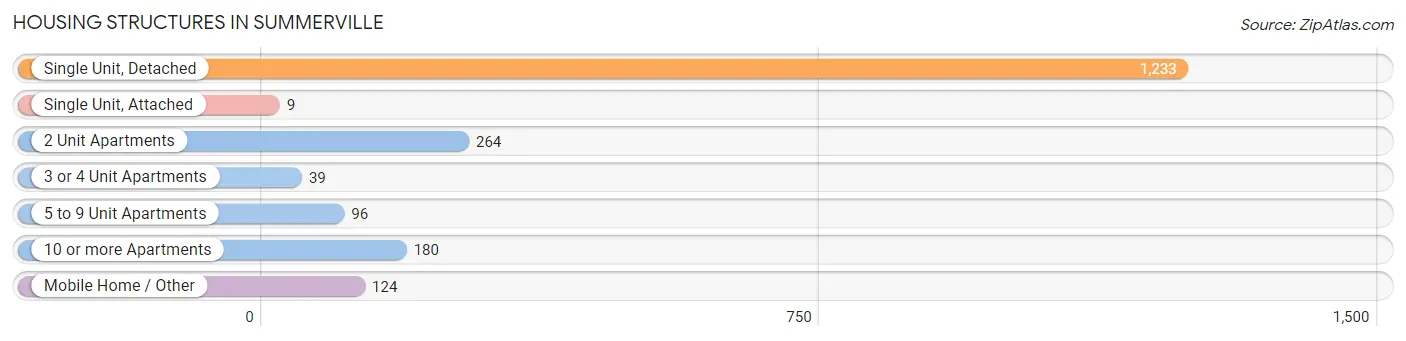
| Structure Type | # Housing Units | % Housing Units |
| Single Unit, Detached | 1,233 | 63.4% |
| Single Unit, Attached | 9 | 0.5% |
| 2 Unit Apartments | 264 | 13.6% |
| 3 or 4 Unit Apartments | 39 | 2.0% |
| 5 to 9 Unit Apartments | 96 | 4.9% |
| 10 or more Apartments | 180 | 9.2% |
| Mobile Home / Other | 124 | 6.4% |
| Total | 1,945 | 100.0% |
Housing Structures by Occupancy in Summerville
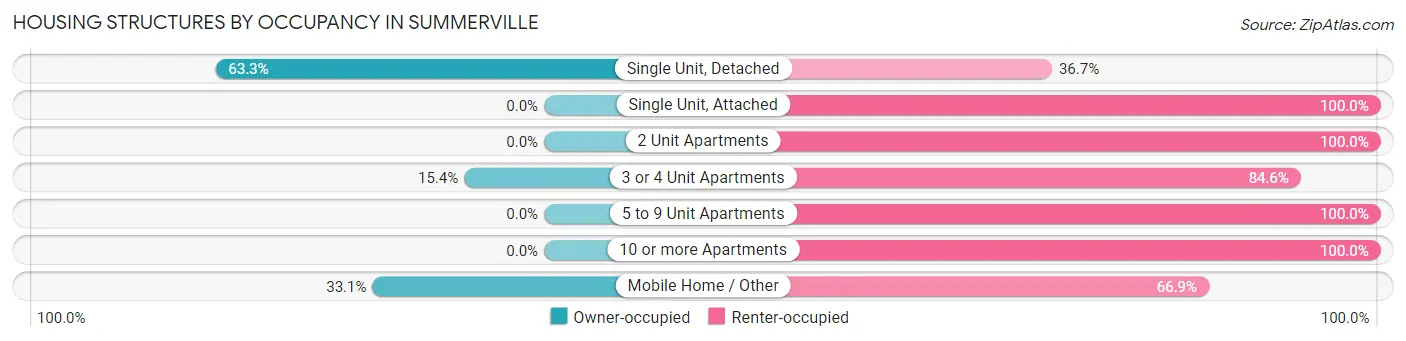
| Structure Type | Owner-occupied | Renter-occupied |
| Single Unit, Detached | 780 (63.3%) | 453 (36.7%) |
| Single Unit, Attached | 0 (0.0%) | 9 (100.0%) |
| 2 Unit Apartments | 0 (0.0%) | 264 (100.0%) |
| 3 or 4 Unit Apartments | 6 (15.4%) | 33 (84.6%) |
| 5 to 9 Unit Apartments | 0 (0.0%) | 96 (100.0%) |
| 10 or more Apartments | 0 (0.0%) | 180 (100.0%) |
| Mobile Home / Other | 41 (33.1%) | 83 (66.9%) |
| Total | 827 (42.5%) | 1,118 (57.5%) |
Housing Structures by Number of Rooms in Summerville
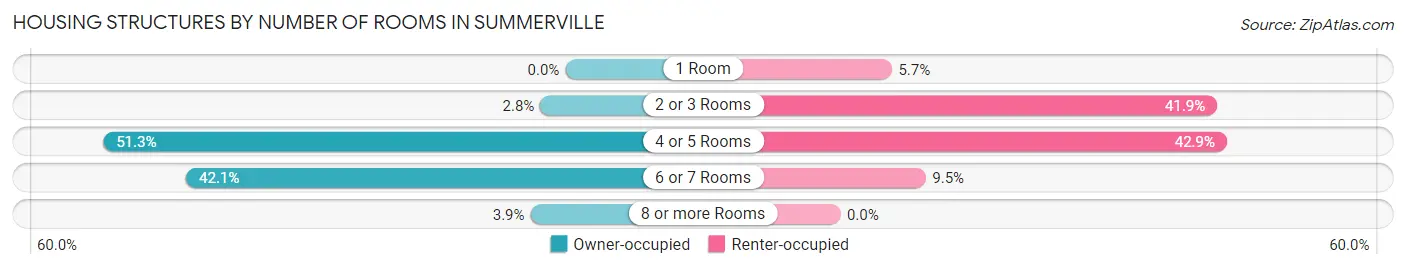
| Number of Rooms | Owner-occupied | Renter-occupied |
| 1 Room | 0 (0.0%) | 64 (5.7%) |
| 2 or 3 Rooms | 23 (2.8%) | 468 (41.9%) |
| 4 or 5 Rooms | 424 (51.3%) | 480 (42.9%) |
| 6 or 7 Rooms | 348 (42.1%) | 106 (9.5%) |
| 8 or more Rooms | 32 (3.9%) | 0 (0.0%) |
| Total | 827 (100.0%) | 1,118 (100.0%) |
Housing Structure by Heating Type in Summerville
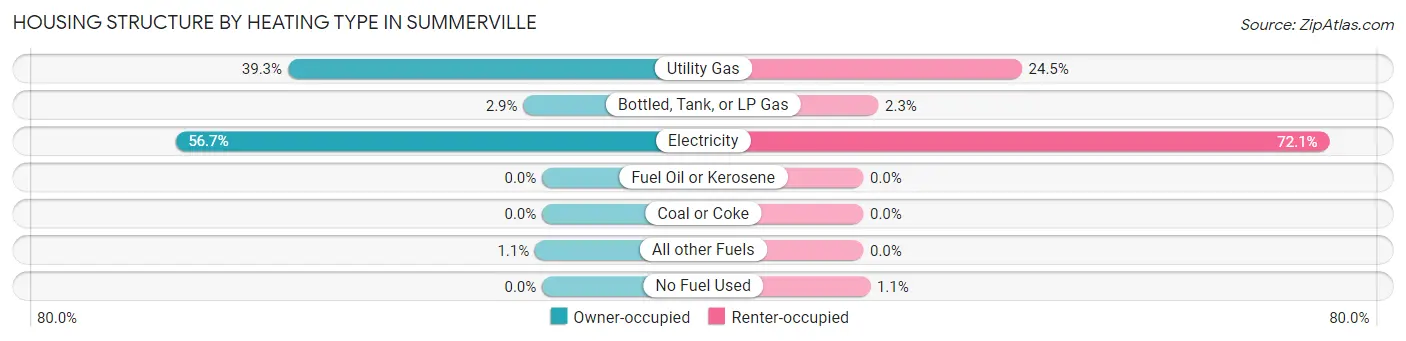
| Heating Type | Owner-occupied | Renter-occupied |
| Utility Gas | 325 (39.3%) | 274 (24.5%) |
| Bottled, Tank, or LP Gas | 24 (2.9%) | 26 (2.3%) |
| Electricity | 469 (56.7%) | 806 (72.1%) |
| Fuel Oil or Kerosene | 0 (0.0%) | 0 (0.0%) |
| Coal or Coke | 0 (0.0%) | 0 (0.0%) |
| All other Fuels | 9 (1.1%) | 0 (0.0%) |
| No Fuel Used | 0 (0.0%) | 12 (1.1%) |
| Total | 827 (100.0%) | 1,118 (100.0%) |
Household Vehicle Usage in Summerville
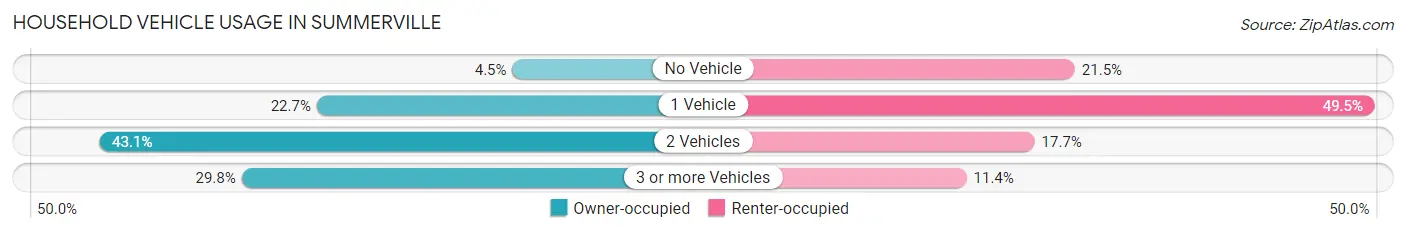
| Vehicles per Household | Owner-occupied | Renter-occupied |
| No Vehicle | 37 (4.5%) | 240 (21.5%) |
| 1 Vehicle | 188 (22.7%) | 553 (49.5%) |
| 2 Vehicles | 356 (43.0%) | 198 (17.7%) |
| 3 or more Vehicles | 246 (29.7%) | 127 (11.4%) |
| Total | 827 (100.0%) | 1,118 (100.0%) |
Real Estate & Mortgages in Summerville
Real Estate and Mortgage Overview in Summerville
| Characteristic | Without Mortgage | With Mortgage |
| Housing Units | 577 | 250 |
| Median Property Value | $69,100 | $65,500 |
| Median Household Income | $45,380 | $8 |
| Monthly Housing Costs | $341 | $0 |
| Real Estate Taxes | $579 | $0 |
Property Value by Mortgage Status in Summerville
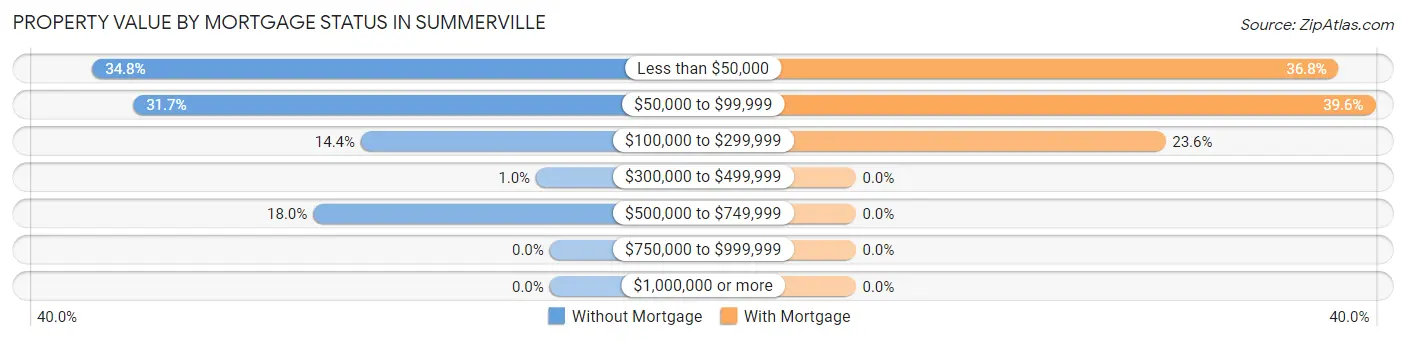
| Property Value | Without Mortgage | With Mortgage |
| Less than $50,000 | 201 (34.8%) | 92 (36.8%) |
| $50,000 to $99,999 | 183 (31.7%) | 99 (39.6%) |
| $100,000 to $299,999 | 83 (14.4%) | 59 (23.6%) |
| $300,000 to $499,999 | 6 (1.0%) | 0 (0.0%) |
| $500,000 to $749,999 | 104 (18.0%) | 0 (0.0%) |
| $750,000 to $999,999 | 0 (0.0%) | 0 (0.0%) |
| $1,000,000 or more | 0 (0.0%) | 0 (0.0%) |
| Total | 577 (100.0%) | 250 (100.0%) |
Household Income by Mortgage Status in Summerville
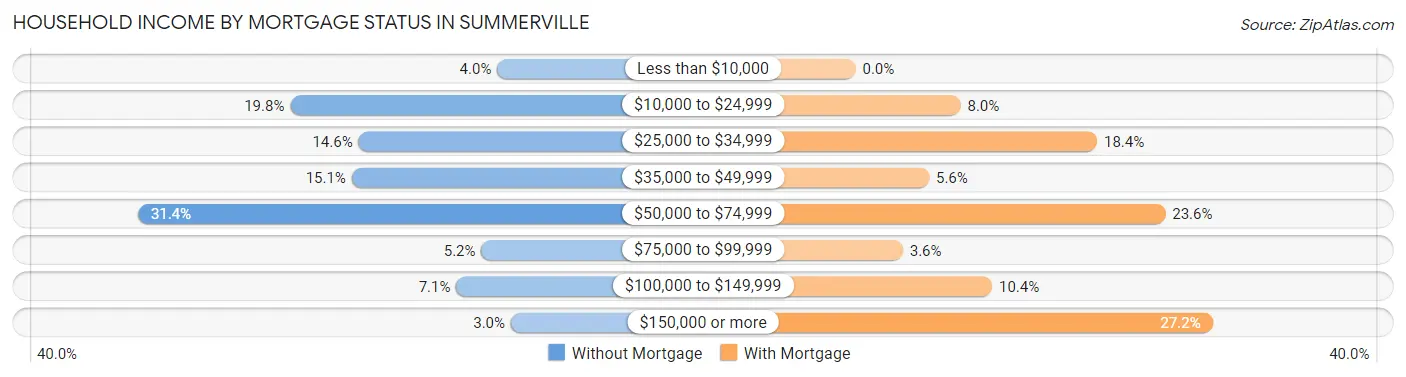
| Household Income | Without Mortgage | With Mortgage |
| Less than $10,000 | 23 (4.0%) | 0 (0.0%) |
| $10,000 to $24,999 | 114 (19.8%) | 20 (8.0%) |
| $25,000 to $34,999 | 84 (14.6%) | 46 (18.4%) |
| $35,000 to $49,999 | 87 (15.1%) | 14 (5.6%) |
| $50,000 to $74,999 | 181 (31.4%) | 59 (23.6%) |
| $75,000 to $99,999 | 30 (5.2%) | 9 (3.6%) |
| $100,000 to $149,999 | 41 (7.1%) | 26 (10.4%) |
| $150,000 or more | 17 (2.9%) | 68 (27.2%) |
| Total | 577 (100.0%) | 250 (100.0%) |
Property Value to Household Income Ratio in Summerville
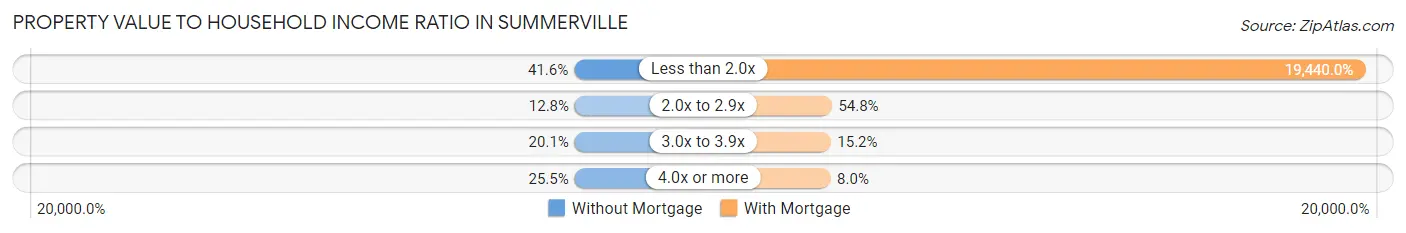
| Value-to-Income Ratio | Without Mortgage | With Mortgage |
| Less than 2.0x | 240 (41.6%) | 48,600 (19,440.0%) |
| 2.0x to 2.9x | 74 (12.8%) | 137 (54.8%) |
| 3.0x to 3.9x | 116 (20.1%) | 38 (15.2%) |
| 4.0x or more | 147 (25.5%) | 20 (8.0%) |
| Total | 577 (100.0%) | 250 (100.0%) |
Real Estate Taxes by Mortgage Status in Summerville
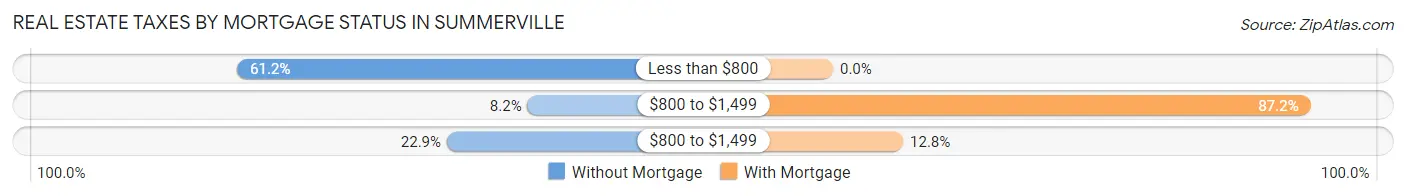
| Property Taxes | Without Mortgage | With Mortgage |
| Less than $800 | 353 (61.2%) | 0 (0.0%) |
| $800 to $1,499 | 47 (8.2%) | 218 (87.2%) |
| $800 to $1,499 | 132 (22.9%) | 32 (12.8%) |
| Total | 577 (100.0%) | 250 (100.0%) |
Health & Disability in Summerville
Health Insurance Coverage by Age in Summerville
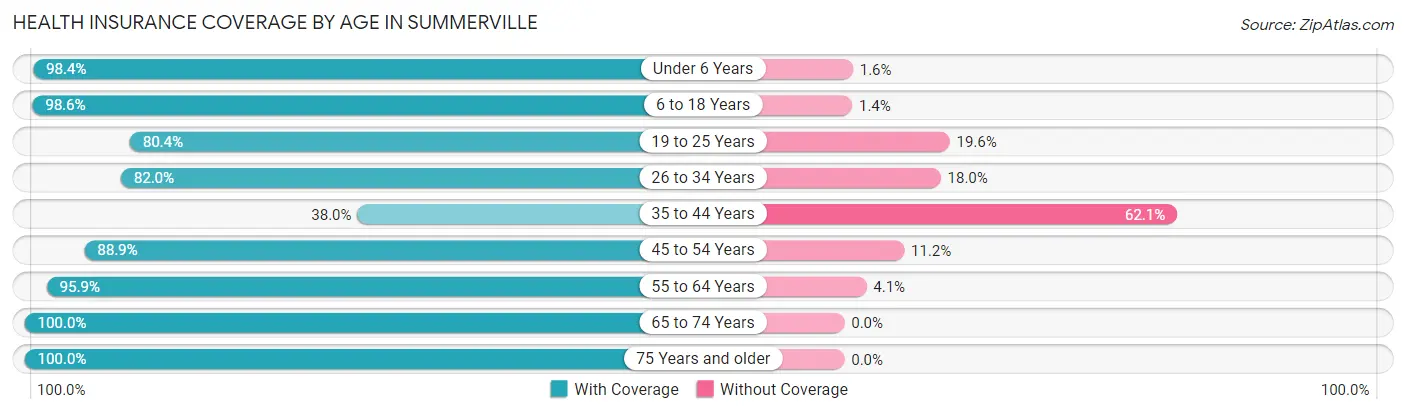
| Age Bracket | With Coverage | Without Coverage |
| Under 6 Years | 436 (98.4%) | 7 (1.6%) |
| 6 to 18 Years | 617 (98.6%) | 9 (1.4%) |
| 19 to 25 Years | 217 (80.4%) | 53 (19.6%) |
| 26 to 34 Years | 274 (82.0%) | 60 (18.0%) |
| 35 to 44 Years | 159 (38.0%) | 260 (62.1%) |
| 45 to 54 Years | 470 (88.8%) | 59 (11.2%) |
| 55 to 64 Years | 769 (95.9%) | 33 (4.1%) |
| 65 to 74 Years | 383 (100.0%) | 0 (0.0%) |
| 75 Years and older | 355 (100.0%) | 0 (0.0%) |
| Total | 3,680 (88.4%) | 481 (11.6%) |
Health Insurance Coverage by Citizenship Status in Summerville
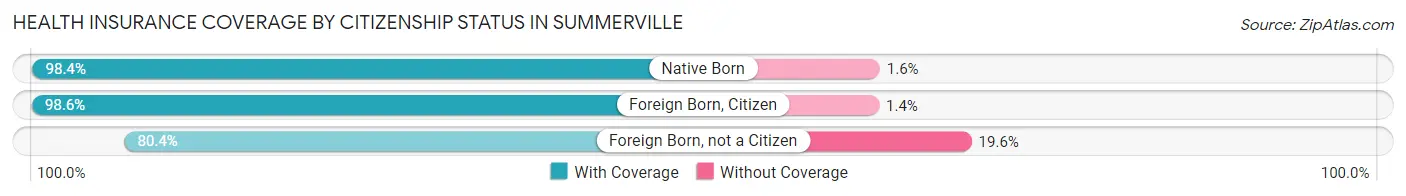
| Citizenship Status | With Coverage | Without Coverage |
| Native Born | 436 (98.4%) | 7 (1.6%) |
| Foreign Born, Citizen | 617 (98.6%) | 9 (1.4%) |
| Foreign Born, not a Citizen | 217 (80.4%) | 53 (19.6%) |
Health Insurance Coverage by Household Income in Summerville
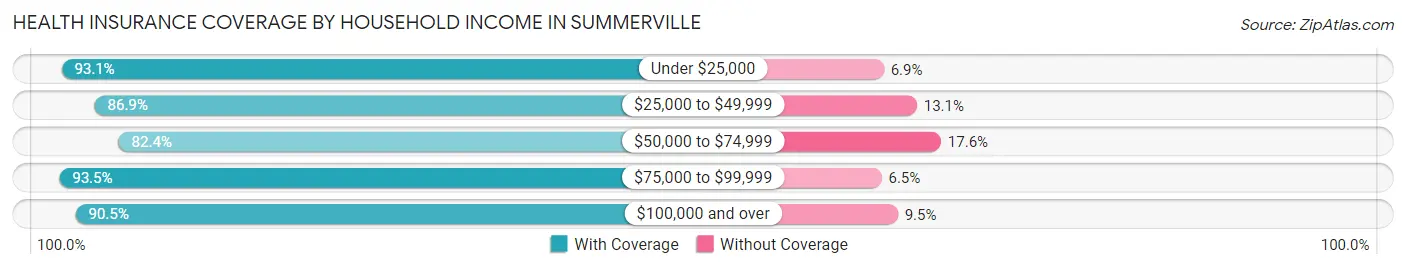
| Household Income | With Coverage | Without Coverage |
| Under $25,000 | 1,239 (93.1%) | 92 (6.9%) |
| $25,000 to $49,999 | 841 (86.9%) | 127 (13.1%) |
| $50,000 to $74,999 | 911 (82.4%) | 195 (17.6%) |
| $75,000 to $99,999 | 158 (93.5%) | 11 (6.5%) |
| $100,000 and over | 531 (90.5%) | 56 (9.5%) |
Public vs Private Health Insurance Coverage by Age in Summerville
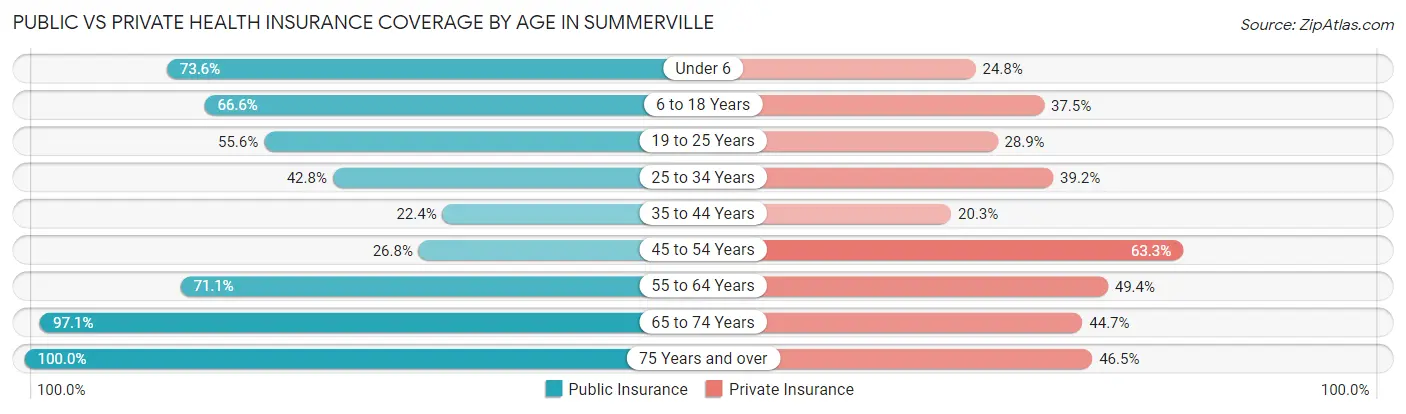
| Age Bracket | Public Insurance | Private Insurance |
| Under 6 | 326 (73.6%) | 110 (24.8%) |
| 6 to 18 Years | 417 (66.6%) | 235 (37.5%) |
| 19 to 25 Years | 150 (55.6%) | 78 (28.9%) |
| 25 to 34 Years | 143 (42.8%) | 131 (39.2%) |
| 35 to 44 Years | 94 (22.4%) | 85 (20.3%) |
| 45 to 54 Years | 142 (26.8%) | 335 (63.3%) |
| 55 to 64 Years | 570 (71.1%) | 396 (49.4%) |
| 65 to 74 Years | 372 (97.1%) | 171 (44.7%) |
| 75 Years and over | 355 (100.0%) | 165 (46.5%) |
| Total | 2,569 (61.7%) | 1,706 (41.0%) |
Disability Status by Sex by Age in Summerville
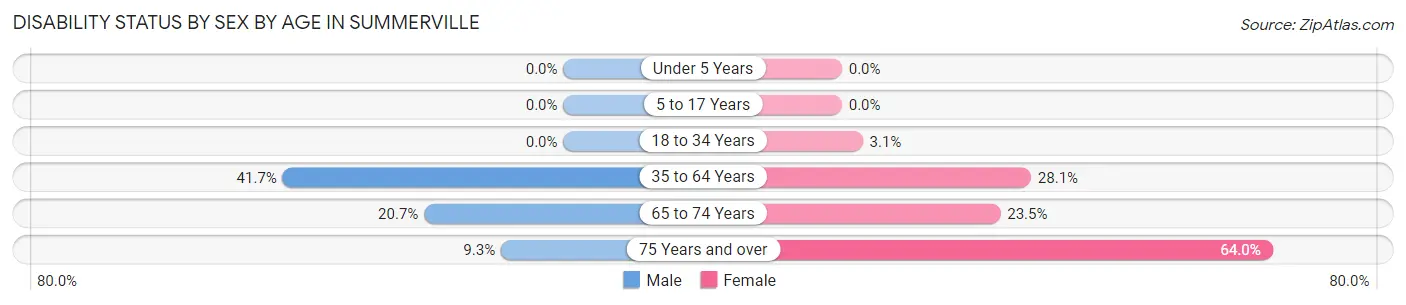
| Age Bracket | Male | Female |
| Under 5 Years | 0 (0.0%) | 0 (0.0%) |
| 5 to 17 Years | 0 (0.0%) | 0 (0.0%) |
| 18 to 34 Years | 0 (0.0%) | 11 (3.1%) |
| 35 to 64 Years | 293 (41.7%) | 294 (28.1%) |
| 65 to 74 Years | 37 (20.7%) | 48 (23.5%) |
| 75 Years and over | 10 (9.3%) | 158 (64.0%) |
Disability Class by Sex by Age in Summerville
Disability Class: Hearing Difficulty
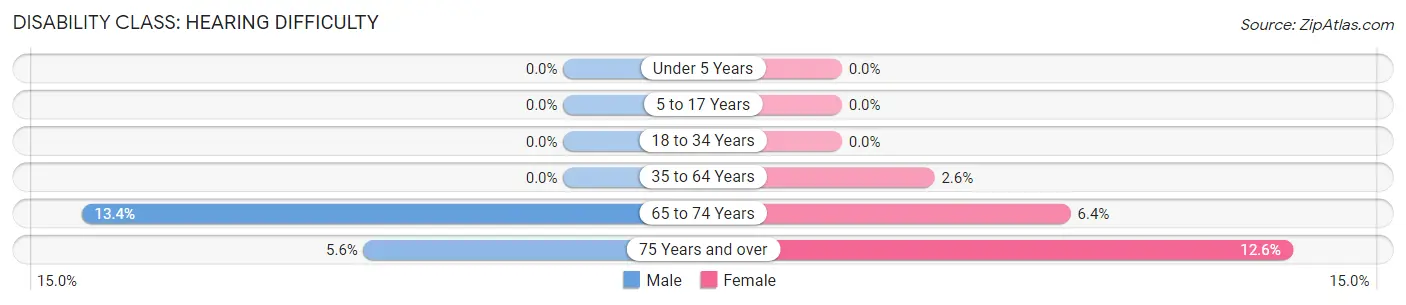
| Age Bracket | Male | Female |
| Under 5 Years | 0 (0.0%) | 0 (0.0%) |
| 5 to 17 Years | 0 (0.0%) | 0 (0.0%) |
| 18 to 34 Years | 0 (0.0%) | 0 (0.0%) |
| 35 to 64 Years | 0 (0.0%) | 27 (2.6%) |
| 65 to 74 Years | 24 (13.4%) | 13 (6.4%) |
| 75 Years and over | 6 (5.6%) | 31 (12.6%) |
Disability Class: Vision Difficulty
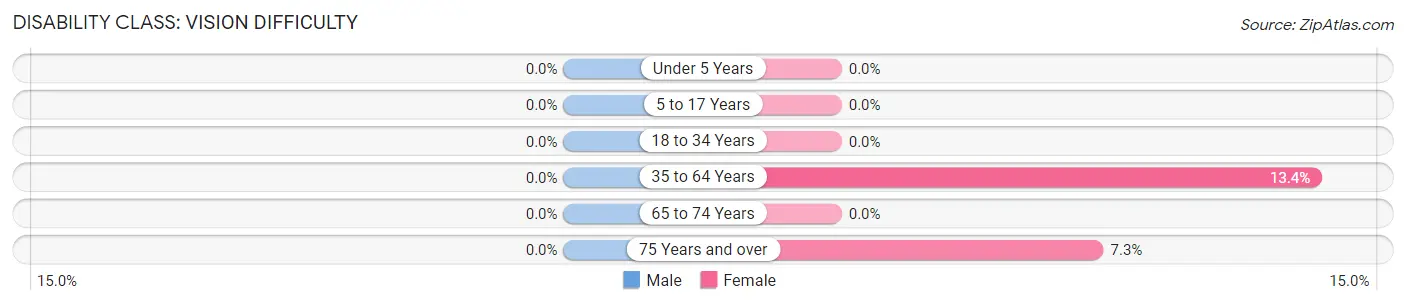
| Age Bracket | Male | Female |
| Under 5 Years | 0 (0.0%) | 0 (0.0%) |
| 5 to 17 Years | 0 (0.0%) | 0 (0.0%) |
| 18 to 34 Years | 0 (0.0%) | 0 (0.0%) |
| 35 to 64 Years | 0 (0.0%) | 140 (13.4%) |
| 65 to 74 Years | 0 (0.0%) | 0 (0.0%) |
| 75 Years and over | 0 (0.0%) | 18 (7.3%) |
Disability Class: Cognitive Difficulty
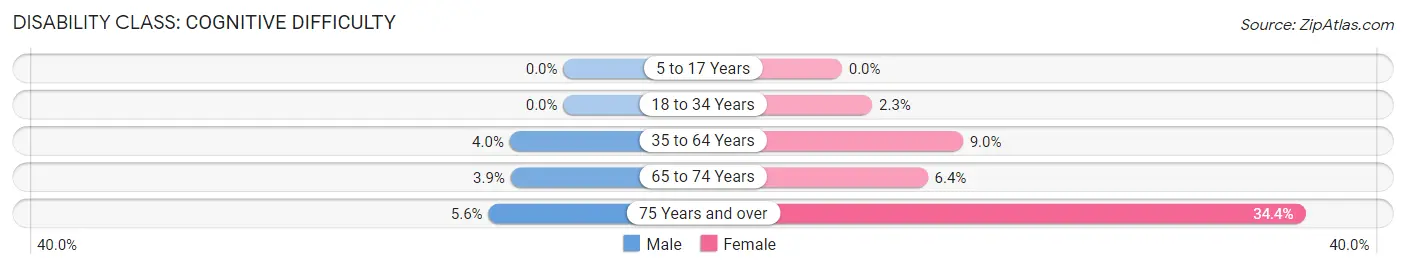
| Age Bracket | Male | Female |
| 5 to 17 Years | 0 (0.0%) | 0 (0.0%) |
| 18 to 34 Years | 0 (0.0%) | 8 (2.2%) |
| 35 to 64 Years | 28 (4.0%) | 94 (9.0%) |
| 65 to 74 Years | 7 (3.9%) | 13 (6.4%) |
| 75 Years and over | 6 (5.6%) | 85 (34.4%) |
Disability Class: Ambulatory Difficulty
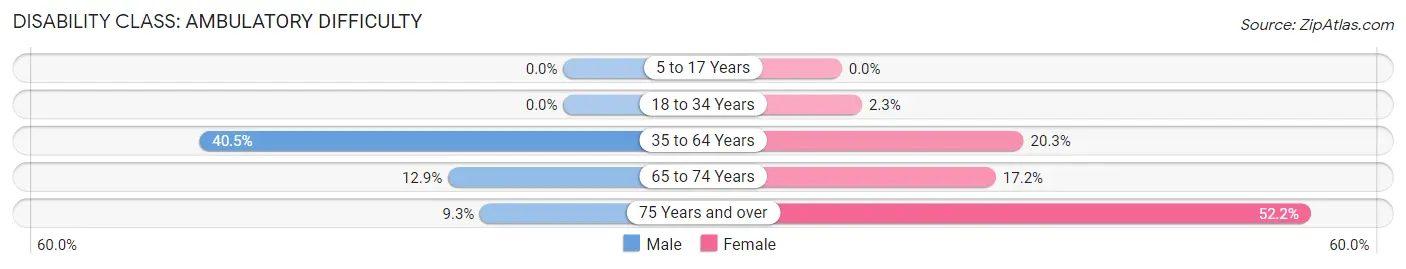
| Age Bracket | Male | Female |
| 5 to 17 Years | 0 (0.0%) | 0 (0.0%) |
| 18 to 34 Years | 0 (0.0%) | 8 (2.2%) |
| 35 to 64 Years | 285 (40.5%) | 212 (20.3%) |
| 65 to 74 Years | 23 (12.9%) | 35 (17.2%) |
| 75 Years and over | 10 (9.3%) | 129 (52.2%) |
Disability Class: Self-Care Difficulty
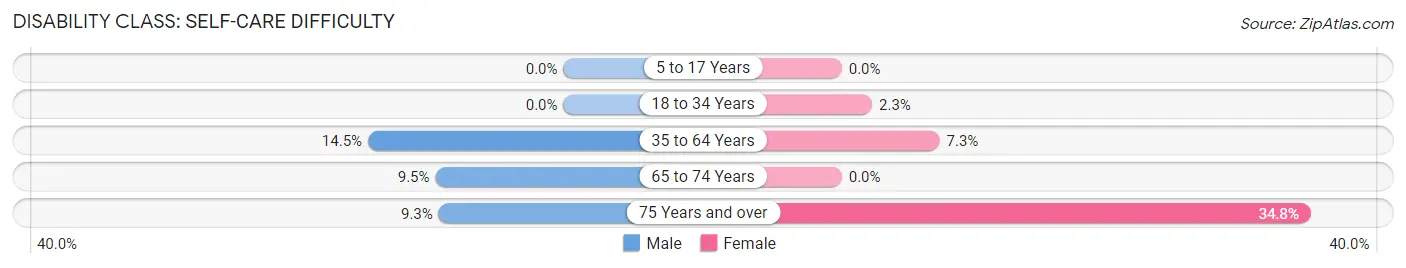
| Age Bracket | Male | Female |
| 5 to 17 Years | 0 (0.0%) | 0 (0.0%) |
| 18 to 34 Years | 0 (0.0%) | 8 (2.2%) |
| 35 to 64 Years | 102 (14.5%) | 76 (7.3%) |
| 65 to 74 Years | 17 (9.5%) | 0 (0.0%) |
| 75 Years and over | 10 (9.3%) | 86 (34.8%) |
Technology Access in Summerville
Computing Device Access in Summerville
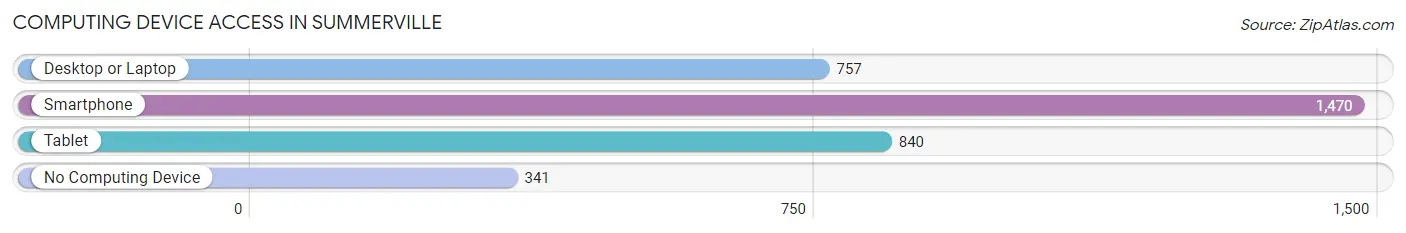
| Device Type | # Households | % Households |
| Desktop or Laptop | 757 | 38.9% |
| Smartphone | 1,470 | 75.6% |
| Tablet | 840 | 43.2% |
| No Computing Device | 341 | 17.5% |
| Total | 1,945 | 100.0% |
Internet Access in Summerville
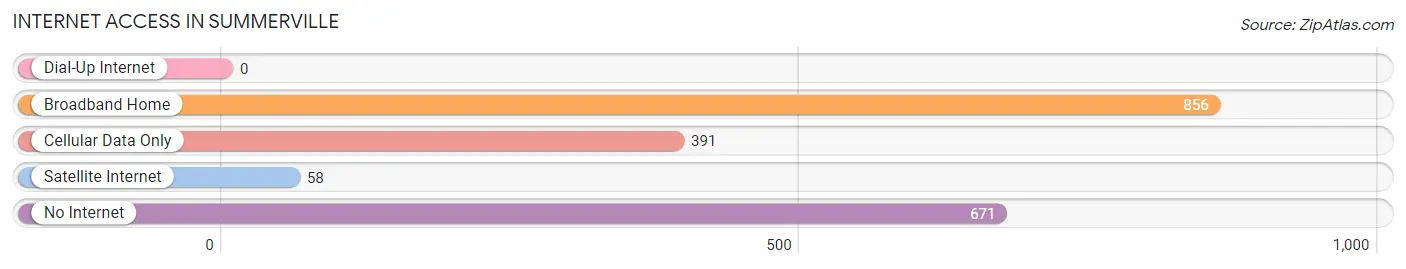
| Internet Type | # Households | % Households |
| Dial-Up Internet | 0 | 0.0% |
| Broadband Home | 856 | 44.0% |
| Cellular Data Only | 391 | 20.1% |
| Satellite Internet | 58 | 3.0% |
| No Internet | 671 | 34.5% |
| Total | 1,945 | 100.0% |
Summerville Summary
History
The town of Summerville, Georgia is located in the northwest corner of the state, in the foothills of the Appalachian Mountains. It is the county seat of Chattooga County, and was founded in 1838. The town was named after the nearby Summerville Creek, which was named for the abundance of wildflowers that bloomed in the area during the summer months.
The town was originally settled by Cherokee Indians, who had been forced to relocate from their ancestral lands in the southeastern United States. The Cherokee were joined by settlers from the Carolinas, Virginia, and other parts of Georgia. The town quickly grew, and by the time of the Civil War, it was a thriving community.
During the Civil War, Summerville was the site of several battles, including the Battle of Summerville in 1864. The town was occupied by Union forces, and many of the buildings were destroyed. After the war, the town was rebuilt and continued to grow.
In the late 19th century, Summerville became a popular tourist destination, due to its proximity to the nearby Lookout Mountain. The town was also home to several resorts, including the Summerville Hotel, which was built in 1887.
In the early 20th century, Summerville was a center of industry, with several factories and mills located in the area. The town was also home to several educational institutions, including the Summerville Academy, which was founded in 1891.
Geography
Summerville is located in the northwest corner of Georgia, in the foothills of the Appalachian Mountains. The town is situated on the banks of the Chattooga River, and is surrounded by the Chattahoochee National Forest. The town is located about 30 miles from Chattanooga, Tennessee, and about 90 miles from Atlanta, Georgia.
The town has a total area of 4.2 square miles, all of which is land. The town is located at an elevation of 1,068 feet above sea level. The climate in Summerville is mild, with temperatures ranging from the mid-50s in the winter to the mid-80s in the summer.
Economy
The economy of Summerville is largely based on tourism and manufacturing. The town is home to several resorts and hotels, as well as several restaurants and shops. The town is also home to several factories and mills, which produce a variety of products, including textiles, furniture, and paper products.
The town is also home to several educational institutions, including the Summerville Academy, which was founded in 1891. The town is also home to several churches, including the Summerville Presbyterian Church, which was founded in 1845.
Demographics
As of the 2010 census, the population of Summerville was 2,845. The racial makeup of the town was 87.3% White, 9.2% African American, 0.7% Native American, 0.3% Asian, 0.1% Pacific Islander, 0.7% from other races, and 1.9% from two or more races. Hispanic or Latino of any race were 2.2% of the population.
The median income for a household in Summerville was $30,938, and the median income for a family was $37,813. The per capita income for the town was $17,845. About 17.2% of families and 20.2% of the population were below the poverty line, including 28.3% of those under age 18 and 11.2% of those age 65 or over.
Common Questions
What is Per Capita Income in Summerville?
Per Capita income in Summerville is $18,095.
What is the Median Family Income in Summerville?
Median Family Income in Summerville is $48,246.
What is the Median Household income in Summerville?
Median Household Income in Summerville is $27,694.
What is Income or Wage Gap in Summerville?
Income or Wage Gap in Summerville is 20.1%.
Women in Summerville earn 79.9 cents for every dollar earned by a man.
What is Inequality or Gini Index in Summerville?
Inequality or Gini Index in Summerville is 0.44.
What is the Total Population of Summerville?
Total Population of Summerville is 4,381.
What is the Total Male Population of Summerville?
Total Male Population of Summerville is 1,971.
What is the Total Female Population of Summerville?
Total Female Population of Summerville is 2,410.
What is the Ratio of Males per 100 Females in Summerville?
There are 81.78 Males per 100 Females in Summerville.
What is the Ratio of Females per 100 Males in Summerville?
There are 122.27 Females per 100 Males in Summerville.
What is the Median Population Age in Summerville?
Median Population Age in Summerville is 45.6 Years.
What is the Average Family Size in Summerville
Average Family Size in Summerville is 2.7 People.
What is the Average Household Size in Summerville
Average Household Size in Summerville is 2.1 People.
How Large is the Labor Force in Summerville?
There are 1,432 People in the Labor Forcein in Summerville.
What is the Percentage of People in the Labor Force in Summerville?
42.5% of People are in the Labor Force in Summerville.
What is the Unemployment Rate in Summerville?
Unemployment Rate in Summerville is 4.7%.