Zip Codes with the Highest Percentage of Families with Income Below $10,000 in Delaware

RELATED REPORTS & OPTIONS

Family Income | $0-10k
Population
Families and Households
Female Fertility
Female Fertility (Unmarried)
Race (Community Size)
Race (Percentage)
Ancestry (Community Size)
AfghanAfricanAlaska NativeAlaskan AthabascanAlbanianAleutAlsatianAmericanApacheArabArapahoArgentineanArmenianAssyrian / Chaldean / SyriacAustralianAustrianBahamianBangladeshiBarbadianBasqueBelgianBelizeanBermudanBhutaneseBlackfeetBolivianBrazilianBritishBritish West IndianBulgarianBurmeseCajunCambodianCanadianCape VerdeanCarpatho RusynCelticCentral AmericanCentral American IndianCherokeeCheyenneChickasawChileanChineseChippewaChoctawColombianColvilleComancheCosta RicanCreeCreekCroatianCrowCubanCypriotCzechCzechoslovakianDanishDelawareDominicanDutchDutch West IndianEastern EuropeanEcuadorianEgyptianEnglishEstonianEthiopianEuropeanFijianFilipinoFinnishFrenchFrench American IndianFrench CanadianGermanGerman RussianGhanaianGreekGuamanian / ChamorroGuatemalanGuyaneseHaitianHmongHonduranHopiHoumaHungarianIcelanderIndian (Asian)IndonesianInupiatIranianIraqiIrishIroquoisIsraeliItalianJamaicanJapaneseJordanianKenyanKiowaKoreanLaotianLatvianLebaneseLiberianLithuanianLumbeeLuxembourgerMacedonianMalaysianMalteseMarshalleseMenomineeMexicanMexican American IndianMongolianMoroccanNative HawaiianNavajoNepaleseNew ZealanderNicaraguanNigerianNorthern EuropeanNorwegianOkinawanOsageOttawaPaiutePakistaniPalestinianPanamanianParaguayanPennsylvania GermanPeruvianPimaPolishPortuguesePotawatomiPuebloPuerto RicanPuget Sound SalishRomanianRussianSalvadoranSamoanScandinavianScotch-IrishScottishSeminoleSenegaleseSerbianShoshoneSierra LeoneanSiouxSlavicSlovakSloveneSomaliSouth AfricanSouth AmericanSouth American IndianSoviet UnionSpaniardSpanishSpanish AmericanSpanish American IndianSri LankanSubsaharan AfricanSudaneseSwedishSwissSyrianTaiwaneseThaiTlingit-HaidaTohono O'OdhamTonganTrinidadian and TobagonianTsimshianTurkishU.S. Virgin IslanderUgandanUkrainianUruguayanUteVenezuelanVietnameseWelshWest IndianYakamaYaquiYugoslavianYumanYup'ikZimbabwean
Ancestry (Percentage)
AfghanAfricanAlaska NativeAlaskan AthabascanAlbanianAleutAlsatianAmericanApacheArabArapahoArgentineanArmenianAssyrian / Chaldean / SyriacAustralianAustrianBahamianBangladeshiBarbadianBasqueBelgianBelizeanBermudanBhutaneseBlackfeetBolivianBrazilianBritishBritish West IndianBulgarianBurmeseCajunCambodianCanadianCape VerdeanCarpatho RusynCelticCentral AmericanCentral American IndianCherokeeCheyenneChickasawChileanChineseChippewaChoctawColombianColvilleComancheCosta RicanCreeCreekCroatianCrowCubanCypriotCzechCzechoslovakianDanishDelawareDominicanDutchDutch West IndianEastern EuropeanEcuadorianEgyptianEnglishEstonianEthiopianEuropeanFijianFilipinoFinnishFrenchFrench American IndianFrench CanadianGermanGerman RussianGhanaianGreekGuamanian / ChamorroGuatemalanGuyaneseHaitianHmongHonduranHopiHoumaHungarianIcelanderIndian (Asian)IndonesianInupiatIranianIraqiIrishIroquoisIsraeliItalianJamaicanJapaneseJordanianKenyanKiowaKoreanLaotianLatvianLebaneseLiberianLithuanianLumbeeLuxembourgerMacedonianMalaysianMalteseMarshalleseMenomineeMexicanMexican American IndianMongolianMoroccanNative HawaiianNavajoNepaleseNew ZealanderNicaraguanNigerianNorthern EuropeanNorwegianOkinawanOsageOttawaPaiutePakistaniPalestinianPanamanianParaguayanPennsylvania GermanPeruvianPimaPolishPortuguesePotawatomiPuebloPuerto RicanPuget Sound SalishRomanianRussianSalvadoranSamoanScandinavianScotch-IrishScottishSeminoleSenegaleseSerbianShoshoneSierra LeoneanSiouxSlavicSlovakSloveneSomaliSouth AfricanSouth AmericanSouth American IndianSoviet UnionSpaniardSpanishSpanish AmericanSpanish American IndianSri LankanSubsaharan AfricanSudaneseSwedishSwissSyrianTaiwaneseThaiTlingit-HaidaTohono O'OdhamTonganTrinidadian and TobagonianTsimshianTurkishU.S. Virgin IslanderUgandanUkrainianUruguayanUteVenezuelanVietnameseWelshWest IndianYakamaYaquiYugoslavianYumanYup'ikZimbabwean
Immigrant Origin (Total)
AfghanistanAfricaAlbaniaArgentinaArmeniaAsiaAustraliaAustriaAzoresBahamasBangladeshBarbadosBelarusBelgiumBelizeBoliviaBosnia and HerzegovinaBrazilBulgariaBurma / MyanmarCabo VerdeCambodiaCameroonCanadaCaribbeanCentral AmericaChileChinaColombiaCongoCosta RicaCroatiaCubaCzechoslovakiaDenmarkDominicaDominican RepublicEastern AfricaEastern AsiaEastern EuropeEcuadorEgyptEl SalvadorEnglandEritreaEthiopiaEuropeFijiFranceGermanyGhanaGreeceGrenadaGuatemalaGuyanaHaitiHondurasHong KongHungaryIndiaIndonesiaIranIraqIrelandIsraelItalyJamaicaJapanJordanKazakhstanKenyaKoreaKuwaitLaosLatin AmericaLatviaLebanonLiberiaLithuaniaMalaysiaMexicoMicronesiaMiddle AfricaMoldovaMoroccoNepalNetherlandsNicaraguaNigeriaNorth MacedoniaNorthern AfricaNorthern EuropeNorwayOceaniaPakistanPanamaPeruPhilippinesPolandPortugalRomaniaRussiaSaudi ArabiaScotlandSenegalSerbiaSierra LeoneSingaporeSomaliaSouth AfricaSouth AmericaSouth Central AsiaSouth Eastern AsiaSouthern EuropeSpainSri LankaSt. Vincent and the GrenadinesSudanSwedenSwitzerlandSyriaTaiwanThailandTrinidad and TobagoTurkeyUgandaUkraineUruguayUzbekistanVenezuelaVietnamWest IndiesWestern AfricaWestern AsiaWestern EuropeYemenZaireZimbabwe
Immigrant Origin (Percentage)
AfghanistanAfricaAlbaniaArgentinaArmeniaAsiaAustraliaAustriaAzoresBahamasBangladeshBarbadosBelarusBelgiumBelizeBoliviaBosnia and HerzegovinaBrazilBulgariaBurma / MyanmarCabo VerdeCambodiaCameroonCanadaCaribbeanCentral AmericaChileChinaColombiaCongoCosta RicaCroatiaCubaCzechoslovakiaDenmarkDominicaDominican RepublicEastern AfricaEastern AsiaEastern EuropeEcuadorEgyptEl SalvadorEnglandEritreaEthiopiaEuropeFijiFranceGermanyGhanaGreeceGrenadaGuatemalaGuyanaHaitiHondurasHong KongHungaryIndiaIndonesiaIranIraqIrelandIsraelItalyJamaicaJapanJordanKazakhstanKenyaKoreaKuwaitLaosLatin AmericaLatviaLebanonLiberiaLithuaniaMalaysiaMexicoMicronesiaMiddle AfricaMoldovaMoroccoNepalNetherlandsNicaraguaNigeriaNorth MacedoniaNorthern AfricaNorthern EuropeNorwayOceaniaPakistanPanamaPeruPhilippinesPolandPortugalRomaniaRussiaSaudi ArabiaScotlandSenegalSerbiaSierra LeoneSingaporeSomaliaSouth AfricaSouth AmericaSouth Central AsiaSouth Eastern AsiaSouthern EuropeSpainSri LankaSt. Vincent and the GrenadinesSudanSwedenSwitzerlandSyriaTaiwanThailandTrinidad and TobagoTurkeyUgandaUkraineUruguayUzbekistanVenezuelaVietnamWest IndiesWestern AfricaWestern AsiaWestern EuropeYemenZaireZimbabwe
Income
Income (Families)
Income (Households)
Poverty
Poverty (Families)
Unemployment
Employment Occupations
Employment Industries
Employer Class
Commute Time
Commute Means
School Enrollment
Education by Degree Field
Occupancy
Finances
Physical Characteristics
Delaware
Compare Zip Codes
Comparison Subject

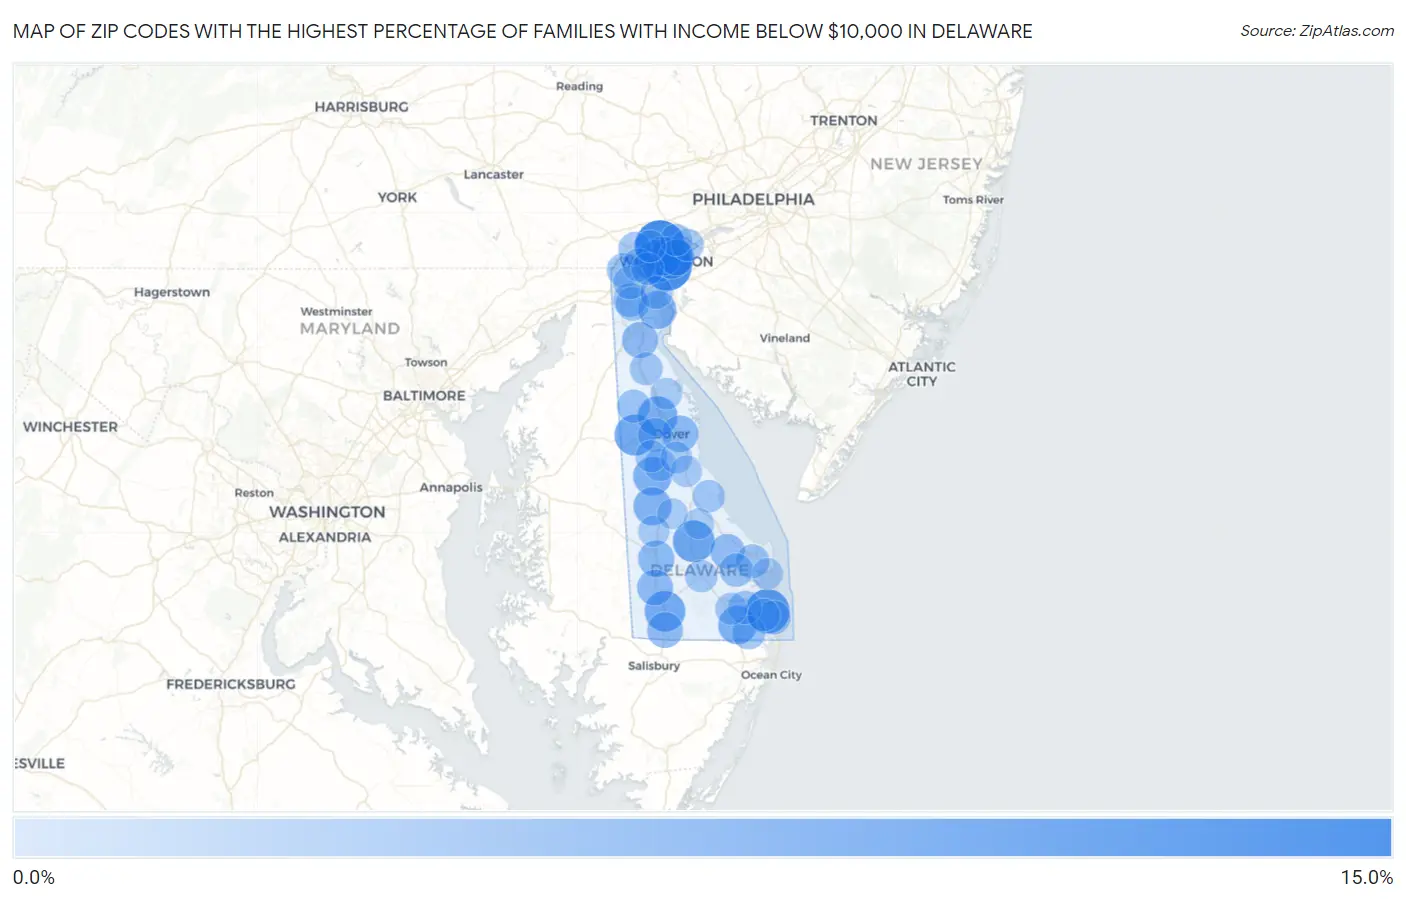
Map of Zip Codes with the Highest Percentage of Families with Income Below $10,000 in Delaware

0.0%
15.0%
Zip Codes with the Highest Percentage of Families with Income Below $10,000 in Delaware Map

Zip Codes with the Highest Percentage of Families with Income Below $10,000 in Delaware

Zip Code Families with Income < $10k vs State vs National
1.1973211.5%2.6%(+8.90)#13.1%(+8.40)#1,464
2.1980110.9%2.6%(+8.30)#23.1%(+7.80)#1,614
3.199708.3%2.6%(+5.70)#33.1%(+5.20)#2,786
4.198057.6%2.6%(+5.00)#43.1%(+4.50)#3,196
5.198027.2%2.6%(+4.60)#53.1%(+4.10)#3,475
6.199416.8%2.6%(+4.20)#63.1%(+3.70)#3,838
7.199536.3%2.6%(+3.70)#73.1%(+3.20)#4,344
8.199566.1%2.6%(+3.50)#83.1%(+3.00)#4,556
9.199365.7%2.6%(+3.10)#93.1%(+2.60)#5,133
10.198065.2%2.6%(+2.60)#103.1%(+2.10)#5,803
11.199434.9%2.6%(+2.30)#113.1%(+1.80)#6,308
12.199454.9%2.6%(+2.30)#123.1%(+1.80)#6,321
13.199524.6%2.6%(+2.00)#133.1%(+1.50)#6,867
14.197064.6%2.6%(+2.00)#143.1%(+1.50)#6,932
15.199013.7%2.6%(+1.10)#153.1%(+0.600)#8,954
16.199333.5%2.6%(+0.900)#163.1%(+0.400)#9,596
17.197093.4%2.6%(+0.800)#173.1%(+0.300)#9,769
18.198093.4%2.6%(+0.800)#183.1%(+0.300)#9,877
19.199733.3%2.6%(+0.700)#193.1%(+0.200)#10,153
20.199403.2%2.6%(+0.600)#203.1%(+0.100)#10,580
21.199682.6%2.6%(=0.000)#213.1%(-0.500)#12,754
22.197112.1%2.6%(-0.500)#223.1%(-1.000)#14,777
23.199042.1%2.6%(-0.500)#233.1%(-1.000)#14,816
24.199302.1%2.6%(-0.500)#243.1%(-1.000)#15,085
25.197022.0%2.6%(-0.600)#253.1%(-1.10)#15,247
26.197012.0%2.6%(-0.600)#263.1%(-1.10)#15,265
27.199582.0%2.6%(-0.600)#273.1%(-1.10)#15,327
28.199752.0%2.6%(-0.600)#283.1%(-1.10)#15,453
29.197131.9%2.6%(-0.700)#293.1%(-1.20)#15,798
30.199511.9%2.6%(-0.700)#303.1%(-1.20)#16,066
31.197071.8%2.6%(-0.800)#313.1%(-1.30)#16,373
32.199391.8%2.6%(-0.800)#323.1%(-1.30)#16,459
33.199381.7%2.6%(-0.900)#333.1%(-1.40)#16,890
34.198081.6%2.6%(-1.00)#343.1%(-1.50)#17,225
35.197201.5%2.6%(-1.10)#353.1%(-1.60)#17,657
36.197341.5%2.6%(-1.10)#363.1%(-1.60)#17,854
37.198041.4%2.6%(-1.20)#373.1%(-1.70)#18,313
38.199671.4%2.6%(-1.20)#383.1%(-1.70)#18,531
39.199631.3%2.6%(-1.30)#393.1%(-1.80)#18,799
40.199471.2%2.6%(-1.40)#403.1%(-1.90)#19,341
41.197031.2%2.6%(-1.40)#413.1%(-1.90)#19,364
42.199791.2%2.6%(-1.40)#423.1%(-1.90)#19,661
43.199661.1%2.6%(-1.50)#433.1%(-2.00)#19,744
44.198101.1%2.6%(-1.50)#443.1%(-2.00)#19,774
45.199341.0%2.6%(-1.60)#453.1%(-2.10)#20,358
46.198071.0%2.6%(-1.60)#463.1%(-2.10)#20,420
47.199620.80%2.6%(-1.80)#473.1%(-2.30)#21,347
48.199770.70%2.6%(-1.90)#483.1%(-2.40)#21,699
49.199460.70%2.6%(-1.90)#493.1%(-2.40)#21,891
50.199500.60%2.6%(-2.00)#503.1%(-2.50)#22,330
51.199710.50%2.6%(-2.10)#513.1%(-2.60)#22,696
52.199600.30%2.6%(-2.30)#523.1%(-2.80)#23,473
53.199540.20%2.6%(-2.40)#533.1%(-2.90)#23,794

Common Questions

What are the Top 10 Zip Codes with the Highest Percentage of Families with Income Below $10,000 in Delaware?
Top 10 Zip Codes with the Highest Percentage of Families with Income Below $10,000 in Delaware are:
#1
11.5%
#2
10.9%
#3
8.3%
#4
7.6%
#5
7.2%
#6
6.8%
#7
6.3%
#8
6.1%
#9
5.7%
#10
5.2%
What zip code has the Highest Percentage of Families with Income Below $10,000 in Delaware?
19732 has the Highest Percentage of Families with Income Below $10,000 in Delaware with 11.5%.
What is the Percentage of Families with Income Below $10,000 in the State of Delaware?
Percentage of Families with Income Below $10,000 in Delaware is 2.6%.
What is the Percentage of Families with Income Below $10,000 in the United States?
Percentage of Families with Income Below $10,000 in the United States is 3.1%.