Zip Codes with the Lowest Poverty Level Among Children Under the Age of 5 in Delaware

RELATED REPORTS & OPTIONS

Lowest Poverty | Child 0-5
Population
Families and Households
Female Fertility
Female Fertility (Unmarried)
Race (Community Size)
Race (Percentage)
Ancestry (Community Size)
AfghanAfricanAlaska NativeAlaskan AthabascanAlbanianAleutAlsatianAmericanApacheArabArapahoArgentineanArmenianAssyrian / Chaldean / SyriacAustralianAustrianBahamianBangladeshiBarbadianBasqueBelgianBelizeanBermudanBhutaneseBlackfeetBolivianBrazilianBritishBritish West IndianBulgarianBurmeseCajunCambodianCanadianCape VerdeanCarpatho RusynCelticCentral AmericanCentral American IndianCherokeeCheyenneChickasawChileanChineseChippewaChoctawColombianColvilleComancheCosta RicanCreeCreekCroatianCrowCubanCypriotCzechCzechoslovakianDanishDelawareDominicanDutchDutch West IndianEastern EuropeanEcuadorianEgyptianEnglishEstonianEthiopianEuropeanFijianFilipinoFinnishFrenchFrench American IndianFrench CanadianGermanGerman RussianGhanaianGreekGuamanian / ChamorroGuatemalanGuyaneseHaitianHmongHonduranHopiHoumaHungarianIcelanderIndian (Asian)IndonesianInupiatIranianIraqiIrishIroquoisIsraeliItalianJamaicanJapaneseJordanianKenyanKiowaKoreanLaotianLatvianLebaneseLiberianLithuanianLumbeeLuxembourgerMacedonianMalaysianMalteseMarshalleseMenomineeMexicanMexican American IndianMongolianMoroccanNative HawaiianNavajoNepaleseNew ZealanderNicaraguanNigerianNorthern EuropeanNorwegianOkinawanOsageOttawaPaiutePakistaniPalestinianPanamanianParaguayanPennsylvania GermanPeruvianPimaPolishPortuguesePotawatomiPuebloPuerto RicanPuget Sound SalishRomanianRussianSalvadoranSamoanScandinavianScotch-IrishScottishSeminoleSenegaleseSerbianShoshoneSierra LeoneanSiouxSlavicSlovakSloveneSomaliSouth AfricanSouth AmericanSouth American IndianSoviet UnionSpaniardSpanishSpanish AmericanSpanish American IndianSri LankanSubsaharan AfricanSudaneseSwedishSwissSyrianTaiwaneseThaiTlingit-HaidaTohono O'OdhamTonganTrinidadian and TobagonianTsimshianTurkishU.S. Virgin IslanderUgandanUkrainianUruguayanUteVenezuelanVietnameseWelshWest IndianYakamaYaquiYugoslavianYumanYup'ikZimbabwean
Ancestry (Percentage)
AfghanAfricanAlaska NativeAlaskan AthabascanAlbanianAleutAlsatianAmericanApacheArabArapahoArgentineanArmenianAssyrian / Chaldean / SyriacAustralianAustrianBahamianBangladeshiBarbadianBasqueBelgianBelizeanBermudanBhutaneseBlackfeetBolivianBrazilianBritishBritish West IndianBulgarianBurmeseCajunCambodianCanadianCape VerdeanCarpatho RusynCelticCentral AmericanCentral American IndianCherokeeCheyenneChickasawChileanChineseChippewaChoctawColombianColvilleComancheCosta RicanCreeCreekCroatianCrowCubanCypriotCzechCzechoslovakianDanishDelawareDominicanDutchDutch West IndianEastern EuropeanEcuadorianEgyptianEnglishEstonianEthiopianEuropeanFijianFilipinoFinnishFrenchFrench American IndianFrench CanadianGermanGerman RussianGhanaianGreekGuamanian / ChamorroGuatemalanGuyaneseHaitianHmongHonduranHopiHoumaHungarianIcelanderIndian (Asian)IndonesianInupiatIranianIraqiIrishIroquoisIsraeliItalianJamaicanJapaneseJordanianKenyanKiowaKoreanLaotianLatvianLebaneseLiberianLithuanianLumbeeLuxembourgerMacedonianMalaysianMalteseMarshalleseMenomineeMexicanMexican American IndianMongolianMoroccanNative HawaiianNavajoNepaleseNew ZealanderNicaraguanNigerianNorthern EuropeanNorwegianOkinawanOsageOttawaPaiutePakistaniPalestinianPanamanianParaguayanPennsylvania GermanPeruvianPimaPolishPortuguesePotawatomiPuebloPuerto RicanPuget Sound SalishRomanianRussianSalvadoranSamoanScandinavianScotch-IrishScottishSeminoleSenegaleseSerbianShoshoneSierra LeoneanSiouxSlavicSlovakSloveneSomaliSouth AfricanSouth AmericanSouth American IndianSoviet UnionSpaniardSpanishSpanish AmericanSpanish American IndianSri LankanSubsaharan AfricanSudaneseSwedishSwissSyrianTaiwaneseThaiTlingit-HaidaTohono O'OdhamTonganTrinidadian and TobagonianTsimshianTurkishU.S. Virgin IslanderUgandanUkrainianUruguayanUteVenezuelanVietnameseWelshWest IndianYakamaYaquiYugoslavianYumanYup'ikZimbabwean
Immigrant Origin (Total)
AfghanistanAfricaAlbaniaArgentinaArmeniaAsiaAustraliaAustriaAzoresBahamasBangladeshBarbadosBelarusBelgiumBelizeBoliviaBosnia and HerzegovinaBrazilBulgariaBurma / MyanmarCabo VerdeCambodiaCameroonCanadaCaribbeanCentral AmericaChileChinaColombiaCongoCosta RicaCroatiaCubaCzechoslovakiaDenmarkDominicaDominican RepublicEastern AfricaEastern AsiaEastern EuropeEcuadorEgyptEl SalvadorEnglandEritreaEthiopiaEuropeFijiFranceGermanyGhanaGreeceGrenadaGuatemalaGuyanaHaitiHondurasHong KongHungaryIndiaIndonesiaIranIraqIrelandIsraelItalyJamaicaJapanJordanKazakhstanKenyaKoreaKuwaitLaosLatin AmericaLatviaLebanonLiberiaLithuaniaMalaysiaMexicoMicronesiaMiddle AfricaMoldovaMoroccoNepalNetherlandsNicaraguaNigeriaNorth MacedoniaNorthern AfricaNorthern EuropeNorwayOceaniaPakistanPanamaPeruPhilippinesPolandPortugalRomaniaRussiaSaudi ArabiaScotlandSenegalSerbiaSierra LeoneSingaporeSomaliaSouth AfricaSouth AmericaSouth Central AsiaSouth Eastern AsiaSouthern EuropeSpainSri LankaSt. Vincent and the GrenadinesSudanSwedenSwitzerlandSyriaTaiwanThailandTrinidad and TobagoTurkeyUgandaUkraineUruguayUzbekistanVenezuelaVietnamWest IndiesWestern AfricaWestern AsiaWestern EuropeYemenZaireZimbabwe
Immigrant Origin (Percentage)
AfghanistanAfricaAlbaniaArgentinaArmeniaAsiaAustraliaAustriaAzoresBahamasBangladeshBarbadosBelarusBelgiumBelizeBoliviaBosnia and HerzegovinaBrazilBulgariaBurma / MyanmarCabo VerdeCambodiaCameroonCanadaCaribbeanCentral AmericaChileChinaColombiaCongoCosta RicaCroatiaCubaCzechoslovakiaDenmarkDominicaDominican RepublicEastern AfricaEastern AsiaEastern EuropeEcuadorEgyptEl SalvadorEnglandEritreaEthiopiaEuropeFijiFranceGermanyGhanaGreeceGrenadaGuatemalaGuyanaHaitiHondurasHong KongHungaryIndiaIndonesiaIranIraqIrelandIsraelItalyJamaicaJapanJordanKazakhstanKenyaKoreaKuwaitLaosLatin AmericaLatviaLebanonLiberiaLithuaniaMalaysiaMexicoMicronesiaMiddle AfricaMoldovaMoroccoNepalNetherlandsNicaraguaNigeriaNorth MacedoniaNorthern AfricaNorthern EuropeNorwayOceaniaPakistanPanamaPeruPhilippinesPolandPortugalRomaniaRussiaSaudi ArabiaScotlandSenegalSerbiaSierra LeoneSingaporeSomaliaSouth AfricaSouth AmericaSouth Central AsiaSouth Eastern AsiaSouthern EuropeSpainSri LankaSt. Vincent and the GrenadinesSudanSwedenSwitzerlandSyriaTaiwanThailandTrinidad and TobagoTurkeyUgandaUkraineUruguayUzbekistanVenezuelaVietnamWest IndiesWestern AfricaWestern AsiaWestern EuropeYemenZaireZimbabwe
Income
Income (Families)
Income (Households)
Poverty
Poverty (Families)
Unemployment
Employment Occupations
Employment Industries
Employer Class
Commute Time
Commute Means
School Enrollment
Education by Degree Field
Occupancy
Finances
Physical Characteristics
Delaware
Compare Zip Codes
Comparison Subject

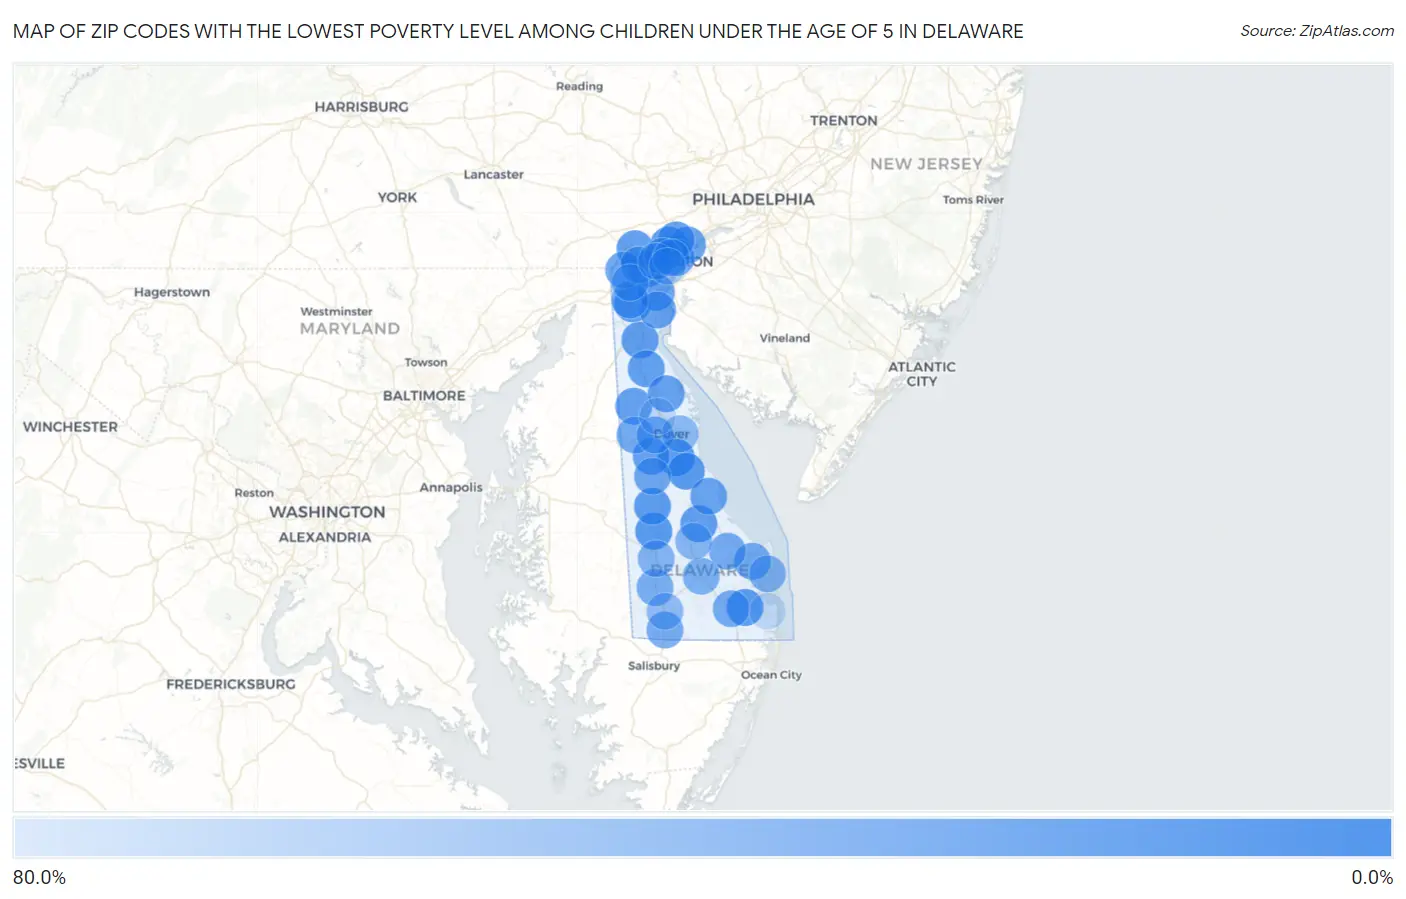
Map of Zip Codes with the Lowest Poverty Level Among Children Under the Age of 5 in Delaware

80.0%
0.0%
Zip Codes with the Lowest Poverty Level Among Children Under the Age of 5 in Delaware Map

Zip Codes with the Lowest Poverty Level Among Children Under the Age of 5 in Delaware

Zip Code Child Poverty vs State vs National
1.199620.41%19.1%(-18.7)#118.1%(-17.7)#32
2.199461.5%19.1%(-17.6)#218.1%(-16.6)#525
3.198032.3%19.1%(-16.8)#318.1%(-15.8)#1,036
4.199502.7%19.1%(-16.4)#418.1%(-15.4)#1,265
5.199393.7%19.1%(-15.4)#518.1%(-14.4)#1,928
6.197074.5%19.1%(-14.6)#618.1%(-13.6)#2,552
7.199524.7%19.1%(-14.4)#718.1%(-13.4)#2,692
8.198045.1%19.1%(-14.0)#818.1%(-13.0)#2,964
9.197096.1%19.1%(-12.9)#918.1%(-11.9)#3,698
10.199607.0%19.1%(-12.1)#1018.1%(-11.1)#4,283
11.197348.3%19.1%(-10.8)#1118.1%(-9.80)#5,080
12.199348.9%19.1%(-10.1)#1218.1%(-9.11)#5,580
13.197039.0%19.1%(-10.1)#1318.1%(-9.09)#5,595
14.198099.0%19.1%(-10.1)#1418.1%(-9.09)#5,602
15.198109.0%19.1%(-10.0)#1518.1%(-9.01)#5,641
16.197019.2%19.1%(-9.85)#1618.1%(-8.85)#5,756
17.1972010.5%19.1%(-8.55)#1718.1%(-7.55)#6,559
18.1993810.8%19.1%(-8.24)#1818.1%(-7.24)#6,732
19.1997711.0%19.1%(-8.06)#1918.1%(-7.06)#6,837
20.1996312.6%19.1%(-6.43)#2018.1%(-5.43)#7,838
21.1970613.3%19.1%(-5.73)#2118.1%(-4.73)#8,232
22.1970215.1%19.1%(-3.93)#2218.1%(-2.93)#9,286
23.1971116.3%19.1%(-2.77)#2318.1%(-1.77)#9,915
24.1994316.7%19.1%(-2.40)#2418.1%(-1.40)#10,093
25.1995817.2%19.1%(-1.90)#2518.1%(-0.896)#10,324
26.1980817.2%19.1%(-1.86)#2618.1%(-0.862)#10,337
27.1995319.9%19.1%(+0.840)#2718.1%(+1.84)#11,569
28.1996621.5%19.1%(+2.44)#2818.1%(+3.44)#12,285
29.1990422.7%19.1%(+3.61)#2918.1%(+4.61)#12,783
30.1996822.8%19.1%(+3.74)#3018.1%(+4.74)#12,834
31.1980623.1%19.1%(+4.07)#3118.1%(+5.07)#12,956
32.1994024.1%19.1%(+5.06)#3218.1%(+6.07)#13,362
33.1971324.2%19.1%(+5.18)#3318.1%(+6.18)#13,403
34.1997325.6%19.1%(+6.57)#3418.1%(+7.58)#13,912
35.1994727.9%19.1%(+8.83)#3518.1%(+9.83)#14,680
36.1993331.5%19.1%(+12.5)#3618.1%(+13.5)#15,722
37.1997132.2%19.1%(+13.1)#3718.1%(+14.1)#15,879
38.1994135.5%19.1%(+16.4)#3818.1%(+17.4)#16,714
39.1990138.2%19.1%(+19.1)#3918.1%(+20.1)#17,297
40.1995640.0%19.1%(+21.0)#4018.1%(+22.0)#17,671
41.1980542.2%19.1%(+23.1)#4118.1%(+24.1)#18,050
42.1980245.9%19.1%(+26.8)#4218.1%(+27.8)#18,610
43.1980156.7%19.1%(+37.7)#4318.1%(+38.7)#19,743
44.1993676.9%19.1%(+57.9)#4418.1%(+58.9)#20,774
45.1997077.7%19.1%(+58.7)#4518.1%(+59.7)#20,789

Common Questions

What are the Top 10 Zip Codes with the Lowest Poverty Level Among Children Under the Age of 5 in Delaware?
Top 10 Zip Codes with the Lowest Poverty Level Among Children Under the Age of 5 in Delaware are:
#1
0.0%
#2
0.0%
#3
0.0%
#4
0.0%
#5
0.0%
#6
0.0%
#7
0.0%
#8
0.0%
#9
0.0%
#10
0.0%
What zip code has the Lowest Poverty Level Among Children Under the Age of 5 in Delaware?
19962 has the Lowest Poverty Level Among Children Under the Age of 5 in Delaware with 0.41%.
What is the Poverty Level Among Children Under the Age of 5 in the State of Delaware?
Poverty Level Among Children Under the Age of 5 in Delaware is 19.1%.
What is the Poverty Level Among Children Under the Age of 5 in the United States?
Poverty Level Among Children Under the Age of 5 in the United States is 18.1%.