Zip Codes with the Highest Percentage of Families with Income Above $100,000 in Denver, CO
RELATED REPORTS & OPTIONS
Family Income | $100k+
Denver
Compare Zip Codes
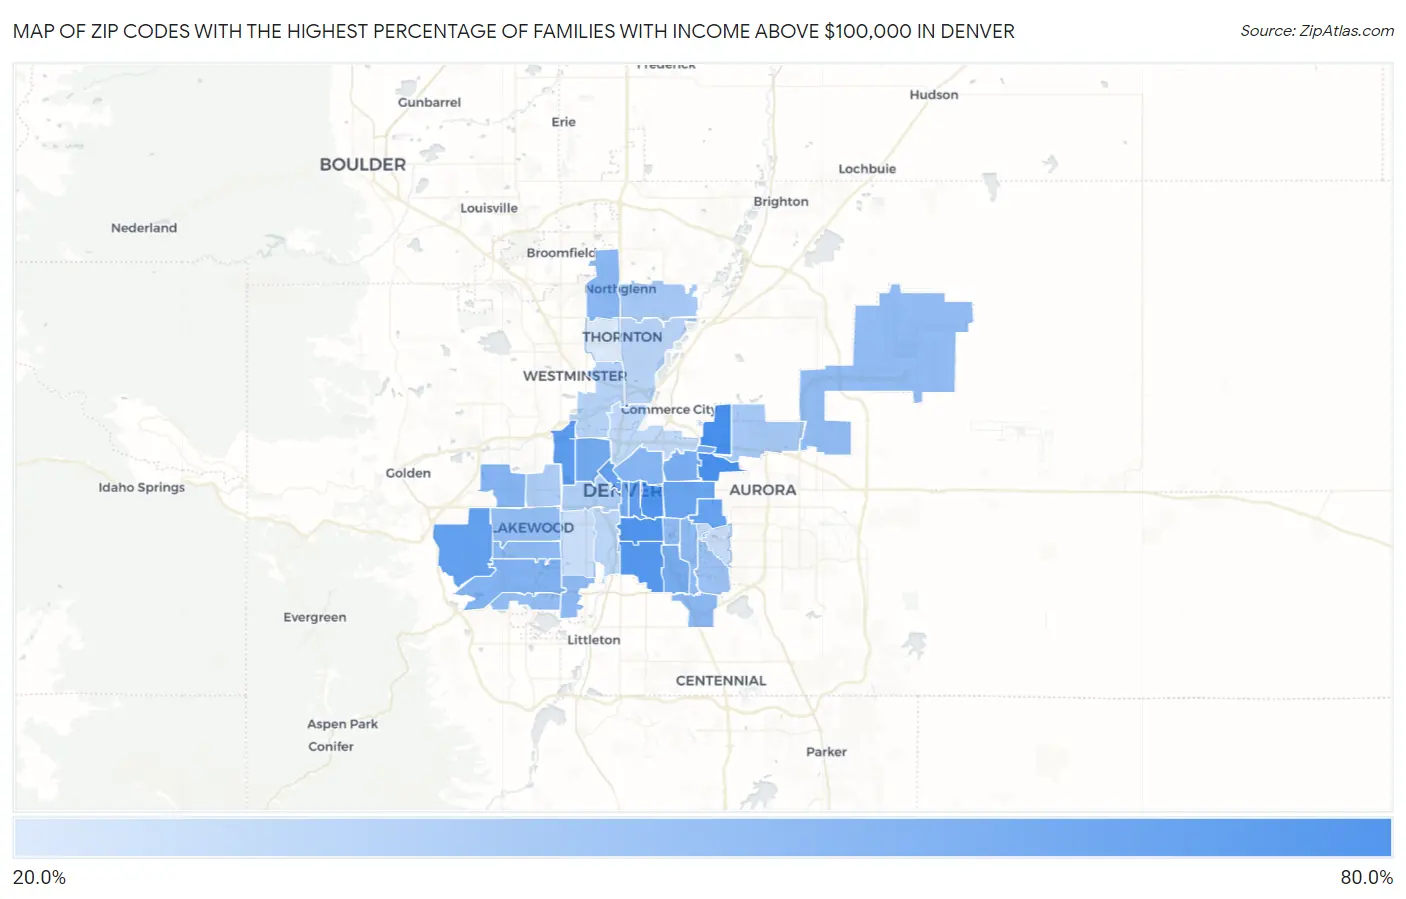
Map of Zip Codes with the Highest Percentage of Families with Income Above $100,000 in Denver
25.3%
79.9%
Zip Codes with the Highest Percentage of Families with Income Above $100,000 in Denver, CO
| Zip Code | Families with Income > $100k | vs State | vs National | |
| 1. | 80238 | 79.9% | 54.4%(+25.5)#18 | 46.1%(+33.8)#1,042 |
| 2. | 80206 | 76.1% | 54.4%(+21.7)#33 | 46.1%(+30.0)#1,547 |
| 3. | 80209 | 75.9% | 54.4%(+21.5)#37 | 46.1%(+29.8)#1,573 |
| 4. | 80210 | 74.2% | 54.4%(+19.8)#47 | 46.1%(+28.1)#1,839 |
| 5. | 80212 | 72.1% | 54.4%(+17.7)#56 | 46.1%(+26.0)#2,196 |
| 6. | 80218 | 69.1% | 54.4%(+14.7)#66 | 46.1%(+23.0)#2,801 |
| 7. | 80228 | 68.5% | 54.4%(+14.1)#71 | 46.1%(+22.4)#2,913 |
| 8. | 80202 | 68.2% | 54.4%(+13.8)#75 | 46.1%(+22.1)#2,971 |
| 9. | 80230 | 67.0% | 54.4%(+12.6)#87 | 46.1%(+20.9)#3,246 |
| 10. | 80220 | 65.1% | 54.4%(+10.7)#98 | 46.1%(+19.0)#3,716 |
| 11. | 80211 | 61.9% | 54.4%(+7.50)#116 | 46.1%(+15.8)#4,573 |
| 12. | 80203 | 61.3% | 54.4%(+6.90)#120 | 46.1%(+15.2)#4,749 |
| 13. | 80222 | 60.4% | 54.4%(+6.00)#126 | 46.1%(+14.3)#5,025 |
| 14. | 80207 | 58.9% | 54.4%(+4.50)#134 | 46.1%(+12.8)#5,481 |
| 15. | 80227 | 56.5% | 54.4%(+2.10)#153 | 46.1%(+10.4)#6,249 |
| 16. | 80205 | 54.8% | 54.4%(+0.400)#158 | 46.1%(+8.70)#6,873 |
| 17. | 80215 | 54.5% | 54.4%(+0.100)#160 | 46.1%(+8.40)#6,977 |
| 18. | 80237 | 53.4% | 54.4%(-1.00)#166 | 46.1%(+7.30)#7,390 |
| 19. | 80234 | 52.7% | 54.4%(-1.70)#175 | 46.1%(+6.60)#7,654 |
| 20. | 80232 | 51.5% | 54.4%(-2.90)#183 | 46.1%(+5.40)#8,201 |
| 21. | 80224 | 51.1% | 54.4%(-3.30)#188 | 46.1%(+5.00)#8,367 |
| 22. | 80236 | 51.0% | 54.4%(-3.40)#189 | 46.1%(+4.90)#8,409 |
| 23. | 80246 | 50.6% | 54.4%(-3.80)#193 | 46.1%(+4.50)#8,569 |
| 24. | 80249 | 50.2% | 54.4%(-4.20)#197 | 46.1%(+4.10)#8,717 |
| 25. | 80226 | 49.6% | 54.4%(-4.80)#207 | 46.1%(+3.50)#9,015 |
| 26. | 80235 | 49.4% | 54.4%(-5.00)#215 | 46.1%(+3.30)#9,112 |
| 27. | 80231 | 46.6% | 54.4%(-7.80)#232 | 46.1%(+0.500)#10,497 |
| 28. | 80233 | 43.2% | 54.4%(-11.2)#258 | 46.1%(-2.90)#12,360 |
| 29. | 80239 | 43.2% | 54.4%(-11.2)#259 | 46.1%(-2.90)#12,361 |
| 30. | 80214 | 40.6% | 54.4%(-13.8)#278 | 46.1%(-5.50)#13,988 |
| 31. | 80204 | 39.8% | 54.4%(-14.6)#286 | 46.1%(-6.30)#14,543 |
| 32. | 80221 | 38.1% | 54.4%(-16.3)#303 | 46.1%(-8.00)#15,659 |
| 33. | 80290 | 38.1% | 54.4%(-16.3)#304 | 46.1%(-8.00)#15,728 |
| 34. | 80229 | 37.0% | 54.4%(-17.4)#316 | 46.1%(-9.10)#16,490 |
| 35. | 80223 | 35.9% | 54.4%(-18.5)#325 | 46.1%(-10.2)#17,261 |
| 36. | 80216 | 34.6% | 54.4%(-19.8)#345 | 46.1%(-11.5)#18,179 |
| 37. | 80219 | 31.8% | 54.4%(-22.6)#374 | 46.1%(-14.3)#20,146 |
| 38. | 80247 | 31.8% | 54.4%(-22.6)#375 | 46.1%(-14.3)#20,152 |
| 39. | 80260 | 25.3% | 54.4%(-29.1)#422 | 46.1%(-20.8)#24,533 |
1
Common Questions
What are the Top 10 Zip Codes with the Highest Percentage of Families with Income Above $100,000 in Denver, CO?
Top 10 Zip Codes with the Highest Percentage of Families with Income Above $100,000 in Denver, CO are:
What zip code has the Highest Percentage of Families with Income Above $100,000 in Denver, CO?
80238 has the Highest Percentage of Families with Income Above $100,000 in Denver, CO with 79.9%.
What is the Percentage of Families with Income Above $100,000 in Denver, CO?
Percentage of Families with Income Above $100,000 in Denver is 54.8%.
What is the Percentage of Families with Income Above $100,000 in Colorado?
Percentage of Families with Income Above $100,000 in Colorado is 54.4%.
What is the Percentage of Families with Income Above $100,000 in the United States?
Percentage of Families with Income Above $100,000 in the United States is 46.1%.