Minturn, CO Map & Demographics
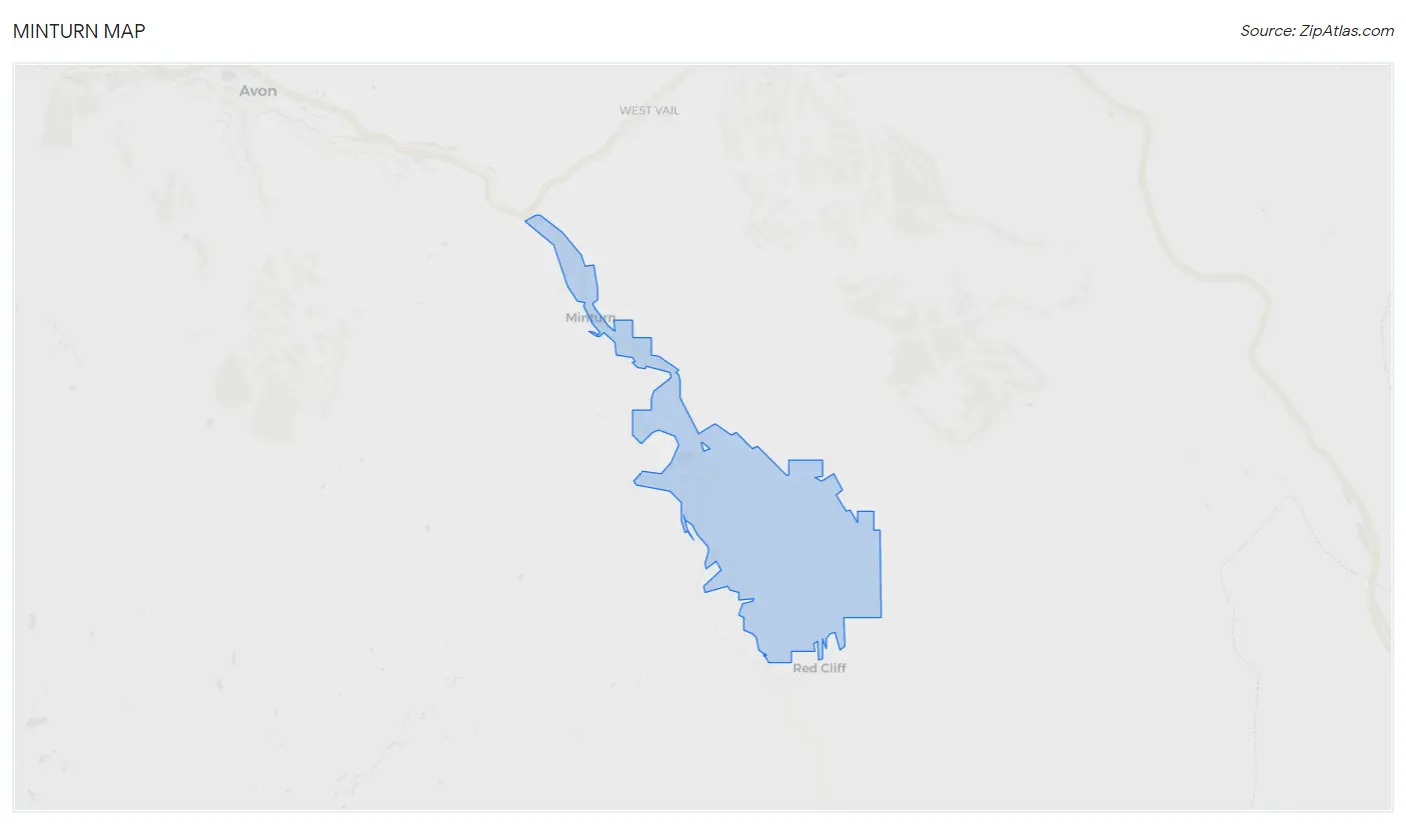
Minturn Map
Minturn Overview
$49,602
PER CAPITA INCOME
$118,542
AVG FAMILY INCOME
$103,333
AVG HOUSEHOLD INCOME
2.5%
WAGE / INCOME GAP [ % ]
97.5¢/ $1
WAGE / INCOME GAP [ $ ]
0.44
INEQUALITY / GINI INDEX
978
TOTAL POPULATION
514
MALE POPULATION
464
FEMALE POPULATION
110.78
MALES / 100 FEMALES
90.27
FEMALES / 100 MALES
38.1
MEDIAN AGE
3.0
AVG FAMILY SIZE
2.5
AVG HOUSEHOLD SIZE
645
LABOR FORCE [ PEOPLE ]
81.1%
PERCENT IN LABOR FORCE
5.9%
UNEMPLOYMENT RATE
Minturn Zip Codes
Minturn Area Codes
Income in Minturn
Income Overview in Minturn
Per Capita Income in Minturn is $49,602, while median incomes of families and households are $118,542 and $103,333 respectively.
| Characteristic | Number | Measure |
| Per Capita Income | 978 | $49,602 |
| Median Family Income | 208 | $118,542 |
| Mean Family Income | 208 | $144,100 |
| Median Household Income | 386 | $103,333 |
| Mean Household Income | 386 | $108,837 |
| Income Deficit | 208 | $0 |
| Wage / Income Gap (%) | 978 | 2.52% |
| Wage / Income Gap ($) | 978 | 97.48¢ per $1 |
| Gini / Inequality Index | 978 | 0.44 |
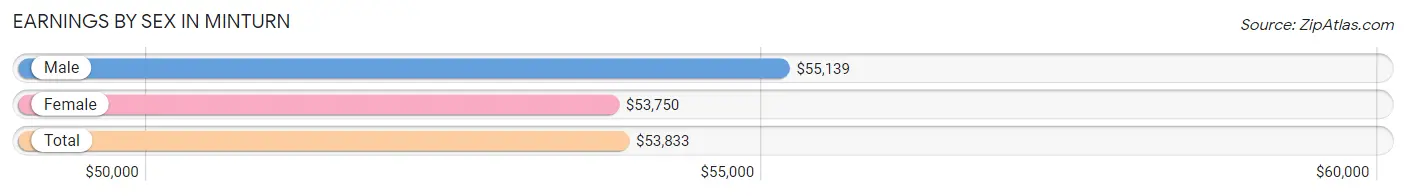
Earnings by Sex in Minturn
Average Earnings in Minturn are $53,833, $55,139 for men and $53,750 for women, a difference of 2.5%.
| Sex | Number | Average Earnings |
| Male | 343 (52.1%) | $55,139 |
| Female | 315 (47.9%) | $53,750 |
| Total | 658 (100.0%) | $53,833 |
Earnings by Sex by Income Bracket in Minturn
The most common earnings brackets in Minturn are $65,000 to $74,999 for men (50 | 14.6%) and $100,000+ for women (89 | 28.2%).
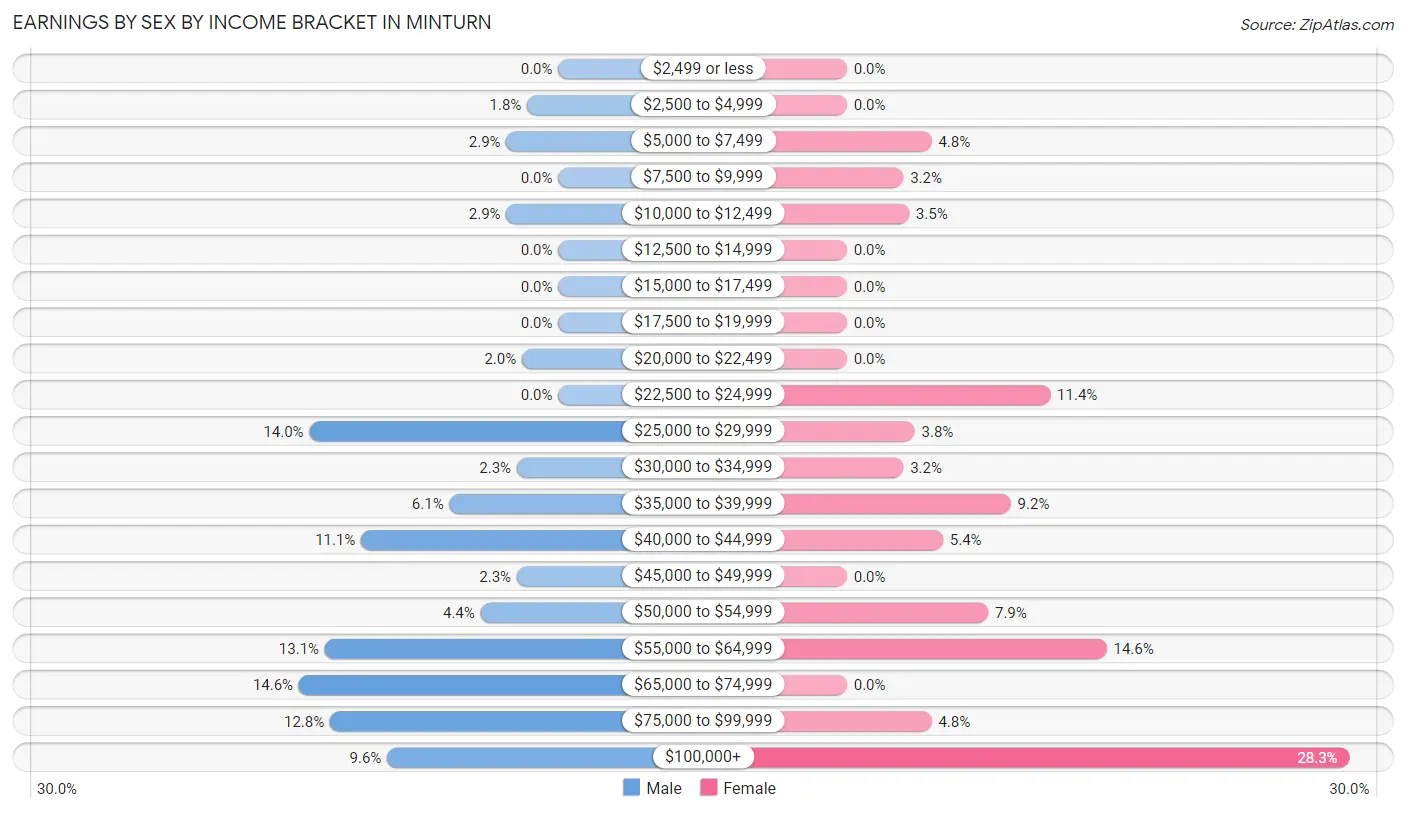
| Income | Male | Female |
| $2,499 or less | 0 (0.0%) | 0 (0.0%) |
| $2,500 to $4,999 | 6 (1.8%) | 0 (0.0%) |
| $5,000 to $7,499 | 10 (2.9%) | 15 (4.8%) |
| $7,500 to $9,999 | 0 (0.0%) | 10 (3.2%) |
| $10,000 to $12,499 | 10 (2.9%) | 11 (3.5%) |
| $12,500 to $14,999 | 0 (0.0%) | 0 (0.0%) |
| $15,000 to $17,499 | 0 (0.0%) | 0 (0.0%) |
| $17,500 to $19,999 | 0 (0.0%) | 0 (0.0%) |
| $20,000 to $22,499 | 7 (2.0%) | 0 (0.0%) |
| $22,500 to $24,999 | 0 (0.0%) | 36 (11.4%) |
| $25,000 to $29,999 | 48 (14.0%) | 12 (3.8%) |
| $30,000 to $34,999 | 8 (2.3%) | 10 (3.2%) |
| $35,000 to $39,999 | 21 (6.1%) | 29 (9.2%) |
| $40,000 to $44,999 | 38 (11.1%) | 17 (5.4%) |
| $45,000 to $49,999 | 8 (2.3%) | 0 (0.0%) |
| $50,000 to $54,999 | 15 (4.4%) | 25 (7.9%) |
| $55,000 to $64,999 | 45 (13.1%) | 46 (14.6%) |
| $65,000 to $74,999 | 50 (14.6%) | 0 (0.0%) |
| $75,000 to $99,999 | 44 (12.8%) | 15 (4.8%) |
| $100,000+ | 33 (9.6%) | 89 (28.2%) |
| Total | 343 (100.0%) | 315 (100.0%) |
Earnings by Sex by Educational Attainment in Minturn
Average earnings in Minturn are $55,972 for men and $54,333 for women, a difference of 2.9%. Men with an educational attainment of high school diploma enjoy the highest average annual earnings of $67,917, while those with college or associate's degree education earn the least with $28,065. Women with an educational attainment of bachelor's degree earn the most with the average annual earnings of $59,625, while those with college or associate's degree education have the smallest earnings of $41,985.
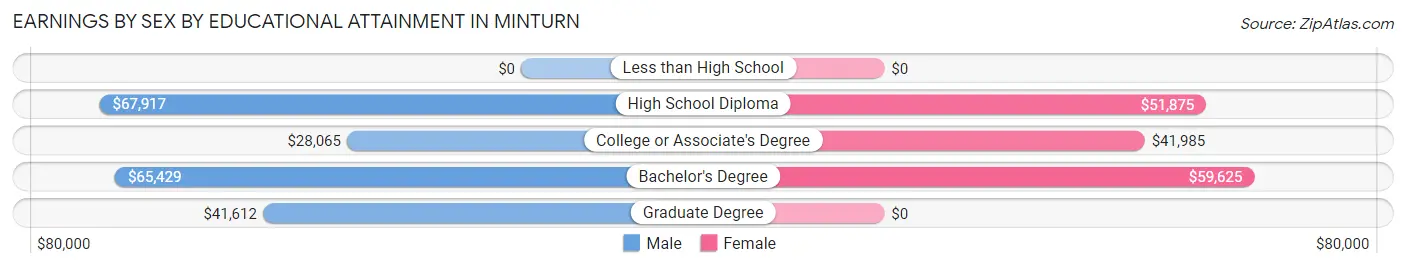
| Educational Attainment | Male Income | Female Income |
| Less than High School | - | - |
| High School Diploma | $67,917 | $51,875 |
| College or Associate's Degree | $28,065 | $41,985 |
| Bachelor's Degree | $65,429 | $59,625 |
| Graduate Degree | $41,612 | $0 |
| Total | $55,972 | $54,333 |
Family Income in Minturn
Family Income Brackets in Minturn
According to the Minturn family income data, there are 65 families falling into the $100,000 to $149,999 income range, which is the most common income bracket and makes up 31.2% of all families.
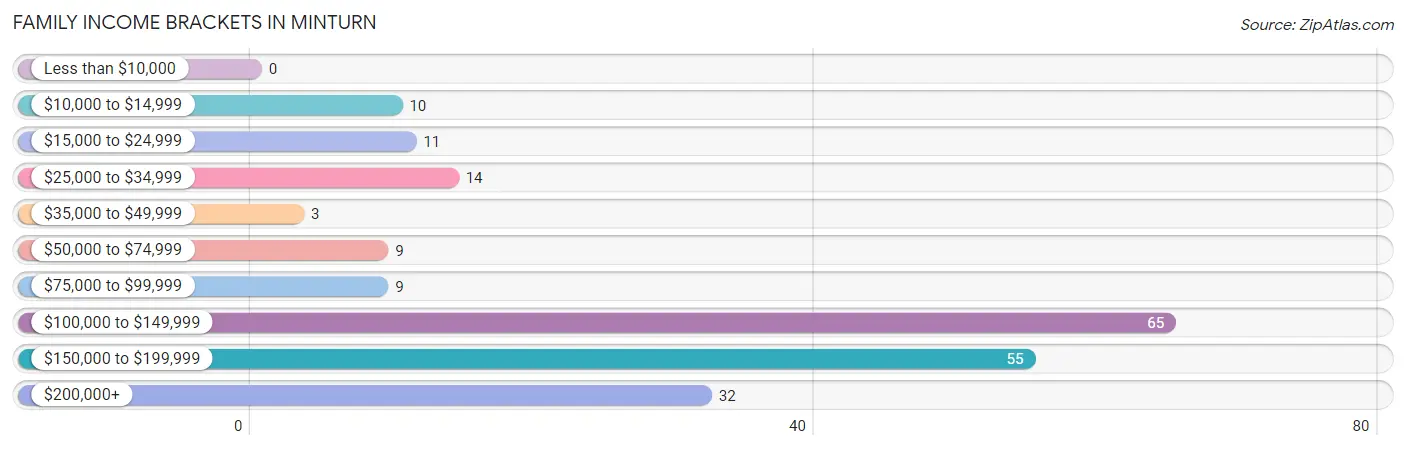
| Income Bracket | # Families | % Families |
| Less than $10,000 | 0 | 0.0% |
| $10,000 to $14,999 | 10 | 4.8% |
| $15,000 to $24,999 | 11 | 5.3% |
| $25,000 to $34,999 | 14 | 6.7% |
| $35,000 to $49,999 | 3 | 1.4% |
| $50,000 to $74,999 | 9 | 4.3% |
| $75,000 to $99,999 | 9 | 4.3% |
| $100,000 to $149,999 | 65 | 31.3% |
| $150,000 to $199,999 | 55 | 26.4% |
| $200,000+ | 32 | 15.4% |
Family Income by Famaliy Size in Minturn
3-person families (43 | 20.7%) account for the highest median family income in Minturn with $114,583 per family, while 2-person families (112 | 53.8%) have the highest median income of $55,278 per family member.
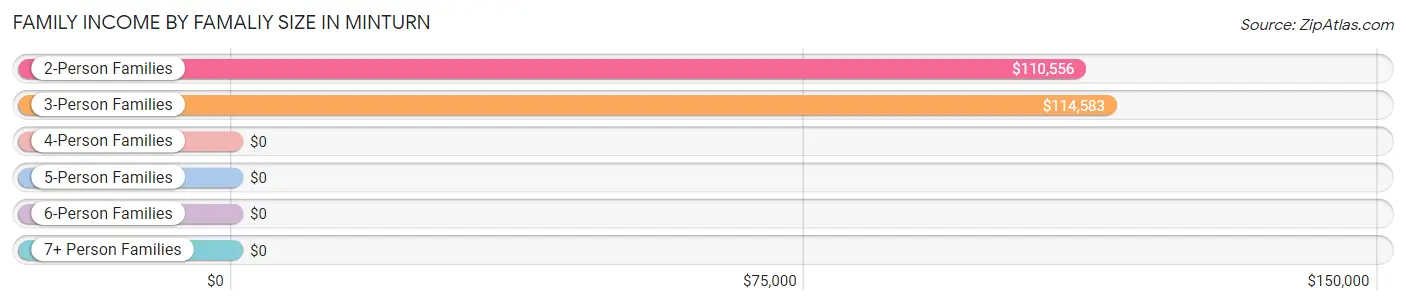
| Income Bracket | # Families | Median Income |
| 2-Person Families | 112 (53.8%) | $110,556 |
| 3-Person Families | 43 (20.7%) | $114,583 |
| 4-Person Families | 15 (7.2%) | $0 |
| 5-Person Families | 38 (18.3%) | $0 |
| 6-Person Families | 0 (0.0%) | $0 |
| 7+ Person Families | 0 (0.0%) | $0 |
| Total | 208 (100.0%) | $118,542 |
Family Income by Number of Earners in Minturn
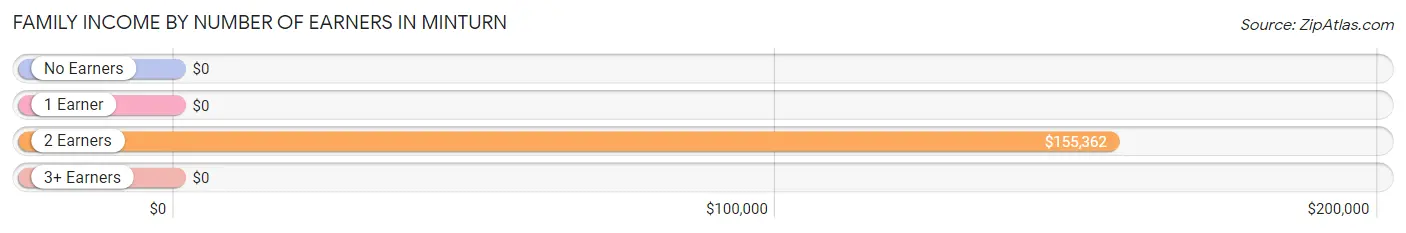
| Number of Earners | # Families | Median Income |
| No Earners | 21 (10.1%) | $0 |
| 1 Earner | 60 (28.8%) | $0 |
| 2 Earners | 127 (61.1%) | $155,362 |
| 3+ Earners | 0 (0.0%) | $0 |
| Total | 208 (100.0%) | $118,542 |
Household Income in Minturn
Household Income Brackets in Minturn
With 89 households falling in the category, the $100,000 to $149,999 income range is the most frequent in Minturn, accounting for 23.1% of all households. In contrast, only 10 households (2.6%) fall into the $10,000 to $14,999 income bracket, making it the least populous group.
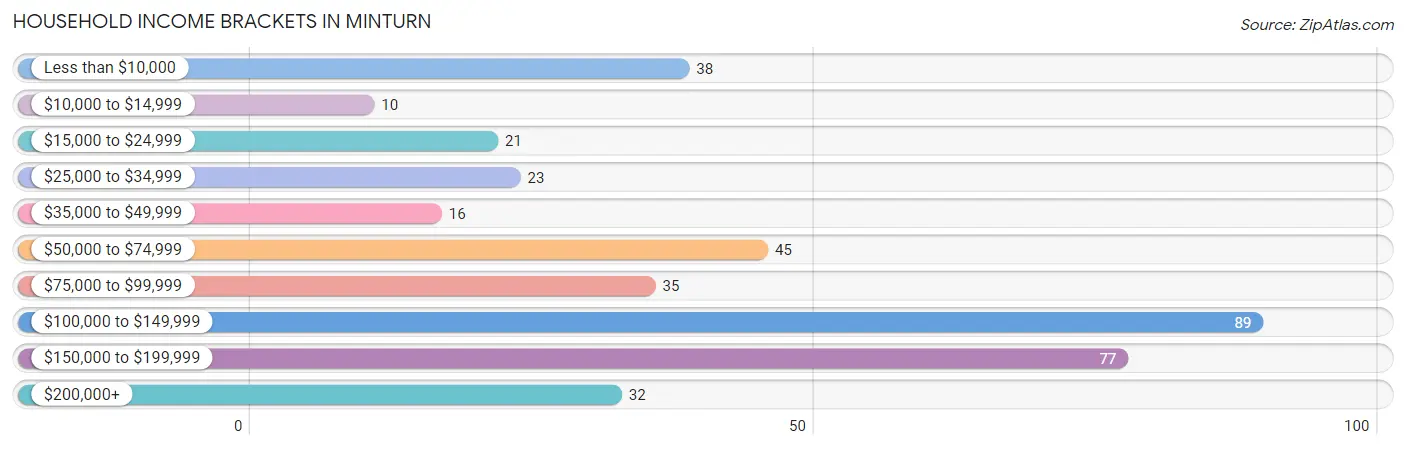
| Income Bracket | # Households | % Households |
| Less than $10,000 | 38 | 9.8% |
| $10,000 to $14,999 | 10 | 2.6% |
| $15,000 to $24,999 | 21 | 5.4% |
| $25,000 to $34,999 | 23 | 6.0% |
| $35,000 to $49,999 | 16 | 4.1% |
| $50,000 to $74,999 | 45 | 11.7% |
| $75,000 to $99,999 | 35 | 9.1% |
| $100,000 to $149,999 | 89 | 23.1% |
| $150,000 to $199,999 | 77 | 19.9% |
| $200,000+ | 32 | 8.3% |
Household Income by Householder Age in Minturn
The median household income in Minturn is $103,333, with the highest median household income of $114,306 found in the 45 to 64 years age bracket for the primary householder. A total of 137 households (35.5%) fall into this category. Meanwhile, the 15 to 24 years age bracket for the primary householder has the lowest median household income of $0, with 13 households (3.4%) in this group.
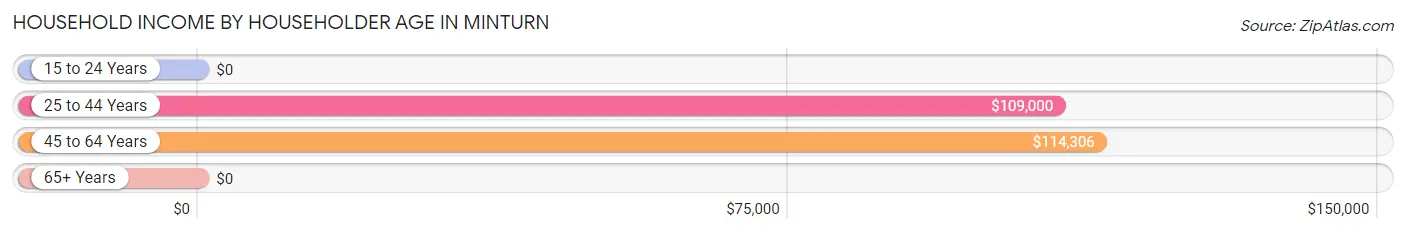
| Income Bracket | # Households | Median Income |
| 15 to 24 Years | 13 (3.4%) | $0 |
| 25 to 44 Years | 136 (35.2%) | $109,000 |
| 45 to 64 Years | 137 (35.5%) | $114,306 |
| 65+ Years | 100 (25.9%) | $0 |
| Total | 386 (100.0%) | $103,333 |
Poverty in Minturn
Income Below Poverty by Sex and Age in Minturn
With 4.3% poverty level for males and 10.6% for females among the residents of Minturn, 18 to 24 year old males and 18 to 24 year old females are the most vulnerable to poverty, with 6 males (100.0%) and 7 females (100.0%) in their respective age groups living below the poverty level.
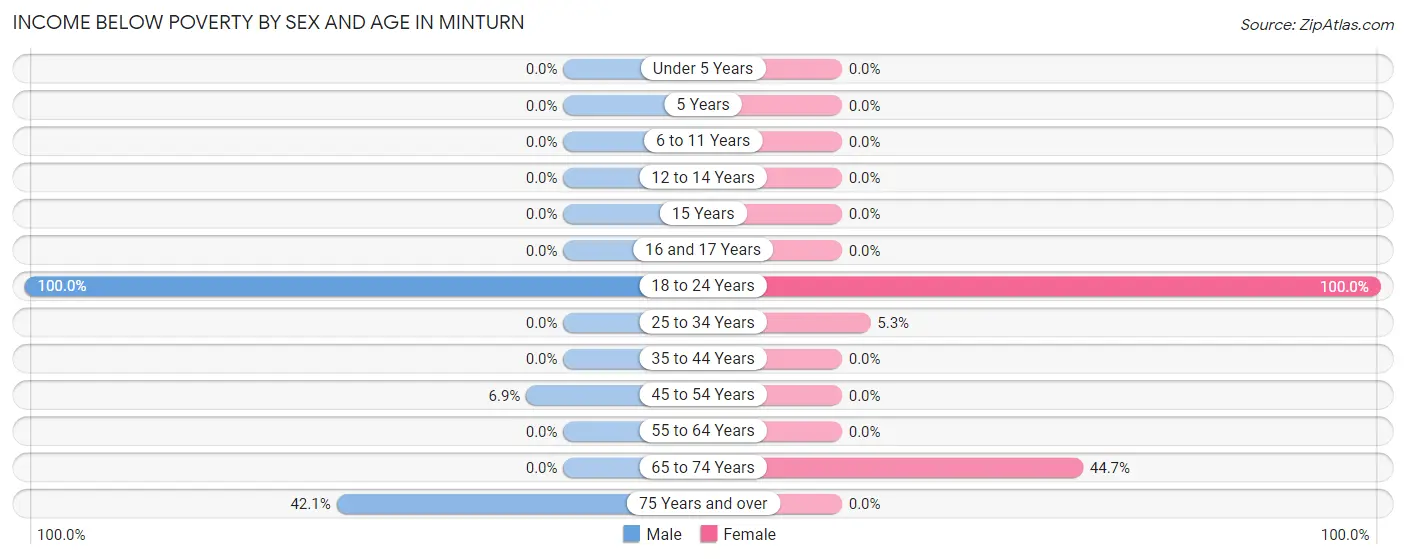
| Age Bracket | Male | Female |
| Under 5 Years | 0 (0.0%) | 0 (0.0%) |
| 5 Years | 0 (0.0%) | 0 (0.0%) |
| 6 to 11 Years | 0 (0.0%) | 0 (0.0%) |
| 12 to 14 Years | 0 (0.0%) | 0 (0.0%) |
| 15 Years | 0 (0.0%) | 0 (0.0%) |
| 16 and 17 Years | 0 (0.0%) | 0 (0.0%) |
| 18 to 24 Years | 6 (100.0%) | 7 (100.0%) |
| 25 to 34 Years | 0 (0.0%) | 8 (5.3%) |
| 35 to 44 Years | 0 (0.0%) | 0 (0.0%) |
| 45 to 54 Years | 8 (6.9%) | 0 (0.0%) |
| 55 to 64 Years | 0 (0.0%) | 0 (0.0%) |
| 65 to 74 Years | 0 (0.0%) | 34 (44.7%) |
| 75 Years and over | 8 (42.1%) | 0 (0.0%) |
| Total | 22 (4.3%) | 49 (10.6%) |
Income Above Poverty by Sex and Age in Minturn
According to the poverty statistics in Minturn, males aged under 5 years and females aged under 5 years are the age groups that are most secure financially, with 100.0% of males and 100.0% of females in these age groups living above the poverty line.
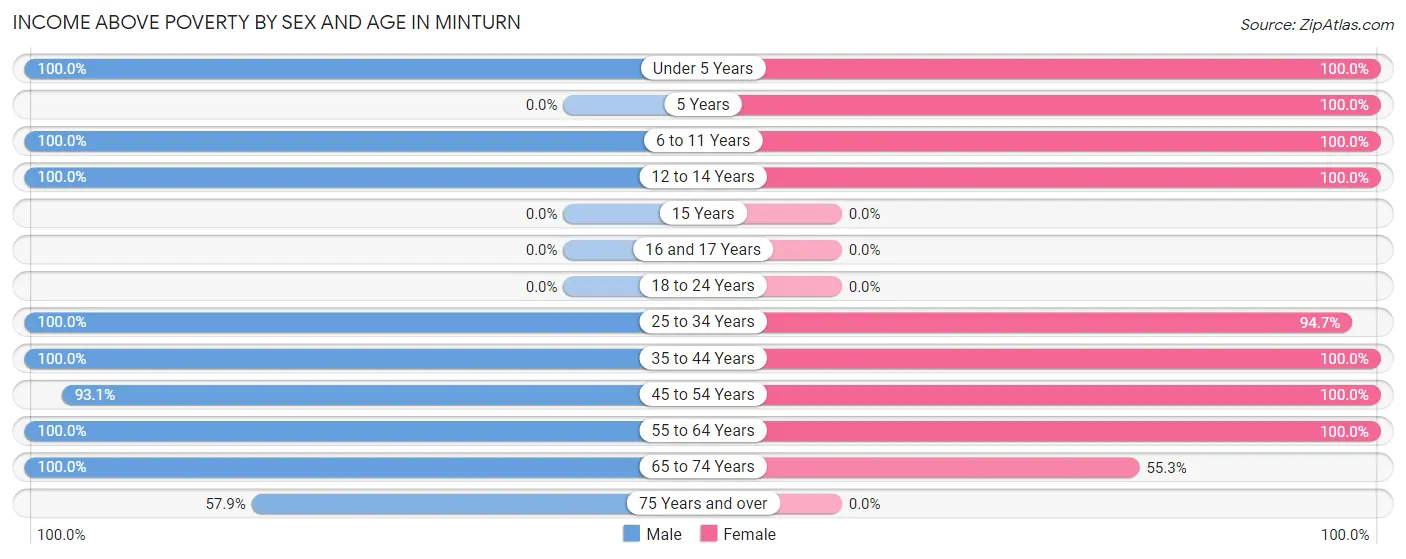
| Age Bracket | Male | Female |
| Under 5 Years | 3 (100.0%) | 3 (100.0%) |
| 5 Years | 0 (0.0%) | 12 (100.0%) |
| 6 to 11 Years | 62 (100.0%) | 49 (100.0%) |
| 12 to 14 Years | 45 (100.0%) | 9 (100.0%) |
| 15 Years | 0 (0.0%) | 0 (0.0%) |
| 16 and 17 Years | 0 (0.0%) | 0 (0.0%) |
| 18 to 24 Years | 0 (0.0%) | 0 (0.0%) |
| 25 to 34 Years | 116 (100.0%) | 143 (94.7%) |
| 35 to 44 Years | 66 (100.0%) | 45 (100.0%) |
| 45 to 54 Years | 108 (93.1%) | 72 (100.0%) |
| 55 to 64 Years | 30 (100.0%) | 40 (100.0%) |
| 65 to 74 Years | 51 (100.0%) | 42 (55.3%) |
| 75 Years and over | 11 (57.9%) | 0 (0.0%) |
| Total | 492 (95.7%) | 415 (89.4%) |
Income Below Poverty Among Married-Couple Families in Minturn
The poverty statistics for married-couple families in Minturn show that 5.4% or 10 of the total 185 families live below the poverty line. Families with no children have the highest poverty rate of 8.8%, comprising of 10 families. On the other hand, families with 1 or 2 children have the lowest poverty rate of 0.0%, which includes 0 families.
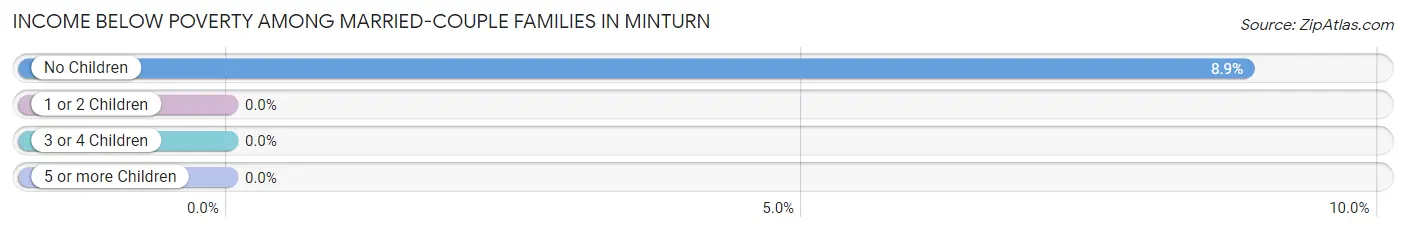
| Children | Above Poverty | Below Poverty |
| No Children | 103 (91.1%) | 10 (8.8%) |
| 1 or 2 Children | 34 (100.0%) | 0 (0.0%) |
| 3 or 4 Children | 38 (100.0%) | 0 (0.0%) |
| 5 or more Children | 0 (0.0%) | 0 (0.0%) |
| Total | 175 (94.6%) | 10 (5.4%) |
Income Below Poverty Among Single-Parent Households in Minturn
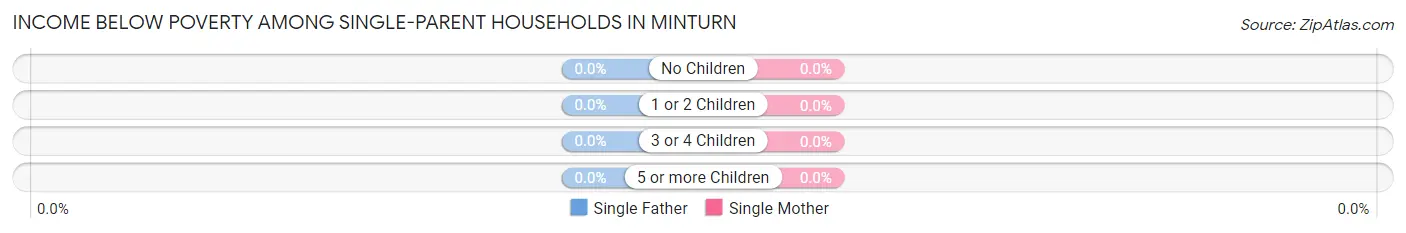
| Children | Single Father | Single Mother |
| No Children | 0 (0.0%) | 0 (0.0%) |
| 1 or 2 Children | 0 (0.0%) | 0 (0.0%) |
| 3 or 4 Children | 0 (0.0%) | 0 (0.0%) |
| 5 or more Children | 0 (0.0%) | 0 (0.0%) |
| Total | 0 (0.0%) | 0 (0.0%) |
Income Below Poverty Among Married-Couple vs Single-Parent Households in Minturn
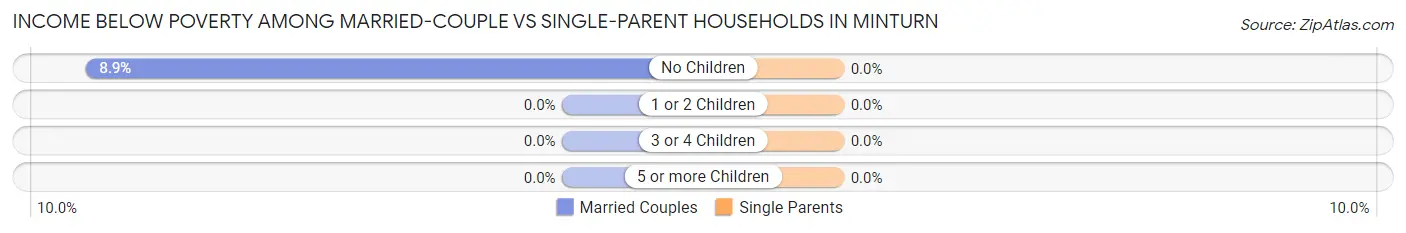
| Children | Married-Couple Families | Single-Parent Households |
| No Children | 10 (8.8%) | 0 (0.0%) |
| 1 or 2 Children | 0 (0.0%) | 0 (0.0%) |
| 3 or 4 Children | 0 (0.0%) | 0 (0.0%) |
| 5 or more Children | 0 (0.0%) | 0 (0.0%) |
| Total | 10 (5.4%) | 0 (0.0%) |
Race in Minturn
The most populous races in Minturn are White / Caucasian (831 | 85.0%), Hispanic or Latino (194 | 19.8%), and Two or more Races (147 | 15.0%).
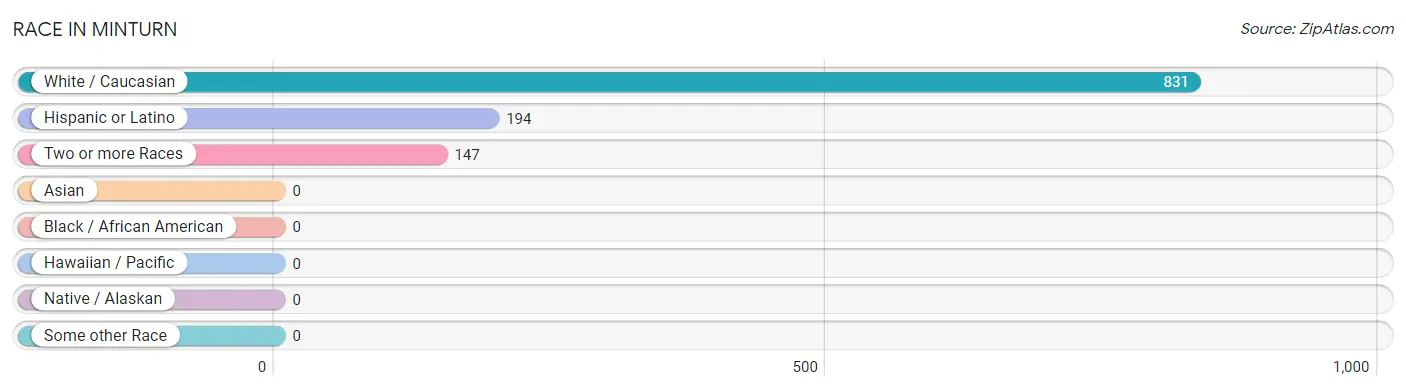
| Race | # Population | % Population |
| Asian | 0 | 0.0% |
| Black / African American | 0 | 0.0% |
| Hawaiian / Pacific | 0 | 0.0% |
| Hispanic or Latino | 194 | 19.8% |
| Native / Alaskan | 0 | 0.0% |
| White / Caucasian | 831 | 85.0% |
| Two or more Races | 147 | 15.0% |
| Some other Race | 0 | 0.0% |
| Total | 978 | 100.0% |
Ancestry in Minturn
The most populous ancestries reported in Minturn are Irish (276 | 28.2%), Dutch (167 | 17.1%), German (136 | 13.9%), Mexican (85 | 8.7%), and French (81 | 8.3%), together accounting for 76.2% of all Minturn residents.
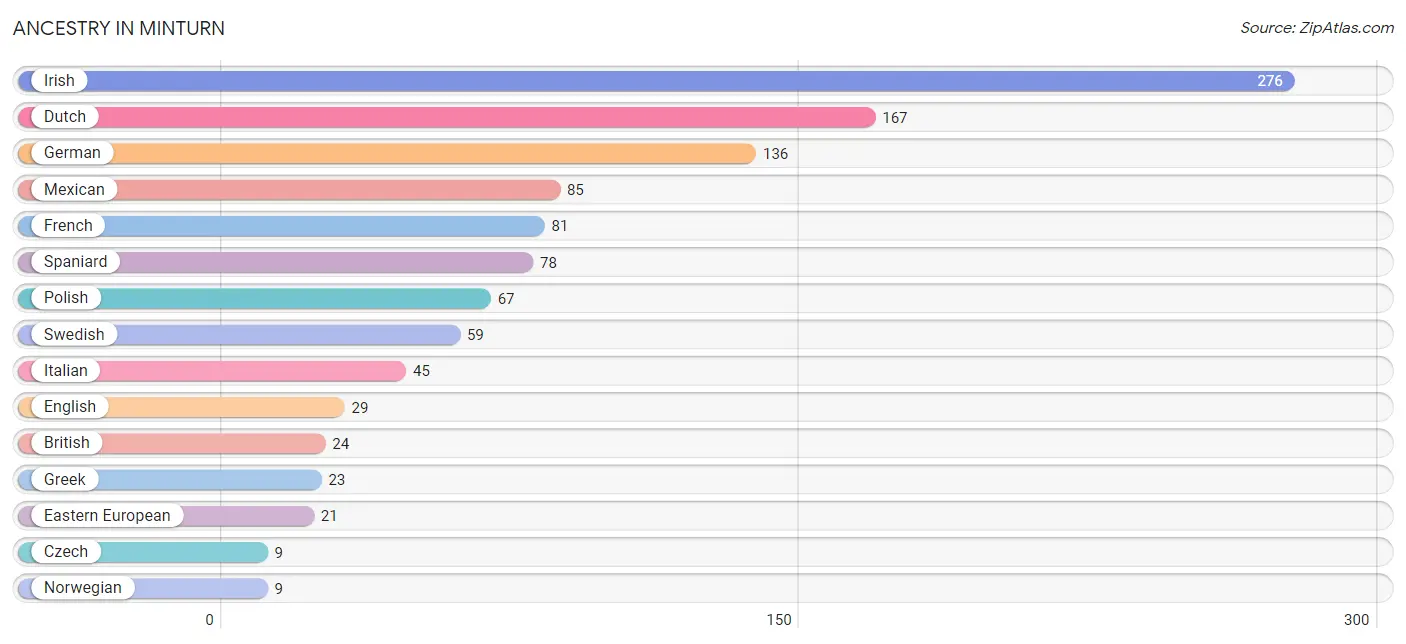
| Ancestry | # Population | % Population |
| British | 24 | 2.5% |
| Czech | 9 | 0.9% |
| Dutch | 167 | 17.1% |
| Eastern European | 21 | 2.1% |
| English | 29 | 3.0% |
| French | 81 | 8.3% |
| German | 136 | 13.9% |
| Greek | 23 | 2.4% |
| Irish | 276 | 28.2% |
| Italian | 45 | 4.6% |
| Mexican | 85 | 8.7% |
| Norwegian | 9 | 0.9% |
| Polish | 67 | 6.9% |
| Spaniard | 78 | 8.0% |
| Swedish | 59 | 6.0% | View All 15 Rows |
Immigrants in Minturn
The most numerous immigrant groups reported in Minturn came from Central America (20 | 2.0%), Latin America (20 | 2.0%), El Salvador (15 | 1.5%), England (8 | 0.8%), and Europe (8 | 0.8%), together accounting for 7.3% of all Minturn residents.
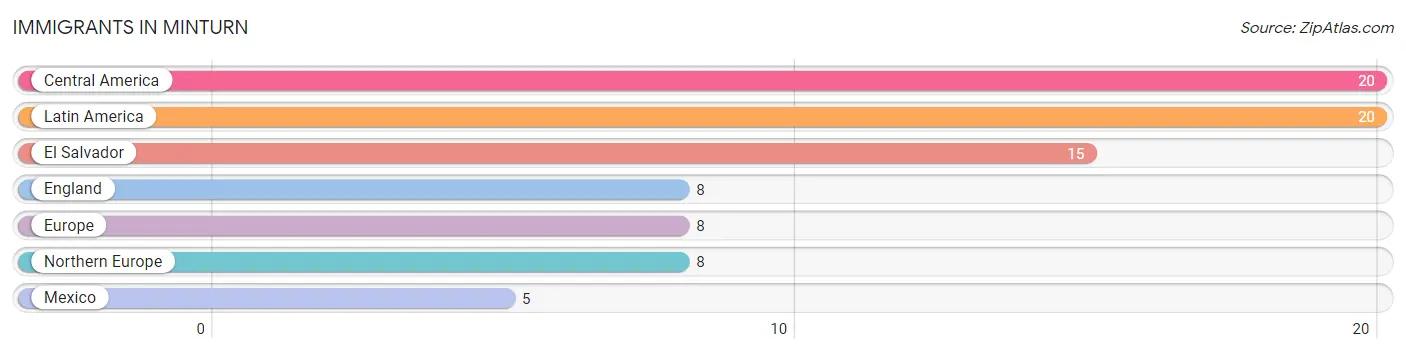
| Immigration Origin | # Population | % Population |
| Central America | 20 | 2.0% |
| El Salvador | 15 | 1.5% |
| England | 8 | 0.8% |
| Europe | 8 | 0.8% |
| Latin America | 20 | 2.0% |
| Mexico | 5 | 0.5% |
| Northern Europe | 8 | 0.8% | View All 7 Rows |
Sex and Age in Minturn
Sex and Age in Minturn
The most populous age groups in Minturn are 50 to 54 Years (73 | 14.2%) for men and 25 to 29 Years (109 | 23.5%) for women.
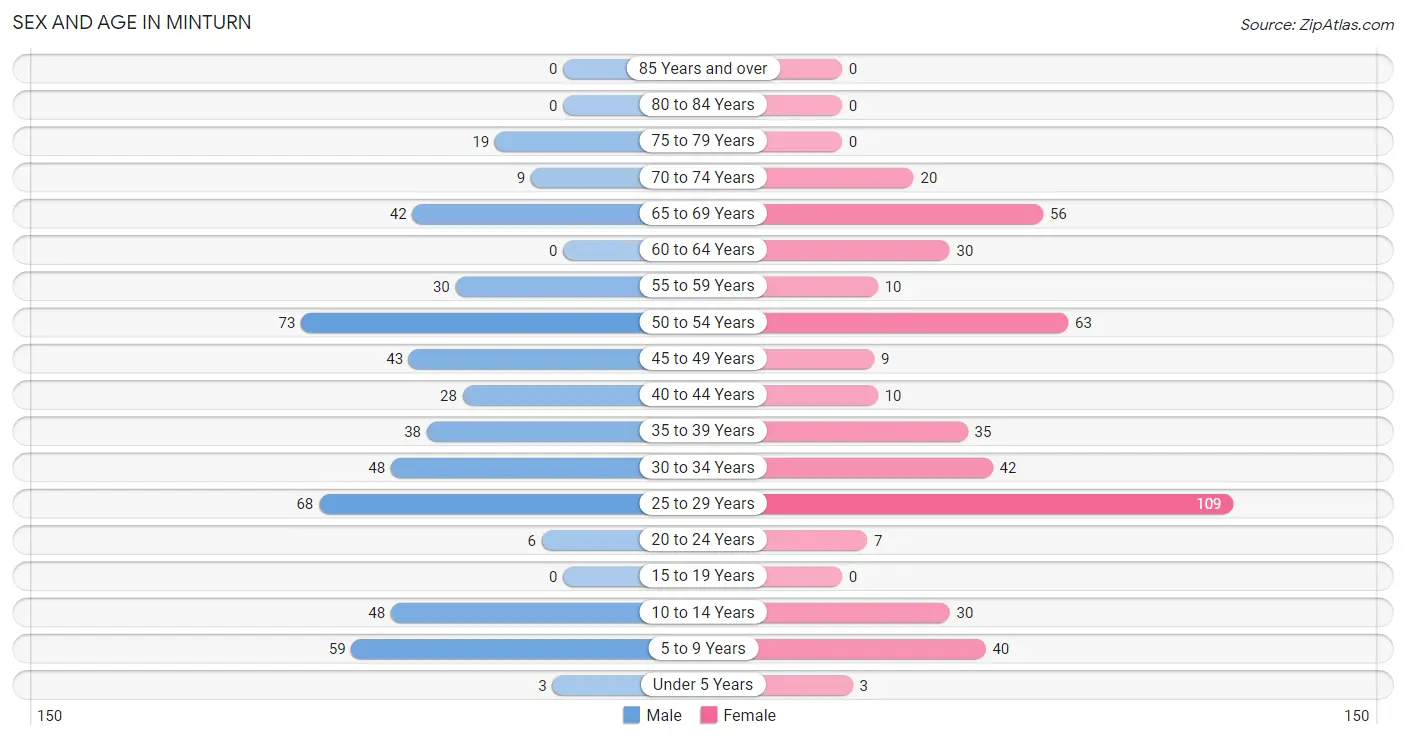
| Age Bracket | Male | Female |
| Under 5 Years | 3 (0.6%) | 3 (0.6%) |
| 5 to 9 Years | 59 (11.5%) | 40 (8.6%) |
| 10 to 14 Years | 48 (9.3%) | 30 (6.5%) |
| 15 to 19 Years | 0 (0.0%) | 0 (0.0%) |
| 20 to 24 Years | 6 (1.2%) | 7 (1.5%) |
| 25 to 29 Years | 68 (13.2%) | 109 (23.5%) |
| 30 to 34 Years | 48 (9.3%) | 42 (9.0%) |
| 35 to 39 Years | 38 (7.4%) | 35 (7.5%) |
| 40 to 44 Years | 28 (5.4%) | 10 (2.2%) |
| 45 to 49 Years | 43 (8.4%) | 9 (1.9%) |
| 50 to 54 Years | 73 (14.2%) | 63 (13.6%) |
| 55 to 59 Years | 30 (5.8%) | 10 (2.2%) |
| 60 to 64 Years | 0 (0.0%) | 30 (6.5%) |
| 65 to 69 Years | 42 (8.2%) | 56 (12.1%) |
| 70 to 74 Years | 9 (1.8%) | 20 (4.3%) |
| 75 to 79 Years | 19 (3.7%) | 0 (0.0%) |
| 80 to 84 Years | 0 (0.0%) | 0 (0.0%) |
| 85 Years and over | 0 (0.0%) | 0 (0.0%) |
| Total | 514 (100.0%) | 464 (100.0%) |
Families and Households in Minturn
Median Family Size in Minturn
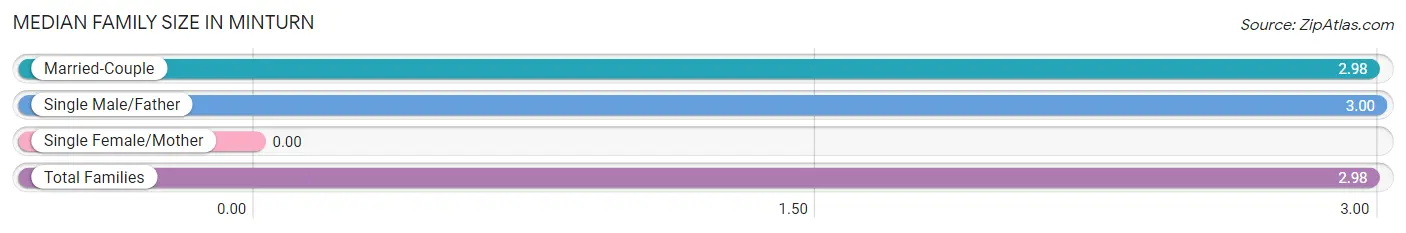
| Family Type | # Families | Family Size |
| Married-Couple | 185 (88.9%) | 2.98 |
| Single Male/Father | 23 (11.1%) | 3.00 |
| Single Female/Mother | 0 (0.0%) | - |
| Total Families | 208 (100.0%) | 2.98 |
Median Household Size in Minturn
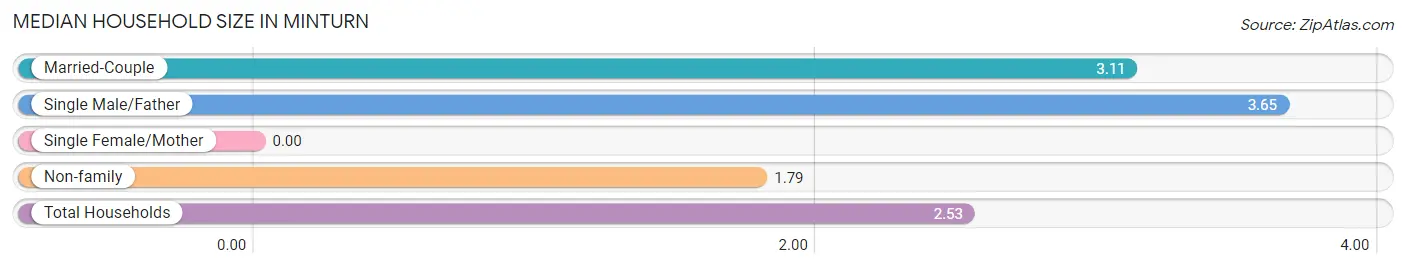
| Household Type | # Households | Household Size |
| Married-Couple | 185 (47.9%) | 3.11 |
| Single Male/Father | 23 (6.0%) | 3.65 |
| Single Female/Mother | 0 (0.0%) | - |
| Non-family | 178 (46.1%) | 1.79 |
| Total Households | 386 (100.0%) | 2.53 |
Household Size by Marriage Status in Minturn
Out of a total of 386 households in Minturn, 208 (53.9%) are family households, while 178 (46.1%) are nonfamily households. The most numerous type of family households are 2-person households, comprising 100, and the most common type of nonfamily households are 1-person households, comprising 104.
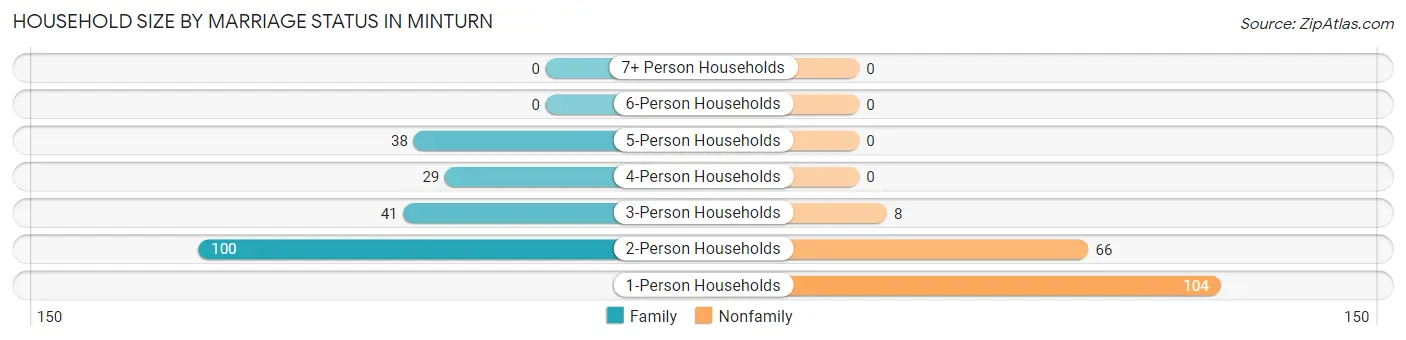
| Household Size | Family Households | Nonfamily Households |
| 1-Person Households | - | 104 (26.9%) |
| 2-Person Households | 100 (25.9%) | 66 (17.1%) |
| 3-Person Households | 41 (10.6%) | 8 (2.1%) |
| 4-Person Households | 29 (7.5%) | 0 (0.0%) |
| 5-Person Households | 38 (9.8%) | 0 (0.0%) |
| 6-Person Households | 0 (0.0%) | 0 (0.0%) |
| 7+ Person Households | 0 (0.0%) | 0 (0.0%) |
| Total | 208 (53.9%) | 178 (46.1%) |
Female Fertility in Minturn
Fertility by Age in Minturn
| Age Bracket | Women with Births | Births / 1,000 Women |
| 15 to 19 years | 0 (0.0%) | 0.0 |
| 20 to 34 years | 0 (0.0%) | 0.0 |
| 35 to 50 years | 0 (0.0%) | 0.0 |
| Total | 0 (0.0%) | 0.0 |
Fertility by Age by Marriage Status in Minturn
| Age Bracket | Married | Unmarried |
| 15 to 19 years | 0 (0.0%) | 0 (0.0%) |
| 20 to 34 years | 0 (0.0%) | 0 (0.0%) |
| 35 to 50 years | 0 (0.0%) | 0 (0.0%) |
| Total | 0 (0.0%) | 0 (0.0%) |
Fertility by Education in Minturn
| Educational Attainment | Women with Births | Births / 1,000 Women |
| Less than High School | 0 (0.0%) | 0.0 |
| High School Diploma | 0 (0.0%) | 0.0 |
| College or Associate's Degree | 0 (0.0%) | 0.0 |
| Bachelor's Degree | 0 (0.0%) | 0.0 |
| Graduate Degree | 0 (0.0%) | 0.0 |
| Total | 0 (0.0%) | 0.0 |
Fertility by Education by Marriage Status in Minturn
| Educational Attainment | Married | Unmarried |
| Less than High School | 0 (0.0%) | 0 (0.0%) |
| High School Diploma | 0 (0.0%) | 0 (0.0%) |
| College or Associate's Degree | 0 (0.0%) | 0 (0.0%) |
| Bachelor's Degree | 0 (0.0%) | 0 (0.0%) |
| Graduate Degree | 0 (0.0%) | 0 (0.0%) |
| Total | 0 (0.0%) | 0 (0.0%) |
Employment Characteristics in Minturn
Employment by Class of Employer in Minturn
Among the 591 employed individuals in Minturn, private company employees (405 | 68.5%), local government employees (76 | 12.9%), and self-employed (incorporated) (59 | 10.0%) make up the most common classes of employment.
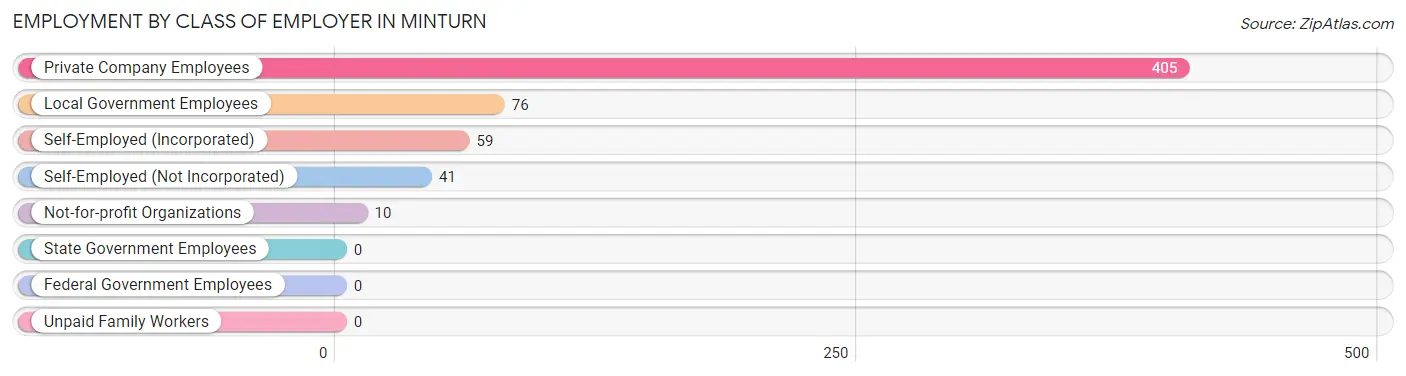
| Employer Class | # Employees | % Employees |
| Private Company Employees | 405 | 68.5% |
| Self-Employed (Incorporated) | 59 | 10.0% |
| Self-Employed (Not Incorporated) | 41 | 6.9% |
| Not-for-profit Organizations | 10 | 1.7% |
| Local Government Employees | 76 | 12.9% |
| State Government Employees | 0 | 0.0% |
| Federal Government Employees | 0 | 0.0% |
| Unpaid Family Workers | 0 | 0.0% |
| Total | 591 | 100.0% |
Employment Status by Age in Minturn
According to the labor force statistics for Minturn, out of the total population over 16 years of age (795), 81.1% or 645 individuals are in the labor force, with 5.9% or 38 of them unemployed. The age group with the highest labor force participation rate is 25 to 29 years, with 100.0% or 177 individuals in the labor force. Within the labor force, the 45 to 54 years age range has the highest percentage of unemployed individuals, with 21.1% or 38 of them being unemployed.
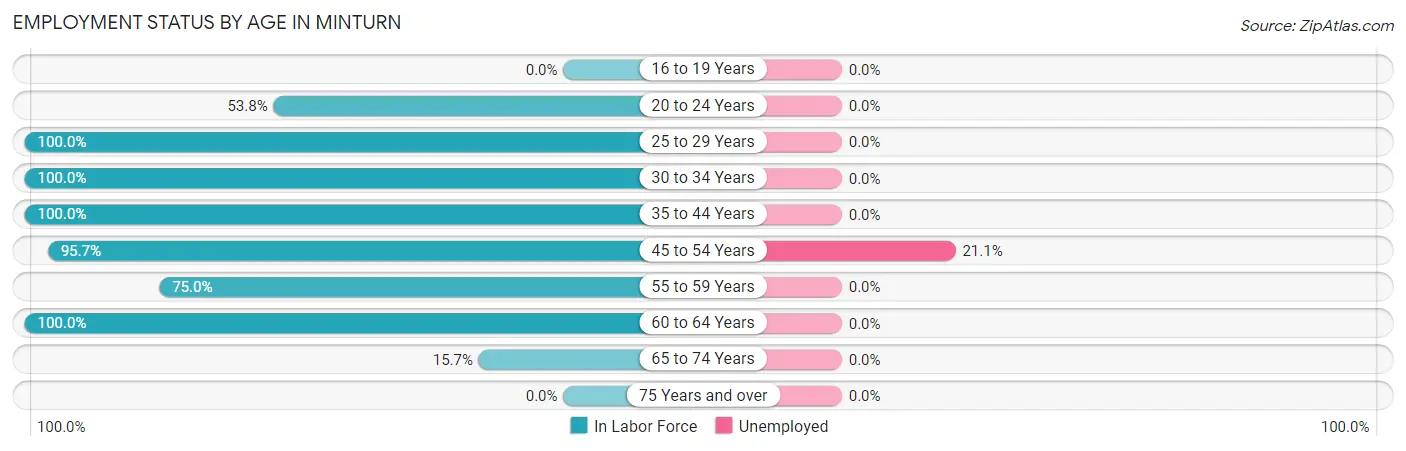
| Age Bracket | In Labor Force | Unemployed |
| 16 to 19 Years | 0 (0.0%) | 0 (0.0%) |
| 20 to 24 Years | 7 (53.8%) | 0 (0.0%) |
| 25 to 29 Years | 177 (100.0%) | 0 (0.0%) |
| 30 to 34 Years | 90 (100.0%) | 0 (0.0%) |
| 35 to 44 Years | 111 (100.0%) | 0 (0.0%) |
| 45 to 54 Years | 180 (95.7%) | 38 (21.1%) |
| 55 to 59 Years | 30 (75.0%) | 0 (0.0%) |
| 60 to 64 Years | 30 (100.0%) | 0 (0.0%) |
| 65 to 74 Years | 20 (15.7%) | 0 (0.0%) |
| 75 Years and over | 0 (0.0%) | 0 (0.0%) |
| Total | 645 (81.1%) | 38 (5.9%) |
Employment Status by Educational Attainment in Minturn
According to labor force statistics for Minturn, 97.2% of individuals (618) out of the total population between 25 and 64 years of age (636) are in the labor force, with 6.1% or 38 of them being unemployed. The group with the highest labor force participation rate are those with the educational attainment of less than high school, with 100.0% or 5 individuals in the labor force. Within the labor force, individuals with bachelor's degree or higher education have the highest percentage of unemployment, with 10.0% or 38 of them being unemployed.
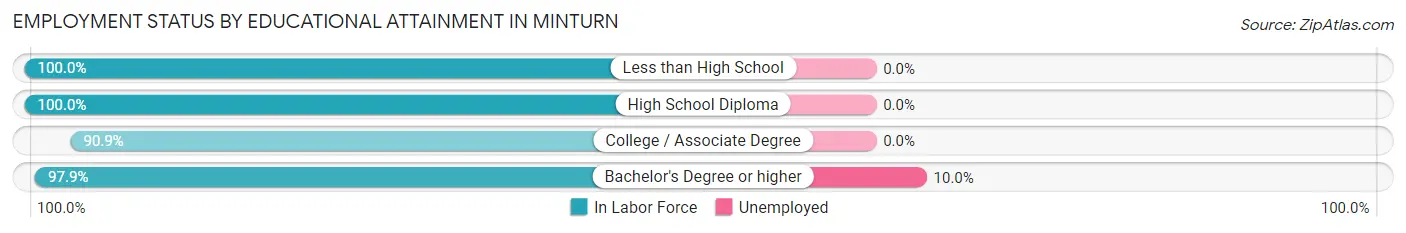
| Educational Attainment | In Labor Force | Unemployed |
| Less than High School | 5 (100.0%) | 0 (0.0%) |
| High School Diploma | 134 (100.0%) | 0 (0.0%) |
| College / Associate Degree | 100 (90.9%) | 0 (0.0%) |
| Bachelor's Degree or higher | 379 (97.9%) | 39 (10.0%) |
| Total | 618 (97.2%) | 39 (6.1%) |
Employment Occupations by Sex in Minturn
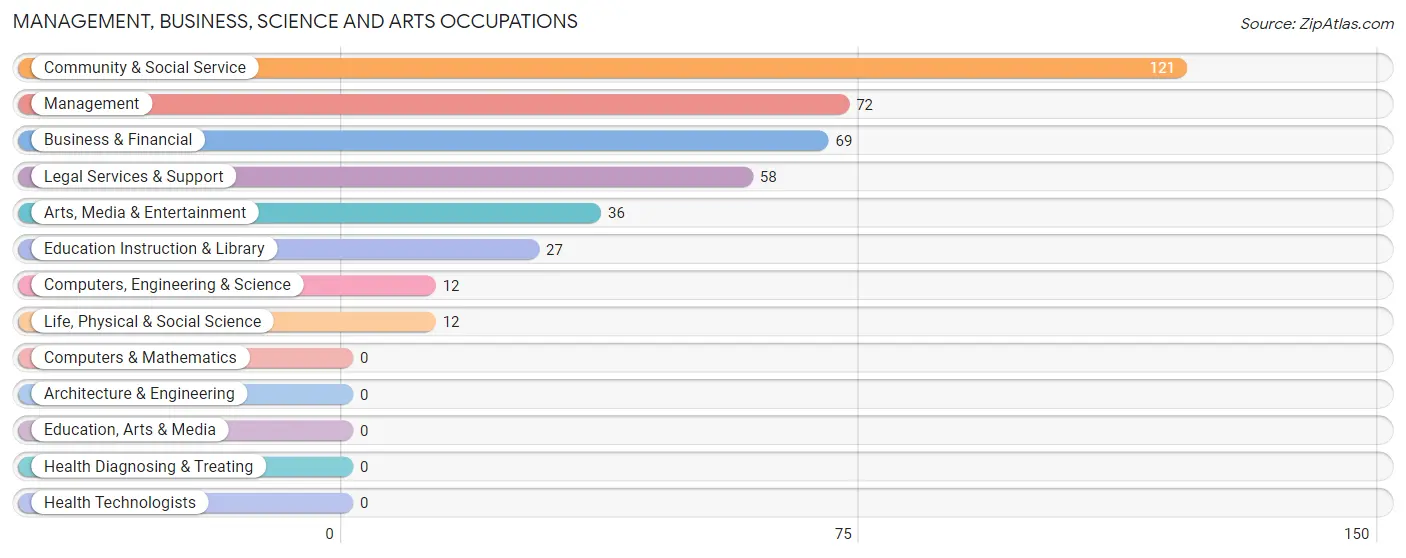
Management, Business, Science and Arts Occupations
The most common Management, Business, Science and Arts occupations in Minturn are Community & Social Service (121 | 19.9%), Management (72 | 11.9%), Business & Financial (69 | 11.4%), Legal Services & Support (58 | 9.6%), and Arts, Media & Entertainment (36 | 5.9%).
Management, Business, Science and Arts Occupations by Sex
Within the Management, Business, Science and Arts occupations in Minturn, the most male-oriented occupations are Computers, Engineering & Science (100.0%), Life, Physical & Social Science (100.0%), and Business & Financial (78.3%), while the most female-oriented occupations are Education Instruction & Library (100.0%), Arts, Media & Entertainment (100.0%), and Community & Social Service (91.7%).
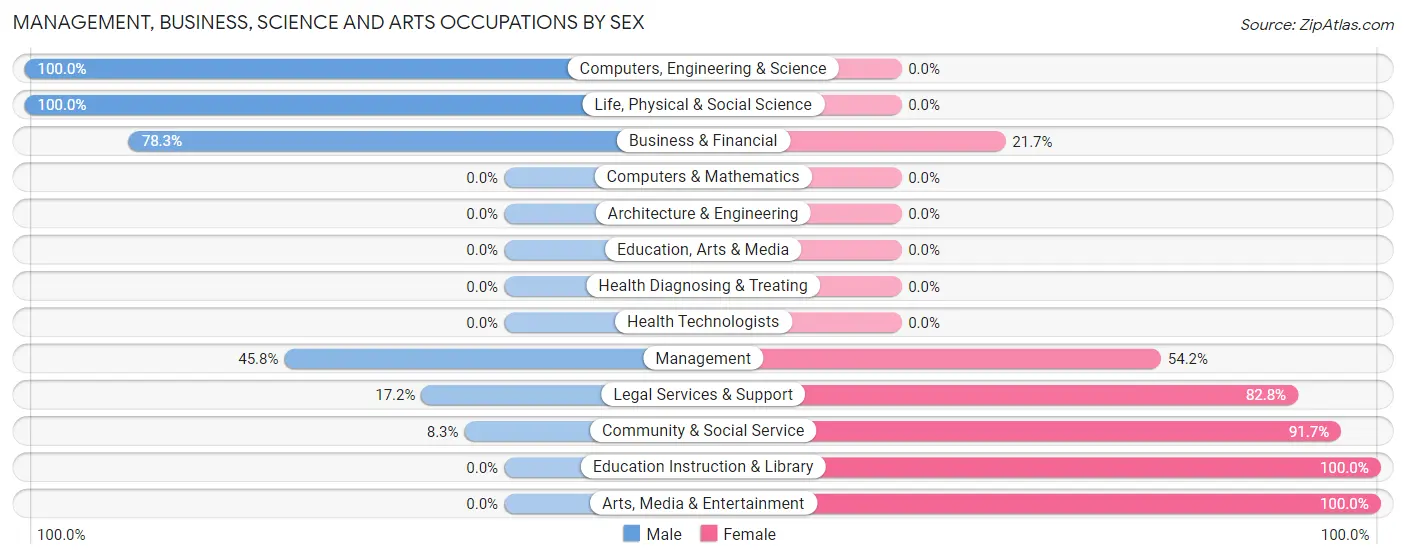
| Occupation | Male | Female |
| Management | 33 (45.8%) | 39 (54.2%) |
| Business & Financial | 54 (78.3%) | 15 (21.7%) |
| Computers, Engineering & Science | 12 (100.0%) | 0 (0.0%) |
| Computers & Mathematics | 0 (0.0%) | 0 (0.0%) |
| Architecture & Engineering | 0 (0.0%) | 0 (0.0%) |
| Life, Physical & Social Science | 12 (100.0%) | 0 (0.0%) |
| Community & Social Service | 10 (8.3%) | 111 (91.7%) |
| Education, Arts & Media | 0 (0.0%) | 0 (0.0%) |
| Legal Services & Support | 10 (17.2%) | 48 (82.8%) |
| Education Instruction & Library | 0 (0.0%) | 27 (100.0%) |
| Arts, Media & Entertainment | 0 (0.0%) | 36 (100.0%) |
| Health Diagnosing & Treating | 0 (0.0%) | 0 (0.0%) |
| Health Technologists | 0 (0.0%) | 0 (0.0%) |
| Total (Category) | 109 (39.8%) | 165 (60.2%) |
| Total (Overall) | 292 (48.1%) | 315 (51.9%) |
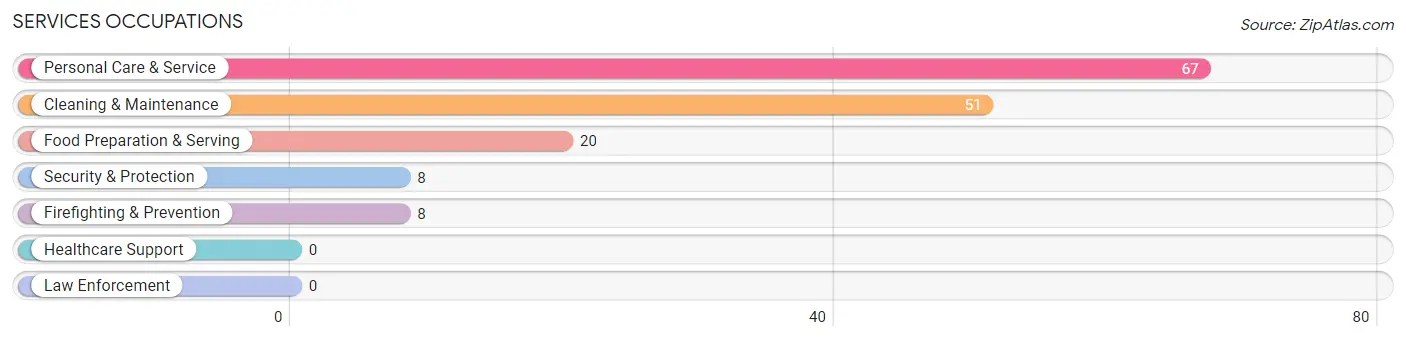
Services Occupations
The most common Services occupations in Minturn are Personal Care & Service (67 | 11.0%), Cleaning & Maintenance (51 | 8.4%), Food Preparation & Serving (20 | 3.3%), Security & Protection (8 | 1.3%), and Firefighting & Prevention (8 | 1.3%).
Services Occupations by Sex
Within the Services occupations in Minturn, the most male-oriented occupations are Security & Protection (100.0%), Firefighting & Prevention (100.0%), and Food Preparation & Serving (100.0%), while the most female-oriented occupations are Cleaning & Maintenance (29.4%), and Personal Care & Service (17.9%).
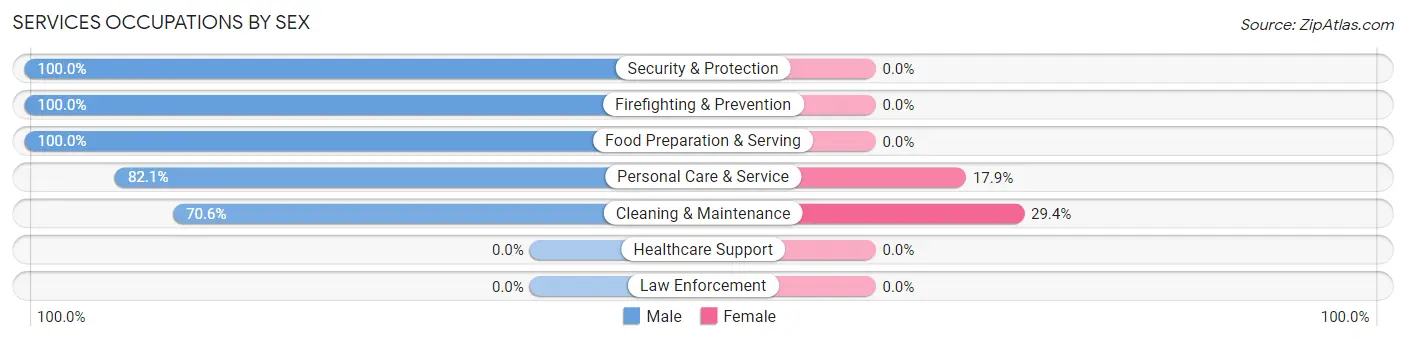
| Occupation | Male | Female |
| Healthcare Support | 0 (0.0%) | 0 (0.0%) |
| Security & Protection | 8 (100.0%) | 0 (0.0%) |
| Firefighting & Prevention | 8 (100.0%) | 0 (0.0%) |
| Law Enforcement | 0 (0.0%) | 0 (0.0%) |
| Food Preparation & Serving | 20 (100.0%) | 0 (0.0%) |
| Cleaning & Maintenance | 36 (70.6%) | 15 (29.4%) |
| Personal Care & Service | 55 (82.1%) | 12 (17.9%) |
| Total (Category) | 119 (81.5%) | 27 (18.5%) |
| Total (Overall) | 292 (48.1%) | 315 (51.9%) |
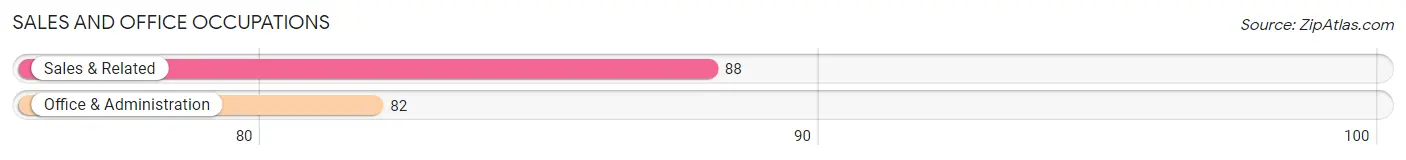
Sales and Office Occupations
The most common Sales and Office occupations in Minturn are Sales & Related (88 | 14.5%), and Office & Administration (82 | 13.5%).
Sales and Office Occupations by Sex
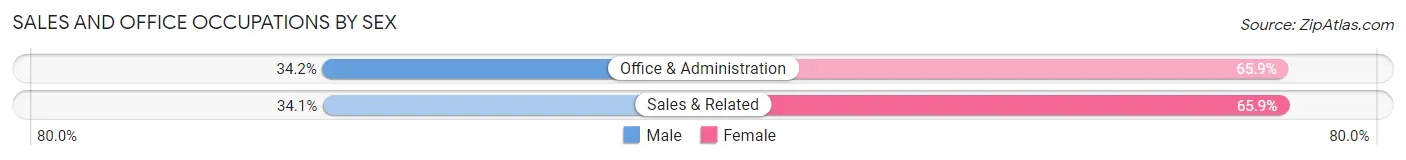
| Occupation | Male | Female |
| Sales & Related | 30 (34.1%) | 58 (65.9%) |
| Office & Administration | 28 (34.2%) | 54 (65.8%) |
| Total (Category) | 58 (34.1%) | 112 (65.9%) |
| Total (Overall) | 292 (48.1%) | 315 (51.9%) |
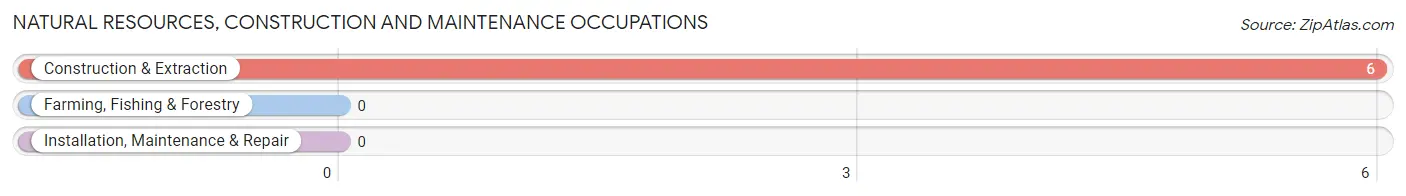
Natural Resources, Construction and Maintenance Occupations
The most common Natural Resources, Construction and Maintenance occupations in Minturn are , and Construction & Extraction (6 | 1.0%).
Natural Resources, Construction and Maintenance Occupations by Sex
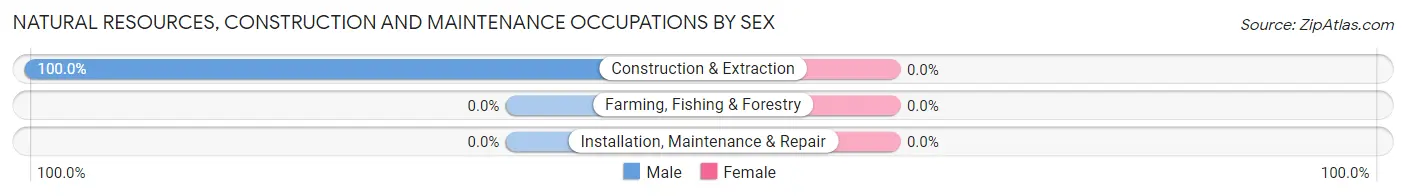
| Occupation | Male | Female |
| Farming, Fishing & Forestry | 0 (0.0%) | 0 (0.0%) |
| Construction & Extraction | 6 (100.0%) | 0 (0.0%) |
| Installation, Maintenance & Repair | 0 (0.0%) | 0 (0.0%) |
| Total (Category) | 6 (100.0%) | 0 (0.0%) |
| Total (Overall) | 292 (48.1%) | 315 (51.9%) |
Production, Transportation and Moving Occupations
The most common Production, Transportation and Moving occupations in Minturn are , and Transportation (11 | 1.8%).
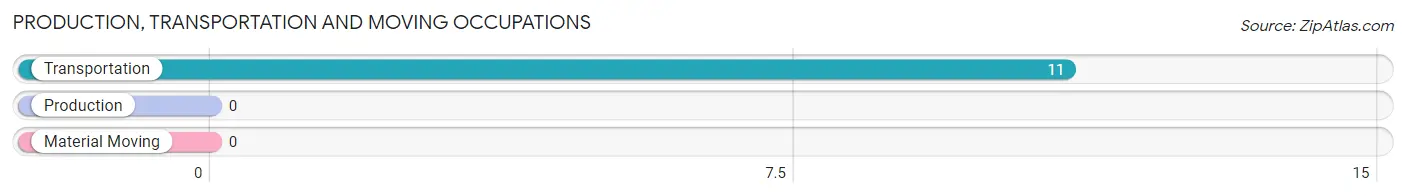
Production, Transportation and Moving Occupations by Sex
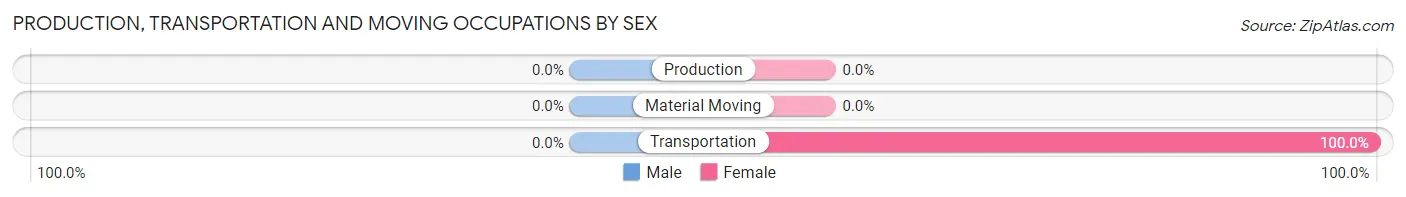
| Occupation | Male | Female |
| Production | 0 (0.0%) | 0 (0.0%) |
| Transportation | 0 (0.0%) | 11 (100.0%) |
| Material Moving | 0 (0.0%) | 0 (0.0%) |
| Total (Category) | 0 (0.0%) | 11 (100.0%) |
| Total (Overall) | 292 (48.1%) | 315 (51.9%) |
Employment Industries by Sex in Minturn
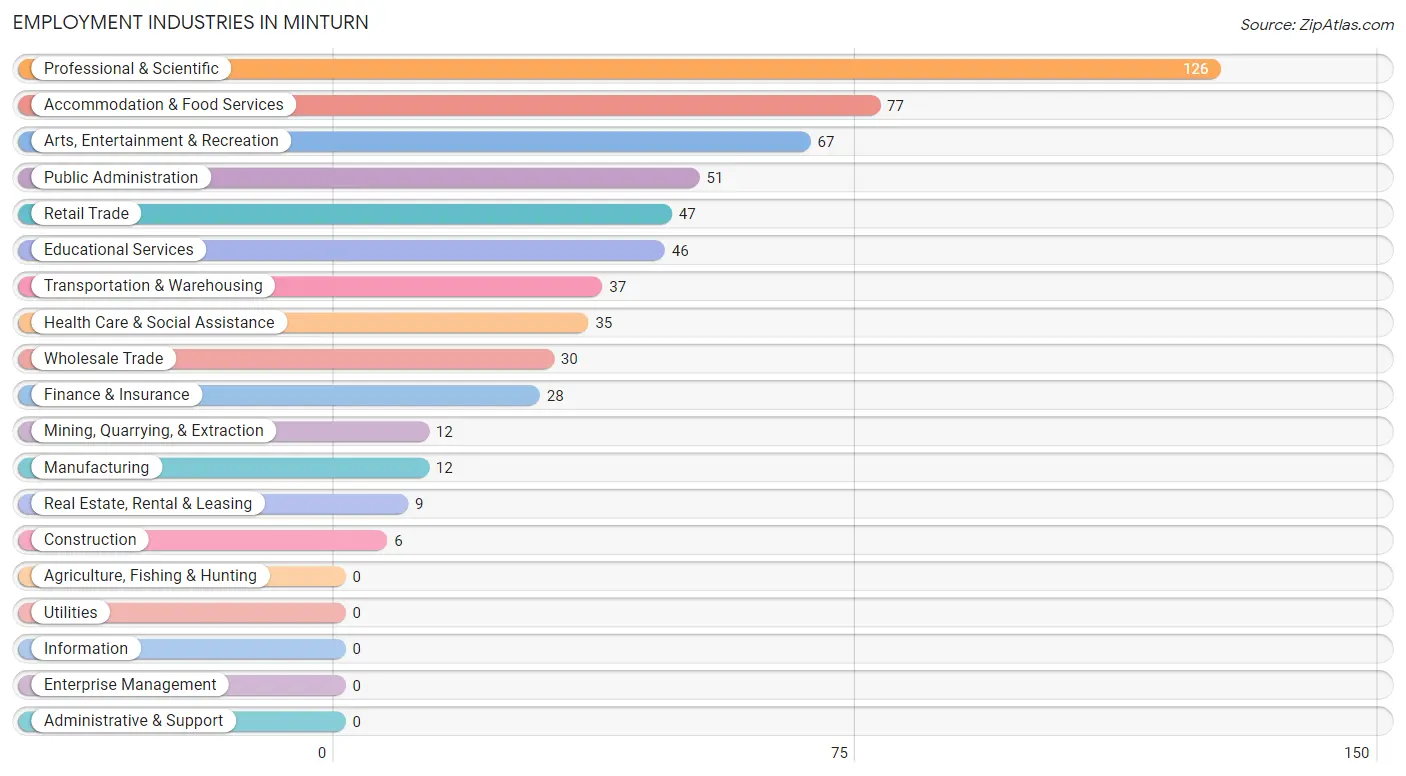
Employment Industries in Minturn
The major employment industries in Minturn include Professional & Scientific (126 | 20.8%), Accommodation & Food Services (77 | 12.7%), Arts, Entertainment & Recreation (67 | 11.0%), Public Administration (51 | 8.4%), and Retail Trade (47 | 7.7%).
Employment Industries by Sex in Minturn
The Minturn industries that see more men than women are Mining, Quarrying, & Extraction (100.0%), Construction (100.0%), and Manufacturing (100.0%), whereas the industries that tend to have a higher number of women are Retail Trade (100.0%), Real Estate, Rental & Leasing (100.0%), and Educational Services (100.0%).
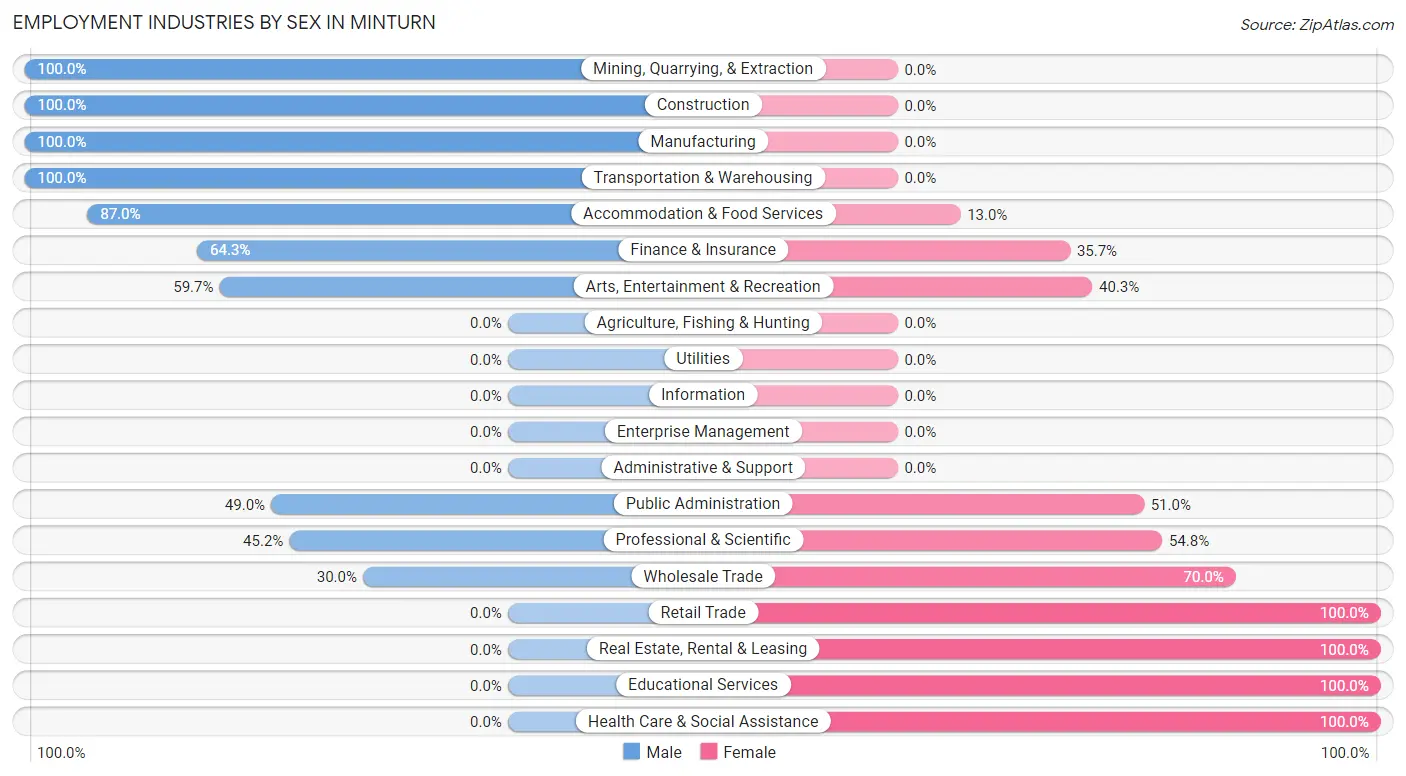
| Industry | Male | Female |
| Agriculture, Fishing & Hunting | 0 (0.0%) | 0 (0.0%) |
| Mining, Quarrying, & Extraction | 12 (100.0%) | 0 (0.0%) |
| Construction | 6 (100.0%) | 0 (0.0%) |
| Manufacturing | 12 (100.0%) | 0 (0.0%) |
| Wholesale Trade | 9 (30.0%) | 21 (70.0%) |
| Retail Trade | 0 (0.0%) | 47 (100.0%) |
| Transportation & Warehousing | 37 (100.0%) | 0 (0.0%) |
| Utilities | 0 (0.0%) | 0 (0.0%) |
| Information | 0 (0.0%) | 0 (0.0%) |
| Finance & Insurance | 18 (64.3%) | 10 (35.7%) |
| Real Estate, Rental & Leasing | 0 (0.0%) | 9 (100.0%) |
| Professional & Scientific | 57 (45.2%) | 69 (54.8%) |
| Enterprise Management | 0 (0.0%) | 0 (0.0%) |
| Administrative & Support | 0 (0.0%) | 0 (0.0%) |
| Educational Services | 0 (0.0%) | 46 (100.0%) |
| Health Care & Social Assistance | 0 (0.0%) | 35 (100.0%) |
| Arts, Entertainment & Recreation | 40 (59.7%) | 27 (40.3%) |
| Accommodation & Food Services | 67 (87.0%) | 10 (13.0%) |
| Public Administration | 25 (49.0%) | 26 (51.0%) |
| Total | 292 (48.1%) | 315 (51.9%) |
Education in Minturn
School Enrollment in Minturn
The most common levels of schooling among the 206 students in Minturn are elementary school (90 | 43.7%), middle school (66 | 32.0%), and graduate / professional (19 | 9.2%).
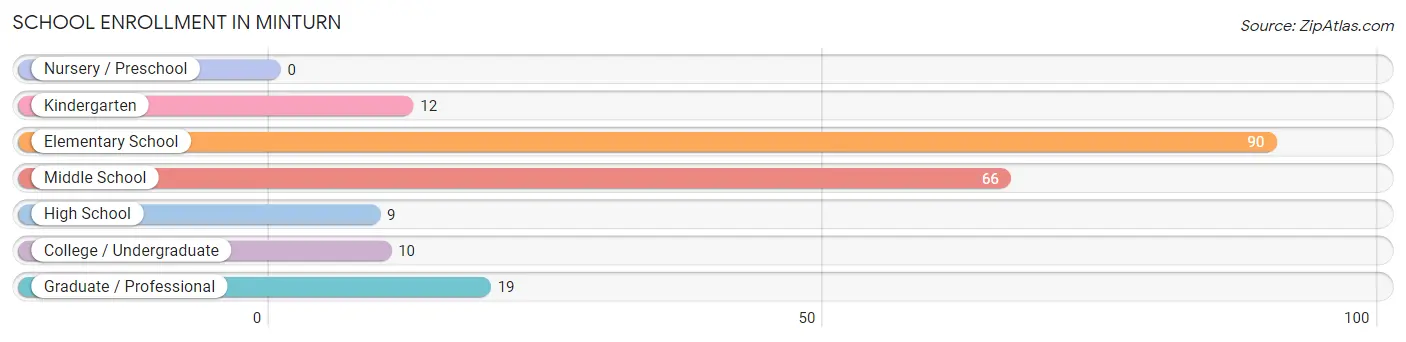
| School Level | # Students | % Students |
| Nursery / Preschool | 0 | 0.0% |
| Kindergarten | 12 | 5.8% |
| Elementary School | 90 | 43.7% |
| Middle School | 66 | 32.0% |
| High School | 9 | 4.4% |
| College / Undergraduate | 10 | 4.9% |
| Graduate / Professional | 19 | 9.2% |
| Total | 206 | 100.0% |
School Enrollment by Age by Funding Source in Minturn
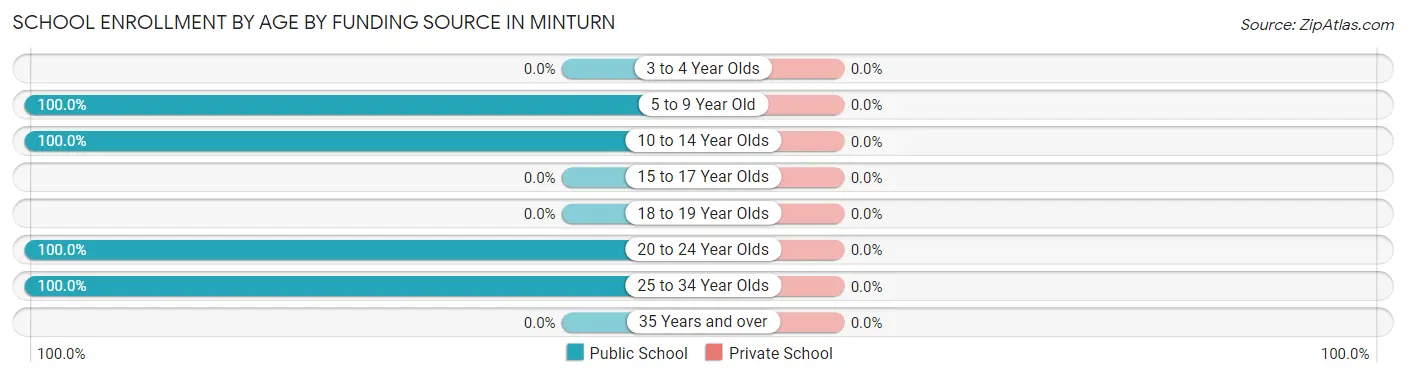
| Age Bracket | Public School | Private School |
| 3 to 4 Year Olds | 0 (0.0%) | 0 (0.0%) |
| 5 to 9 Year Old | 99 (100.0%) | 0 (0.0%) |
| 10 to 14 Year Olds | 78 (100.0%) | 0 (0.0%) |
| 15 to 17 Year Olds | 0 (0.0%) | 0 (0.0%) |
| 18 to 19 Year Olds | 0 (0.0%) | 0 (0.0%) |
| 20 to 24 Year Olds | 7 (100.0%) | 0 (0.0%) |
| 25 to 34 Year Olds | 22 (100.0%) | 0 (0.0%) |
| 35 Years and over | 0 (0.0%) | 0 (0.0%) |
| Total | 206 (100.0%) | 0 (0.0%) |
Educational Attainment by Field of Study in Minturn
Social sciences (124 | 25.8%), business (72 | 15.0%), communications (69 | 14.3%), psychology (47 | 9.8%), and education (26 | 5.4%) are the most common fields of study among 481 individuals in Minturn who have obtained a bachelor's degree or higher.
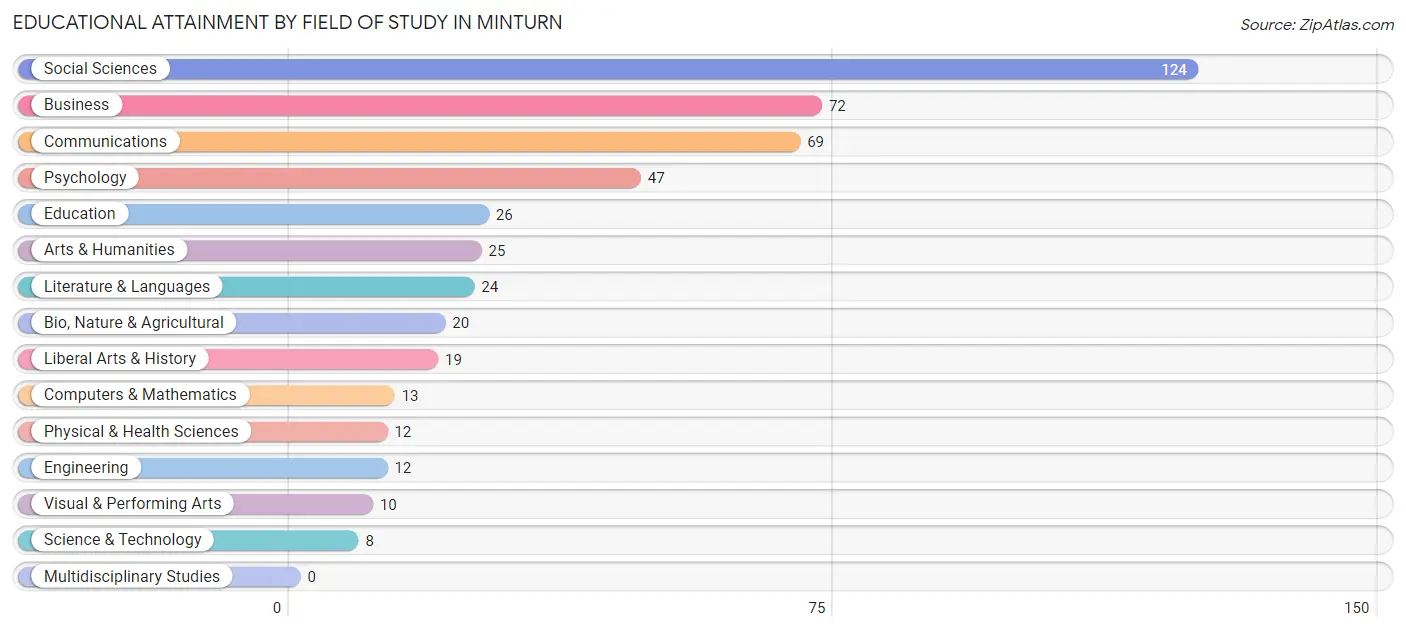
| Field of Study | # Graduates | % Graduates |
| Computers & Mathematics | 13 | 2.7% |
| Bio, Nature & Agricultural | 20 | 4.2% |
| Physical & Health Sciences | 12 | 2.5% |
| Psychology | 47 | 9.8% |
| Social Sciences | 124 | 25.8% |
| Engineering | 12 | 2.5% |
| Multidisciplinary Studies | 0 | 0.0% |
| Science & Technology | 8 | 1.7% |
| Business | 72 | 15.0% |
| Education | 26 | 5.4% |
| Literature & Languages | 24 | 5.0% |
| Liberal Arts & History | 19 | 4.0% |
| Visual & Performing Arts | 10 | 2.1% |
| Communications | 69 | 14.3% |
| Arts & Humanities | 25 | 5.2% |
| Total | 481 | 100.0% |
Transportation & Commute in Minturn
Vehicle Availability by Sex in Minturn
The most prevalent vehicle ownership categories in Minturn are males with 2 vehicles (149, accounting for 51.0%) and females with 2 vehicles (196, making up 49.8%).
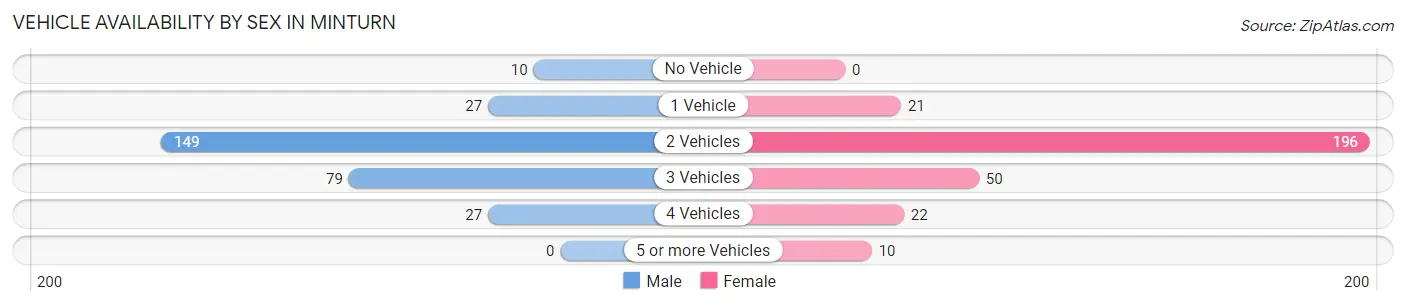
| Vehicles Available | Male | Female |
| No Vehicle | 10 (3.4%) | 0 (0.0%) |
| 1 Vehicle | 27 (9.2%) | 21 (7.0%) |
| 2 Vehicles | 149 (51.0%) | 196 (65.5%) |
| 3 Vehicles | 79 (27.1%) | 50 (16.7%) |
| 4 Vehicles | 27 (9.2%) | 22 (7.4%) |
| 5 or more Vehicles | 0 (0.0%) | 10 (3.3%) |
| Total | 292 (100.0%) | 299 (100.0%) |
Commute Time in Minturn
The most frequently occuring commute durations in Minturn are 15 to 19 minutes (219 commuters, 40.7%), 20 to 24 minutes (86 commuters, 16.0%), and 10 to 14 minutes (81 commuters, 15.1%).
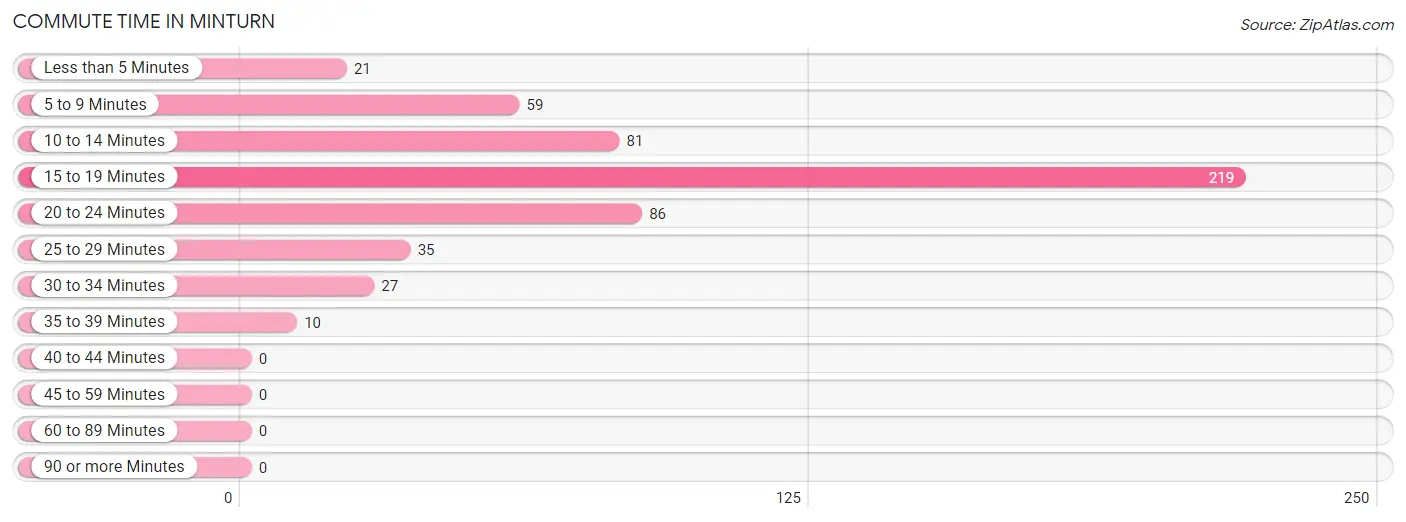
| Commute Time | # Commuters | % Commuters |
| Less than 5 Minutes | 21 | 3.9% |
| 5 to 9 Minutes | 59 | 11.0% |
| 10 to 14 Minutes | 81 | 15.1% |
| 15 to 19 Minutes | 219 | 40.7% |
| 20 to 24 Minutes | 86 | 16.0% |
| 25 to 29 Minutes | 35 | 6.5% |
| 30 to 34 Minutes | 27 | 5.0% |
| 35 to 39 Minutes | 10 | 1.9% |
| 40 to 44 Minutes | 0 | 0.0% |
| 45 to 59 Minutes | 0 | 0.0% |
| 60 to 89 Minutes | 0 | 0.0% |
| 90 or more Minutes | 0 | 0.0% |
Commute Time by Sex in Minturn
The most common commute times in Minturn are 10 to 14 minutes (71 commuters, 26.3%) for males and 15 to 19 minutes (148 commuters, 55.2%) for females.
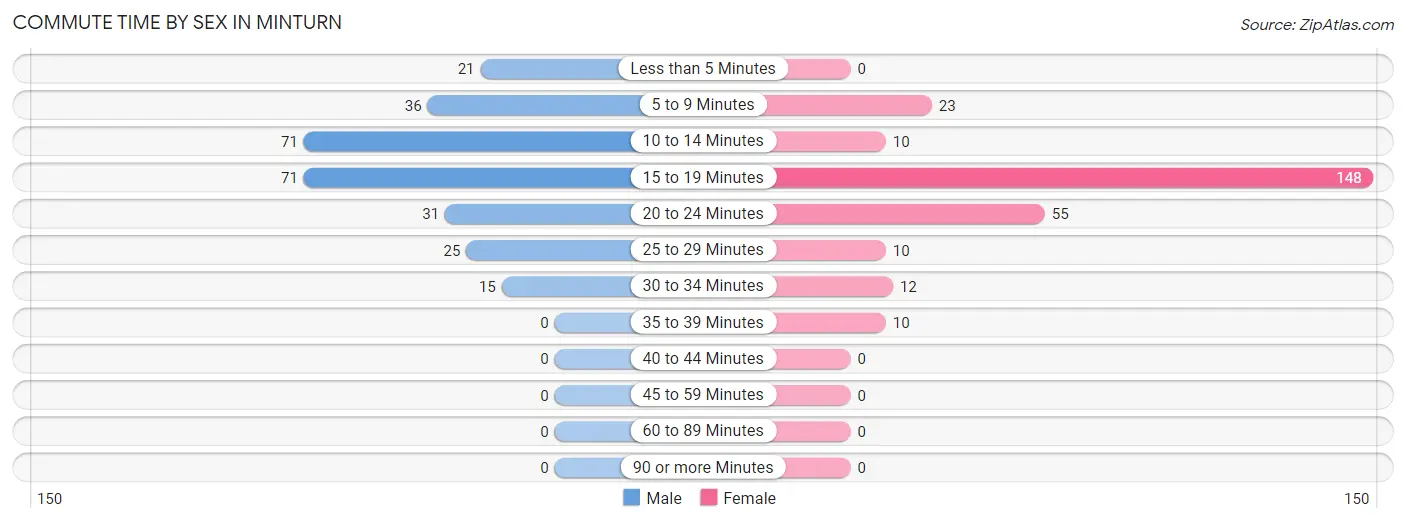
| Commute Time | Male | Female |
| Less than 5 Minutes | 21 (7.8%) | 0 (0.0%) |
| 5 to 9 Minutes | 36 (13.3%) | 23 (8.6%) |
| 10 to 14 Minutes | 71 (26.3%) | 10 (3.7%) |
| 15 to 19 Minutes | 71 (26.3%) | 148 (55.2%) |
| 20 to 24 Minutes | 31 (11.5%) | 55 (20.5%) |
| 25 to 29 Minutes | 25 (9.3%) | 10 (3.7%) |
| 30 to 34 Minutes | 15 (5.6%) | 12 (4.5%) |
| 35 to 39 Minutes | 0 (0.0%) | 10 (3.7%) |
| 40 to 44 Minutes | 0 (0.0%) | 0 (0.0%) |
| 45 to 59 Minutes | 0 (0.0%) | 0 (0.0%) |
| 60 to 89 Minutes | 0 (0.0%) | 0 (0.0%) |
| 90 or more Minutes | 0 (0.0%) | 0 (0.0%) |
Time of Departure to Work by Sex in Minturn
The most frequent times of departure to work in Minturn are 8:00 AM to 8:29 AM (60, 22.2%) for males and 8:30 AM to 8:59 AM (94, 35.1%) for females.
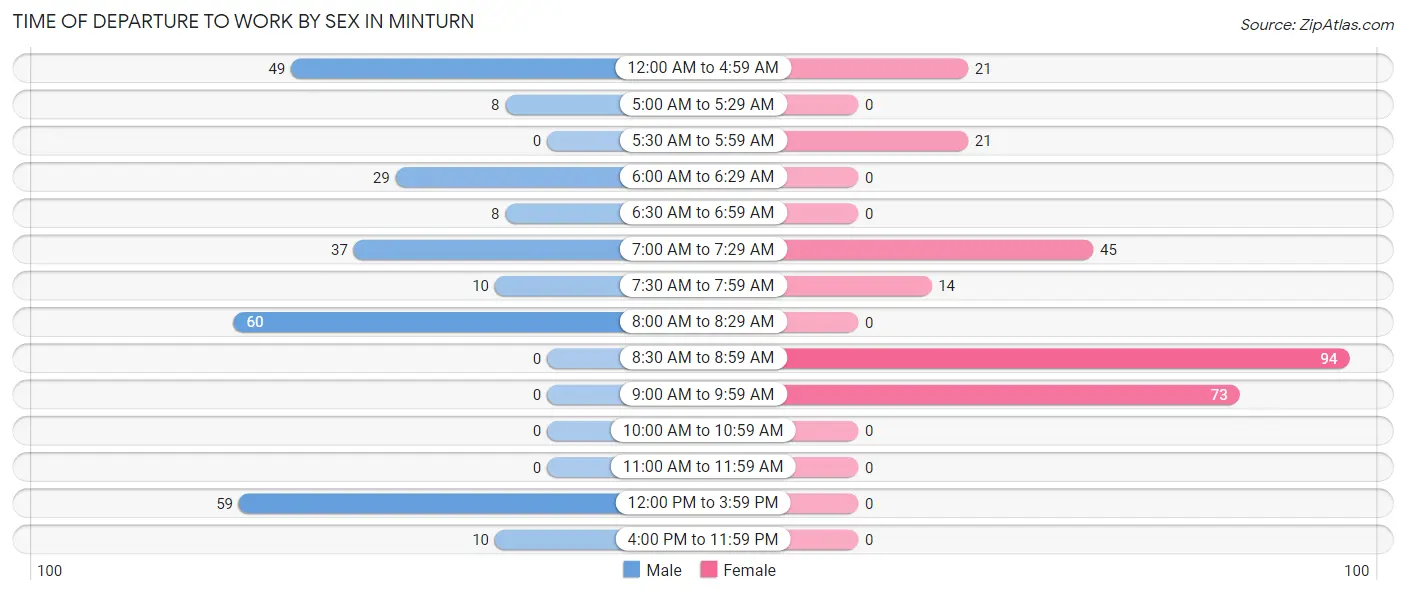
| Time of Departure | Male | Female |
| 12:00 AM to 4:59 AM | 49 (18.1%) | 21 (7.8%) |
| 5:00 AM to 5:29 AM | 8 (3.0%) | 0 (0.0%) |
| 5:30 AM to 5:59 AM | 0 (0.0%) | 21 (7.8%) |
| 6:00 AM to 6:29 AM | 29 (10.7%) | 0 (0.0%) |
| 6:30 AM to 6:59 AM | 8 (3.0%) | 0 (0.0%) |
| 7:00 AM to 7:29 AM | 37 (13.7%) | 45 (16.8%) |
| 7:30 AM to 7:59 AM | 10 (3.7%) | 14 (5.2%) |
| 8:00 AM to 8:29 AM | 60 (22.2%) | 0 (0.0%) |
| 8:30 AM to 8:59 AM | 0 (0.0%) | 94 (35.1%) |
| 9:00 AM to 9:59 AM | 0 (0.0%) | 73 (27.2%) |
| 10:00 AM to 10:59 AM | 0 (0.0%) | 0 (0.0%) |
| 11:00 AM to 11:59 AM | 0 (0.0%) | 0 (0.0%) |
| 12:00 PM to 3:59 PM | 59 (21.8%) | 0 (0.0%) |
| 4:00 PM to 11:59 PM | 10 (3.7%) | 0 (0.0%) |
| Total | 270 (100.0%) | 268 (100.0%) |
Housing Occupancy in Minturn
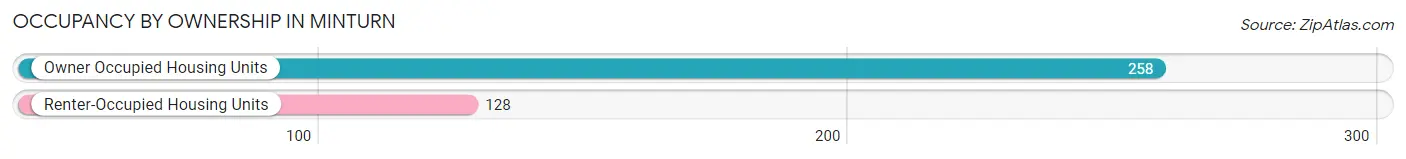
Occupancy by Ownership in Minturn
Of the total 386 dwellings in Minturn, owner-occupied units account for 258 (66.8%), while renter-occupied units make up 128 (33.2%).
| Occupancy | # Housing Units | % Housing Units |
| Owner Occupied Housing Units | 258 | 66.8% |
| Renter-Occupied Housing Units | 128 | 33.2% |
| Total Occupied Housing Units | 386 | 100.0% |
Occupancy by Household Size in Minturn
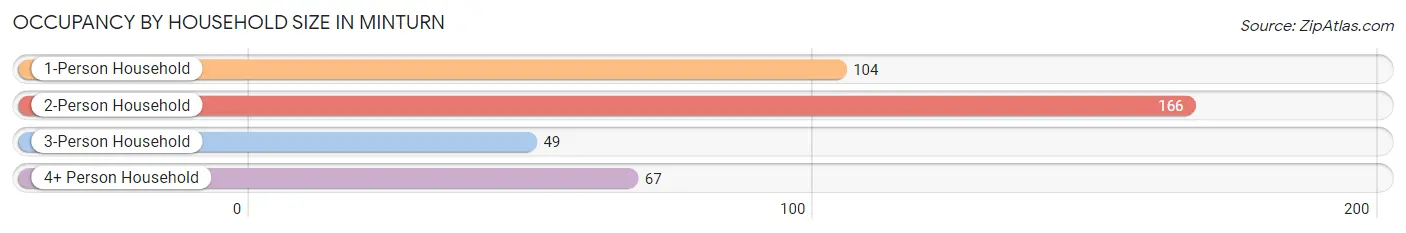
| Household Size | # Housing Units | % Housing Units |
| 1-Person Household | 104 | 26.9% |
| 2-Person Household | 166 | 43.0% |
| 3-Person Household | 49 | 12.7% |
| 4+ Person Household | 67 | 17.4% |
| Total Housing Units | 386 | 100.0% |
Occupancy by Ownership by Household Size in Minturn
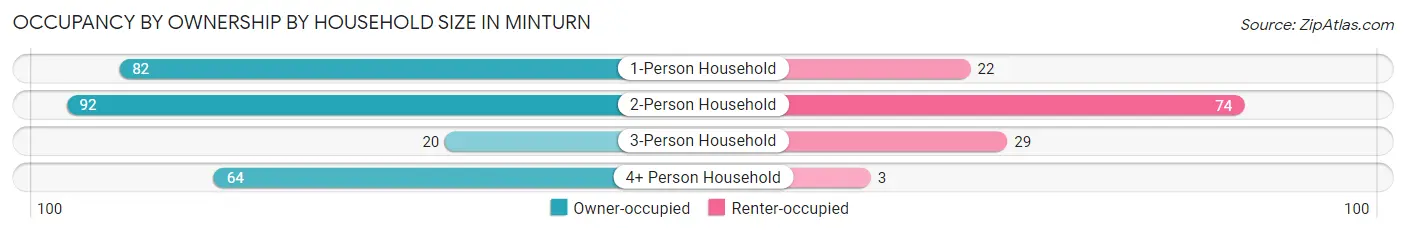
| Household Size | Owner-occupied | Renter-occupied |
| 1-Person Household | 82 (78.8%) | 22 (21.1%) |
| 2-Person Household | 92 (55.4%) | 74 (44.6%) |
| 3-Person Household | 20 (40.8%) | 29 (59.2%) |
| 4+ Person Household | 64 (95.5%) | 3 (4.5%) |
| Total Housing Units | 258 (66.8%) | 128 (33.2%) |
Occupancy by Educational Attainment in Minturn
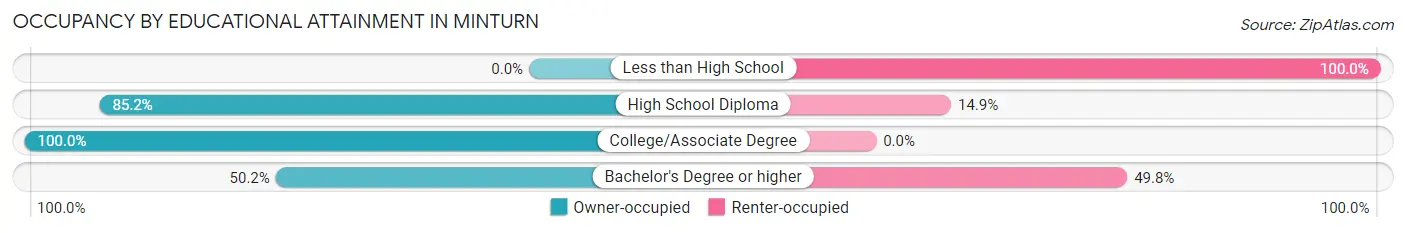
| Household Size | Owner-occupied | Renter-occupied |
| Less than High School | 0 (0.0%) | 3 (100.0%) |
| High School Diploma | 86 (85.2%) | 15 (14.8%) |
| College/Associate Degree | 61 (100.0%) | 0 (0.0%) |
| Bachelor's Degree or higher | 111 (50.2%) | 110 (49.8%) |
Occupancy by Age of Householder in Minturn
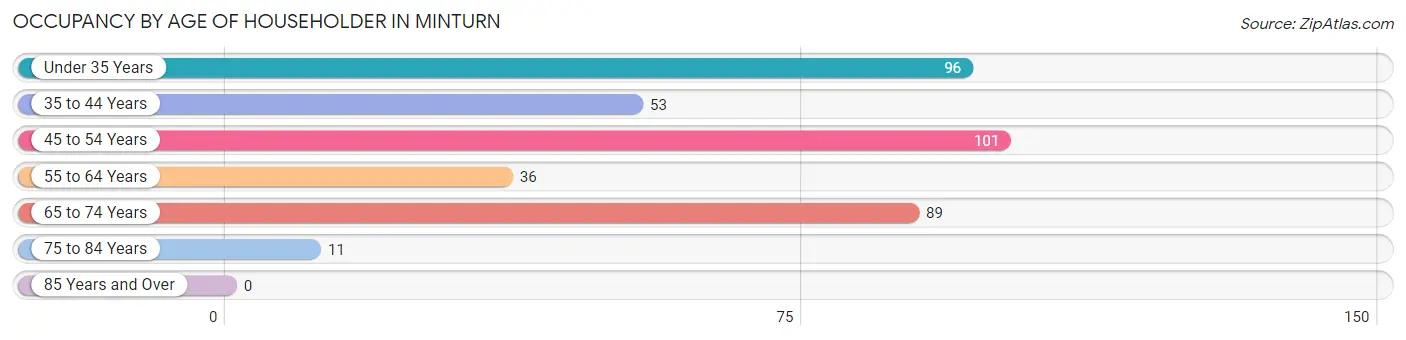
| Age Bracket | # Households | % Households |
| Under 35 Years | 96 | 24.9% |
| 35 to 44 Years | 53 | 13.7% |
| 45 to 54 Years | 101 | 26.2% |
| 55 to 64 Years | 36 | 9.3% |
| 65 to 74 Years | 89 | 23.1% |
| 75 to 84 Years | 11 | 2.9% |
| 85 Years and Over | 0 | 0.0% |
| Total | 386 | 100.0% |
Housing Finances in Minturn
Median Income by Occupancy in Minturn
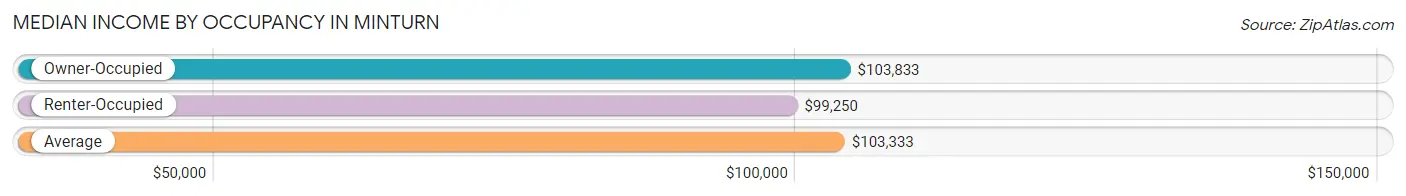
| Occupancy Type | # Households | Median Income |
| Owner-Occupied | 258 (66.8%) | $103,833 |
| Renter-Occupied | 128 (33.2%) | $99,250 |
| Average | 386 (100.0%) | $103,333 |
Occupancy by Householder Income Bracket in Minturn
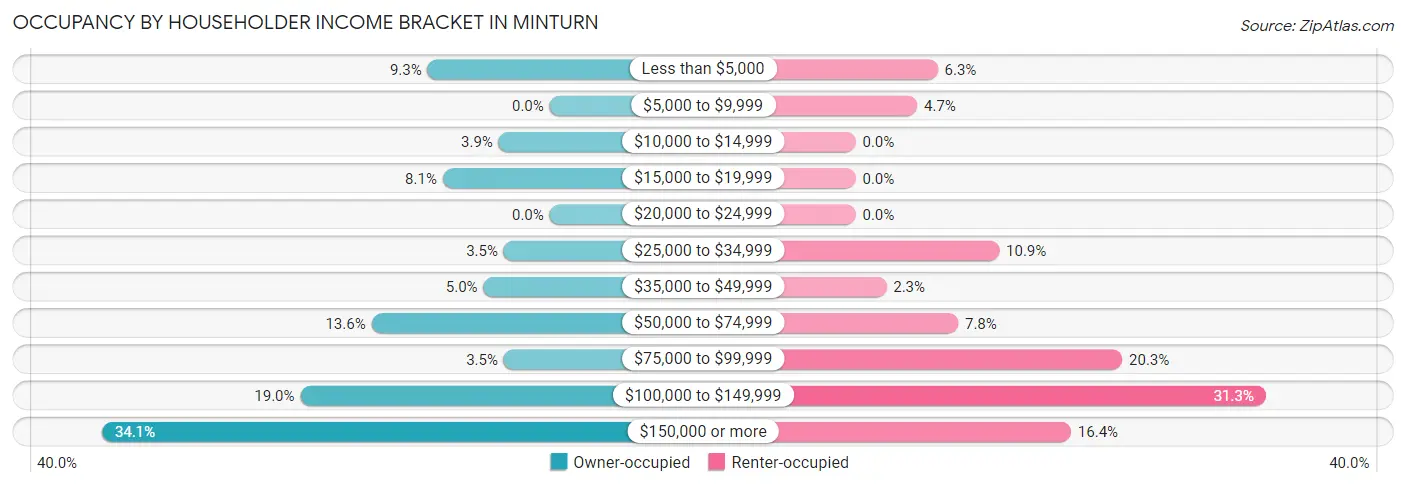
| Income Bracket | Owner-occupied | Renter-occupied |
| Less than $5,000 | 24 (9.3%) | 8 (6.2%) |
| $5,000 to $9,999 | 0 (0.0%) | 6 (4.7%) |
| $10,000 to $14,999 | 10 (3.9%) | 0 (0.0%) |
| $15,000 to $19,999 | 21 (8.1%) | 0 (0.0%) |
| $20,000 to $24,999 | 0 (0.0%) | 0 (0.0%) |
| $25,000 to $34,999 | 9 (3.5%) | 14 (10.9%) |
| $35,000 to $49,999 | 13 (5.0%) | 3 (2.3%) |
| $50,000 to $74,999 | 35 (13.6%) | 10 (7.8%) |
| $75,000 to $99,999 | 9 (3.5%) | 26 (20.3%) |
| $100,000 to $149,999 | 49 (19.0%) | 40 (31.2%) |
| $150,000 or more | 88 (34.1%) | 21 (16.4%) |
| Total | 258 (100.0%) | 128 (100.0%) |
Monthly Housing Cost Tiers in Minturn
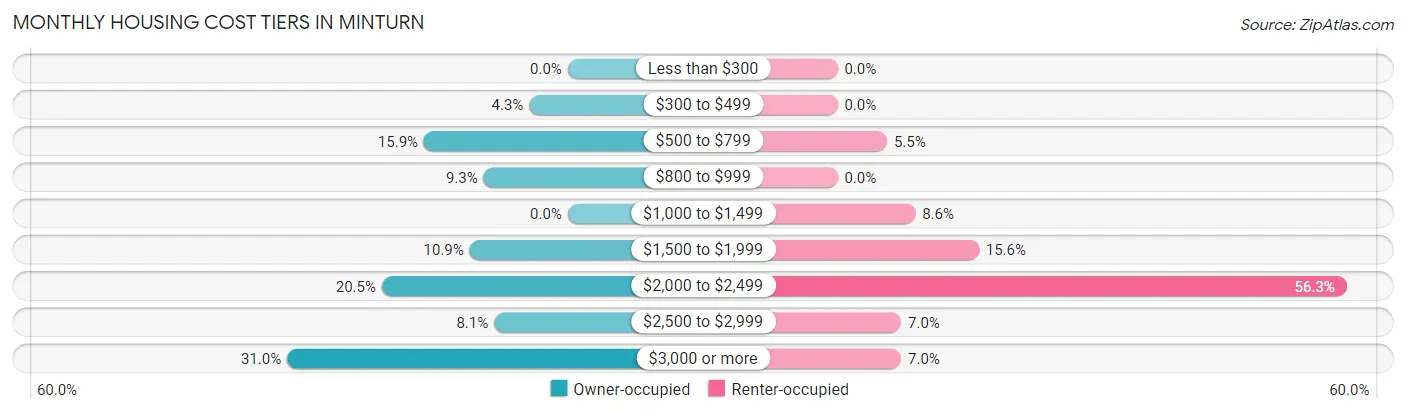
| Monthly Cost | Owner-occupied | Renter-occupied |
| Less than $300 | 0 (0.0%) | 0 (0.0%) |
| $300 to $499 | 11 (4.3%) | 0 (0.0%) |
| $500 to $799 | 41 (15.9%) | 7 (5.5%) |
| $800 to $999 | 24 (9.3%) | 0 (0.0%) |
| $1,000 to $1,499 | 0 (0.0%) | 11 (8.6%) |
| $1,500 to $1,999 | 28 (10.8%) | 20 (15.6%) |
| $2,000 to $2,499 | 53 (20.5%) | 72 (56.2%) |
| $2,500 to $2,999 | 21 (8.1%) | 9 (7.0%) |
| $3,000 or more | 80 (31.0%) | 9 (7.0%) |
| Total | 258 (100.0%) | 128 (100.0%) |
Physical Housing Characteristics in Minturn
Housing Structures in Minturn
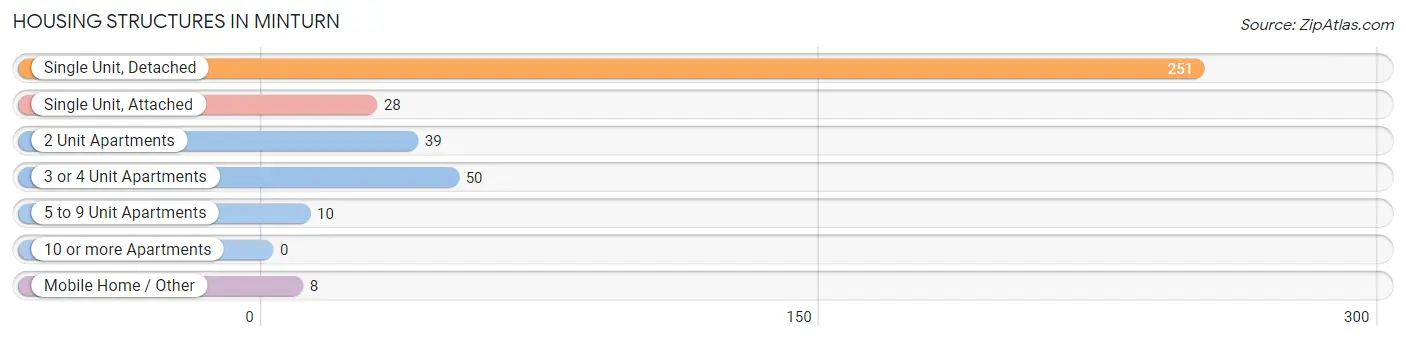
| Structure Type | # Housing Units | % Housing Units |
| Single Unit, Detached | 251 | 65.0% |
| Single Unit, Attached | 28 | 7.2% |
| 2 Unit Apartments | 39 | 10.1% |
| 3 or 4 Unit Apartments | 50 | 13.0% |
| 5 to 9 Unit Apartments | 10 | 2.6% |
| 10 or more Apartments | 0 | 0.0% |
| Mobile Home / Other | 8 | 2.1% |
| Total | 386 | 100.0% |
Housing Structures by Occupancy in Minturn

| Structure Type | Owner-occupied | Renter-occupied |
| Single Unit, Detached | 191 (76.1%) | 60 (23.9%) |
| Single Unit, Attached | 19 (67.9%) | 9 (32.1%) |
| 2 Unit Apartments | 13 (33.3%) | 26 (66.7%) |
| 3 or 4 Unit Apartments | 35 (70.0%) | 15 (30.0%) |
| 5 to 9 Unit Apartments | 0 (0.0%) | 10 (100.0%) |
| 10 or more Apartments | 0 (0.0%) | 0 (0.0%) |
| Mobile Home / Other | 0 (0.0%) | 8 (100.0%) |
| Total | 258 (66.8%) | 128 (33.2%) |
Housing Structures by Number of Rooms in Minturn
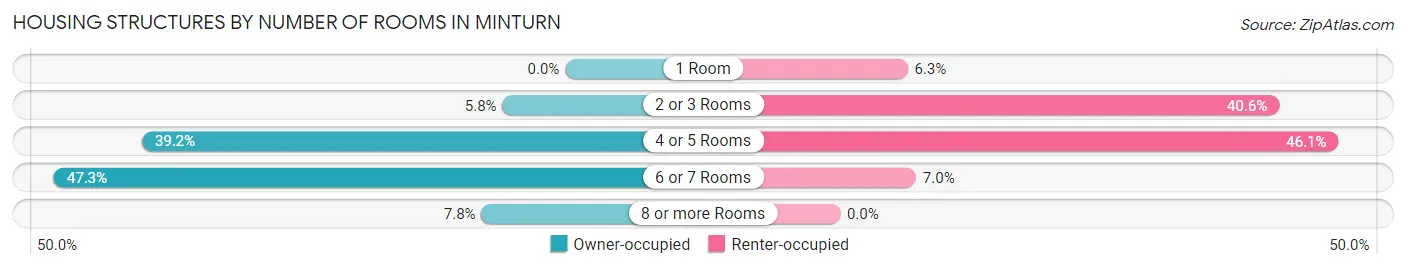
| Number of Rooms | Owner-occupied | Renter-occupied |
| 1 Room | 0 (0.0%) | 8 (6.2%) |
| 2 or 3 Rooms | 15 (5.8%) | 52 (40.6%) |
| 4 or 5 Rooms | 101 (39.2%) | 59 (46.1%) |
| 6 or 7 Rooms | 122 (47.3%) | 9 (7.0%) |
| 8 or more Rooms | 20 (7.7%) | 0 (0.0%) |
| Total | 258 (100.0%) | 128 (100.0%) |
Housing Structure by Heating Type in Minturn
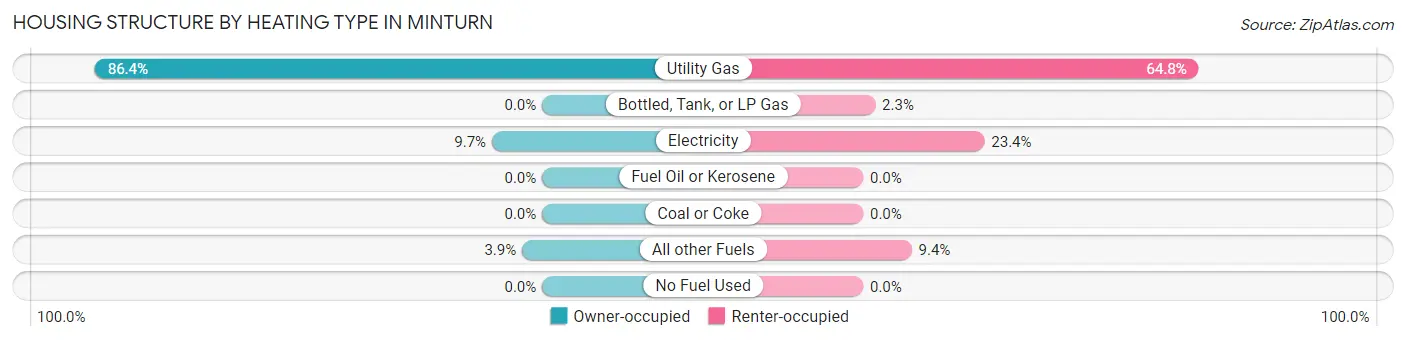
| Heating Type | Owner-occupied | Renter-occupied |
| Utility Gas | 223 (86.4%) | 83 (64.8%) |
| Bottled, Tank, or LP Gas | 0 (0.0%) | 3 (2.3%) |
| Electricity | 25 (9.7%) | 30 (23.4%) |
| Fuel Oil or Kerosene | 0 (0.0%) | 0 (0.0%) |
| Coal or Coke | 0 (0.0%) | 0 (0.0%) |
| All other Fuels | 10 (3.9%) | 12 (9.4%) |
| No Fuel Used | 0 (0.0%) | 0 (0.0%) |
| Total | 258 (100.0%) | 128 (100.0%) |
Household Vehicle Usage in Minturn
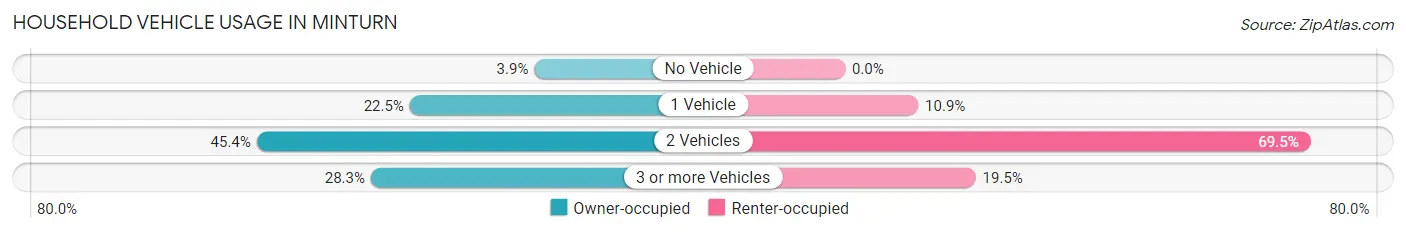
| Vehicles per Household | Owner-occupied | Renter-occupied |
| No Vehicle | 10 (3.9%) | 0 (0.0%) |
| 1 Vehicle | 58 (22.5%) | 14 (10.9%) |
| 2 Vehicles | 117 (45.4%) | 89 (69.5%) |
| 3 or more Vehicles | 73 (28.3%) | 25 (19.5%) |
| Total | 258 (100.0%) | 128 (100.0%) |
Real Estate & Mortgages in Minturn
Real Estate and Mortgage Overview in Minturn
| Characteristic | Without Mortgage | With Mortgage |
| Housing Units | 76 | 182 |
| Median Property Value | $838,900 | $939,700 |
| Median Household Income | - | - |
| Monthly Housing Costs | $682 | $80 |
| Real Estate Taxes | $2,667 | $0 |
Property Value by Mortgage Status in Minturn
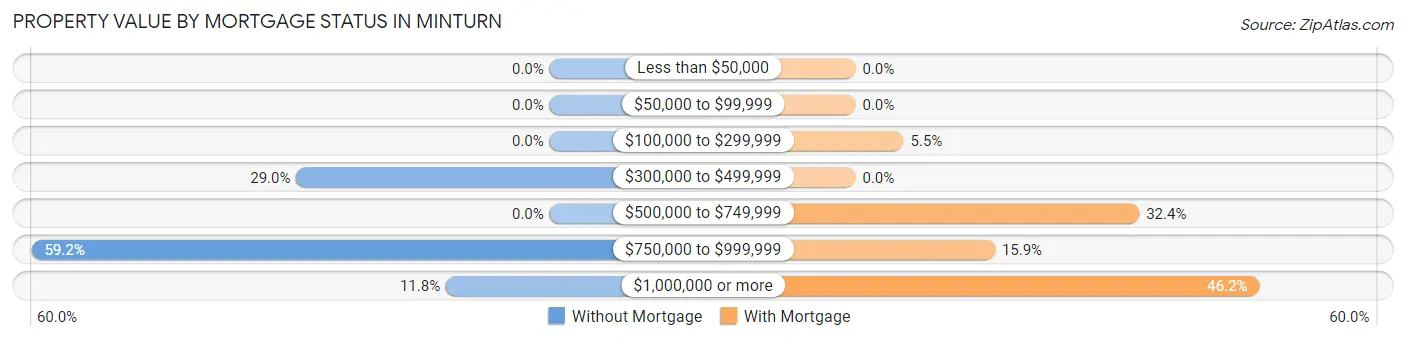
| Property Value | Without Mortgage | With Mortgage |
| Less than $50,000 | 0 (0.0%) | 0 (0.0%) |
| $50,000 to $99,999 | 0 (0.0%) | 0 (0.0%) |
| $100,000 to $299,999 | 0 (0.0%) | 10 (5.5%) |
| $300,000 to $499,999 | 22 (28.9%) | 0 (0.0%) |
| $500,000 to $749,999 | 0 (0.0%) | 59 (32.4%) |
| $750,000 to $999,999 | 45 (59.2%) | 29 (15.9%) |
| $1,000,000 or more | 9 (11.8%) | 84 (46.2%) |
| Total | 76 (100.0%) | 182 (100.0%) |
Household Income by Mortgage Status in Minturn
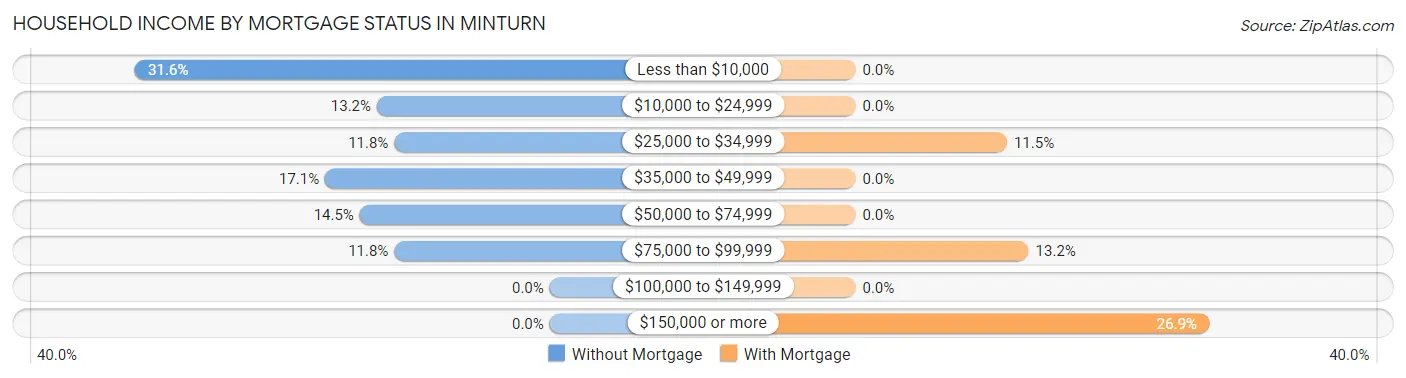
| Household Income | Without Mortgage | With Mortgage |
| Less than $10,000 | 24 (31.6%) | 0 (0.0%) |
| $10,000 to $24,999 | 10 (13.2%) | 0 (0.0%) |
| $25,000 to $34,999 | 9 (11.8%) | 21 (11.5%) |
| $35,000 to $49,999 | 13 (17.1%) | 0 (0.0%) |
| $50,000 to $74,999 | 11 (14.5%) | 0 (0.0%) |
| $75,000 to $99,999 | 9 (11.8%) | 24 (13.2%) |
| $100,000 to $149,999 | 0 (0.0%) | 0 (0.0%) |
| $150,000 or more | 0 (0.0%) | 49 (26.9%) |
| Total | 76 (100.0%) | 182 (100.0%) |
Property Value to Household Income Ratio in Minturn
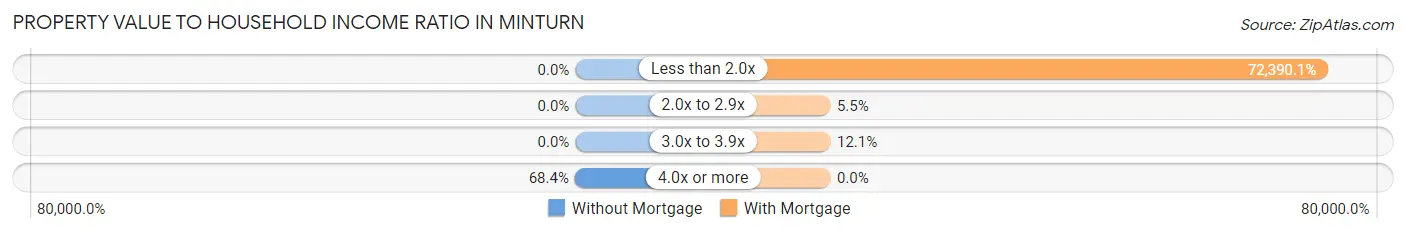
| Value-to-Income Ratio | Without Mortgage | With Mortgage |
| Less than 2.0x | 0 (0.0%) | 131,750 (72,390.1%) |
| 2.0x to 2.9x | 0 (0.0%) | 10 (5.5%) |
| 3.0x to 3.9x | 0 (0.0%) | 22 (12.1%) |
| 4.0x or more | 52 (68.4%) | 0 (0.0%) |
| Total | 76 (100.0%) | 182 (100.0%) |
Real Estate Taxes by Mortgage Status in Minturn
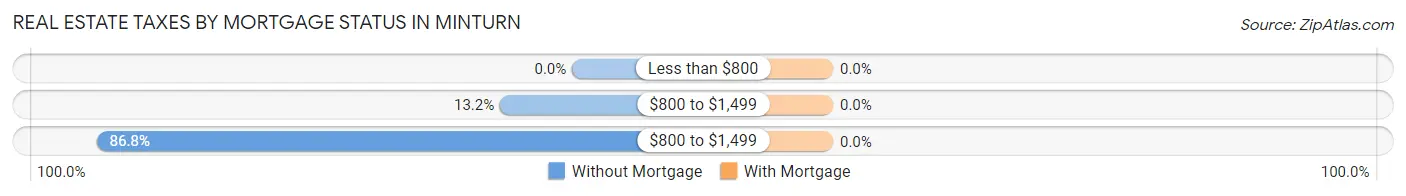
| Property Taxes | Without Mortgage | With Mortgage |
| Less than $800 | 0 (0.0%) | 0 (0.0%) |
| $800 to $1,499 | 10 (13.2%) | 0 (0.0%) |
| $800 to $1,499 | 66 (86.8%) | 0 (0.0%) |
| Total | 76 (100.0%) | 182 (100.0%) |
Health & Disability in Minturn
Health Insurance Coverage by Age in Minturn
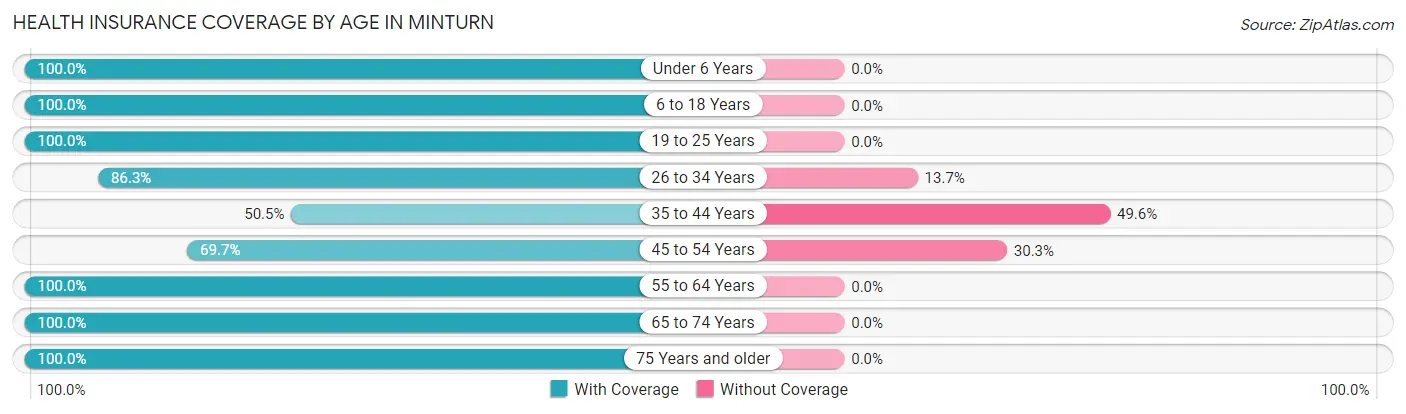
| Age Bracket | With Coverage | Without Coverage |
| Under 6 Years | 18 (100.0%) | 0 (0.0%) |
| 6 to 18 Years | 165 (100.0%) | 0 (0.0%) |
| 19 to 25 Years | 46 (100.0%) | 0 (0.0%) |
| 26 to 34 Years | 202 (86.3%) | 32 (13.7%) |
| 35 to 44 Years | 56 (50.4%) | 55 (49.5%) |
| 45 to 54 Years | 131 (69.7%) | 57 (30.3%) |
| 55 to 64 Years | 70 (100.0%) | 0 (0.0%) |
| 65 to 74 Years | 127 (100.0%) | 0 (0.0%) |
| 75 Years and older | 19 (100.0%) | 0 (0.0%) |
| Total | 834 (85.3%) | 144 (14.7%) |
Health Insurance Coverage by Citizenship Status in Minturn
| Citizenship Status | With Coverage | Without Coverage |
| Native Born | 18 (100.0%) | 0 (0.0%) |
| Foreign Born, Citizen | 165 (100.0%) | 0 (0.0%) |
| Foreign Born, not a Citizen | 46 (100.0%) | 0 (0.0%) |
Health Insurance Coverage by Household Income in Minturn
| Household Income | With Coverage | Without Coverage |
| Under $25,000 | 95 (100.0%) | 0 (0.0%) |
| $25,000 to $49,999 | 15 (31.9%) | 32 (68.1%) |
| $50,000 to $74,999 | 60 (100.0%) | 0 (0.0%) |
| $75,000 to $99,999 | 55 (64.7%) | 30 (35.3%) |
| $100,000 and over | 609 (88.1%) | 82 (11.9%) |
Public vs Private Health Insurance Coverage by Age in Minturn
| Age Bracket | Public Insurance | Private Insurance |
| Under 6 | 6 (33.3%) | 12 (66.7%) |
| 6 to 18 Years | 16 (9.7%) | 149 (90.3%) |
| 19 to 25 Years | 0 (0.0%) | 46 (100.0%) |
| 25 to 34 Years | 0 (0.0%) | 202 (86.3%) |
| 35 to 44 Years | 0 (0.0%) | 56 (50.4%) |
| 45 to 54 Years | 16 (8.5%) | 123 (65.4%) |
| 55 to 64 Years | 10 (14.3%) | 60 (85.7%) |
| 65 to 74 Years | 127 (100.0%) | 75 (59.1%) |
| 75 Years and over | 19 (100.0%) | 0 (0.0%) |
| Total | 194 (19.8%) | 723 (73.9%) |
Disability Status by Sex by Age in Minturn
| Age Bracket | Male | Female |
| Under 5 Years | 0 (0.0%) | 0 (0.0%) |
| 5 to 17 Years | 0 (0.0%) | 0 (0.0%) |
| 18 to 34 Years | 14 (11.5%) | 25 (15.8%) |
| 35 to 64 Years | 15 (7.1%) | 0 (0.0%) |
| 65 to 74 Years | 0 (0.0%) | 0 (0.0%) |
| 75 Years and over | 8 (42.1%) | 0 (0.0%) |
Disability Class by Sex by Age in Minturn
Disability Class: Hearing Difficulty
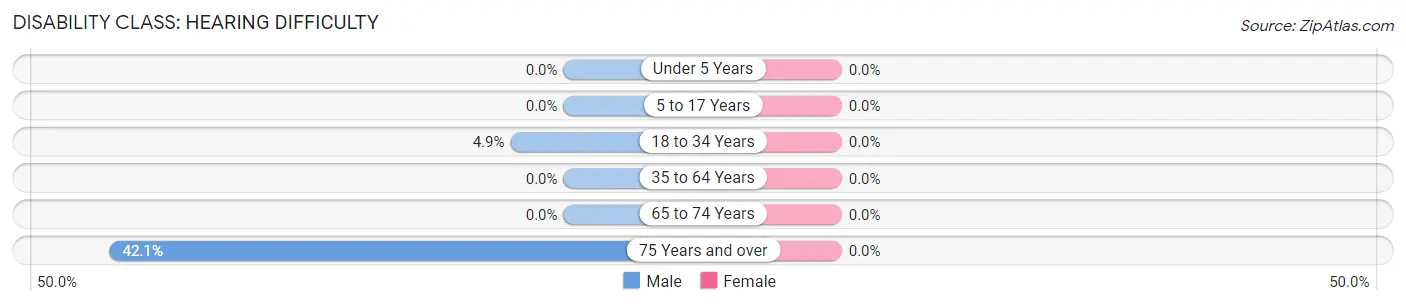
| Age Bracket | Male | Female |
| Under 5 Years | 0 (0.0%) | 0 (0.0%) |
| 5 to 17 Years | 0 (0.0%) | 0 (0.0%) |
| 18 to 34 Years | 6 (4.9%) | 0 (0.0%) |
| 35 to 64 Years | 0 (0.0%) | 0 (0.0%) |
| 65 to 74 Years | 0 (0.0%) | 0 (0.0%) |
| 75 Years and over | 8 (42.1%) | 0 (0.0%) |
Disability Class: Vision Difficulty
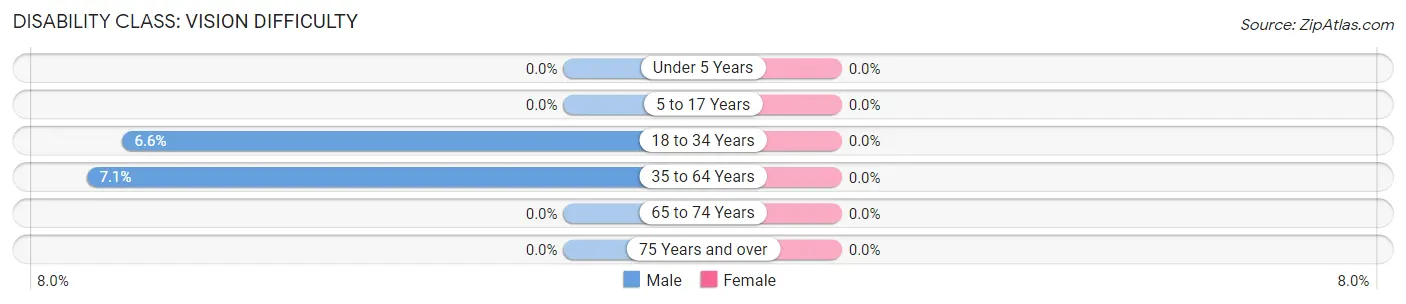
| Age Bracket | Male | Female |
| Under 5 Years | 0 (0.0%) | 0 (0.0%) |
| 5 to 17 Years | 0 (0.0%) | 0 (0.0%) |
| 18 to 34 Years | 8 (6.6%) | 0 (0.0%) |
| 35 to 64 Years | 15 (7.1%) | 0 (0.0%) |
| 65 to 74 Years | 0 (0.0%) | 0 (0.0%) |
| 75 Years and over | 0 (0.0%) | 0 (0.0%) |
Disability Class: Cognitive Difficulty
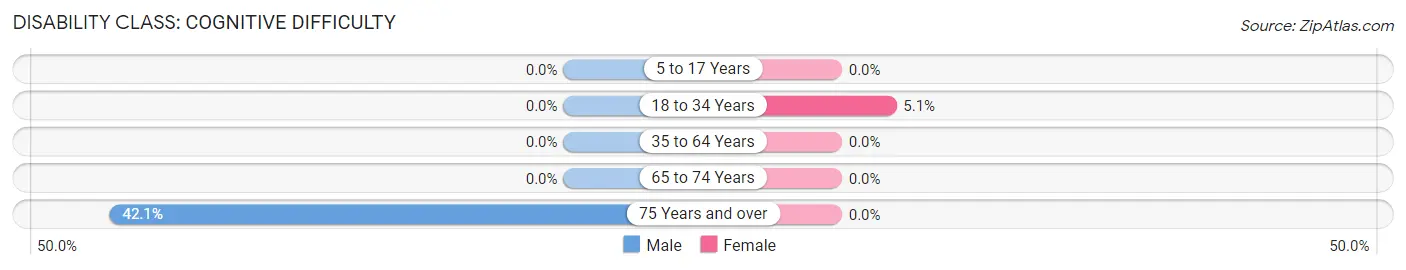
| Age Bracket | Male | Female |
| 5 to 17 Years | 0 (0.0%) | 0 (0.0%) |
| 18 to 34 Years | 0 (0.0%) | 8 (5.1%) |
| 35 to 64 Years | 0 (0.0%) | 0 (0.0%) |
| 65 to 74 Years | 0 (0.0%) | 0 (0.0%) |
| 75 Years and over | 8 (42.1%) | 0 (0.0%) |
Disability Class: Ambulatory Difficulty
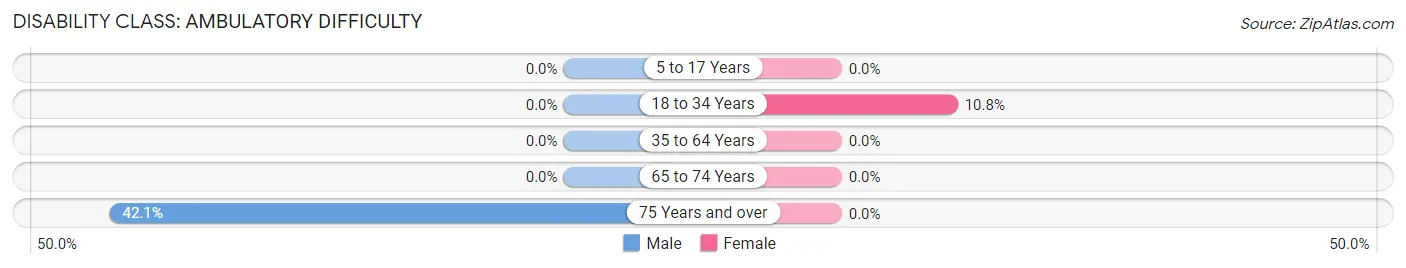
| Age Bracket | Male | Female |
| 5 to 17 Years | 0 (0.0%) | 0 (0.0%) |
| 18 to 34 Years | 0 (0.0%) | 17 (10.8%) |
| 35 to 64 Years | 0 (0.0%) | 0 (0.0%) |
| 65 to 74 Years | 0 (0.0%) | 0 (0.0%) |
| 75 Years and over | 8 (42.1%) | 0 (0.0%) |
Disability Class: Self-Care Difficulty
| Age Bracket | Male | Female |
| 5 to 17 Years | 0 (0.0%) | 0 (0.0%) |
| 18 to 34 Years | 0 (0.0%) | 0 (0.0%) |
| 35 to 64 Years | 0 (0.0%) | 0 (0.0%) |
| 65 to 74 Years | 0 (0.0%) | 0 (0.0%) |
| 75 Years and over | 0 (0.0%) | 0 (0.0%) |
Technology Access in Minturn
Computing Device Access in Minturn
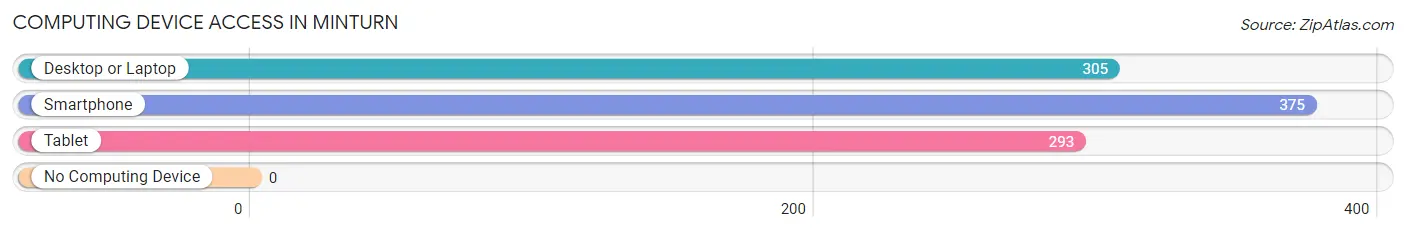
| Device Type | # Households | % Households |
| Desktop or Laptop | 305 | 79.0% |
| Smartphone | 375 | 97.2% |
| Tablet | 293 | 75.9% |
| No Computing Device | 0 | 0.0% |
| Total | 386 | 100.0% |
Internet Access in Minturn
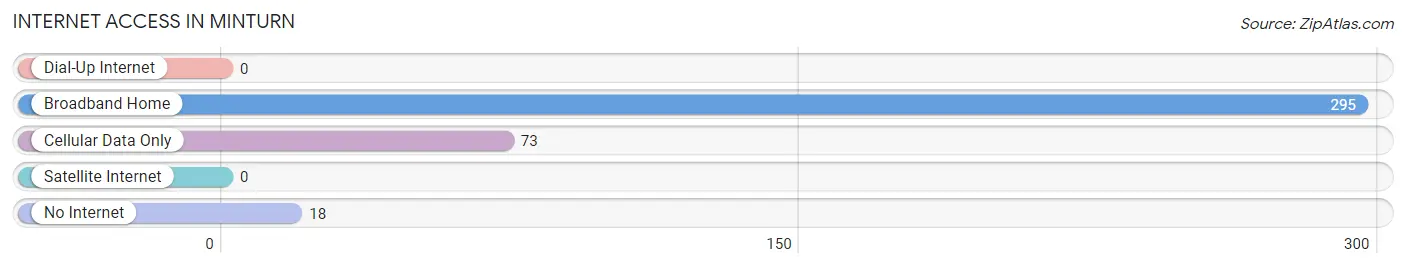
| Internet Type | # Households | % Households |
| Dial-Up Internet | 0 | 0.0% |
| Broadband Home | 295 | 76.4% |
| Cellular Data Only | 73 | 18.9% |
| Satellite Internet | 0 | 0.0% |
| No Internet | 18 | 4.7% |
| Total | 386 | 100.0% |
Minturn Summary
Minturn is a small town located in Eagle County, Colorado, United States. It is situated in the heart of the Rocky Mountains, just south of Vail and Beaver Creek ski resorts. The town was founded in 1883 by miners and ranchers, and has since become a popular tourist destination.
History
Minturn was founded in 1883 by miners and ranchers who were drawn to the area by the promise of gold and silver. The town was named after the nearby Minturn Creek, which was named after a local Native American chief. The town quickly grew, and by the early 1900s, it had become a bustling center of commerce and industry. The town was home to several mines, a sawmill, a brickyard, and a railroad.
In the 1950s, the town began to decline as the mining industry declined. However, in the 1960s, the town was revitalized by the development of the nearby ski resorts of Vail and Beaver Creek. This brought a new influx of tourists and businesses to the area, and Minturn quickly became a popular tourist destination.
Geography
Minturn is located in the heart of the Rocky Mountains, just south of Vail and Beaver Creek ski resorts. The town is situated at an elevation of 8,400 feet, and is surrounded by the White River National Forest. The town is located in a valley, and is bordered by the Sawatch Range to the west and the Gore Range to the east. The town is also located near the Eagle River, which is a popular destination for fishing and rafting.
Economy
Minturn's economy is largely based on tourism. The town is home to several ski resorts, including Vail and Beaver Creek, which attract thousands of visitors each year. The town is also home to several restaurants, bars, and shops, which cater to the tourist trade. In addition, the town is home to several businesses that provide services to the local community, such as construction, plumbing, and electrical services.
Demographics
As of the 2010 census, Minturn had a population of 1,074. The town is predominantly white, with a small Hispanic population. The median household income is $50,000, and the median home value is $400,000. The town has a high rate of homeownership, with over 80% of residents owning their own homes. The town also has a high rate of educational attainment, with over 90% of residents having at least a high school diploma.
Common Questions
What is Per Capita Income in Minturn?
Per Capita income in Minturn is $49,602.
What is the Median Family Income in Minturn?
Median Family Income in Minturn is $118,542.
What is the Median Household income in Minturn?
Median Household Income in Minturn is $103,333.
What is Income or Wage Gap in Minturn?
Income or Wage Gap in Minturn is 2.5%.
Women in Minturn earn 97.5 cents for every dollar earned by a man.
What is Inequality or Gini Index in Minturn?
Inequality or Gini Index in Minturn is 0.44.
What is the Total Population of Minturn?
Total Population of Minturn is 978.
What is the Total Male Population of Minturn?
Total Male Population of Minturn is 514.
What is the Total Female Population of Minturn?
Total Female Population of Minturn is 464.
What is the Ratio of Males per 100 Females in Minturn?
There are 110.78 Males per 100 Females in Minturn.
What is the Ratio of Females per 100 Males in Minturn?
There are 90.27 Females per 100 Males in Minturn.
What is the Median Population Age in Minturn?
Median Population Age in Minturn is 38.1 Years.
What is the Average Family Size in Minturn
Average Family Size in Minturn is 3.0 People.
What is the Average Household Size in Minturn
Average Household Size in Minturn is 2.5 People.
How Large is the Labor Force in Minturn?
There are 645 People in the Labor Forcein in Minturn.
What is the Percentage of People in the Labor Force in Minturn?
81.1% of People are in the Labor Force in Minturn.
What is the Unemployment Rate in Minturn?
Unemployment Rate in Minturn is 5.9%.