Zip Codes with the Highest Percentage of Families with Income Above $100,000 in Loveland, CO
RELATED REPORTS & OPTIONS
Family Income | $100k+
Loveland
Compare Zip Codes
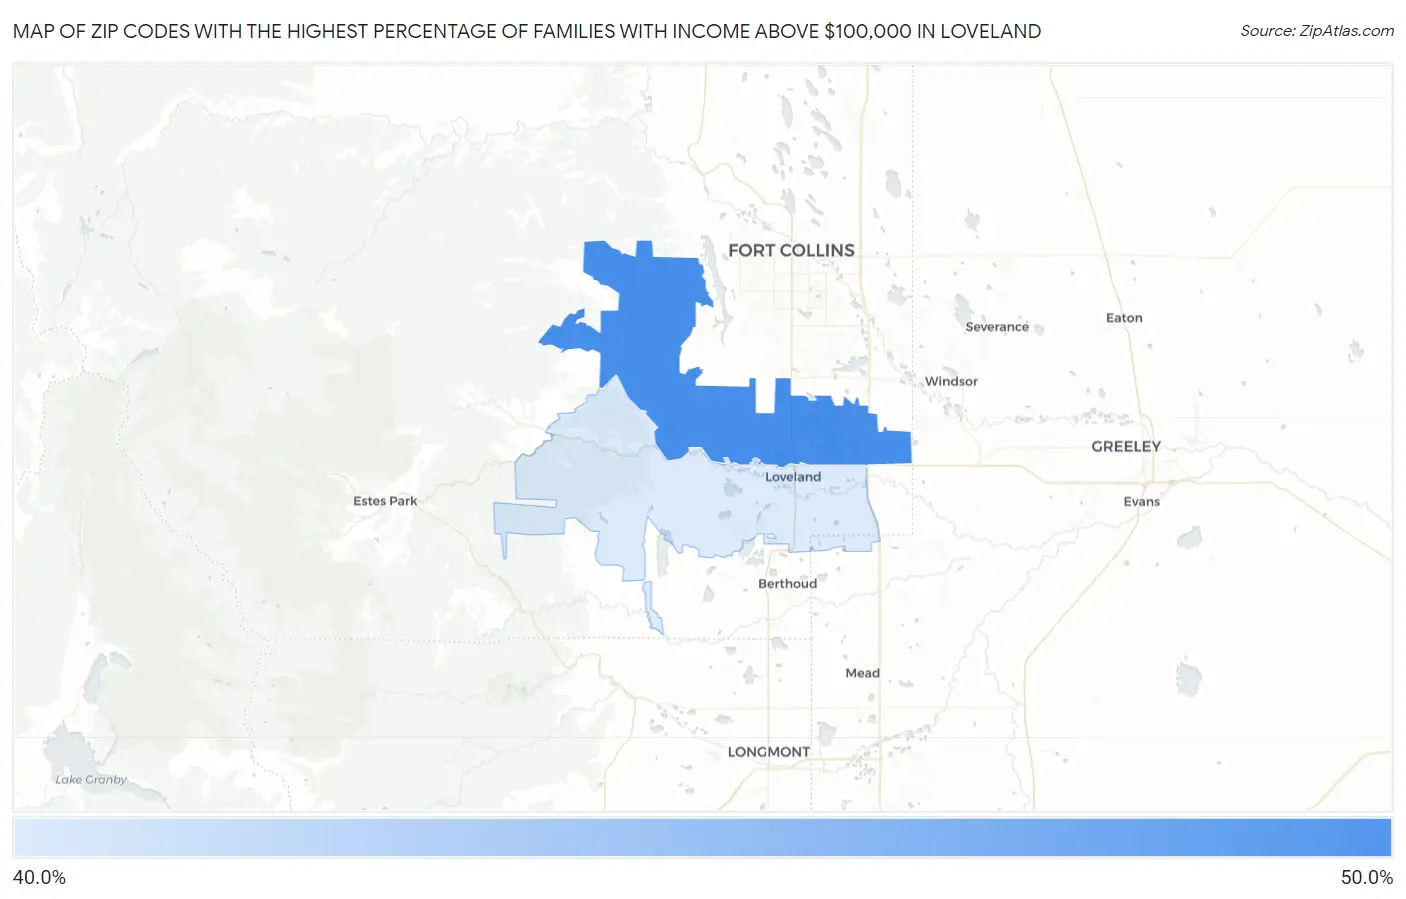
Map of Zip Codes with the Highest Percentage of Families with Income Above $100,000 in Loveland
46.3%
49.5%
Zip Codes with the Highest Percentage of Families with Income Above $100,000 in Loveland, CO
| Zip Code | Families with Income > $100k | vs State | vs National | |
| 1. | 80538 | 49.5% | 54.4%(-4.90)#211 | 46.1%(+3.40)#9,045 |
| 2. | 80537 | 46.3% | 54.4%(-8.10)#235 | 46.1%(+0.200)#10,644 |
1
Common Questions
What are the Top Zip Codes with the Highest Percentage of Families with Income Above $100,000 in Loveland, CO?
Top Zip Codes with the Highest Percentage of Families with Income Above $100,000 in Loveland, CO are:
What zip code has the Highest Percentage of Families with Income Above $100,000 in Loveland, CO?
80538 has the Highest Percentage of Families with Income Above $100,000 in Loveland, CO with 49.5%.
What is the Percentage of Families with Income Above $100,000 in Loveland, CO?
Percentage of Families with Income Above $100,000 in Loveland is 45.4%.
What is the Percentage of Families with Income Above $100,000 in Colorado?
Percentage of Families with Income Above $100,000 in Colorado is 54.4%.
What is the Percentage of Families with Income Above $100,000 in the United States?
Percentage of Families with Income Above $100,000 in the United States is 46.1%.