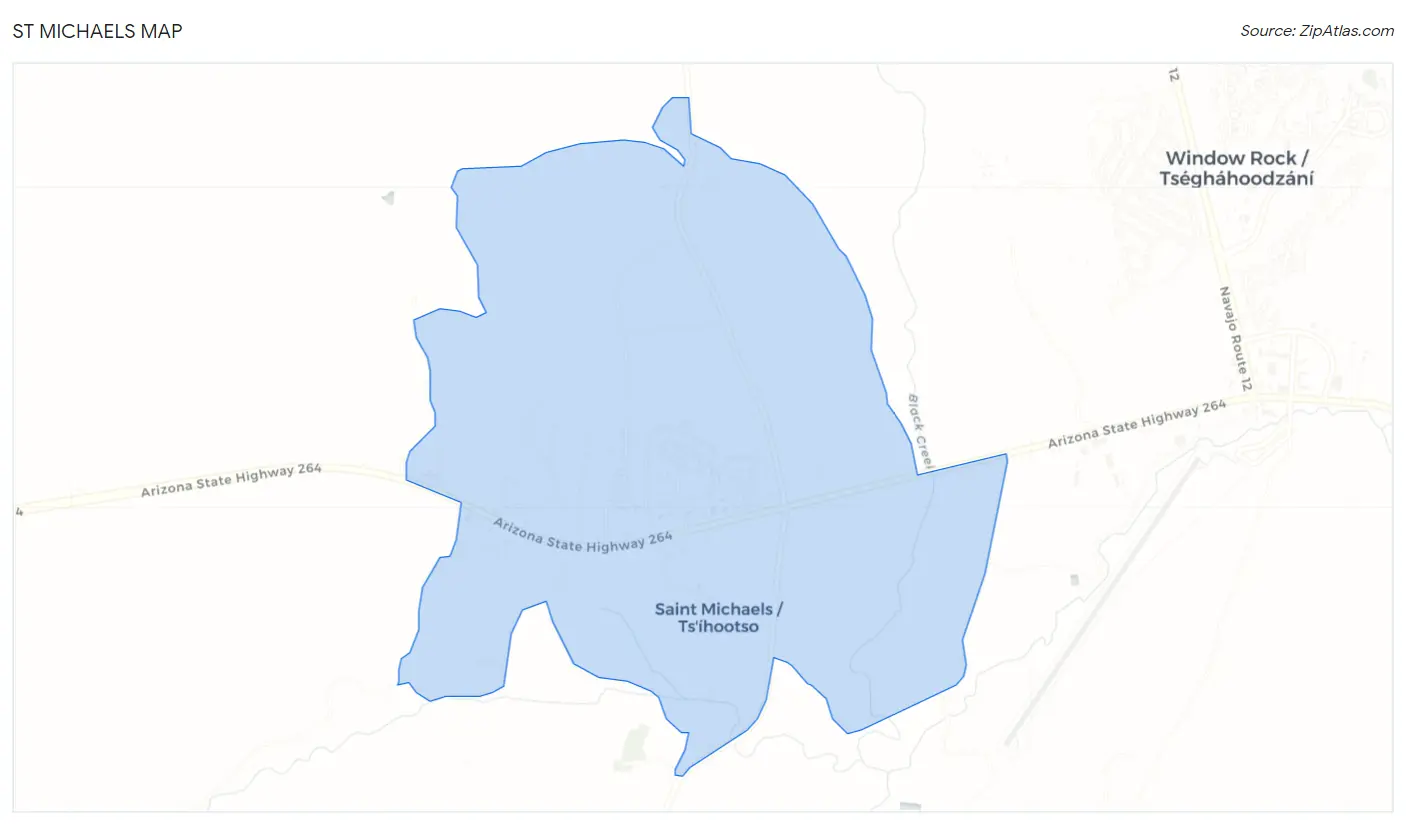
St Michaels, AZ Map & Demographics
St Michaels Map
St Michaels Overview
$21,218
PER CAPITA INCOME
$68,611
AVG FAMILY INCOME
$45,208
AVG HOUSEHOLD INCOME
11.6%
WAGE / INCOME GAP [ % ]
88.4¢/ $1
WAGE / INCOME GAP [ $ ]
$15,293
FAMILY INCOME DEFICIT
0.48
INEQUALITY / GINI INDEX
774
TOTAL POPULATION
326
MALE POPULATION
448
FEMALE POPULATION
72.77
MALES / 100 FEMALES
137.42
FEMALES / 100 MALES
43.3
MEDIAN AGE
4.5
AVG FAMILY SIZE
3.4
AVG HOUSEHOLD SIZE
253
LABOR FORCE [ PEOPLE ]
40.9%
PERCENT IN LABOR FORCE
11.1%
UNEMPLOYMENT RATE
St Michaels Area Codes
Income in St Michaels
Income Overview in St Michaels
Per Capita Income in St Michaels is $21,218, while median incomes of families and households are $68,611 and $45,208 respectively.
| Characteristic | Number | Measure |
| Per Capita Income | 774 | $21,218 |
| Median Family Income | 154 | $68,611 |
| Mean Family Income | 154 | $74,277 |
| Median Household Income | 224 | $45,208 |
| Mean Household Income | 224 | $64,588 |
| Income Deficit | 154 | $15,293 |
| Wage / Income Gap (%) | 774 | 11.61% |
| Wage / Income Gap ($) | 774 | 88.39¢ per $1 |
| Gini / Inequality Index | 774 | 0.48 |
Earnings by Sex in St Michaels
Average Earnings in St Michaels are $46,104, $46,811 for men and $41,375 for women, a difference of 11.6%.
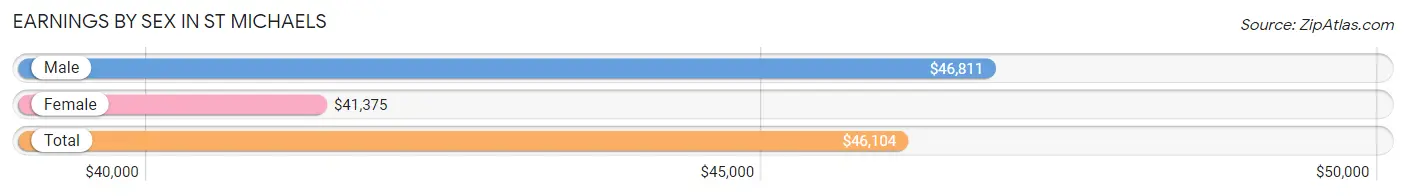
| Sex | Number | Average Earnings |
| Male | 123 (47.9%) | $46,811 |
| Female | 134 (52.1%) | $41,375 |
| Total | 257 (100.0%) | $46,104 |
Earnings by Sex by Income Bracket in St Michaels
The most common earnings brackets in St Michaels are $45,000 to $49,999 for men (49 | 39.8%) and $50,000 to $54,999 for women (31 | 23.1%).
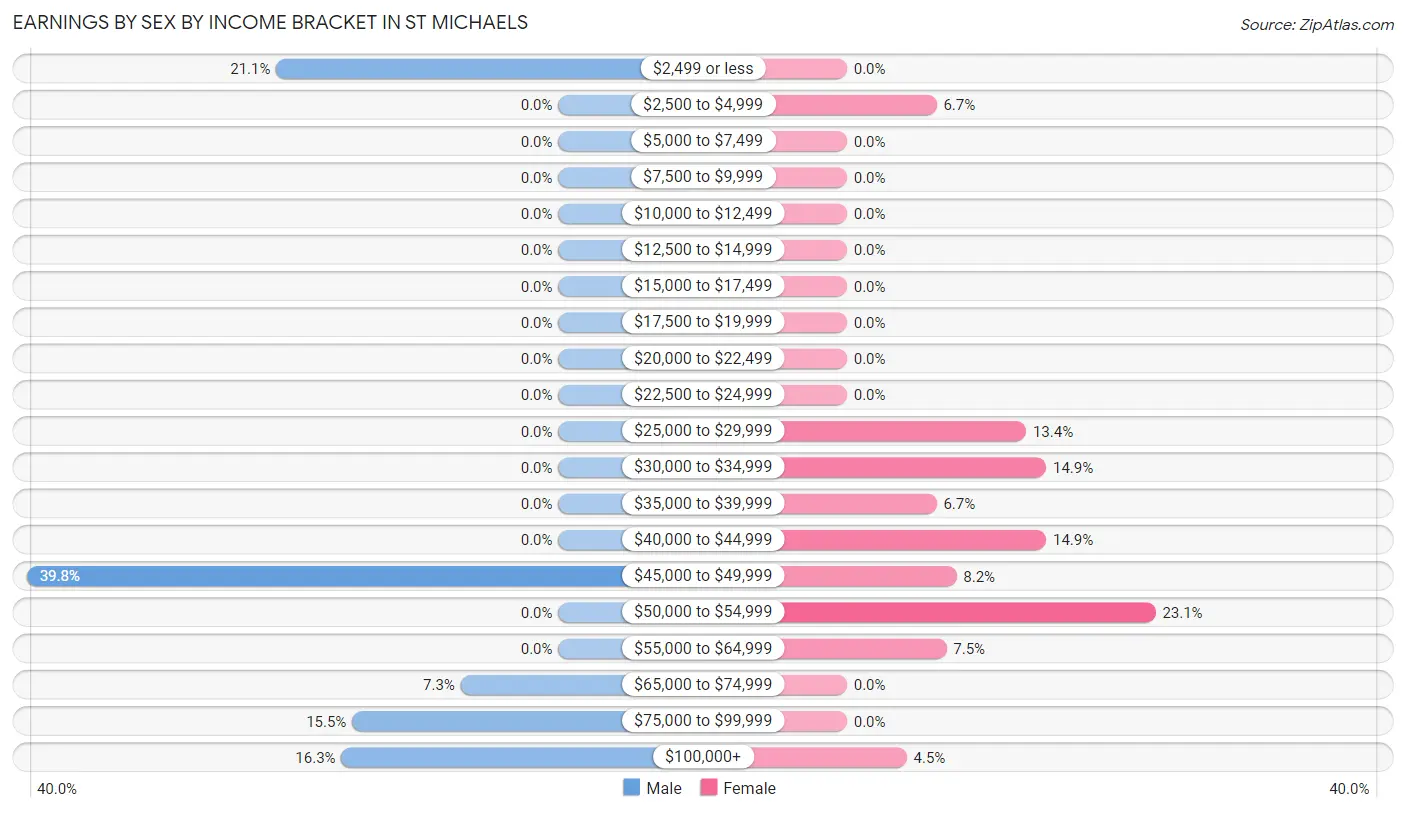
| Income | Male | Female |
| $2,499 or less | 26 (21.1%) | 0 (0.0%) |
| $2,500 to $4,999 | 0 (0.0%) | 9 (6.7%) |
| $5,000 to $7,499 | 0 (0.0%) | 0 (0.0%) |
| $7,500 to $9,999 | 0 (0.0%) | 0 (0.0%) |
| $10,000 to $12,499 | 0 (0.0%) | 0 (0.0%) |
| $12,500 to $14,999 | 0 (0.0%) | 0 (0.0%) |
| $15,000 to $17,499 | 0 (0.0%) | 0 (0.0%) |
| $17,500 to $19,999 | 0 (0.0%) | 0 (0.0%) |
| $20,000 to $22,499 | 0 (0.0%) | 0 (0.0%) |
| $22,500 to $24,999 | 0 (0.0%) | 0 (0.0%) |
| $25,000 to $29,999 | 0 (0.0%) | 18 (13.4%) |
| $30,000 to $34,999 | 0 (0.0%) | 20 (14.9%) |
| $35,000 to $39,999 | 0 (0.0%) | 9 (6.7%) |
| $40,000 to $44,999 | 0 (0.0%) | 20 (14.9%) |
| $45,000 to $49,999 | 49 (39.8%) | 11 (8.2%) |
| $50,000 to $54,999 | 0 (0.0%) | 31 (23.1%) |
| $55,000 to $64,999 | 0 (0.0%) | 10 (7.5%) |
| $65,000 to $74,999 | 9 (7.3%) | 0 (0.0%) |
| $75,000 to $99,999 | 19 (15.4%) | 0 (0.0%) |
| $100,000+ | 20 (16.3%) | 6 (4.5%) |
| Total | 123 (100.0%) | 134 (100.0%) |
Earnings by Sex by Educational Attainment in St Michaels
Average earnings in St Michaels are $46,811 for men and $41,375 for women, a difference of 11.6%. Men with an educational attainment of bachelor's degree enjoy the highest average annual earnings of $109,250, while those with college or associate's degree education earn the least with $46,739. Women with an educational attainment of bachelor's degree earn the most with the average annual earnings of $53,214, while those with college or associate's degree education have the smallest earnings of $40,625.
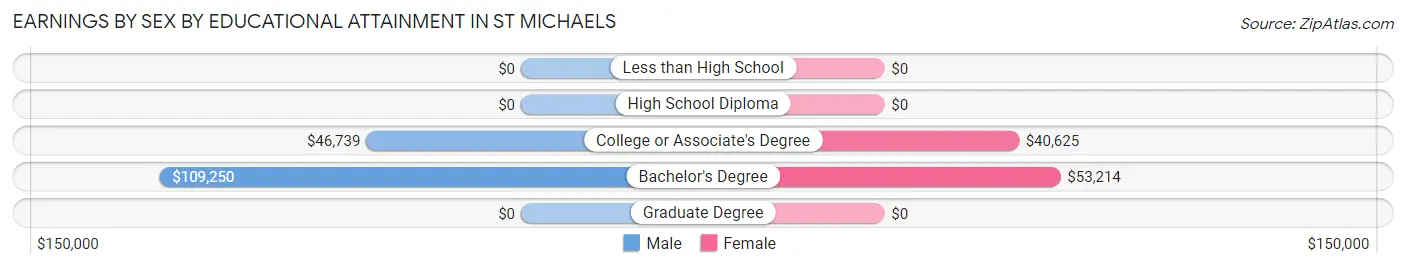
| Educational Attainment | Male Income | Female Income |
| Less than High School | - | - |
| High School Diploma | - | - |
| College or Associate's Degree | $46,739 | $40,625 |
| Bachelor's Degree | $109,250 | $53,214 |
| Graduate Degree | - | - |
| Total | $46,811 | $41,375 |
Family Income in St Michaels
Family Income Brackets in St Michaels
According to the St Michaels family income data, there are 30 families falling into the $100,000 to $149,999 income range, which is the most common income bracket and makes up 19.5% of all families.
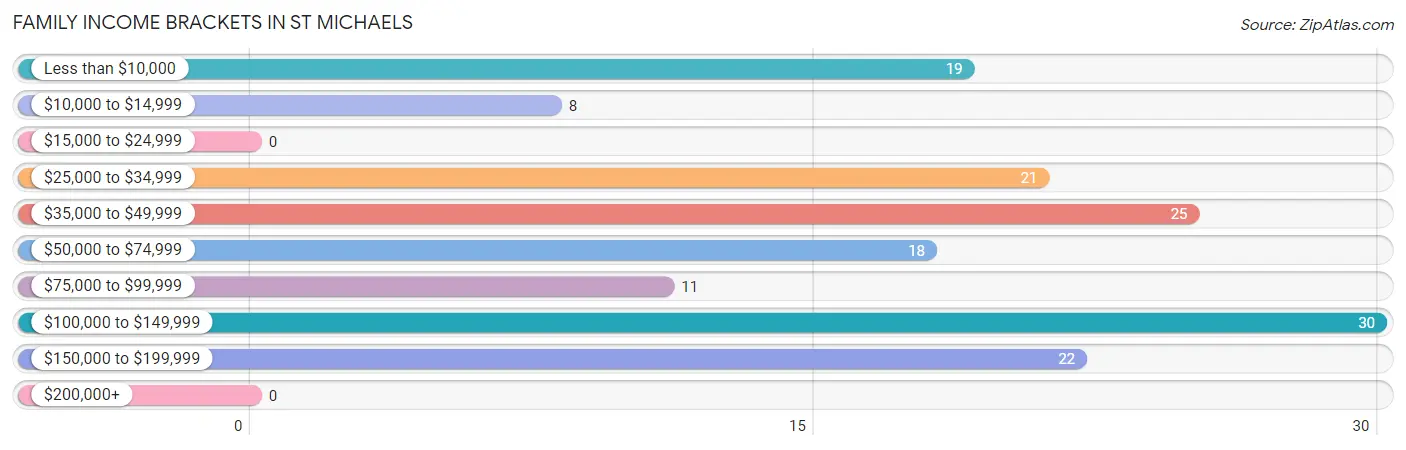
| Income Bracket | # Families | % Families |
| Less than $10,000 | 19 | 12.3% |
| $10,000 to $14,999 | 8 | 5.2% |
| $15,000 to $24,999 | 0 | 0.0% |
| $25,000 to $34,999 | 21 | 13.6% |
| $35,000 to $49,999 | 25 | 16.2% |
| $50,000 to $74,999 | 18 | 11.7% |
| $75,000 to $99,999 | 11 | 7.1% |
| $100,000 to $149,999 | 30 | 19.5% |
| $150,000 to $199,999 | 22 | 14.3% |
| $200,000+ | 0 | 0.0% |
Family Income by Famaliy Size in St Michaels
| Income Bracket | # Families | Median Income |
| 2-Person Families | 84 (54.5%) | $0 |
| 3-Person Families | 35 (22.7%) | $0 |
| 4-Person Families | 0 (0.0%) | $0 |
| 5-Person Families | 18 (11.7%) | $0 |
| 6-Person Families | 8 (5.2%) | $0 |
| 7+ Person Families | 9 (5.8%) | $0 |
| Total | 154 (100.0%) | $68,611 |
Family Income by Number of Earners in St Michaels
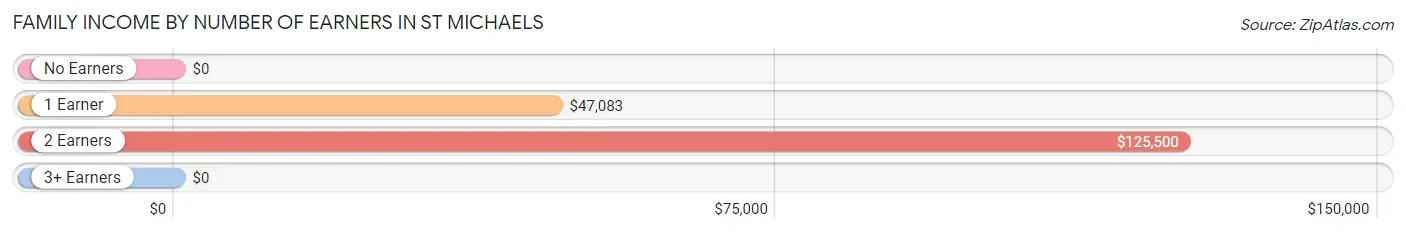
| Number of Earners | # Families | Median Income |
| No Earners | 42 (27.3%) | $0 |
| 1 Earner | 58 (37.7%) | $47,083 |
| 2 Earners | 44 (28.6%) | $125,500 |
| 3+ Earners | 10 (6.5%) | $0 |
| Total | 154 (100.0%) | $68,611 |
Household Income in St Michaels
Household Income Brackets in St Michaels
With 37 households falling in the category, the less than $10,000 income range is the most frequent in St Michaels, accounting for 16.5% of all households.
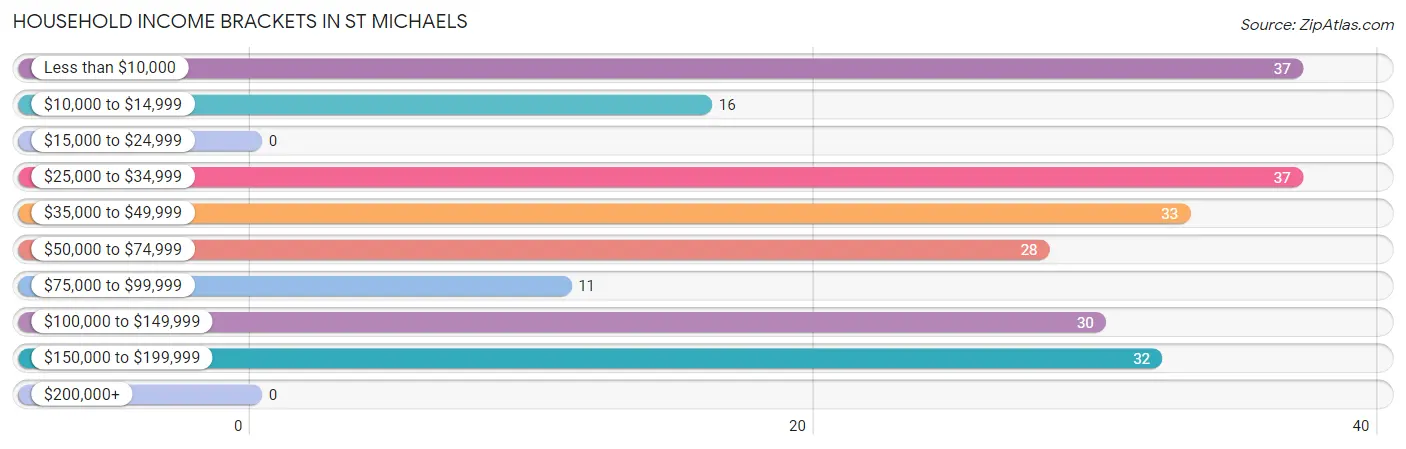
| Income Bracket | # Households | % Households |
| Less than $10,000 | 37 | 16.5% |
| $10,000 to $14,999 | 16 | 7.1% |
| $15,000 to $24,999 | 0 | 0.0% |
| $25,000 to $34,999 | 37 | 16.5% |
| $35,000 to $49,999 | 33 | 14.7% |
| $50,000 to $74,999 | 28 | 12.5% |
| $75,000 to $99,999 | 11 | 4.9% |
| $100,000 to $149,999 | 30 | 13.4% |
| $150,000 to $199,999 | 32 | 14.3% |
| $200,000+ | 0 | 0.0% |
Household Income by Householder Age in St Michaels
The median household income in St Michaels is $45,208, with the highest median household income of $28,068 found in the 65+ years age bracket for the primary householder. A total of 103 households (46.0%) fall into this category.
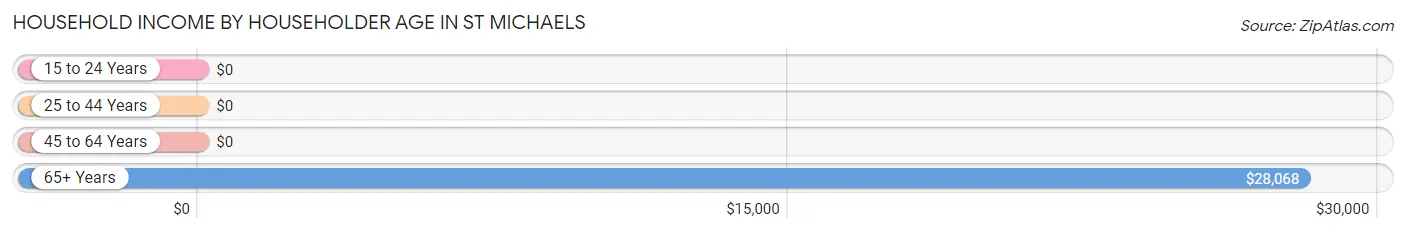
| Income Bracket | # Households | Median Income |
| 15 to 24 Years | 0 (0.0%) | $0 |
| 25 to 44 Years | 39 (17.4%) | $0 |
| 45 to 64 Years | 82 (36.6%) | $0 |
| 65+ Years | 103 (46.0%) | $28,068 |
| Total | 224 (100.0%) | $45,208 |
Poverty in St Michaels
Income Below Poverty by Sex and Age in St Michaels
With 16.6% poverty level for males and 17.9% for females among the residents of St Michaels, 45 to 54 year old males and 18 to 24 year old females are the most vulnerable to poverty, with 33 males (39.8%) and 20 females (100.0%) in their respective age groups living below the poverty level.
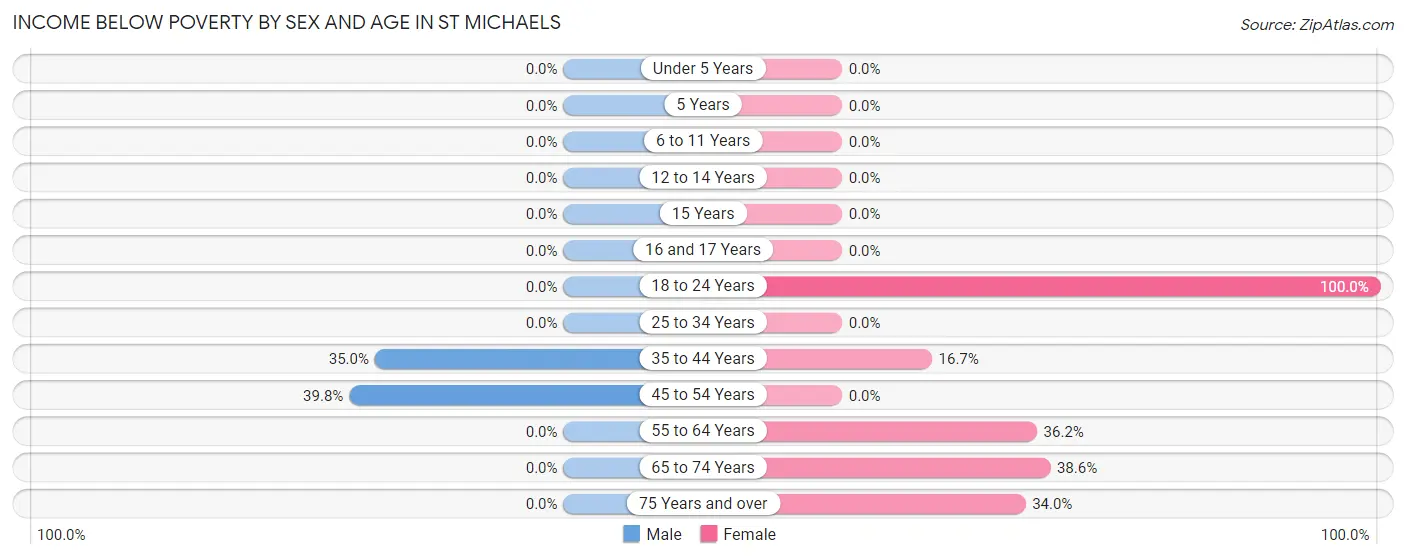
| Age Bracket | Male | Female |
| Under 5 Years | 0 (0.0%) | 0 (0.0%) |
| 5 Years | 0 (0.0%) | 0 (0.0%) |
| 6 to 11 Years | 0 (0.0%) | 0 (0.0%) |
| 12 to 14 Years | 0 (0.0%) | 0 (0.0%) |
| 15 Years | 0 (0.0%) | 0 (0.0%) |
| 16 and 17 Years | 0 (0.0%) | 0 (0.0%) |
| 18 to 24 Years | 0 (0.0%) | 20 (100.0%) |
| 25 to 34 Years | 0 (0.0%) | 0 (0.0%) |
| 35 to 44 Years | 21 (35.0%) | 10 (16.7%) |
| 45 to 54 Years | 33 (39.8%) | 0 (0.0%) |
| 55 to 64 Years | 0 (0.0%) | 17 (36.2%) |
| 65 to 74 Years | 0 (0.0%) | 17 (38.6%) |
| 75 Years and over | 0 (0.0%) | 16 (34.0%) |
| Total | 54 (16.6%) | 80 (17.9%) |
Income Above Poverty by Sex and Age in St Michaels
According to the poverty statistics in St Michaels, males aged 5 years and females aged under 5 years are the age groups that are most secure financially, with 100.0% of males and 100.0% of females in these age groups living above the poverty line.
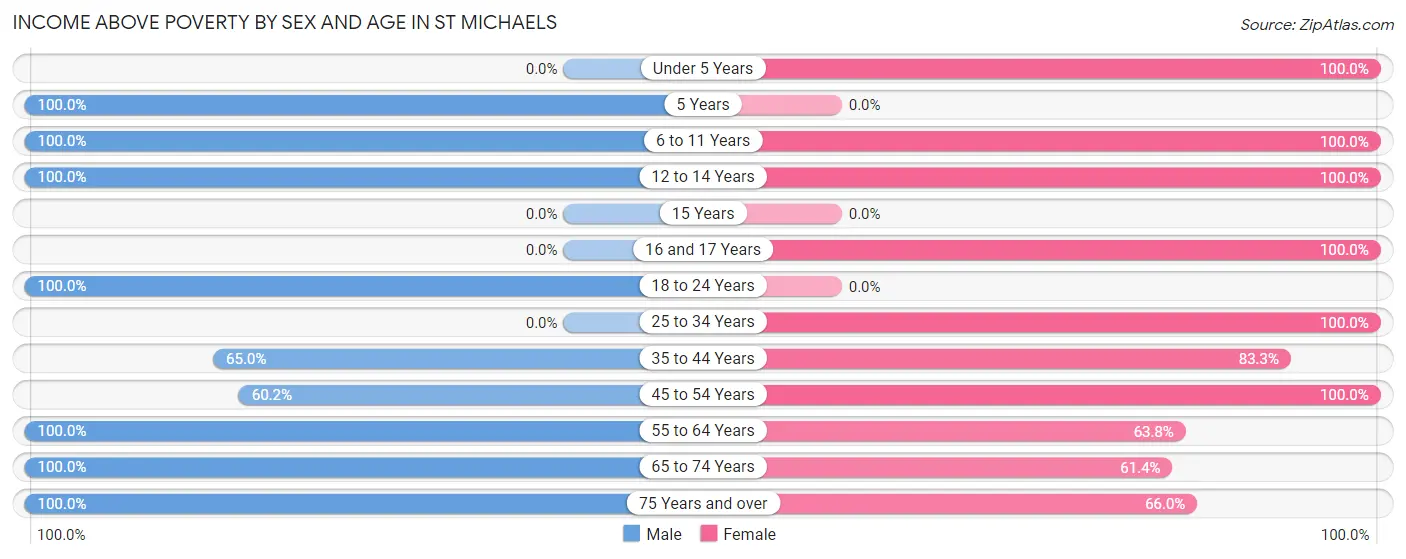
| Age Bracket | Male | Female |
| Under 5 Years | 0 (0.0%) | 24 (100.0%) |
| 5 Years | 12 (100.0%) | 0 (0.0%) |
| 6 to 11 Years | 52 (100.0%) | 44 (100.0%) |
| 12 to 14 Years | 12 (100.0%) | 12 (100.0%) |
| 15 Years | 0 (0.0%) | 0 (0.0%) |
| 16 and 17 Years | 0 (0.0%) | 14 (100.0%) |
| 18 to 24 Years | 7 (100.0%) | 0 (0.0%) |
| 25 to 34 Years | 0 (0.0%) | 88 (100.0%) |
| 35 to 44 Years | 39 (65.0%) | 50 (83.3%) |
| 45 to 54 Years | 50 (60.2%) | 48 (100.0%) |
| 55 to 64 Years | 54 (100.0%) | 30 (63.8%) |
| 65 to 74 Years | 20 (100.0%) | 27 (61.4%) |
| 75 Years and over | 26 (100.0%) | 31 (66.0%) |
| Total | 272 (83.4%) | 368 (82.1%) |
Income Below Poverty Among Married-Couple Families in St Michaels
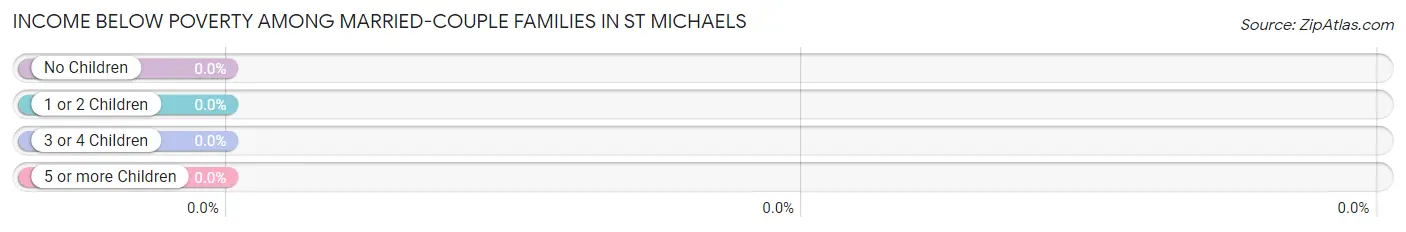
| Children | Above Poverty | Below Poverty |
| No Children | 58 (100.0%) | 0 (0.0%) |
| 1 or 2 Children | 29 (100.0%) | 0 (0.0%) |
| 3 or 4 Children | 0 (0.0%) | 0 (0.0%) |
| 5 or more Children | 9 (100.0%) | 0 (0.0%) |
| Total | 96 (100.0%) | 0 (0.0%) |
Income Below Poverty Among Single-Parent Households in St Michaels
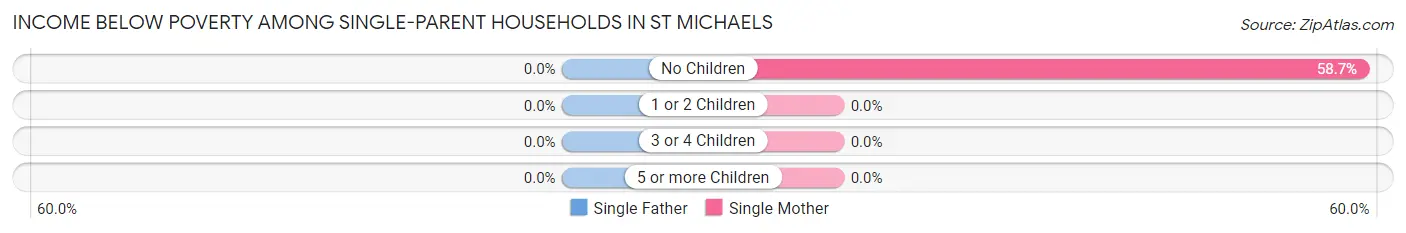
| Children | Single Father | Single Mother |
| No Children | 0 (0.0%) | 27 (58.7%) |
| 1 or 2 Children | 0 (0.0%) | 0 (0.0%) |
| 3 or 4 Children | 0 (0.0%) | 0 (0.0%) |
| 5 or more Children | 0 (0.0%) | 0 (0.0%) |
| Total | 0 (0.0%) | 27 (58.7%) |
Income Below Poverty Among Married-Couple vs Single-Parent Households in St Michaels
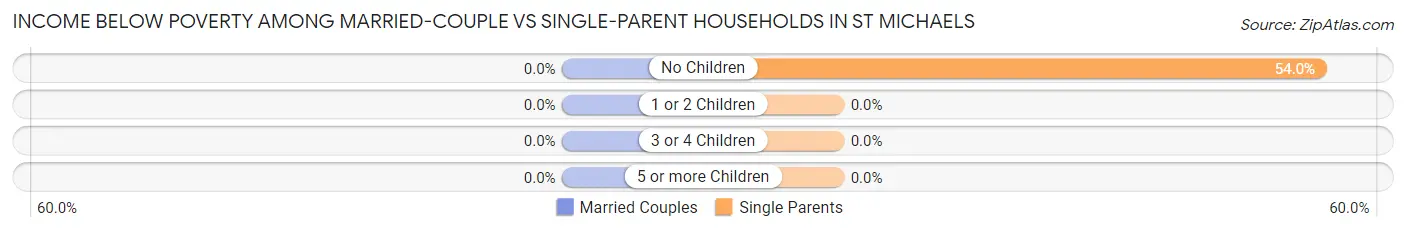
| Children | Married-Couple Families | Single-Parent Households |
| No Children | 0 (0.0%) | 27 (54.0%) |
| 1 or 2 Children | 0 (0.0%) | 0 (0.0%) |
| 3 or 4 Children | 0 (0.0%) | 0 (0.0%) |
| 5 or more Children | 0 (0.0%) | 0 (0.0%) |
| Total | 0 (0.0%) | 27 (46.6%) |
Race in St Michaels
The most populous races in St Michaels are Native / Alaskan (721 | 93.1%), Asian (30 | 3.9%), and Hispanic or Latino (13 | 1.7%).
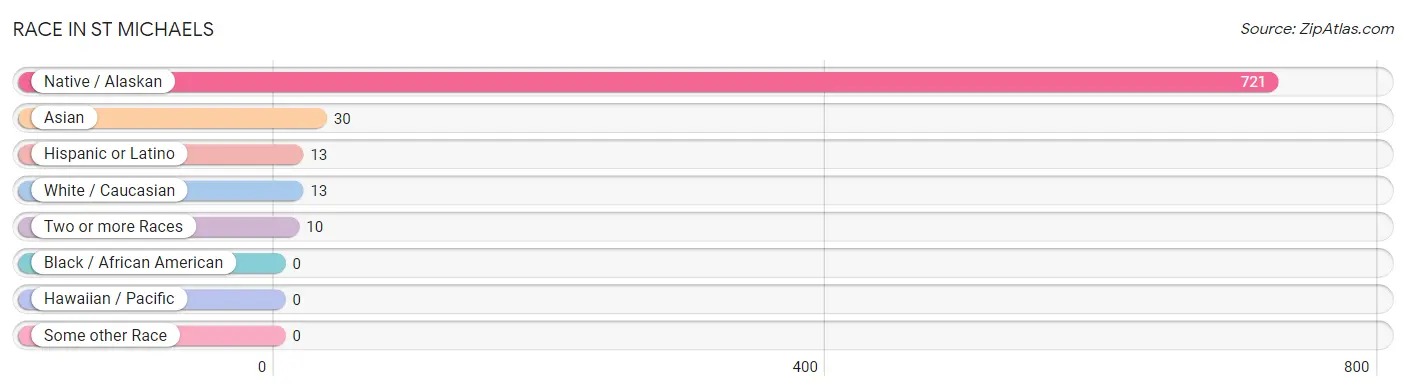
| Race | # Population | % Population |
| Asian | 30 | 3.9% |
| Black / African American | 0 | 0.0% |
| Hawaiian / Pacific | 0 | 0.0% |
| Hispanic or Latino | 13 | 1.7% |
| Native / Alaskan | 721 | 93.1% |
| White / Caucasian | 13 | 1.7% |
| Two or more Races | 10 | 1.3% |
| Some other Race | 0 | 0.0% |
| Total | 774 | 100.0% |
Ancestry in St Michaels
The most populous ancestries reported in St Michaels are Navajo (731 | 94.4%), Thai (18 | 2.3%), Bhutanese (12 | 1.5%), Polish (9 | 1.2%), and Mexican (8 | 1.0%), together accounting for 100.5% of all St Michaels residents.
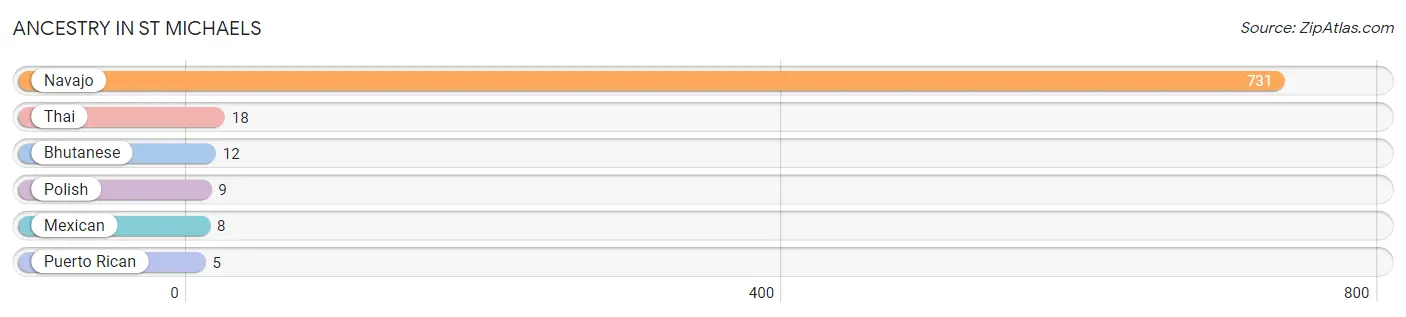
| Ancestry | # Population | % Population |
| Bhutanese | 12 | 1.5% |
| Mexican | 8 | 1.0% |
| Navajo | 731 | 94.4% |
| Polish | 9 | 1.2% |
| Puerto Rican | 5 | 0.6% |
| Thai | 18 | 2.3% | View All 6 Rows |
Immigrants in St Michaels
The most numerous immigrant groups reported in St Michaels came from Asia (30 | 3.9%), Philippines (18 | 2.3%), South Eastern Asia (18 | 2.3%), Eastern Asia (12 | 1.5%), and Japan (12 | 1.5%), together accounting for 11.6% of all St Michaels residents.
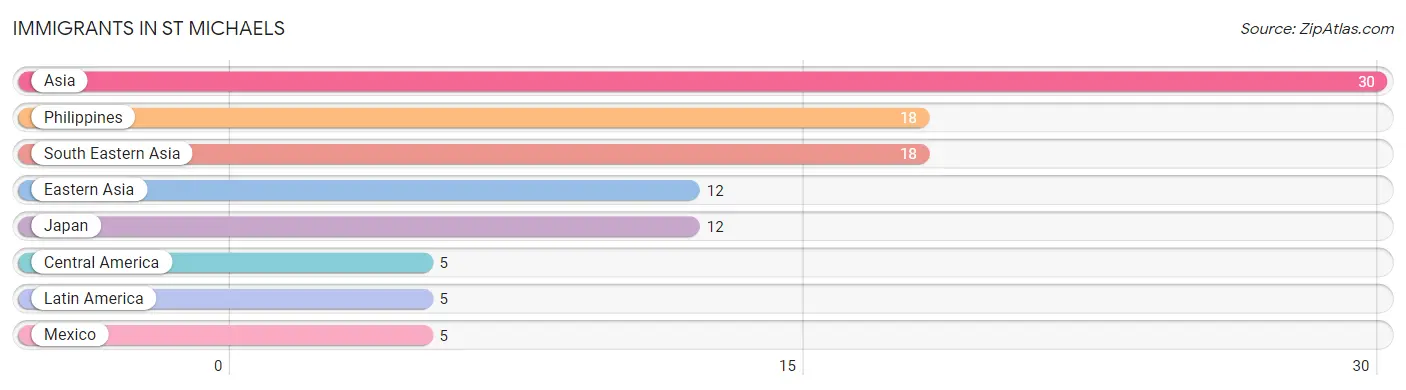
| Immigration Origin | # Population | % Population |
| Asia | 30 | 3.9% |
| Central America | 5 | 0.6% |
| Eastern Asia | 12 | 1.5% |
| Japan | 12 | 1.5% |
| Latin America | 5 | 0.6% |
| Mexico | 5 | 0.6% |
| Philippines | 18 | 2.3% |
| South Eastern Asia | 18 | 2.3% | View All 8 Rows |
Sex and Age in St Michaels
Sex and Age in St Michaels
The most populous age groups in St Michaels are 50 to 54 Years (58 | 17.8%) for men and 25 to 29 Years (49 | 10.9%) for women.
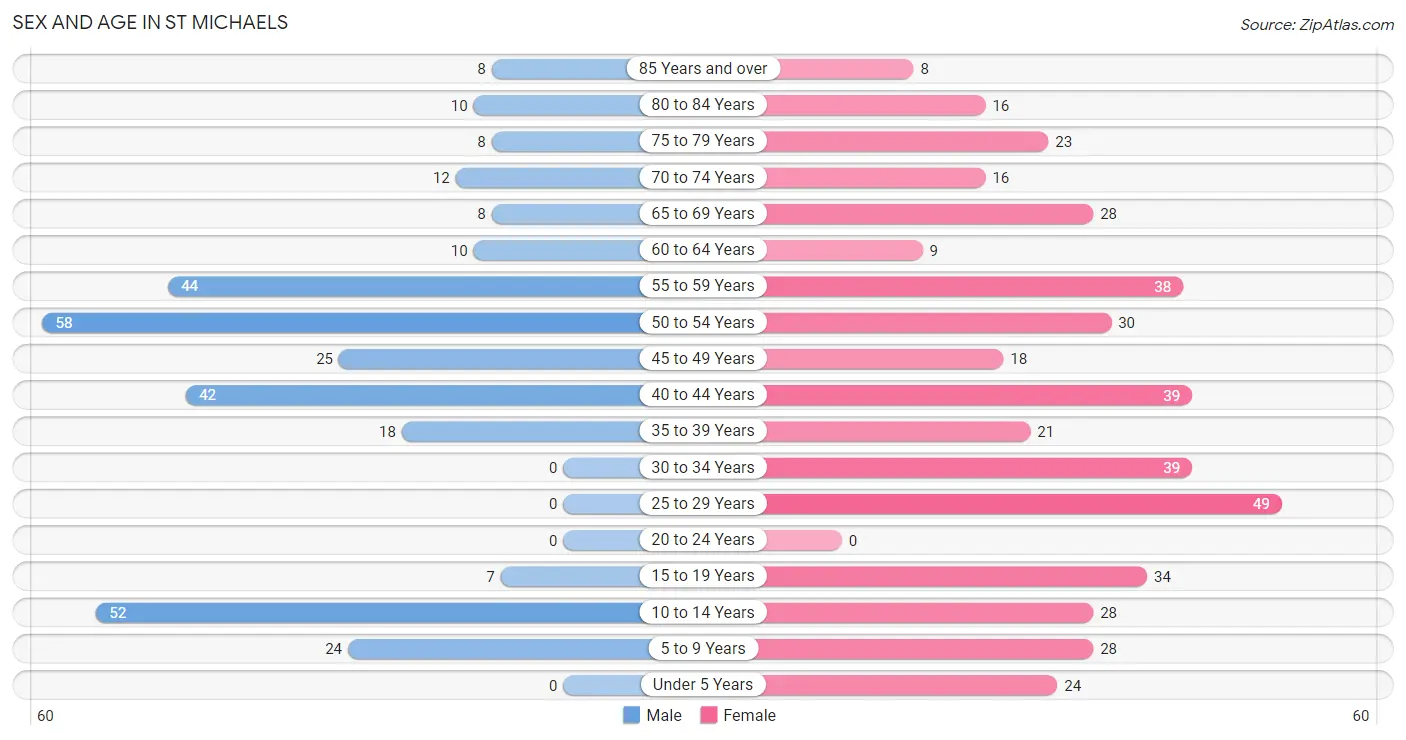
| Age Bracket | Male | Female |
| Under 5 Years | 0 (0.0%) | 24 (5.4%) |
| 5 to 9 Years | 24 (7.4%) | 28 (6.2%) |
| 10 to 14 Years | 52 (16.0%) | 28 (6.2%) |
| 15 to 19 Years | 7 (2.1%) | 34 (7.6%) |
| 20 to 24 Years | 0 (0.0%) | 0 (0.0%) |
| 25 to 29 Years | 0 (0.0%) | 49 (10.9%) |
| 30 to 34 Years | 0 (0.0%) | 39 (8.7%) |
| 35 to 39 Years | 18 (5.5%) | 21 (4.7%) |
| 40 to 44 Years | 42 (12.9%) | 39 (8.7%) |
| 45 to 49 Years | 25 (7.7%) | 18 (4.0%) |
| 50 to 54 Years | 58 (17.8%) | 30 (6.7%) |
| 55 to 59 Years | 44 (13.5%) | 38 (8.5%) |
| 60 to 64 Years | 10 (3.1%) | 9 (2.0%) |
| 65 to 69 Years | 8 (2.5%) | 28 (6.2%) |
| 70 to 74 Years | 12 (3.7%) | 16 (3.6%) |
| 75 to 79 Years | 8 (2.5%) | 23 (5.1%) |
| 80 to 84 Years | 10 (3.1%) | 16 (3.6%) |
| 85 Years and over | 8 (2.5%) | 8 (1.8%) |
| Total | 326 (100.0%) | 448 (100.0%) |
Families and Households in St Michaels
Median Family Size in St Michaels
The median family size in St Michaels is 4.54 persons per family, with single male/father families (12 | 7.8%) accounting for the largest median family size of 7.83 persons per family. On the other hand, single female/mother families (46 | 29.9%) represent the smallest median family size with 3.61 persons per family.
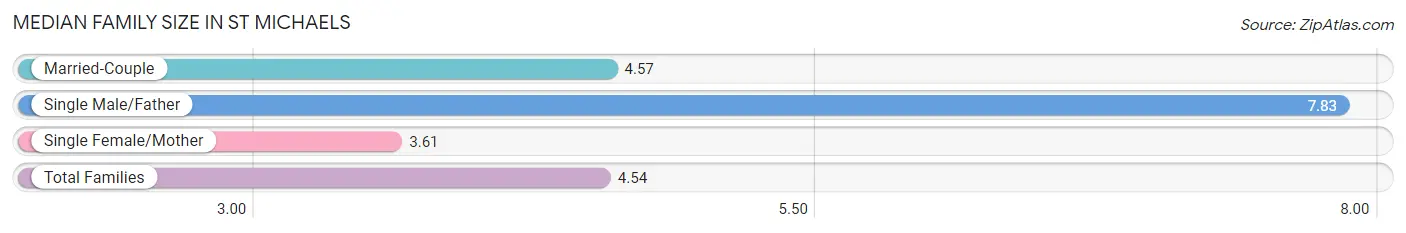
| Family Type | # Families | Family Size |
| Married-Couple | 96 (62.3%) | 4.57 |
| Single Male/Father | 12 (7.8%) | 7.83 |
| Single Female/Mother | 46 (29.9%) | 3.61 |
| Total Families | 154 (100.0%) | 4.54 |
Median Household Size in St Michaels
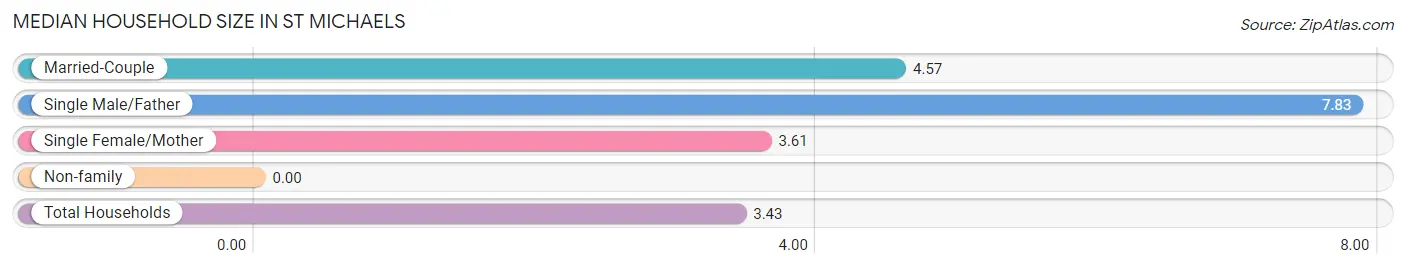
| Household Type | # Households | Household Size |
| Married-Couple | 96 (42.9%) | 4.57 |
| Single Male/Father | 12 (5.4%) | 7.83 |
| Single Female/Mother | 46 (20.5%) | 3.61 |
| Non-family | 70 (31.2%) | - |
| Total Households | 224 (100.0%) | 3.43 |
Household Size by Marriage Status in St Michaels
Out of a total of 224 households in St Michaels, 154 (68.8%) are family households, while 70 (31.2%) are nonfamily households. The most numerous type of family households are 2-person households, comprising 84, and the most common type of nonfamily households are 1-person households, comprising 70.
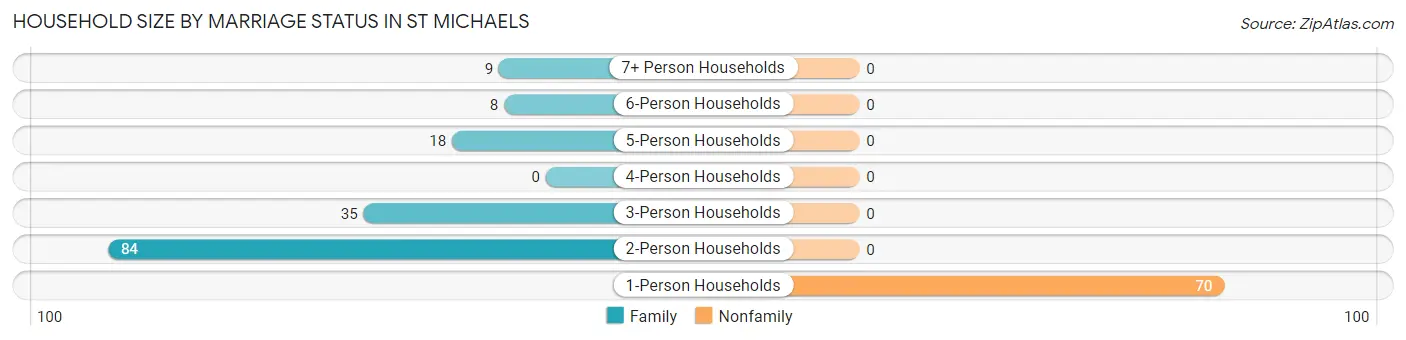
| Household Size | Family Households | Nonfamily Households |
| 1-Person Households | - | 70 (31.2%) |
| 2-Person Households | 84 (37.5%) | 0 (0.0%) |
| 3-Person Households | 35 (15.6%) | 0 (0.0%) |
| 4-Person Households | 0 (0.0%) | 0 (0.0%) |
| 5-Person Households | 18 (8.0%) | 0 (0.0%) |
| 6-Person Households | 8 (3.6%) | 0 (0.0%) |
| 7+ Person Households | 9 (4.0%) | 0 (0.0%) |
| Total | 154 (68.8%) | 70 (31.2%) |
Female Fertility in St Michaels
Fertility by Age in St Michaels
| Age Bracket | Women with Births | Births / 1,000 Women |
| 15 to 19 years | 0 (0.0%) | 0.0 |
| 20 to 34 years | 0 (0.0%) | 0.0 |
| 35 to 50 years | 0 (0.0%) | 0.0 |
| Total | 0 (0.0%) | 0.0 |
Fertility by Age by Marriage Status in St Michaels
| Age Bracket | Married | Unmarried |
| 15 to 19 years | 0 (0.0%) | 0 (0.0%) |
| 20 to 34 years | 0 (0.0%) | 0 (0.0%) |
| 35 to 50 years | 0 (0.0%) | 0 (0.0%) |
| Total | 0 (0.0%) | 0 (0.0%) |
Fertility by Education in St Michaels
| Educational Attainment | Women with Births | Births / 1,000 Women |
| Less than High School | 0 (0.0%) | 0.0 |
| High School Diploma | 0 (0.0%) | 0.0 |
| College or Associate's Degree | 0 (0.0%) | 0.0 |
| Bachelor's Degree | 0 (0.0%) | 0.0 |
| Graduate Degree | 0 (0.0%) | 0.0 |
| Total | 0 (0.0%) | 0.0 |
Fertility by Education by Marriage Status in St Michaels
| Educational Attainment | Married | Unmarried |
| Less than High School | 0 (0.0%) | 0 (0.0%) |
| High School Diploma | 0 (0.0%) | 0 (0.0%) |
| College or Associate's Degree | 0 (0.0%) | 0 (0.0%) |
| Bachelor's Degree | 0 (0.0%) | 0 (0.0%) |
| Graduate Degree | 0 (0.0%) | 0 (0.0%) |
| Total | 0 (0.0%) | 0 (0.0%) |
Employment Characteristics in St Michaels
Employment by Class of Employer in St Michaels
Among the 225 employed individuals in St Michaels, local government employees (89 | 39.6%), federal government employees (51 | 22.7%), and state government employees (38 | 16.9%) make up the most common classes of employment.
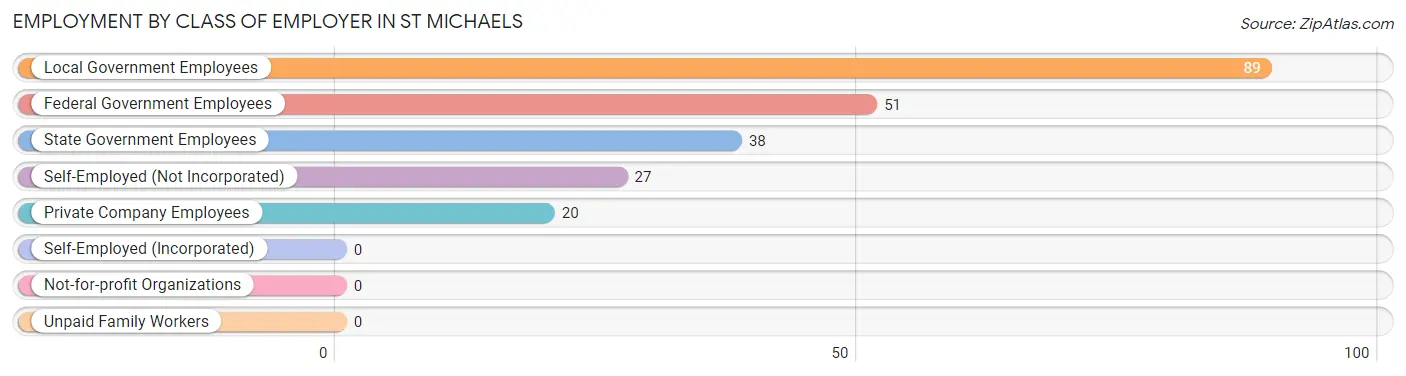
| Employer Class | # Employees | % Employees |
| Private Company Employees | 20 | 8.9% |
| Self-Employed (Incorporated) | 0 | 0.0% |
| Self-Employed (Not Incorporated) | 27 | 12.0% |
| Not-for-profit Organizations | 0 | 0.0% |
| Local Government Employees | 89 | 39.6% |
| State Government Employees | 38 | 16.9% |
| Federal Government Employees | 51 | 22.7% |
| Unpaid Family Workers | 0 | 0.0% |
| Total | 225 | 100.0% |
Employment Status by Age in St Michaels
According to the labor force statistics for St Michaels, out of the total population over 16 years of age (618), 40.9% or 253 individuals are in the labor force, with 11.1% or 28 of them unemployed. The age group with the highest labor force participation rate is 45 to 54 years, with 63.4% or 83 individuals in the labor force. Within the labor force, the 16 to 19 years age range has the highest percentage of unemployed individuals, with 100.0% or 7 of them being unemployed.
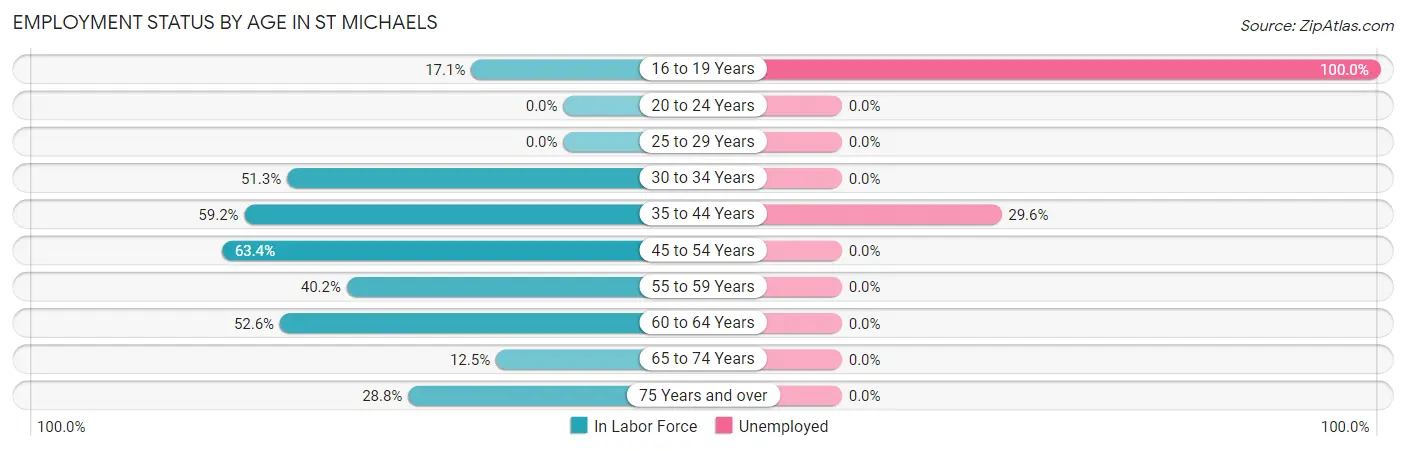
| Age Bracket | In Labor Force | Unemployed |
| 16 to 19 Years | 7 (17.1%) | 7 (100.0%) |
| 20 to 24 Years | 0 (0.0%) | 0 (0.0%) |
| 25 to 29 Years | 0 (0.0%) | 0 (0.0%) |
| 30 to 34 Years | 20 (51.3%) | 0 (0.0%) |
| 35 to 44 Years | 71 (59.2%) | 21 (29.6%) |
| 45 to 54 Years | 83 (63.4%) | 0 (0.0%) |
| 55 to 59 Years | 33 (40.2%) | 0 (0.0%) |
| 60 to 64 Years | 10 (52.6%) | 0 (0.0%) |
| 65 to 74 Years | 8 (12.5%) | 0 (0.0%) |
| 75 Years and over | 21 (28.8%) | 0 (0.0%) |
| Total | 253 (40.9%) | 28 (11.1%) |
Employment Status by Educational Attainment in St Michaels
According to labor force statistics for St Michaels, 49.3% of individuals (217) out of the total population between 25 and 64 years of age (440) are in the labor force, with 9.7% or 21 of them being unemployed. The group with the highest labor force participation rate are those with the educational attainment of bachelor's degree or higher, with 75.8% or 75 individuals in the labor force. Within the labor force, individuals with high school diploma education have the highest percentage of unemployment, with 40.4% or 21 of them being unemployed.
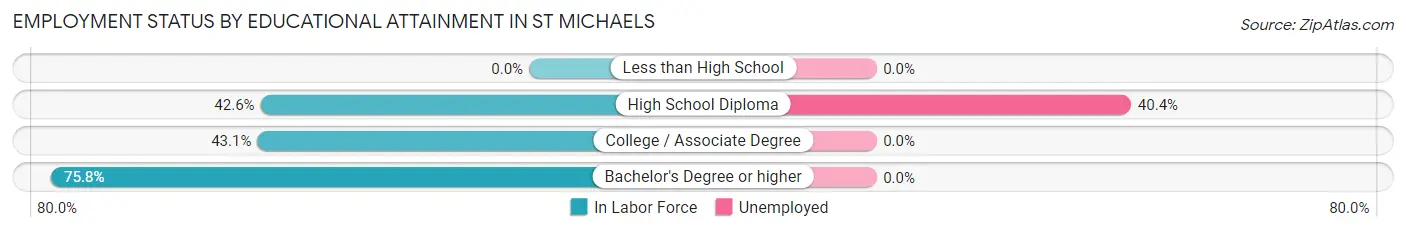
| Educational Attainment | In Labor Force | Unemployed |
| Less than High School | 0 (0.0%) | 0 (0.0%) |
| High School Diploma | 52 (42.6%) | 49 (40.4%) |
| College / Associate Degree | 90 (43.1%) | 0 (0.0%) |
| Bachelor's Degree or higher | 75 (75.8%) | 0 (0.0%) |
| Total | 217 (49.3%) | 43 (9.7%) |
Employment Occupations by Sex in St Michaels
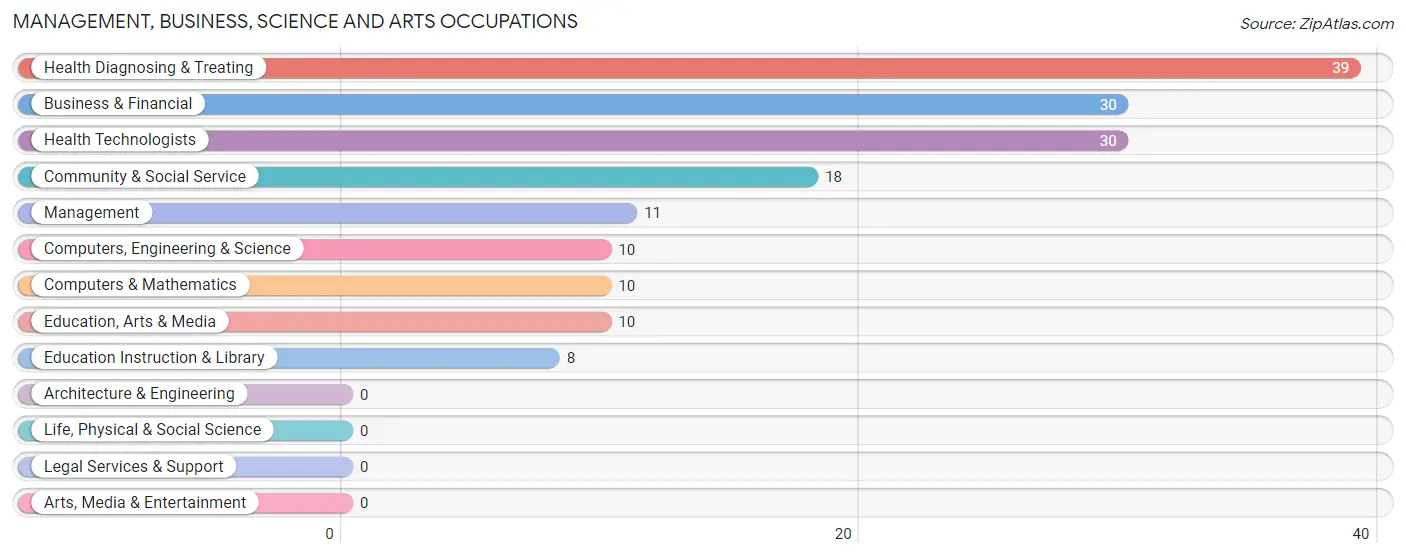
Management, Business, Science and Arts Occupations
The most common Management, Business, Science and Arts occupations in St Michaels are Health Diagnosing & Treating (39 | 17.3%), Business & Financial (30 | 13.3%), Health Technologists (30 | 13.3%), Community & Social Service (18 | 8.0%), and Management (11 | 4.9%).
Management, Business, Science and Arts Occupations by Sex
Within the Management, Business, Science and Arts occupations in St Michaels, the most male-oriented occupations are Education Instruction & Library (100.0%), Management (45.5%), and Community & Social Service (44.4%), while the most female-oriented occupations are Computers, Engineering & Science (100.0%), Computers & Mathematics (100.0%), and Education, Arts & Media (100.0%).
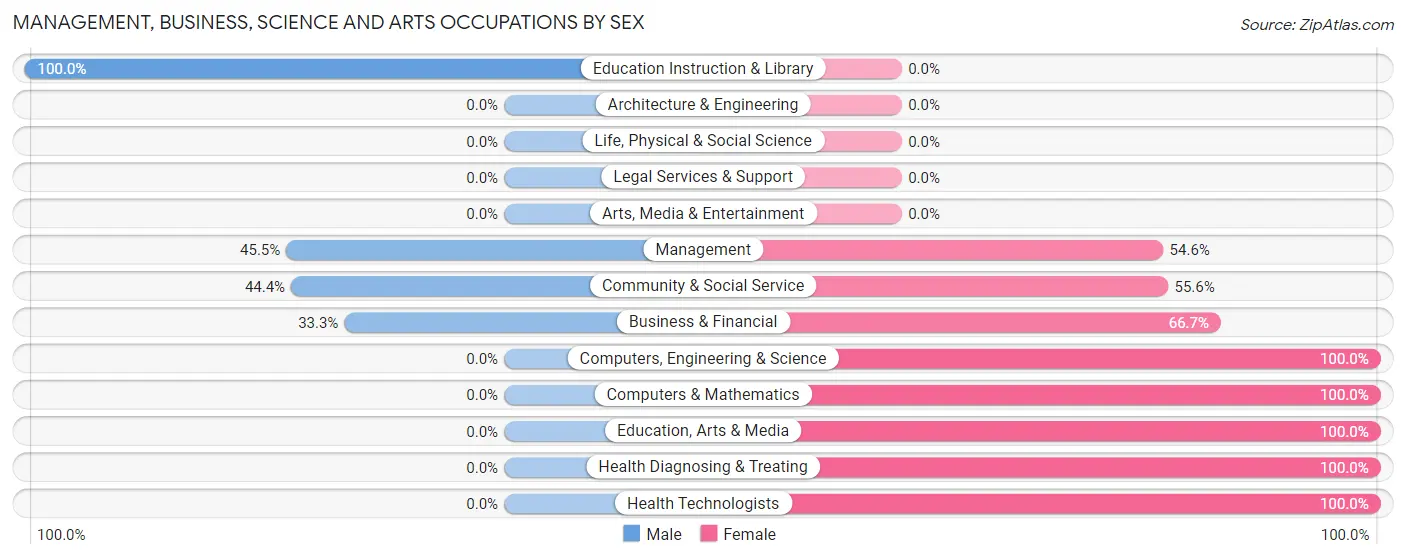
| Occupation | Male | Female |
| Management | 5 (45.5%) | 6 (54.5%) |
| Business & Financial | 10 (33.3%) | 20 (66.7%) |
| Computers, Engineering & Science | 0 (0.0%) | 10 (100.0%) |
| Computers & Mathematics | 0 (0.0%) | 10 (100.0%) |
| Architecture & Engineering | 0 (0.0%) | 0 (0.0%) |
| Life, Physical & Social Science | 0 (0.0%) | 0 (0.0%) |
| Community & Social Service | 8 (44.4%) | 10 (55.6%) |
| Education, Arts & Media | 0 (0.0%) | 10 (100.0%) |
| Legal Services & Support | 0 (0.0%) | 0 (0.0%) |
| Education Instruction & Library | 8 (100.0%) | 0 (0.0%) |
| Arts, Media & Entertainment | 0 (0.0%) | 0 (0.0%) |
| Health Diagnosing & Treating | 0 (0.0%) | 39 (100.0%) |
| Health Technologists | 0 (0.0%) | 30 (100.0%) |
| Total (Category) | 23 (21.3%) | 85 (78.7%) |
| Total (Overall) | 102 (45.3%) | 123 (54.7%) |
Services Occupations
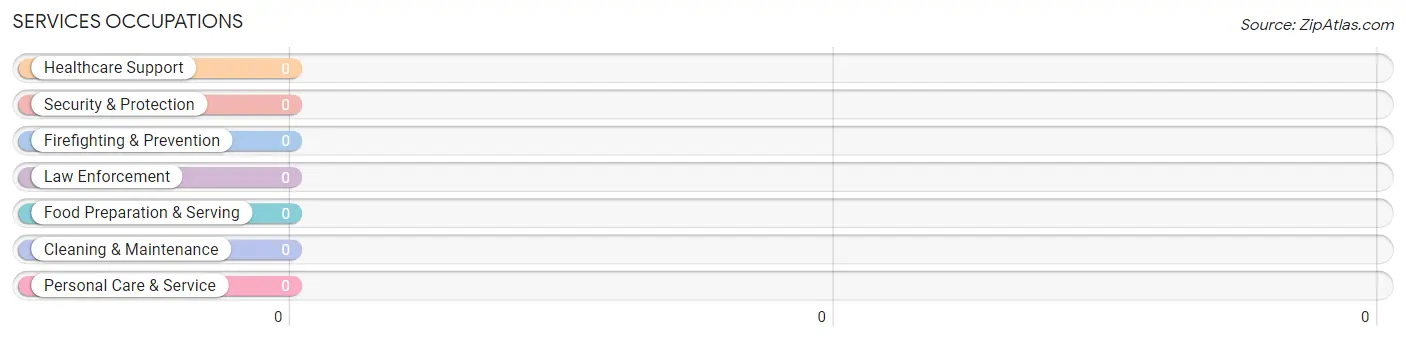
Services Occupations by Sex
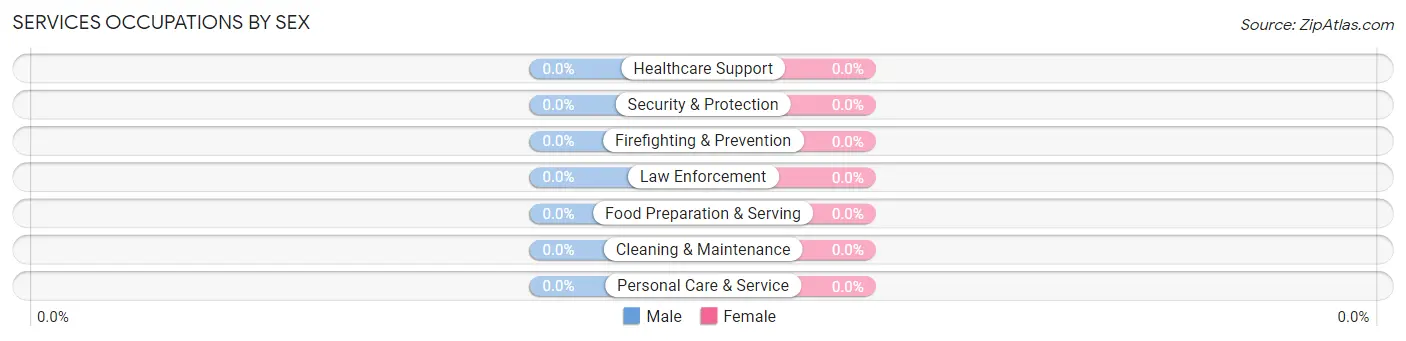
| Occupation | Male | Female |
| Healthcare Support | 0 (0.0%) | 0 (0.0%) |
| Security & Protection | 0 (0.0%) | 0 (0.0%) |
| Firefighting & Prevention | 0 (0.0%) | 0 (0.0%) |
| Law Enforcement | 0 (0.0%) | 0 (0.0%) |
| Food Preparation & Serving | 0 (0.0%) | 0 (0.0%) |
| Cleaning & Maintenance | 0 (0.0%) | 0 (0.0%) |
| Personal Care & Service | 0 (0.0%) | 0 (0.0%) |
| Total (Category) | 0 (0.0%) | 0 (0.0%) |
| Total (Overall) | 102 (45.3%) | 123 (54.7%) |
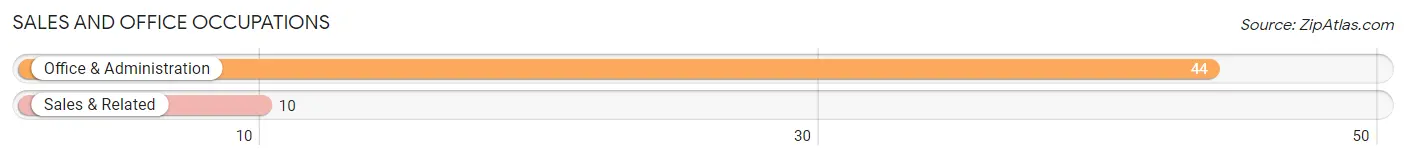
Sales and Office Occupations
The most common Sales and Office occupations in St Michaels are Office & Administration (44 | 19.6%), and Sales & Related (10 | 4.4%).
Sales and Office Occupations by Sex
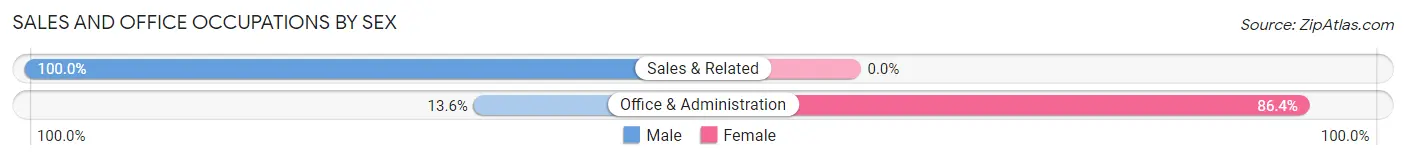
| Occupation | Male | Female |
| Sales & Related | 10 (100.0%) | 0 (0.0%) |
| Office & Administration | 6 (13.6%) | 38 (86.4%) |
| Total (Category) | 16 (29.6%) | 38 (70.4%) |
| Total (Overall) | 102 (45.3%) | 123 (54.7%) |
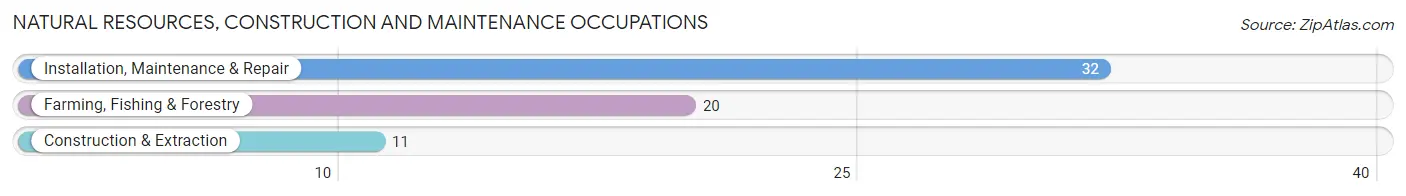
Natural Resources, Construction and Maintenance Occupations
The most common Natural Resources, Construction and Maintenance occupations in St Michaels are Installation, Maintenance & Repair (32 | 14.2%), Farming, Fishing & Forestry (20 | 8.9%), and Construction & Extraction (11 | 4.9%).
Natural Resources, Construction and Maintenance Occupations by Sex
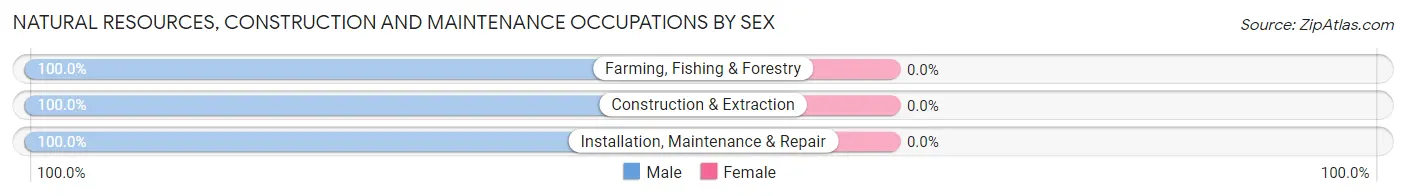
| Occupation | Male | Female |
| Farming, Fishing & Forestry | 20 (100.0%) | 0 (0.0%) |
| Construction & Extraction | 11 (100.0%) | 0 (0.0%) |
| Installation, Maintenance & Repair | 32 (100.0%) | 0 (0.0%) |
| Total (Category) | 63 (100.0%) | 0 (0.0%) |
| Total (Overall) | 102 (45.3%) | 123 (54.7%) |
Production, Transportation and Moving Occupations
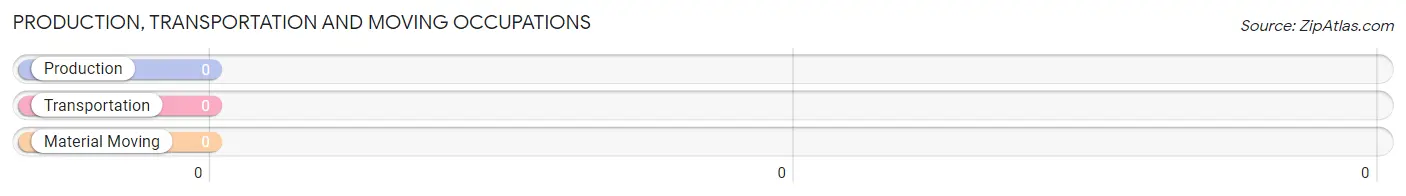
Production, Transportation and Moving Occupations by Sex
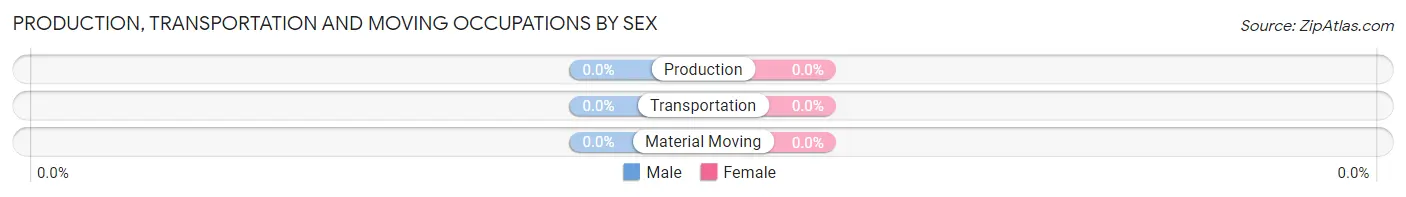
| Occupation | Male | Female |
| Production | 0 (0.0%) | 0 (0.0%) |
| Transportation | 0 (0.0%) | 0 (0.0%) |
| Material Moving | 0 (0.0%) | 0 (0.0%) |
| Total (Category) | 0 (0.0%) | 0 (0.0%) |
| Total (Overall) | 102 (45.3%) | 123 (54.7%) |
Employment Industries by Sex in St Michaels
Employment Industries in St Michaels
The major employment industries in St Michaels include Public Administration (80 | 35.6%), Health Care & Social Assistance (49 | 21.8%), Agriculture, Fishing & Hunting (25 | 11.1%), Professional & Scientific (20 | 8.9%), and Educational Services (19 | 8.4%).
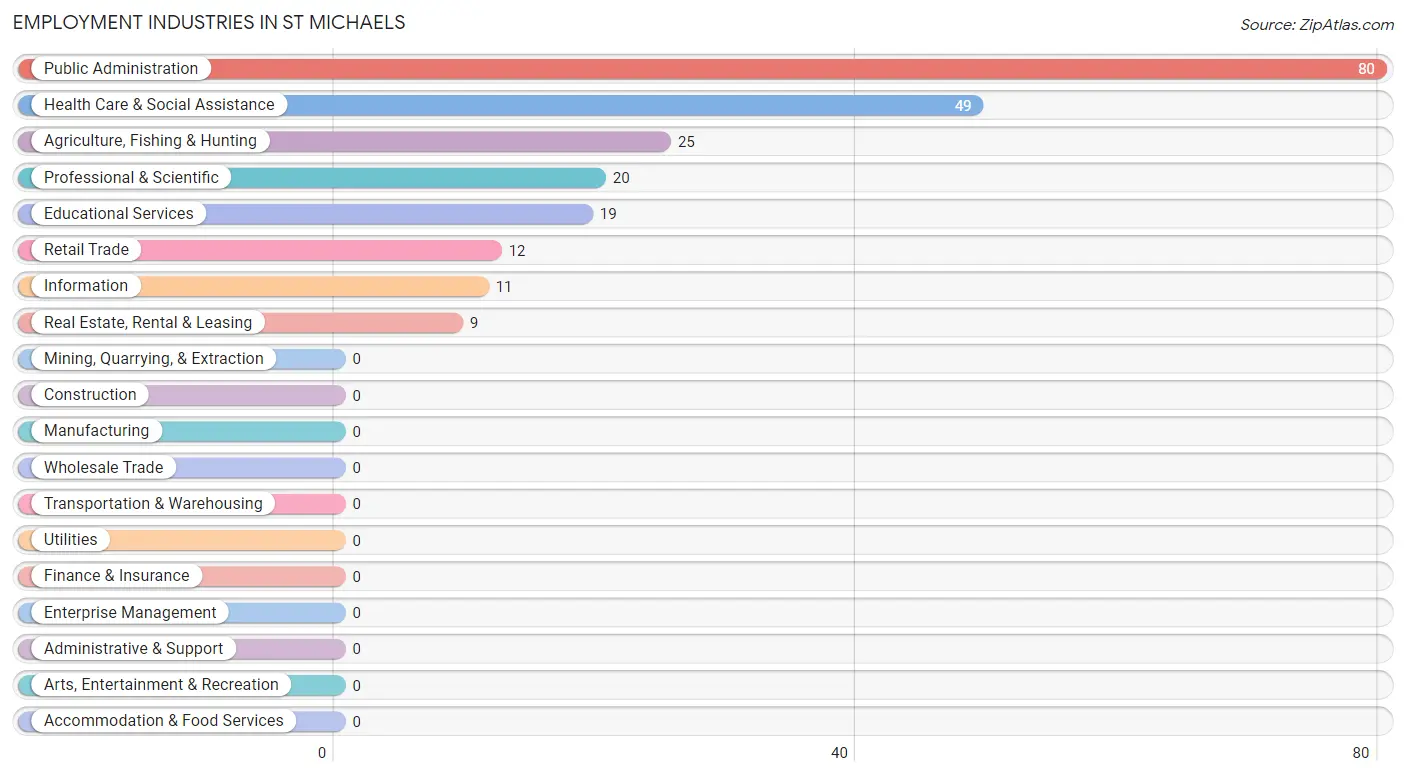
Employment Industries by Sex in St Michaels
The St Michaels industries that see more men than women are Agriculture, Fishing & Hunting (100.0%), Information (100.0%), and Real Estate, Rental & Leasing (100.0%), whereas the industries that tend to have a higher number of women are Health Care & Social Assistance (100.0%), Public Administration (72.5%), and Retail Trade (50.0%).
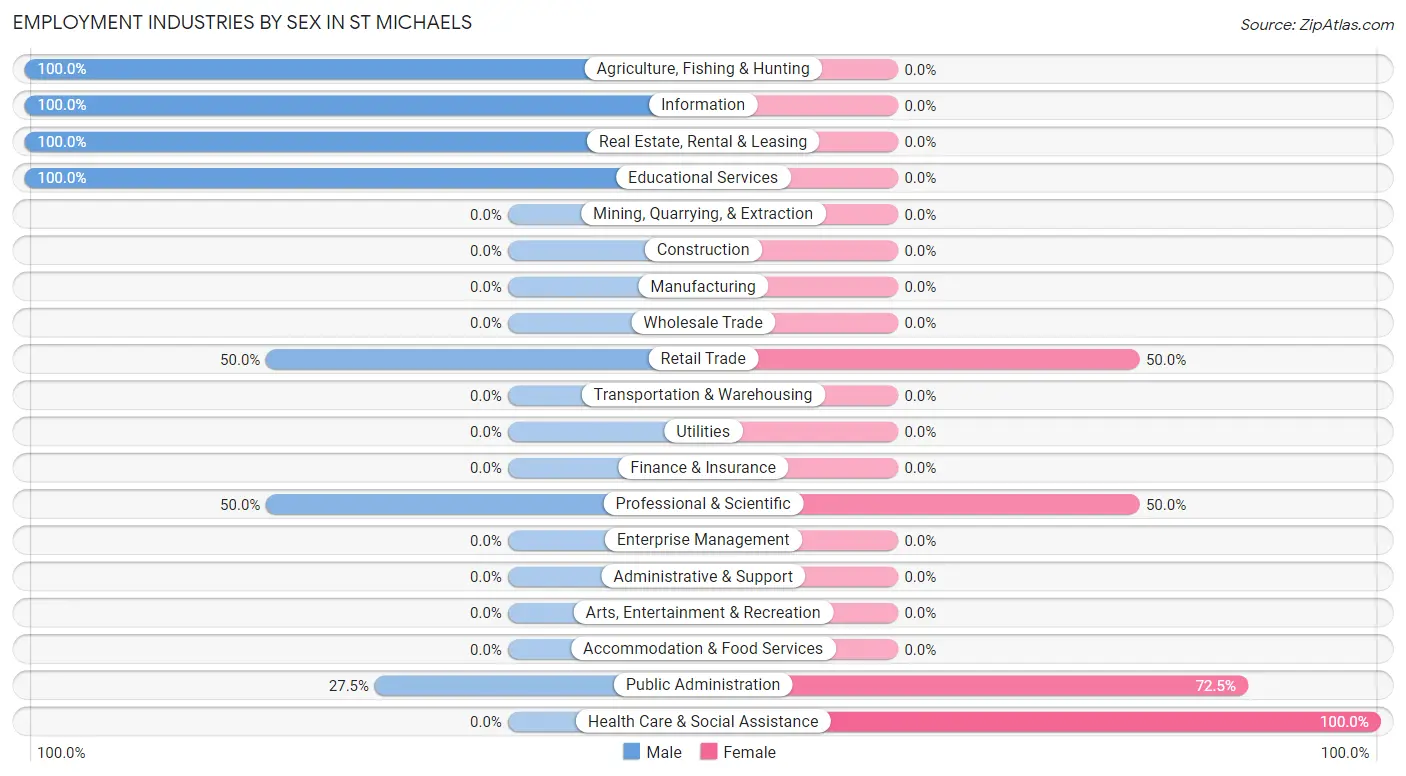
| Industry | Male | Female |
| Agriculture, Fishing & Hunting | 25 (100.0%) | 0 (0.0%) |
| Mining, Quarrying, & Extraction | 0 (0.0%) | 0 (0.0%) |
| Construction | 0 (0.0%) | 0 (0.0%) |
| Manufacturing | 0 (0.0%) | 0 (0.0%) |
| Wholesale Trade | 0 (0.0%) | 0 (0.0%) |
| Retail Trade | 6 (50.0%) | 6 (50.0%) |
| Transportation & Warehousing | 0 (0.0%) | 0 (0.0%) |
| Utilities | 0 (0.0%) | 0 (0.0%) |
| Information | 11 (100.0%) | 0 (0.0%) |
| Finance & Insurance | 0 (0.0%) | 0 (0.0%) |
| Real Estate, Rental & Leasing | 9 (100.0%) | 0 (0.0%) |
| Professional & Scientific | 10 (50.0%) | 10 (50.0%) |
| Enterprise Management | 0 (0.0%) | 0 (0.0%) |
| Administrative & Support | 0 (0.0%) | 0 (0.0%) |
| Educational Services | 19 (100.0%) | 0 (0.0%) |
| Health Care & Social Assistance | 0 (0.0%) | 49 (100.0%) |
| Arts, Entertainment & Recreation | 0 (0.0%) | 0 (0.0%) |
| Accommodation & Food Services | 0 (0.0%) | 0 (0.0%) |
| Public Administration | 22 (27.5%) | 58 (72.5%) |
| Total | 102 (45.3%) | 123 (54.7%) |
Education in St Michaels
School Enrollment in St Michaels
The most common levels of schooling among the 163 students in St Michaels are middle school (68 | 41.7%), elementary school (52 | 31.9%), and high school (34 | 20.9%).
| School Level | # Students | % Students |
| Nursery / Preschool | 0 | 0.0% |
| Kindergarten | 0 | 0.0% |
| Elementary School | 52 | 31.9% |
| Middle School | 68 | 41.7% |
| High School | 34 | 20.9% |
| College / Undergraduate | 9 | 5.5% |
| Graduate / Professional | 0 | 0.0% |
| Total | 163 | 100.0% |
School Enrollment by Age by Funding Source in St Michaels
| Age Bracket | Public School | Private School |
| 3 to 4 Year Olds | 0 (0.0%) | 0 (0.0%) |
| 5 to 9 Year Old | 40 (100.0%) | 0 (0.0%) |
| 10 to 14 Year Olds | 80 (100.0%) | 0 (0.0%) |
| 15 to 17 Year Olds | 14 (100.0%) | 0 (0.0%) |
| 18 to 19 Year Olds | 20 (100.0%) | 0 (0.0%) |
| 20 to 24 Year Olds | 0 (0.0%) | 0 (0.0%) |
| 25 to 34 Year Olds | 0 (0.0%) | 0 (0.0%) |
| 35 Years and over | 9 (100.0%) | 0 (0.0%) |
| Total | 163 (100.0%) | 0 (0.0%) |
Educational Attainment by Field of Study in St Michaels
Science & technology (97 | 50.0%), education (36 | 18.6%), business (26 | 13.4%), computers & mathematics (10 | 5.1%), and social sciences (10 | 5.1%) are the most common fields of study among 194 individuals in St Michaels who have obtained a bachelor's degree or higher.
| Field of Study | # Graduates | % Graduates |
| Computers & Mathematics | 10 | 5.1% |
| Bio, Nature & Agricultural | 0 | 0.0% |
| Physical & Health Sciences | 0 | 0.0% |
| Psychology | 0 | 0.0% |
| Social Sciences | 10 | 5.1% |
| Engineering | 5 | 2.6% |
| Multidisciplinary Studies | 10 | 5.1% |
| Science & Technology | 97 | 50.0% |
| Business | 26 | 13.4% |
| Education | 36 | 18.6% |
| Literature & Languages | 0 | 0.0% |
| Liberal Arts & History | 0 | 0.0% |
| Visual & Performing Arts | 0 | 0.0% |
| Communications | 0 | 0.0% |
| Arts & Humanities | 0 | 0.0% |
| Total | 194 | 100.0% |
Transportation & Commute in St Michaels
Vehicle Availability by Sex in St Michaels
The most prevalent vehicle ownership categories in St Michaels are males with 1 vehicle (31, accounting for 32.0%) and females with 1 vehicle (28, making up 25.2%).
| Vehicles Available | Male | Female |
| No Vehicle | 0 (0.0%) | 0 (0.0%) |
| 1 Vehicle | 31 (32.0%) | 28 (22.8%) |
| 2 Vehicles | 27 (27.8%) | 20 (16.3%) |
| 3 Vehicles | 6 (6.2%) | 24 (19.5%) |
| 4 Vehicles | 22 (22.7%) | 21 (17.1%) |
| 5 or more Vehicles | 11 (11.3%) | 30 (24.4%) |
| Total | 97 (100.0%) | 123 (100.0%) |
Commute Time in St Michaels
The most frequently occuring commute durations in St Michaels are 15 to 19 minutes (97 commuters, 47.3%), 30 to 34 minutes (72 commuters, 35.1%), and 60 to 89 minutes (21 commuters, 10.2%).
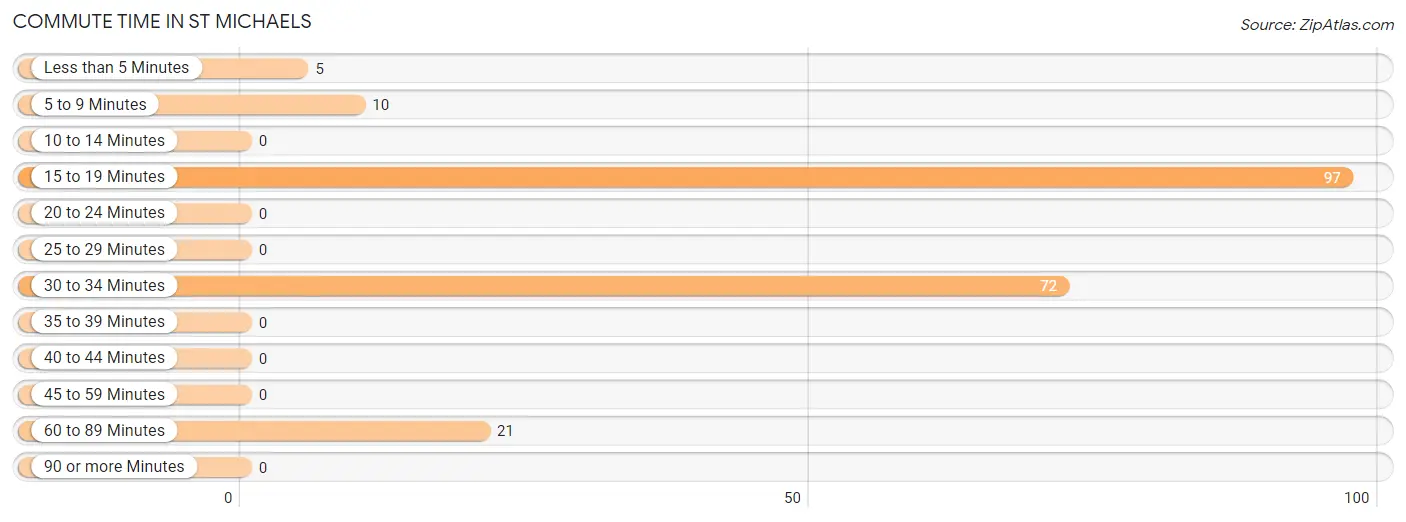
| Commute Time | # Commuters | % Commuters |
| Less than 5 Minutes | 5 | 2.4% |
| 5 to 9 Minutes | 10 | 4.9% |
| 10 to 14 Minutes | 0 | 0.0% |
| 15 to 19 Minutes | 97 | 47.3% |
| 20 to 24 Minutes | 0 | 0.0% |
| 25 to 29 Minutes | 0 | 0.0% |
| 30 to 34 Minutes | 72 | 35.1% |
| 35 to 39 Minutes | 0 | 0.0% |
| 40 to 44 Minutes | 0 | 0.0% |
| 45 to 59 Minutes | 0 | 0.0% |
| 60 to 89 Minutes | 21 | 10.2% |
| 90 or more Minutes | 0 | 0.0% |
Commute Time by Sex in St Michaels
The most common commute times in St Michaels are 30 to 34 minutes (53 commuters, 52.0%) for males and 15 to 19 minutes (63 commuters, 61.2%) for females.
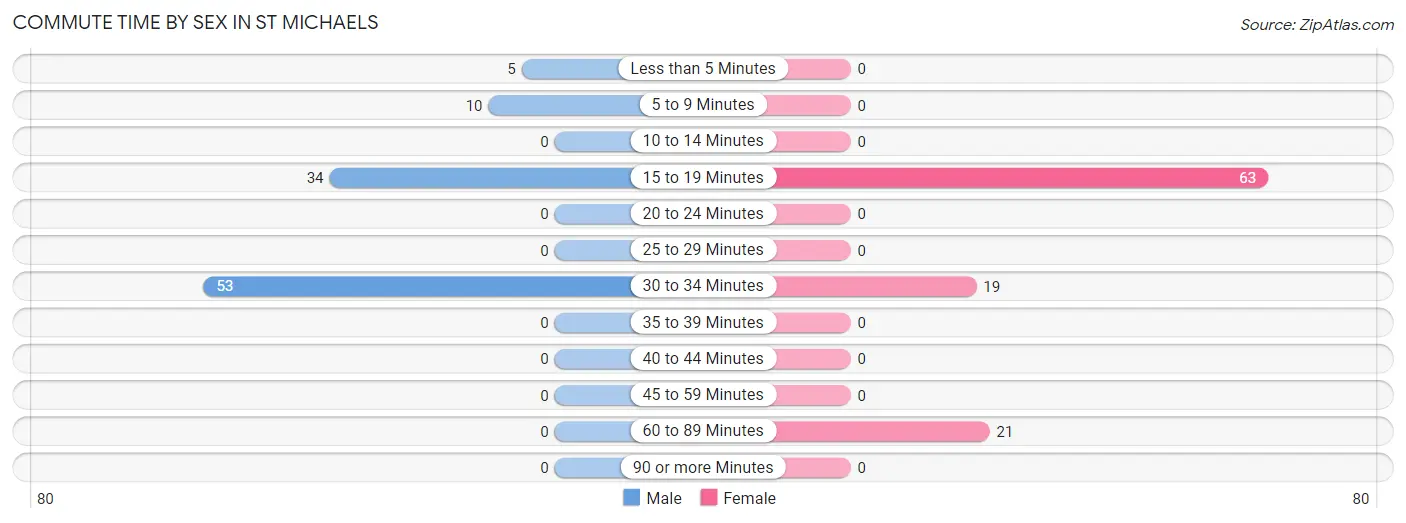
| Commute Time | Male | Female |
| Less than 5 Minutes | 5 (4.9%) | 0 (0.0%) |
| 5 to 9 Minutes | 10 (9.8%) | 0 (0.0%) |
| 10 to 14 Minutes | 0 (0.0%) | 0 (0.0%) |
| 15 to 19 Minutes | 34 (33.3%) | 63 (61.2%) |
| 20 to 24 Minutes | 0 (0.0%) | 0 (0.0%) |
| 25 to 29 Minutes | 0 (0.0%) | 0 (0.0%) |
| 30 to 34 Minutes | 53 (52.0%) | 19 (18.4%) |
| 35 to 39 Minutes | 0 (0.0%) | 0 (0.0%) |
| 40 to 44 Minutes | 0 (0.0%) | 0 (0.0%) |
| 45 to 59 Minutes | 0 (0.0%) | 0 (0.0%) |
| 60 to 89 Minutes | 0 (0.0%) | 21 (20.4%) |
| 90 or more Minutes | 0 (0.0%) | 0 (0.0%) |
Time of Departure to Work by Sex in St Michaels
The most frequent times of departure to work in St Michaels are 7:30 AM to 7:59 AM (72, 70.6%) for males and 7:30 AM to 7:59 AM (67, 65.0%) for females.
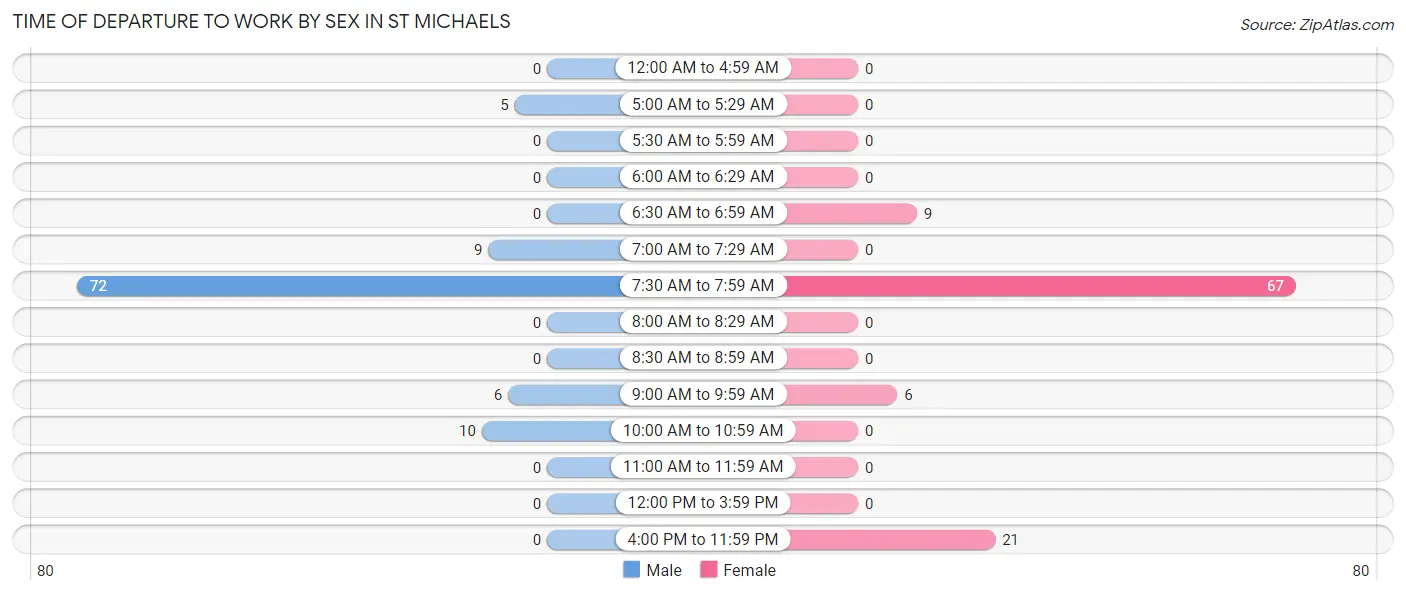
| Time of Departure | Male | Female |
| 12:00 AM to 4:59 AM | 0 (0.0%) | 0 (0.0%) |
| 5:00 AM to 5:29 AM | 5 (4.9%) | 0 (0.0%) |
| 5:30 AM to 5:59 AM | 0 (0.0%) | 0 (0.0%) |
| 6:00 AM to 6:29 AM | 0 (0.0%) | 0 (0.0%) |
| 6:30 AM to 6:59 AM | 0 (0.0%) | 9 (8.7%) |
| 7:00 AM to 7:29 AM | 9 (8.8%) | 0 (0.0%) |
| 7:30 AM to 7:59 AM | 72 (70.6%) | 67 (65.0%) |
| 8:00 AM to 8:29 AM | 0 (0.0%) | 0 (0.0%) |
| 8:30 AM to 8:59 AM | 0 (0.0%) | 0 (0.0%) |
| 9:00 AM to 9:59 AM | 6 (5.9%) | 6 (5.8%) |
| 10:00 AM to 10:59 AM | 10 (9.8%) | 0 (0.0%) |
| 11:00 AM to 11:59 AM | 0 (0.0%) | 0 (0.0%) |
| 12:00 PM to 3:59 PM | 0 (0.0%) | 0 (0.0%) |
| 4:00 PM to 11:59 PM | 0 (0.0%) | 21 (20.4%) |
| Total | 102 (100.0%) | 103 (100.0%) |
Housing Occupancy in St Michaels
Occupancy by Ownership in St Michaels
Of the total 224 dwellings in St Michaels, owner-occupied units account for 200 (89.3%), while renter-occupied units make up 24 (10.7%).
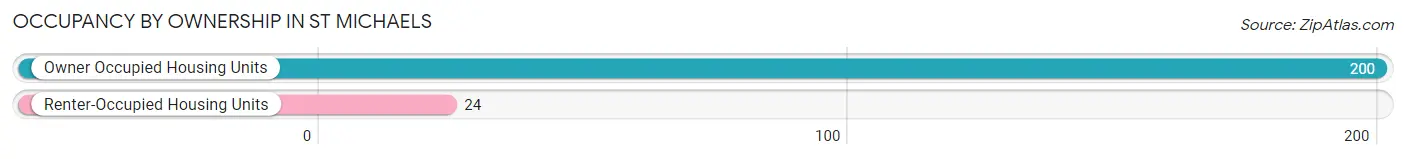
| Occupancy | # Housing Units | % Housing Units |
| Owner Occupied Housing Units | 200 | 89.3% |
| Renter-Occupied Housing Units | 24 | 10.7% |
| Total Occupied Housing Units | 224 | 100.0% |
Occupancy by Household Size in St Michaels
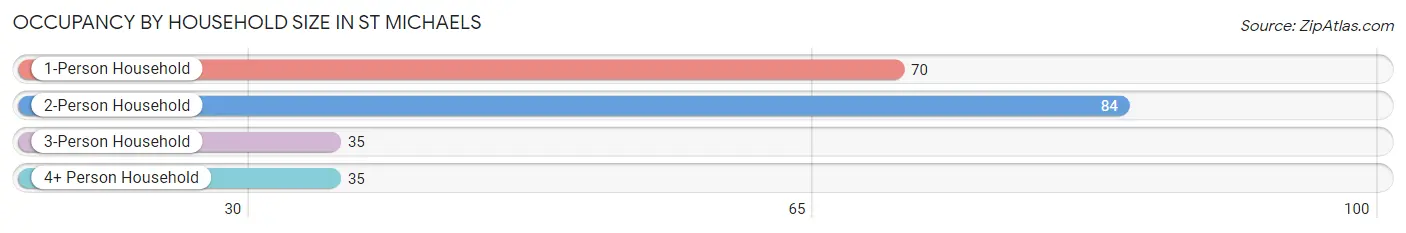
| Household Size | # Housing Units | % Housing Units |
| 1-Person Household | 70 | 31.2% |
| 2-Person Household | 84 | 37.5% |
| 3-Person Household | 35 | 15.6% |
| 4+ Person Household | 35 | 15.6% |
| Total Housing Units | 224 | 100.0% |
Occupancy by Ownership by Household Size in St Michaels
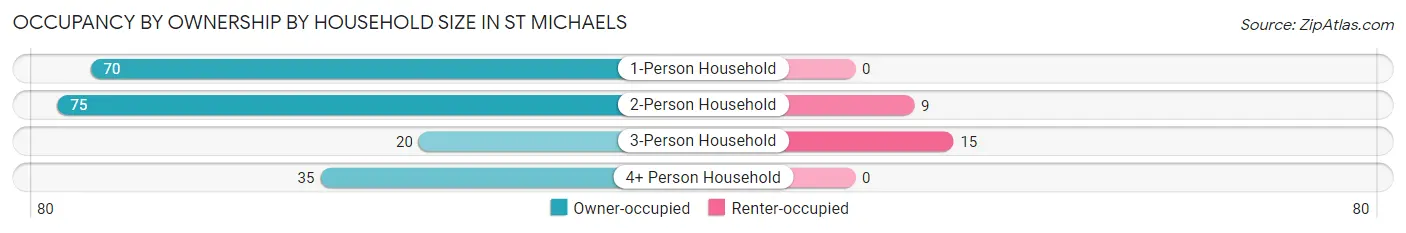
| Household Size | Owner-occupied | Renter-occupied |
| 1-Person Household | 70 (100.0%) | 0 (0.0%) |
| 2-Person Household | 75 (89.3%) | 9 (10.7%) |
| 3-Person Household | 20 (57.1%) | 15 (42.9%) |
| 4+ Person Household | 35 (100.0%) | 0 (0.0%) |
| Total Housing Units | 200 (89.3%) | 24 (10.7%) |
Occupancy by Educational Attainment in St Michaels
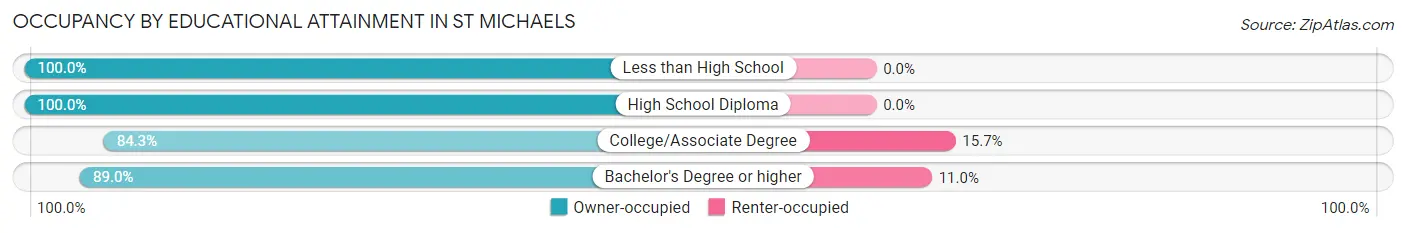
| Household Size | Owner-occupied | Renter-occupied |
| Less than High School | 26 (100.0%) | 0 (0.0%) |
| High School Diploma | 10 (100.0%) | 0 (0.0%) |
| College/Associate Degree | 59 (84.3%) | 11 (15.7%) |
| Bachelor's Degree or higher | 105 (89.0%) | 13 (11.0%) |
Occupancy by Age of Householder in St Michaels
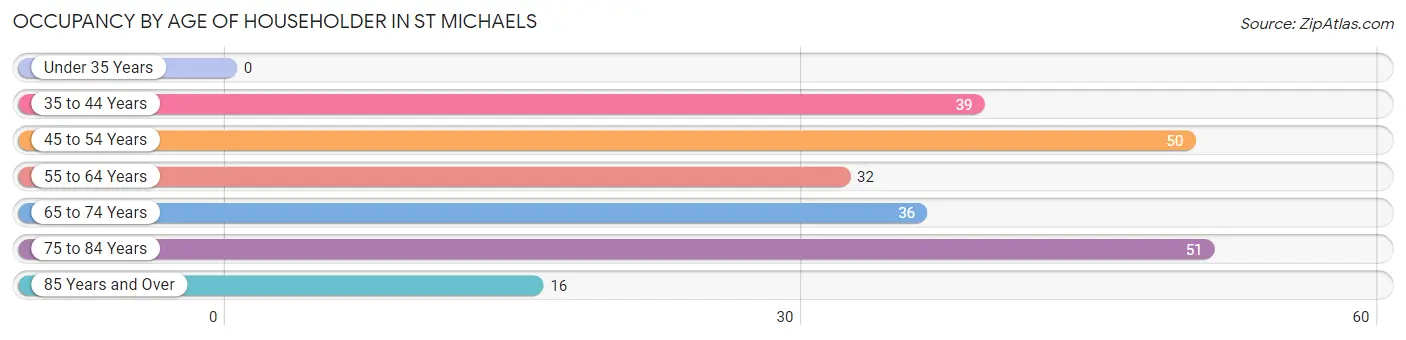
| Age Bracket | # Households | % Households |
| Under 35 Years | 0 | 0.0% |
| 35 to 44 Years | 39 | 17.4% |
| 45 to 54 Years | 50 | 22.3% |
| 55 to 64 Years | 32 | 14.3% |
| 65 to 74 Years | 36 | 16.1% |
| 75 to 84 Years | 51 | 22.8% |
| 85 Years and Over | 16 | 7.1% |
| Total | 224 | 100.0% |
Housing Finances in St Michaels
Median Income by Occupancy in St Michaels
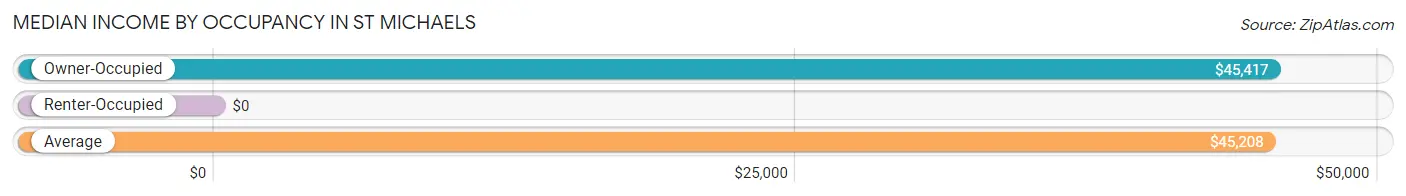
| Occupancy Type | # Households | Median Income |
| Owner-Occupied | 200 (89.3%) | $45,417 |
| Renter-Occupied | 24 (10.7%) | $0 |
| Average | 224 (100.0%) | $45,208 |
Occupancy by Householder Income Bracket in St Michaels
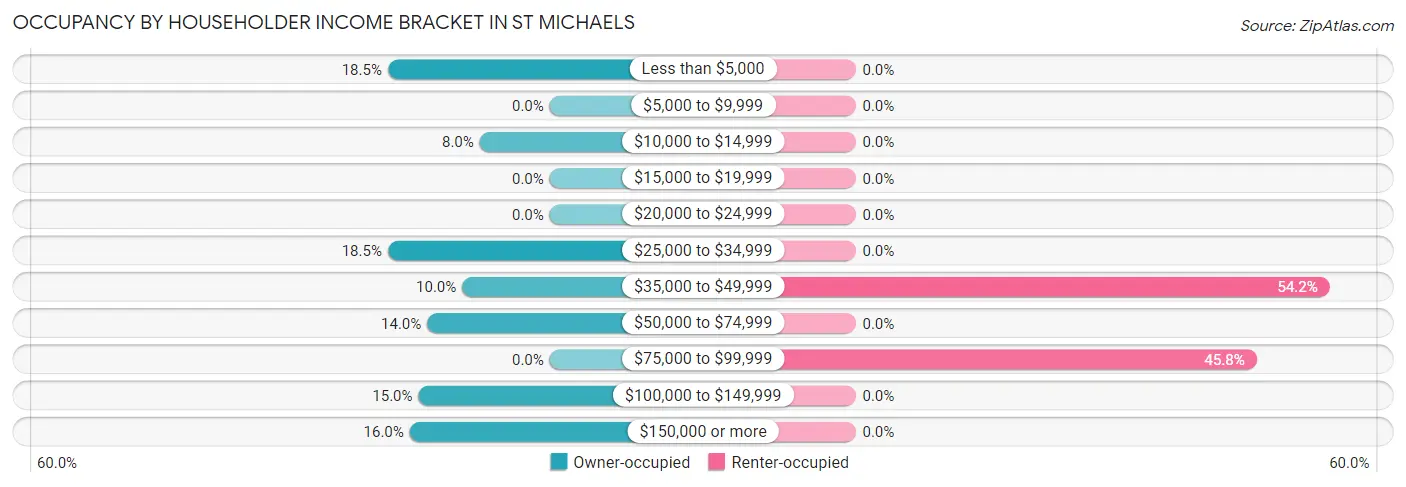
| Income Bracket | Owner-occupied | Renter-occupied |
| Less than $5,000 | 37 (18.5%) | 0 (0.0%) |
| $5,000 to $9,999 | 0 (0.0%) | 0 (0.0%) |
| $10,000 to $14,999 | 16 (8.0%) | 0 (0.0%) |
| $15,000 to $19,999 | 0 (0.0%) | 0 (0.0%) |
| $20,000 to $24,999 | 0 (0.0%) | 0 (0.0%) |
| $25,000 to $34,999 | 37 (18.5%) | 0 (0.0%) |
| $35,000 to $49,999 | 20 (10.0%) | 13 (54.2%) |
| $50,000 to $74,999 | 28 (14.0%) | 0 (0.0%) |
| $75,000 to $99,999 | 0 (0.0%) | 11 (45.8%) |
| $100,000 to $149,999 | 30 (15.0%) | 0 (0.0%) |
| $150,000 or more | 32 (16.0%) | 0 (0.0%) |
| Total | 200 (100.0%) | 24 (100.0%) |
Monthly Housing Cost Tiers in St Michaels
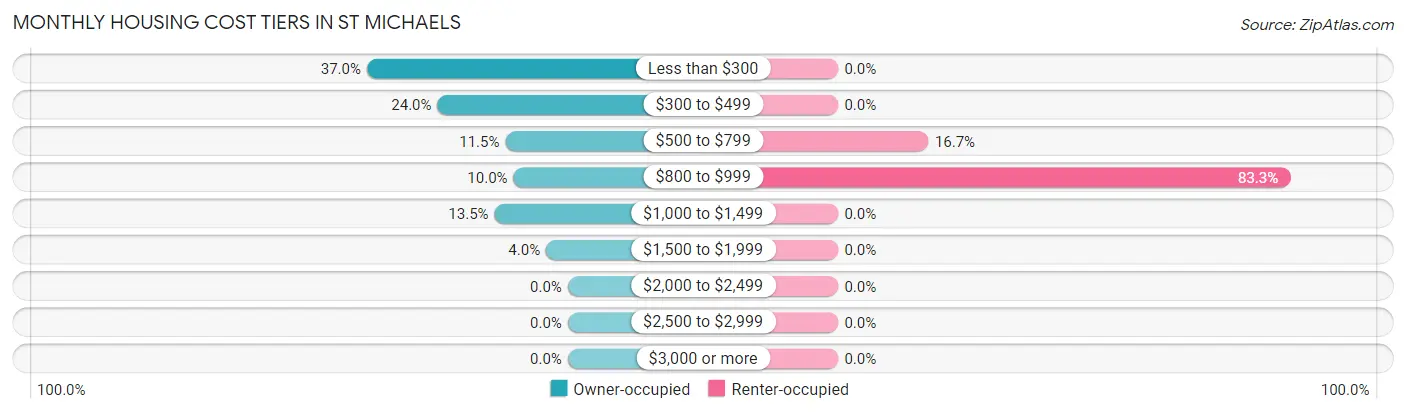
| Monthly Cost | Owner-occupied | Renter-occupied |
| Less than $300 | 74 (37.0%) | 0 (0.0%) |
| $300 to $499 | 48 (24.0%) | 0 (0.0%) |
| $500 to $799 | 23 (11.5%) | 4 (16.7%) |
| $800 to $999 | 20 (10.0%) | 20 (83.3%) |
| $1,000 to $1,499 | 27 (13.5%) | 0 (0.0%) |
| $1,500 to $1,999 | 8 (4.0%) | 0 (0.0%) |
| $2,000 to $2,499 | 0 (0.0%) | 0 (0.0%) |
| $2,500 to $2,999 | 0 (0.0%) | 0 (0.0%) |
| $3,000 or more | 0 (0.0%) | 0 (0.0%) |
| Total | 200 (100.0%) | 24 (100.0%) |
Physical Housing Characteristics in St Michaels
Housing Structures in St Michaels
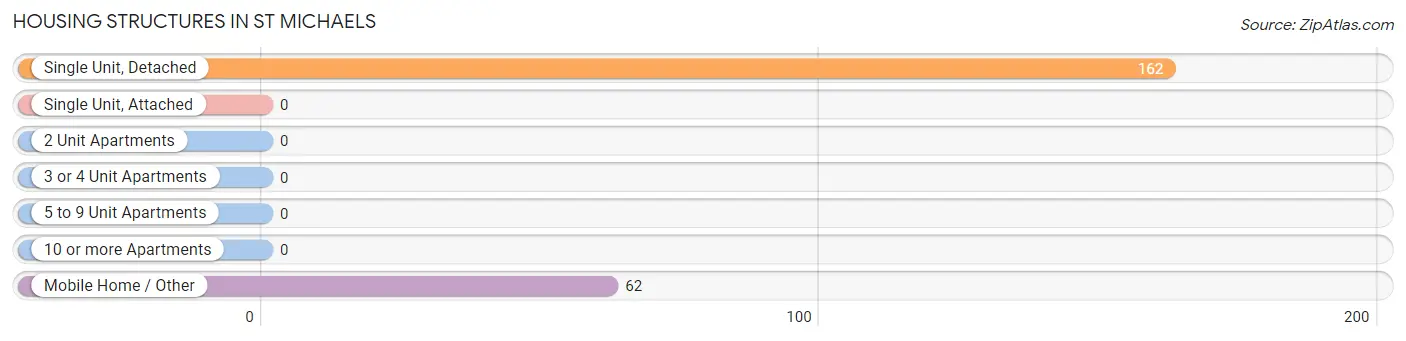
| Structure Type | # Housing Units | % Housing Units |
| Single Unit, Detached | 162 | 72.3% |
| Single Unit, Attached | 0 | 0.0% |
| 2 Unit Apartments | 0 | 0.0% |
| 3 or 4 Unit Apartments | 0 | 0.0% |
| 5 to 9 Unit Apartments | 0 | 0.0% |
| 10 or more Apartments | 0 | 0.0% |
| Mobile Home / Other | 62 | 27.7% |
| Total | 224 | 100.0% |
Housing Structures by Occupancy in St Michaels
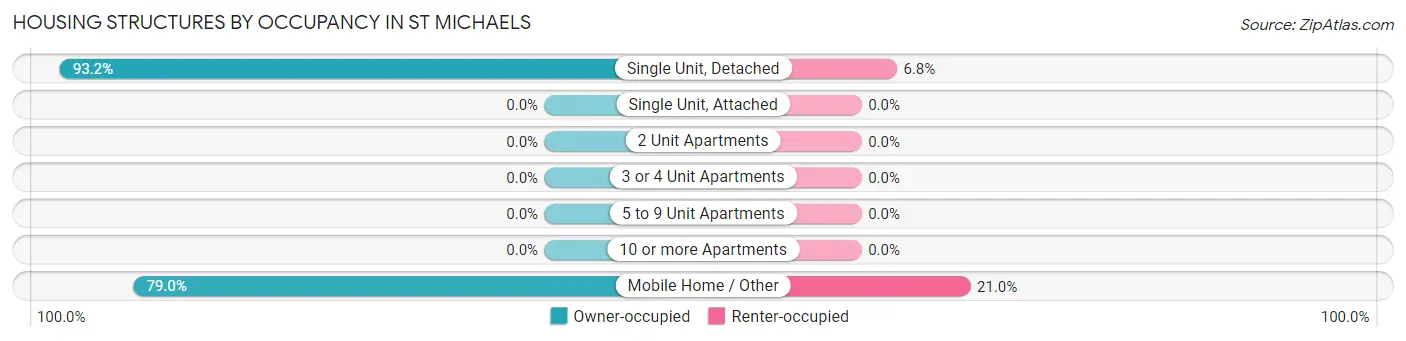
| Structure Type | Owner-occupied | Renter-occupied |
| Single Unit, Detached | 151 (93.2%) | 11 (6.8%) |
| Single Unit, Attached | 0 (0.0%) | 0 (0.0%) |
| 2 Unit Apartments | 0 (0.0%) | 0 (0.0%) |
| 3 or 4 Unit Apartments | 0 (0.0%) | 0 (0.0%) |
| 5 to 9 Unit Apartments | 0 (0.0%) | 0 (0.0%) |
| 10 or more Apartments | 0 (0.0%) | 0 (0.0%) |
| Mobile Home / Other | 49 (79.0%) | 13 (21.0%) |
| Total | 200 (89.3%) | 24 (10.7%) |
Housing Structures by Number of Rooms in St Michaels
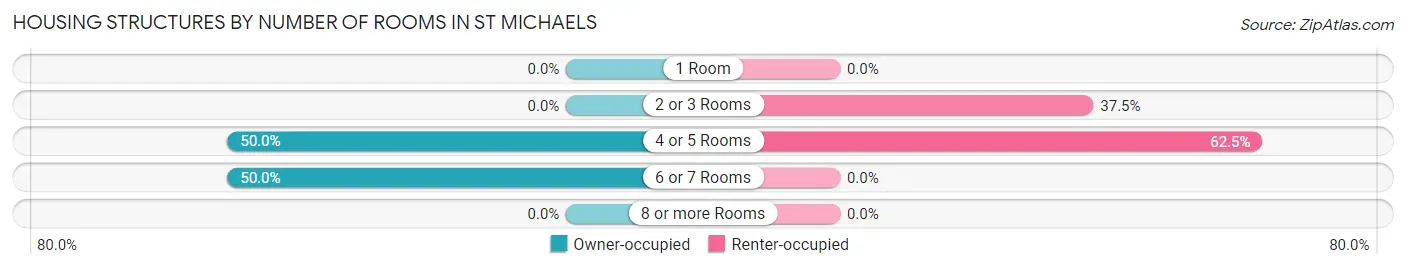
| Number of Rooms | Owner-occupied | Renter-occupied |
| 1 Room | 0 (0.0%) | 0 (0.0%) |
| 2 or 3 Rooms | 0 (0.0%) | 9 (37.5%) |
| 4 or 5 Rooms | 100 (50.0%) | 15 (62.5%) |
| 6 or 7 Rooms | 100 (50.0%) | 0 (0.0%) |
| 8 or more Rooms | 0 (0.0%) | 0 (0.0%) |
| Total | 200 (100.0%) | 24 (100.0%) |
Housing Structure by Heating Type in St Michaels
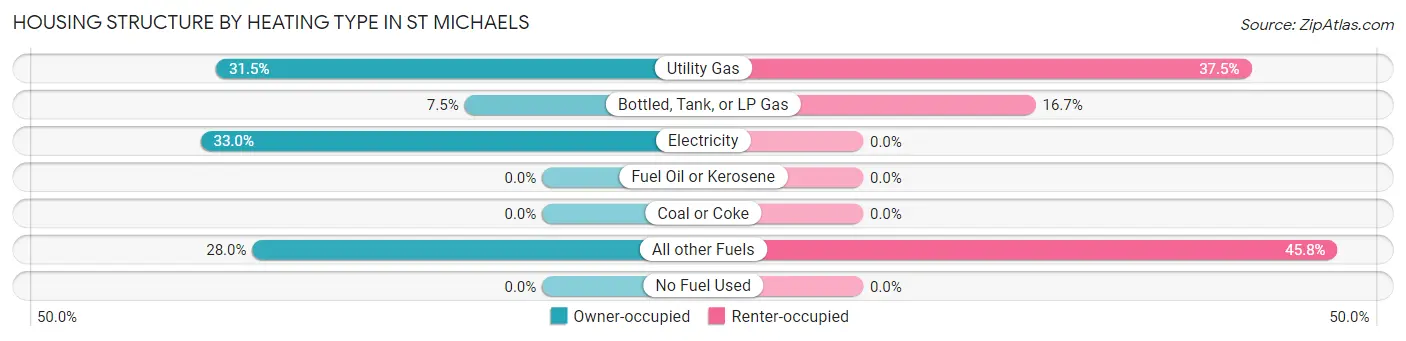
| Heating Type | Owner-occupied | Renter-occupied |
| Utility Gas | 63 (31.5%) | 9 (37.5%) |
| Bottled, Tank, or LP Gas | 15 (7.5%) | 4 (16.7%) |
| Electricity | 66 (33.0%) | 0 (0.0%) |
| Fuel Oil or Kerosene | 0 (0.0%) | 0 (0.0%) |
| Coal or Coke | 0 (0.0%) | 0 (0.0%) |
| All other Fuels | 56 (28.0%) | 11 (45.8%) |
| No Fuel Used | 0 (0.0%) | 0 (0.0%) |
| Total | 200 (100.0%) | 24 (100.0%) |
Household Vehicle Usage in St Michaels
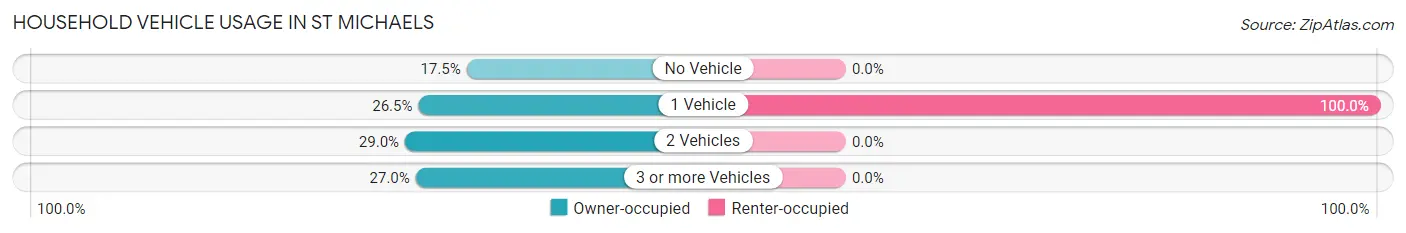
| Vehicles per Household | Owner-occupied | Renter-occupied |
| No Vehicle | 35 (17.5%) | 0 (0.0%) |
| 1 Vehicle | 53 (26.5%) | 24 (100.0%) |
| 2 Vehicles | 58 (29.0%) | 0 (0.0%) |
| 3 or more Vehicles | 54 (27.0%) | 0 (0.0%) |
| Total | 200 (100.0%) | 24 (100.0%) |
Real Estate & Mortgages in St Michaels
Real Estate and Mortgage Overview in St Michaels
| Characteristic | Without Mortgage | With Mortgage |
| Housing Units | 136 | 64 |
| Median Property Value | $94,400 | $205,900 |
| Median Household Income | $46,042 | $10 |
| Monthly Housing Costs | $294 | $0 |
| Real Estate Taxes | - | - |
Property Value by Mortgage Status in St Michaels
| Property Value | Without Mortgage | With Mortgage |
| Less than $50,000 | 44 (32.4%) | 0 (0.0%) |
| $50,000 to $99,999 | 29 (21.3%) | 0 (0.0%) |
| $100,000 to $299,999 | 63 (46.3%) | 56 (87.5%) |
| $300,000 to $499,999 | 0 (0.0%) | 8 (12.5%) |
| $500,000 to $749,999 | 0 (0.0%) | 0 (0.0%) |
| $750,000 to $999,999 | 0 (0.0%) | 0 (0.0%) |
| $1,000,000 or more | 0 (0.0%) | 0 (0.0%) |
| Total | 136 (100.0%) | 64 (100.0%) |
Household Income by Mortgage Status in St Michaels
| Household Income | Without Mortgage | With Mortgage |
| Less than $10,000 | 20 (14.7%) | 0 (0.0%) |
| $10,000 to $24,999 | 16 (11.8%) | 17 (26.6%) |
| $25,000 to $34,999 | 27 (19.9%) | 0 (0.0%) |
| $35,000 to $49,999 | 12 (8.8%) | 10 (15.6%) |
| $50,000 to $74,999 | 19 (14.0%) | 8 (12.5%) |
| $75,000 to $99,999 | 0 (0.0%) | 9 (14.1%) |
| $100,000 to $149,999 | 20 (14.7%) | 0 (0.0%) |
| $150,000 or more | 22 (16.2%) | 10 (15.6%) |
| Total | 136 (100.0%) | 64 (100.0%) |
Property Value to Household Income Ratio in St Michaels
| Value-to-Income Ratio | Without Mortgage | With Mortgage |
| Less than 2.0x | 69 (50.7%) | 0 (0.0%) |
| 2.0x to 2.9x | 8 (5.9%) | 20 (31.2%) |
| 3.0x to 3.9x | 12 (8.8%) | 0 (0.0%) |
| 4.0x or more | 27 (19.9%) | 9 (14.1%) |
| Total | 136 (100.0%) | 64 (100.0%) |
Real Estate Taxes by Mortgage Status in St Michaels
| Property Taxes | Without Mortgage | With Mortgage |
| Less than $800 | 12 (8.8%) | 17 (26.6%) |
| $800 to $1,499 | 0 (0.0%) | 10 (15.6%) |
| $800 to $1,499 | 0 (0.0%) | 0 (0.0%) |
| Total | 136 (100.0%) | 64 (100.0%) |
Health & Disability in St Michaels
Health Insurance Coverage by Age in St Michaels
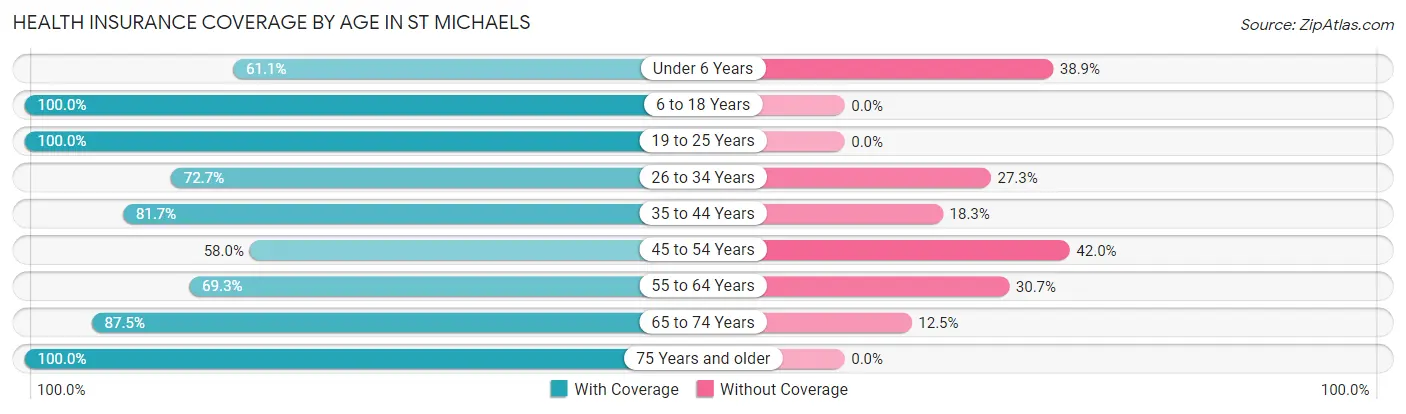
| Age Bracket | With Coverage | Without Coverage |
| Under 6 Years | 22 (61.1%) | 14 (38.9%) |
| 6 to 18 Years | 154 (100.0%) | 0 (0.0%) |
| 19 to 25 Years | 7 (100.0%) | 0 (0.0%) |
| 26 to 34 Years | 64 (72.7%) | 24 (27.3%) |
| 35 to 44 Years | 98 (81.7%) | 22 (18.3%) |
| 45 to 54 Years | 76 (58.0%) | 55 (42.0%) |
| 55 to 64 Years | 70 (69.3%) | 31 (30.7%) |
| 65 to 74 Years | 56 (87.5%) | 8 (12.5%) |
| 75 Years and older | 73 (100.0%) | 0 (0.0%) |
| Total | 620 (80.1%) | 154 (19.9%) |
Health Insurance Coverage by Citizenship Status in St Michaels
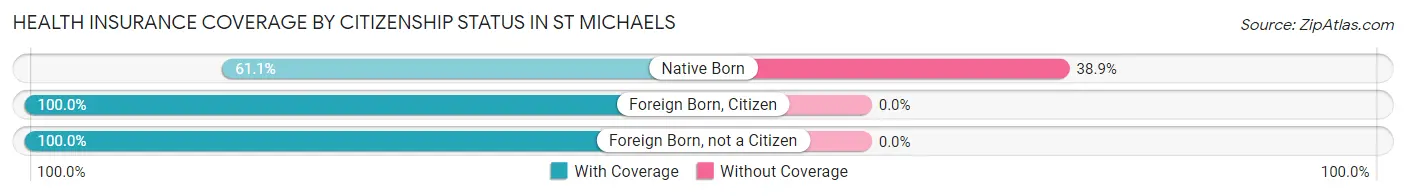
| Citizenship Status | With Coverage | Without Coverage |
| Native Born | 22 (61.1%) | 14 (38.9%) |
| Foreign Born, Citizen | 154 (100.0%) | 0 (0.0%) |
| Foreign Born, not a Citizen | 7 (100.0%) | 0 (0.0%) |
Health Insurance Coverage by Household Income in St Michaels
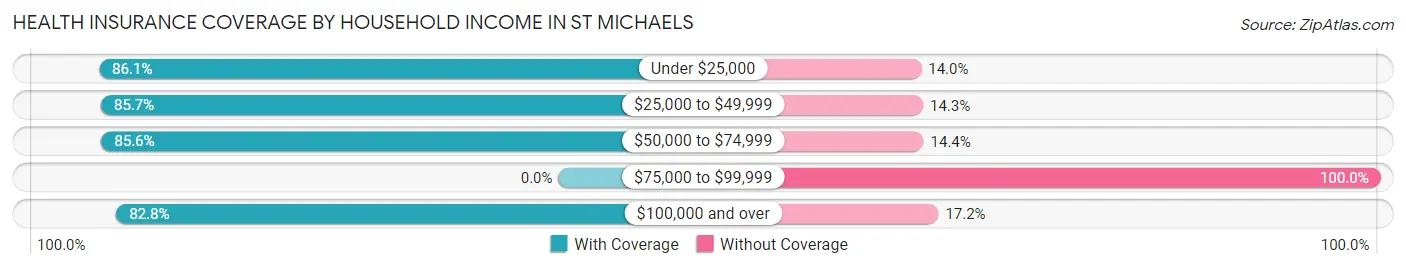
| Household Income | With Coverage | Without Coverage |
| Under $25,000 | 111 (86.1%) | 18 (14.0%) |
| $25,000 to $49,999 | 144 (85.7%) | 24 (14.3%) |
| $50,000 to $74,999 | 119 (85.6%) | 20 (14.4%) |
| $75,000 to $99,999 | 0 (0.0%) | 36 (100.0%) |
| $100,000 and over | 246 (82.8%) | 51 (17.2%) |
Public vs Private Health Insurance Coverage by Age in St Michaels
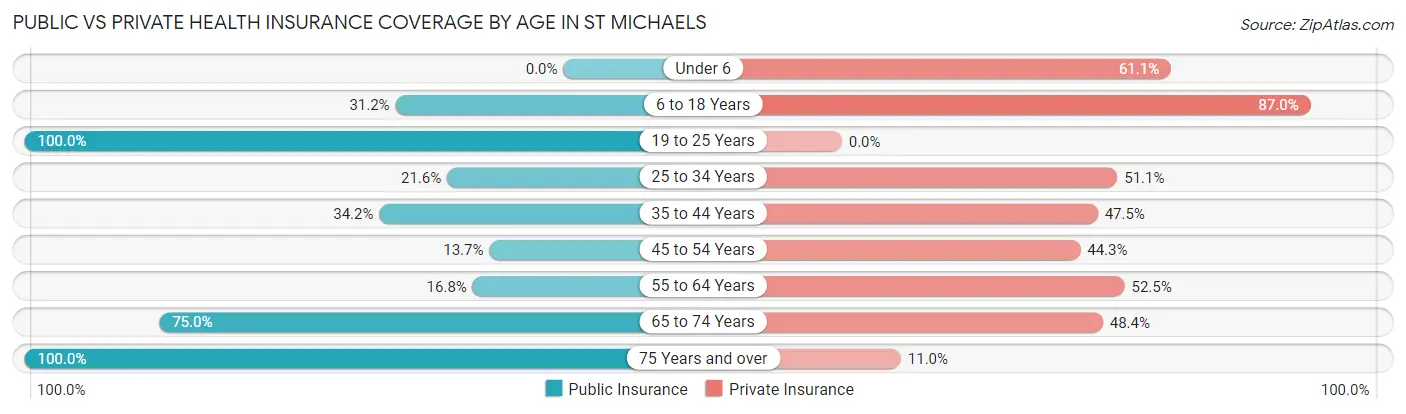
| Age Bracket | Public Insurance | Private Insurance |
| Under 6 | 0 (0.0%) | 22 (61.1%) |
| 6 to 18 Years | 48 (31.2%) | 134 (87.0%) |
| 19 to 25 Years | 7 (100.0%) | 0 (0.0%) |
| 25 to 34 Years | 19 (21.6%) | 45 (51.1%) |
| 35 to 44 Years | 41 (34.2%) | 57 (47.5%) |
| 45 to 54 Years | 18 (13.7%) | 58 (44.3%) |
| 55 to 64 Years | 17 (16.8%) | 53 (52.5%) |
| 65 to 74 Years | 48 (75.0%) | 31 (48.4%) |
| 75 Years and over | 73 (100.0%) | 8 (11.0%) |
| Total | 271 (35.0%) | 408 (52.7%) |
Disability Status by Sex by Age in St Michaels
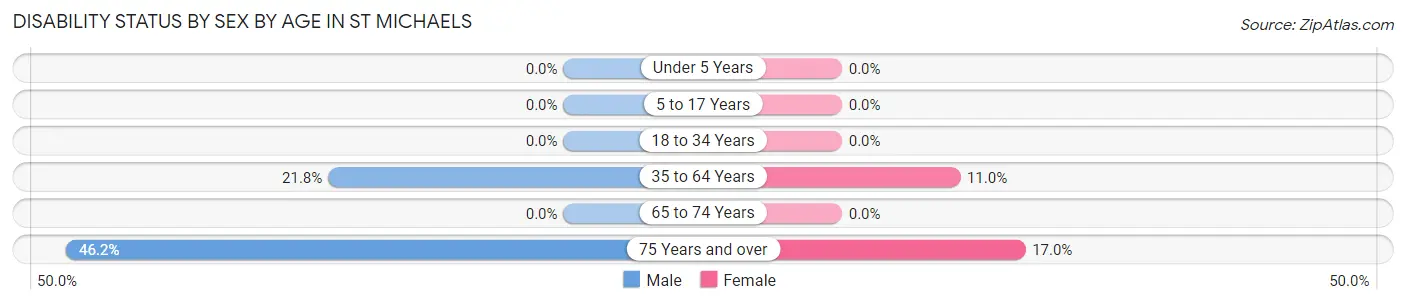
| Age Bracket | Male | Female |
| Under 5 Years | 0 (0.0%) | 0 (0.0%) |
| 5 to 17 Years | 0 (0.0%) | 0 (0.0%) |
| 18 to 34 Years | 0 (0.0%) | 0 (0.0%) |
| 35 to 64 Years | 43 (21.8%) | 17 (11.0%) |
| 65 to 74 Years | 0 (0.0%) | 0 (0.0%) |
| 75 Years and over | 12 (46.2%) | 8 (17.0%) |
Disability Class by Sex by Age in St Michaels
Disability Class: Hearing Difficulty
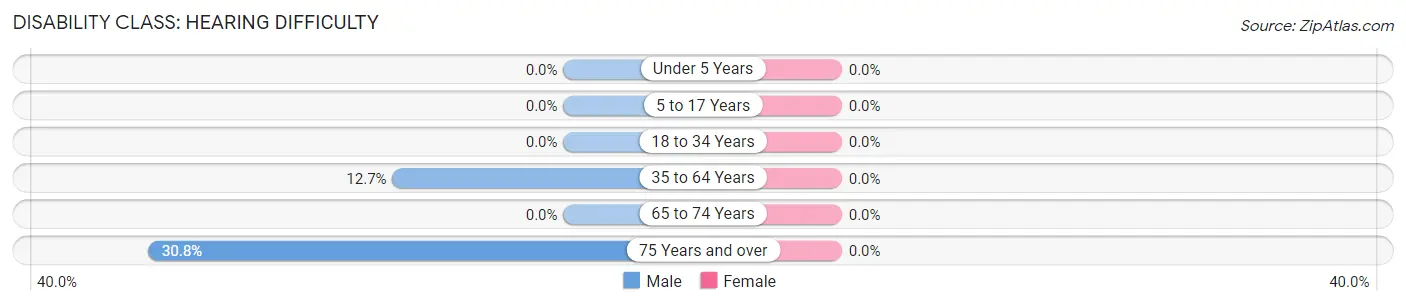
| Age Bracket | Male | Female |
| Under 5 Years | 0 (0.0%) | 0 (0.0%) |
| 5 to 17 Years | 0 (0.0%) | 0 (0.0%) |
| 18 to 34 Years | 0 (0.0%) | 0 (0.0%) |
| 35 to 64 Years | 25 (12.7%) | 0 (0.0%) |
| 65 to 74 Years | 0 (0.0%) | 0 (0.0%) |
| 75 Years and over | 8 (30.8%) | 0 (0.0%) |
Disability Class: Vision Difficulty
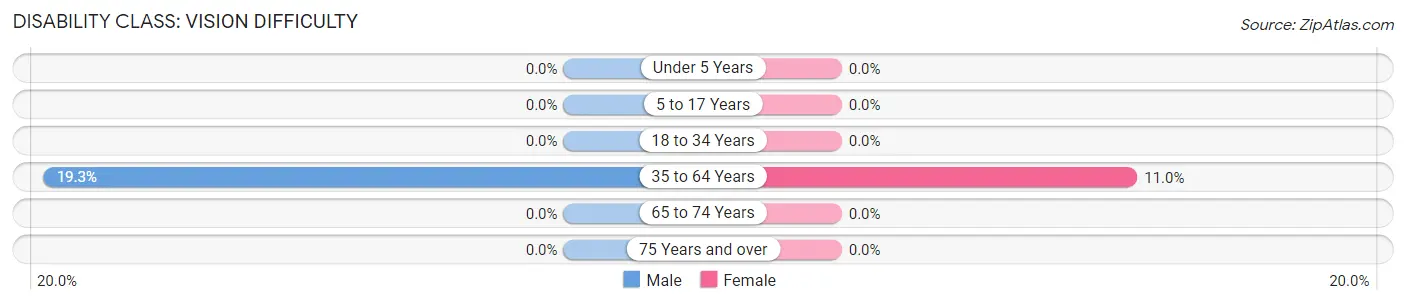
| Age Bracket | Male | Female |
| Under 5 Years | 0 (0.0%) | 0 (0.0%) |
| 5 to 17 Years | 0 (0.0%) | 0 (0.0%) |
| 18 to 34 Years | 0 (0.0%) | 0 (0.0%) |
| 35 to 64 Years | 38 (19.3%) | 17 (11.0%) |
| 65 to 74 Years | 0 (0.0%) | 0 (0.0%) |
| 75 Years and over | 0 (0.0%) | 0 (0.0%) |
Disability Class: Cognitive Difficulty
| Age Bracket | Male | Female |
| 5 to 17 Years | 0 (0.0%) | 0 (0.0%) |
| 18 to 34 Years | 0 (0.0%) | 0 (0.0%) |
| 35 to 64 Years | 0 (0.0%) | 0 (0.0%) |
| 65 to 74 Years | 0 (0.0%) | 0 (0.0%) |
| 75 Years and over | 0 (0.0%) | 0 (0.0%) |
Disability Class: Ambulatory Difficulty
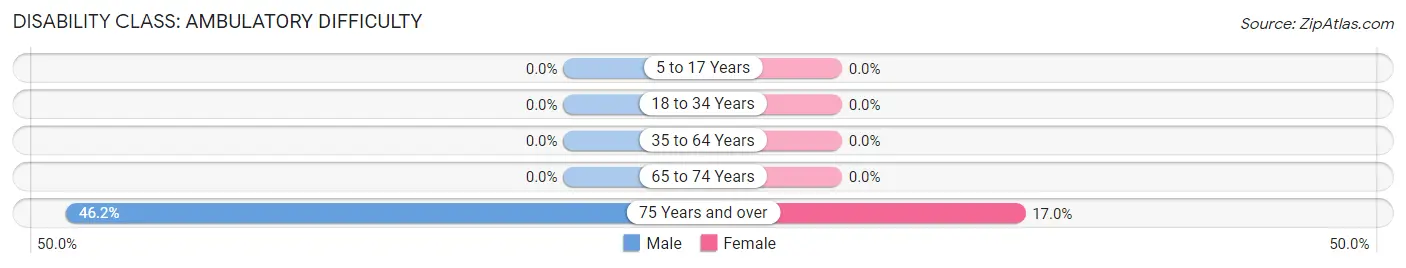
| Age Bracket | Male | Female |
| 5 to 17 Years | 0 (0.0%) | 0 (0.0%) |
| 18 to 34 Years | 0 (0.0%) | 0 (0.0%) |
| 35 to 64 Years | 0 (0.0%) | 0 (0.0%) |
| 65 to 74 Years | 0 (0.0%) | 0 (0.0%) |
| 75 Years and over | 12 (46.2%) | 8 (17.0%) |
Disability Class: Self-Care Difficulty
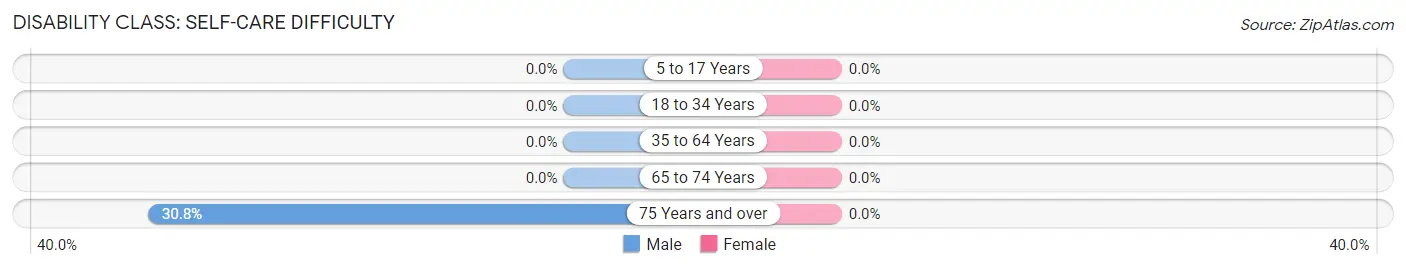
| Age Bracket | Male | Female |
| 5 to 17 Years | 0 (0.0%) | 0 (0.0%) |
| 18 to 34 Years | 0 (0.0%) | 0 (0.0%) |
| 35 to 64 Years | 0 (0.0%) | 0 (0.0%) |
| 65 to 74 Years | 0 (0.0%) | 0 (0.0%) |
| 75 Years and over | 8 (30.8%) | 0 (0.0%) |
Technology Access in St Michaels
Computing Device Access in St Michaels
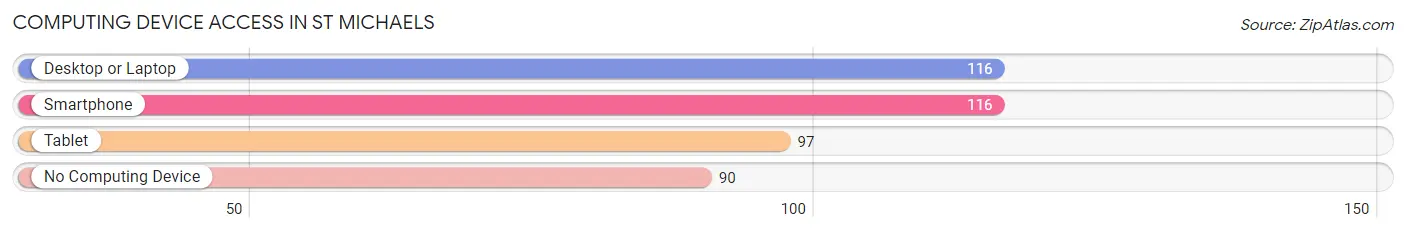
| Device Type | # Households | % Households |
| Desktop or Laptop | 116 | 51.8% |
| Smartphone | 116 | 51.8% |
| Tablet | 97 | 43.3% |
| No Computing Device | 90 | 40.2% |
| Total | 224 | 100.0% |
Internet Access in St Michaels
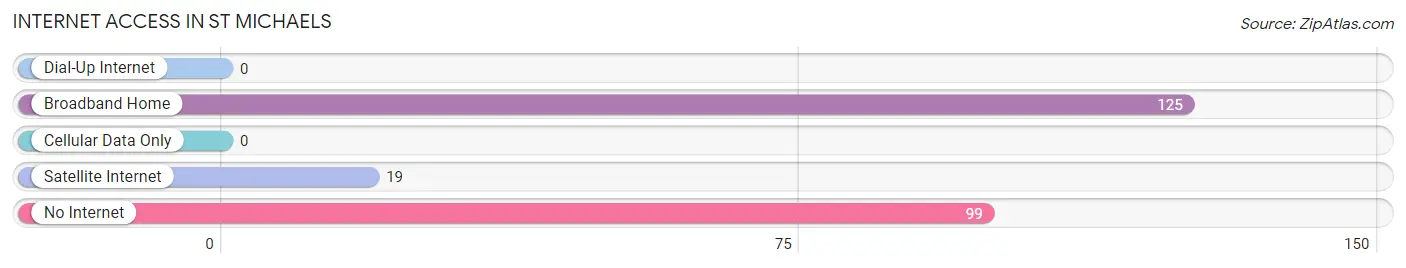
| Internet Type | # Households | % Households |
| Dial-Up Internet | 0 | 0.0% |
| Broadband Home | 125 | 55.8% |
| Cellular Data Only | 0 | 0.0% |
| Satellite Internet | 19 | 8.5% |
| No Internet | 99 | 44.2% |
| Total | 224 | 100.0% |
St Michaels Summary
St. Michaels, Arizona is a small town located in Apache County, Arizona. It is situated in the White Mountains of Arizona, approximately 30 miles east of Show Low. The town was founded in 1876 by a group of Mormon settlers and was named after the Archangel Michael. The town has a population of approximately 500 people and is known for its rich history, beautiful scenery, and friendly people.
History
St. Michaels was founded in 1876 by a group of Mormon settlers who were sent to the area by Brigham Young. The settlers were sent to the area to establish a settlement and to help spread the Mormon faith. The settlers built a fort and a church, and the town quickly grew. The town was named after the Archangel Michael, and the settlers chose the name because they believed that the Archangel Michael would protect them from any danger.
The town was a thriving community for many years, and it was known for its beautiful scenery and friendly people. The town was also known for its strong religious beliefs, and the Mormon faith was a major part of the town's culture.
In the early 1900s, the town began to decline as the population began to move away. The town was eventually abandoned in the 1950s, and it remained abandoned until the late 1970s when a group of people moved to the area and began to restore the town. The town was officially incorporated in 1981, and it has since become a popular tourist destination.
Geography
St. Michaels is located in the White Mountains of Arizona, approximately 30 miles east of Show Low. The town is situated at an elevation of 6,000 feet, and it is surrounded by beautiful mountain scenery. The town is located in a valley, and it is surrounded by the White Mountains on all sides. The town is also located near the Mogollon Rim, which is a large escarpment that runs through the White Mountains.
The town is located in a temperate climate, and it receives an average of 18 inches of precipitation each year. The town is also located in an area that is known for its mild winters and hot summers.
Economy
The economy of St. Michaels is largely based on tourism. The town is a popular destination for tourists who are looking to experience the beauty of the White Mountains and the unique culture of the town. The town is also home to several businesses, including restaurants, hotels, and shops.
The town is also home to several small farms, and the town is known for its production of hay, cattle, and sheep. The town is also home to several logging companies, and the town is known for its production of lumber.
Demographics
As of the 2010 census, the population of St. Michaels was 498 people. The town is predominantly white, with 95.2% of the population being white. The town is also home to a small Hispanic population, with 4.8% of the population being Hispanic. The town is also home to a small Native American population, with 0.2% of the population being Native American.
The median household income in St. Michaels is $37,500, and the median age of the population is 44. The town is also home to a large number of retirees, with 25.2% of the population being over the age of 65.
Conclusion
St. Michaels, Arizona is a small town located in Apache County, Arizona. The town was founded in 1876 by a group of Mormon settlers, and it is known for its rich history, beautiful scenery, and friendly people. The town has a population of approximately 500 people, and the economy of the town is largely based on tourism. The town is predominantly white, with 95.2% of the population being white. The town is also home to a small Hispanic population, with 4.8% of the population being Hispanic. The town is also home to a small Native American population, with 0.2% of the population being Native American. The median household income in St. Michaels is $37,500, and the median age of the population is 44. The town is also home to a large number of retirees, with 25.2% of the population being over the age of 65.
Common Questions
What is Per Capita Income in St Michaels?
Per Capita income in St Michaels is $21,218.
What is the Median Family Income in St Michaels?
Median Family Income in St Michaels is $68,611.
What is the Median Household income in St Michaels?
Median Household Income in St Michaels is $45,208.
What is Income or Wage Gap in St Michaels?
Income or Wage Gap in St Michaels is 11.6%.
Women in St Michaels earn 88.4 cents for every dollar earned by a man.
What is Family Income Deficit in St Michaels?
Family Income Deficit in St Michaels is $15,293.
Families that are below poverty line in St Michaels earn $15,293 less on average than the poverty threshold level.
What is Inequality or Gini Index in St Michaels?
Inequality or Gini Index in St Michaels is 0.48.
What is the Total Population of St Michaels?
Total Population of St Michaels is 774.
What is the Total Male Population of St Michaels?
Total Male Population of St Michaels is 326.
What is the Total Female Population of St Michaels?
Total Female Population of St Michaels is 448.
What is the Ratio of Males per 100 Females in St Michaels?
There are 72.77 Males per 100 Females in St Michaels.
What is the Ratio of Females per 100 Males in St Michaels?
There are 137.42 Females per 100 Males in St Michaels.
What is the Median Population Age in St Michaels?
Median Population Age in St Michaels is 43.3 Years.
What is the Average Family Size in St Michaels
Average Family Size in St Michaels is 4.5 People.
What is the Average Household Size in St Michaels
Average Household Size in St Michaels is 3.4 People.
How Large is the Labor Force in St Michaels?
There are 253 People in the Labor Forcein in St Michaels.
What is the Percentage of People in the Labor Force in St Michaels?
40.9% of People are in the Labor Force in St Michaels.
What is the Unemployment Rate in St Michaels?
Unemployment Rate in St Michaels is 11.1%.