Shongopovi, AZ Map & Demographics
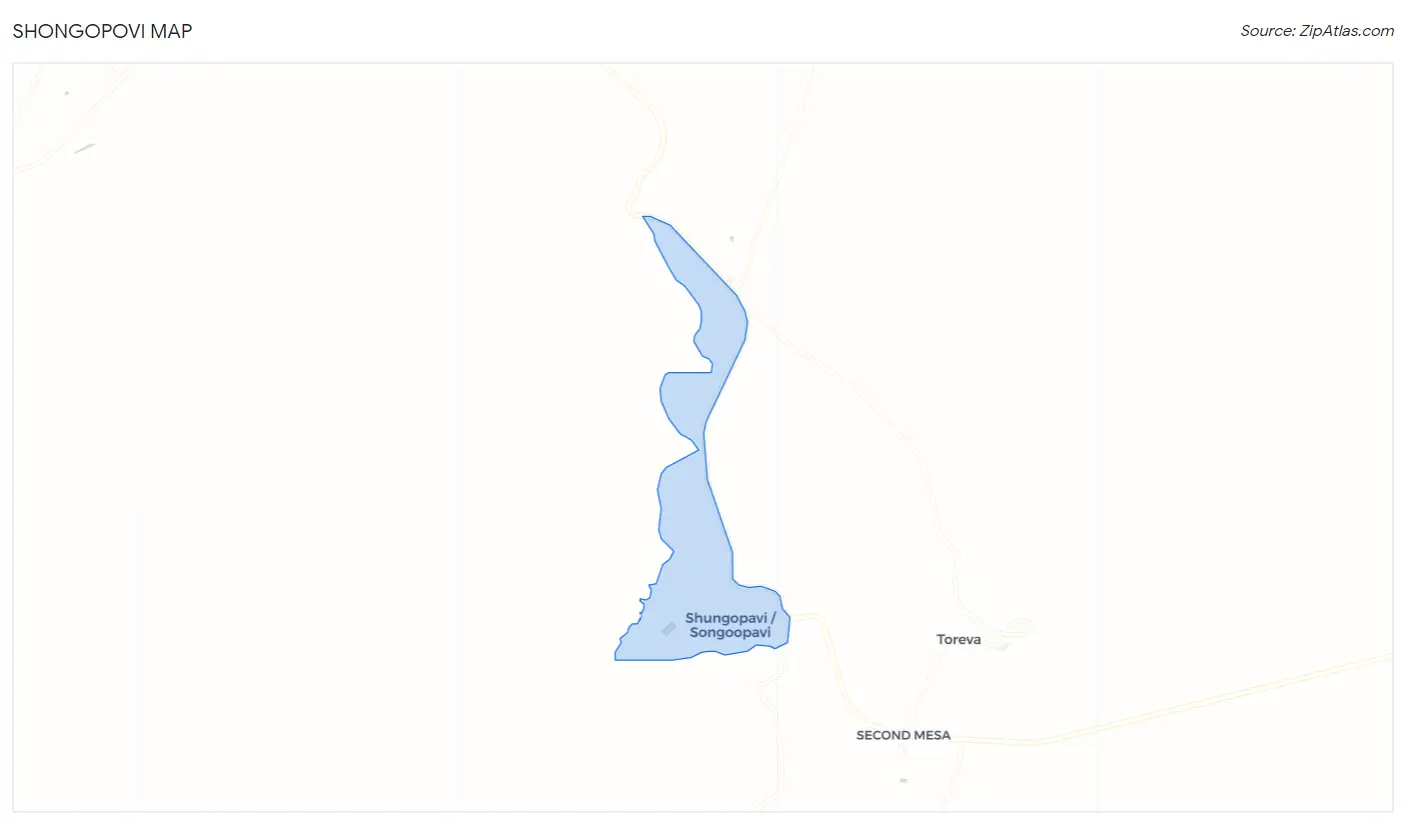
Shongopovi Map
Shongopovi Overview
$10,015
PER CAPITA INCOME
$42,386
AVG FAMILY INCOME
$27,353
AVG HOUSEHOLD INCOME
0.55
INEQUALITY / GINI INDEX
1,151
TOTAL POPULATION
493
MALE POPULATION
658
FEMALE POPULATION
74.92
MALES / 100 FEMALES
133.47
FEMALES / 100 MALES
27.8
MEDIAN AGE
5.5
AVG FAMILY SIZE
4.0
AVG HOUSEHOLD SIZE
329
LABOR FORCE [ PEOPLE ]
40.8%
PERCENT IN LABOR FORCE
28.3%
UNEMPLOYMENT RATE
Income in Shongopovi
Income Overview in Shongopovi
Per Capita Income in Shongopovi is $10,015, while median incomes of families and households are $42,386 and $27,353 respectively.
| Characteristic | Number | Measure |
| Per Capita Income | 1,151 | $10,015 |
| Median Family Income | 185 | $42,386 |
| Mean Family Income | 185 | $47,463 |
| Median Household Income | 288 | $27,353 |
| Mean Household Income | 288 | $36,127 |
| Income Deficit | 185 | $0 |
| Wage / Income Gap (%) | 1,151 | 0.00% |
| Wage / Income Gap ($) | 1,151 | 100.00¢ per $1 |
| Gini / Inequality Index | 1,151 | 0.55 |
Earnings by Sex in Shongopovi
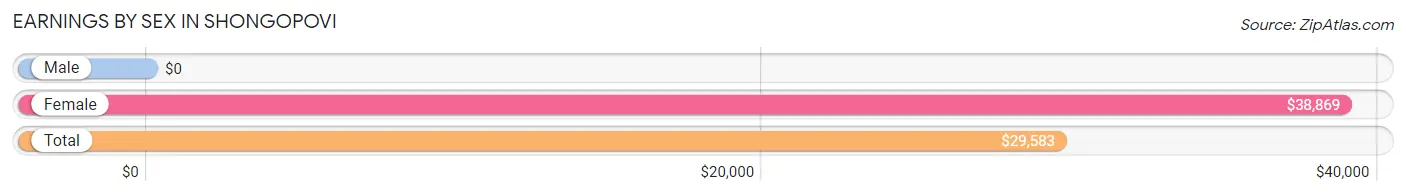
| Sex | Number | Average Earnings |
| Male | 122 (37.8%) | $0 |
| Female | 201 (62.2%) | $38,869 |
| Total | 323 (100.0%) | $29,583 |
Earnings by Sex by Income Bracket in Shongopovi
The most common earnings brackets in Shongopovi are $2,499 or less for men (36 | 29.5%) and $45,000 to $49,999 for women (42 | 20.9%).
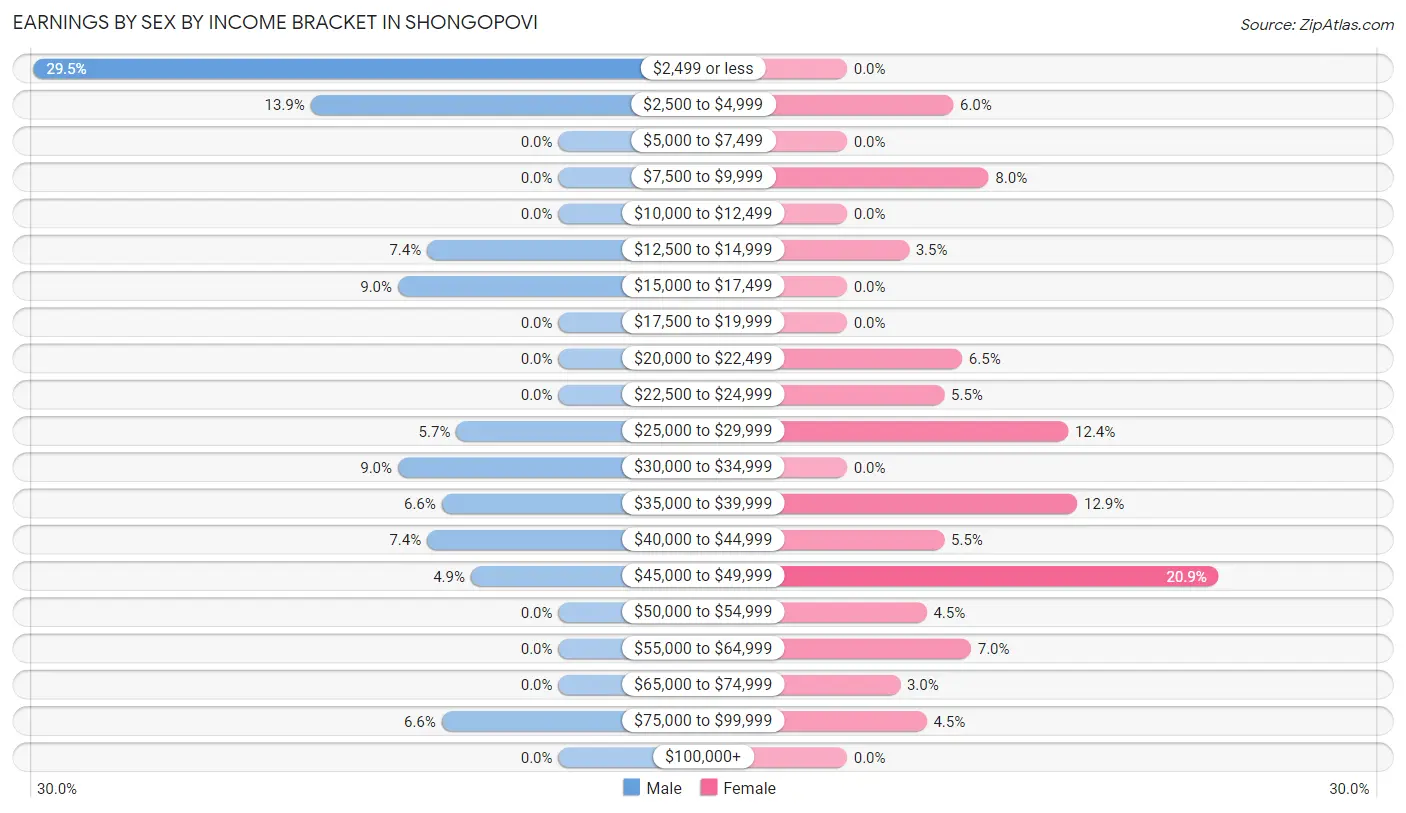
| Income | Male | Female |
| $2,499 or less | 36 (29.5%) | 0 (0.0%) |
| $2,500 to $4,999 | 17 (13.9%) | 12 (6.0%) |
| $5,000 to $7,499 | 0 (0.0%) | 0 (0.0%) |
| $7,500 to $9,999 | 0 (0.0%) | 16 (8.0%) |
| $10,000 to $12,499 | 0 (0.0%) | 0 (0.0%) |
| $12,500 to $14,999 | 9 (7.4%) | 7 (3.5%) |
| $15,000 to $17,499 | 11 (9.0%) | 0 (0.0%) |
| $17,500 to $19,999 | 0 (0.0%) | 0 (0.0%) |
| $20,000 to $22,499 | 0 (0.0%) | 13 (6.5%) |
| $22,500 to $24,999 | 0 (0.0%) | 11 (5.5%) |
| $25,000 to $29,999 | 7 (5.7%) | 25 (12.4%) |
| $30,000 to $34,999 | 11 (9.0%) | 0 (0.0%) |
| $35,000 to $39,999 | 8 (6.6%) | 26 (12.9%) |
| $40,000 to $44,999 | 9 (7.4%) | 11 (5.5%) |
| $45,000 to $49,999 | 6 (4.9%) | 42 (20.9%) |
| $50,000 to $54,999 | 0 (0.0%) | 9 (4.5%) |
| $55,000 to $64,999 | 0 (0.0%) | 14 (7.0%) |
| $65,000 to $74,999 | 0 (0.0%) | 6 (3.0%) |
| $75,000 to $99,999 | 8 (6.6%) | 9 (4.5%) |
| $100,000+ | 0 (0.0%) | 0 (0.0%) |
| Total | 122 (100.0%) | 201 (100.0%) |
Earnings by Sex by Educational Attainment in Shongopovi
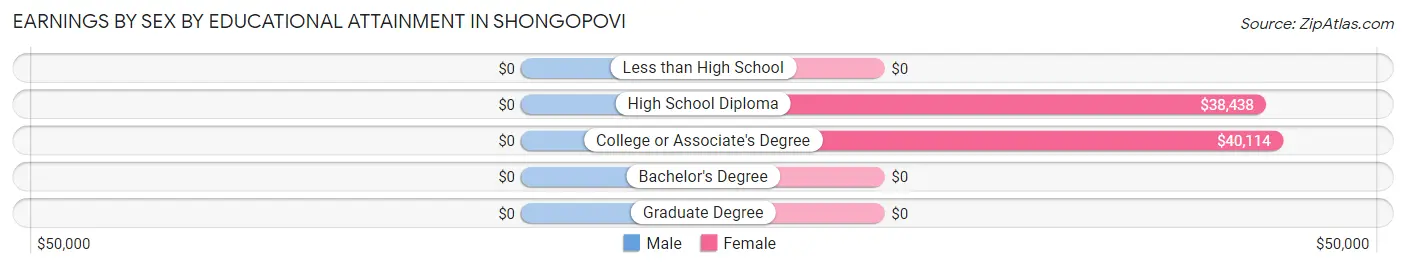
| Educational Attainment | Male Income | Female Income |
| Less than High School | - | - |
| High School Diploma | - | - |
| College or Associate's Degree | - | - |
| Bachelor's Degree | - | - |
| Graduate Degree | - | - |
| Total | - | - |
Family Income in Shongopovi
Family Income Brackets in Shongopovi
According to the Shongopovi family income data, there are 49 families falling into the $35,000 to $49,999 income range, which is the most common income bracket and makes up 26.5% of all families.
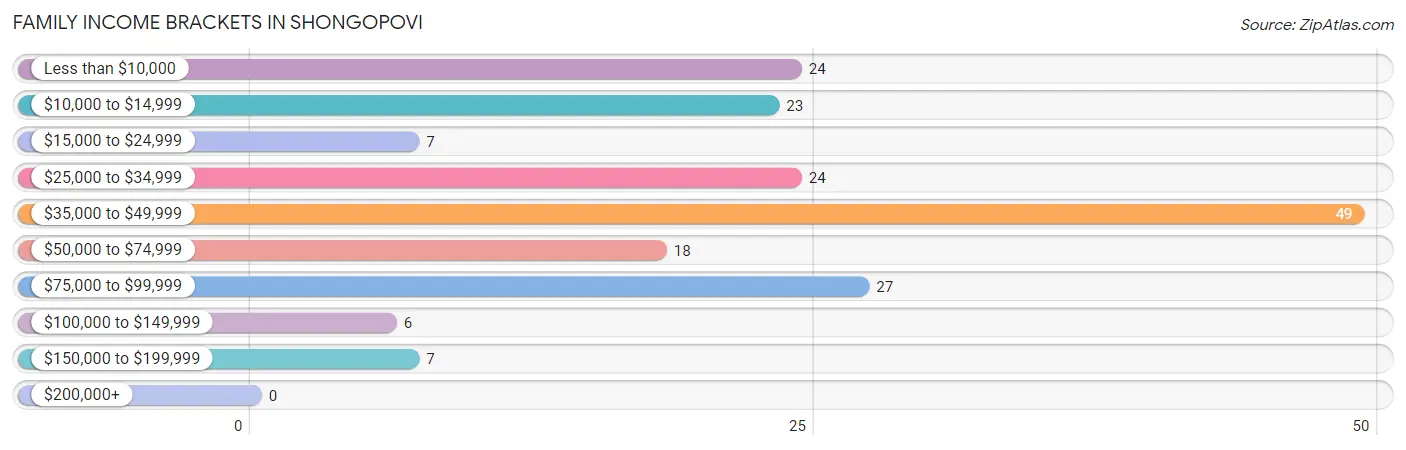
| Income Bracket | # Families | % Families |
| Less than $10,000 | 24 | 13.0% |
| $10,000 to $14,999 | 23 | 12.4% |
| $15,000 to $24,999 | 7 | 3.8% |
| $25,000 to $34,999 | 24 | 13.0% |
| $35,000 to $49,999 | 49 | 26.5% |
| $50,000 to $74,999 | 18 | 9.7% |
| $75,000 to $99,999 | 27 | 14.6% |
| $100,000 to $149,999 | 6 | 3.2% |
| $150,000 to $199,999 | 7 | 3.8% |
| $200,000+ | 0 | 0.0% |
Family Income by Famaliy Size in Shongopovi
3-person families (30 | 16.2%) account for the highest median family income in Shongopovi with $58,750 per family, while 3-person families (30 | 16.2%) have the highest median income of $19,583 per family member.
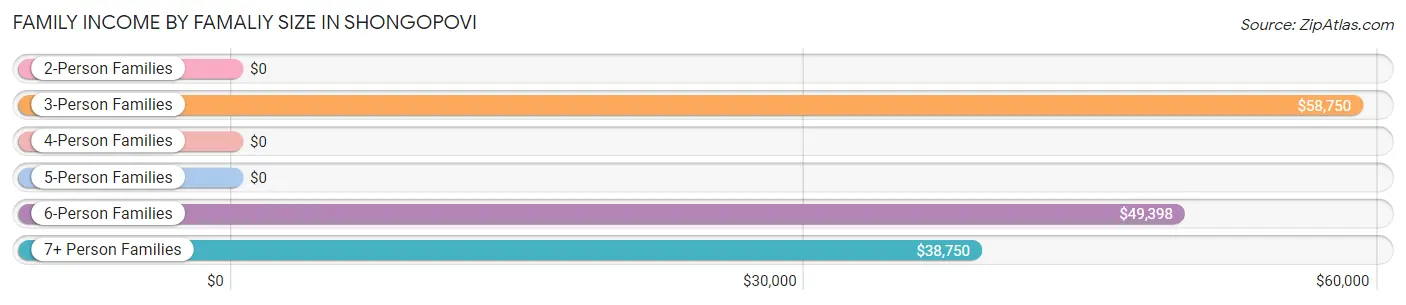
| Income Bracket | # Families | Median Income |
| 2-Person Families | 22 (11.9%) | $0 |
| 3-Person Families | 30 (16.2%) | $58,750 |
| 4-Person Families | 44 (23.8%) | $0 |
| 5-Person Families | 0 (0.0%) | $0 |
| 6-Person Families | 67 (36.2%) | $49,398 |
| 7+ Person Families | 22 (11.9%) | $38,750 |
| Total | 185 (100.0%) | $42,386 |
Family Income by Number of Earners in Shongopovi
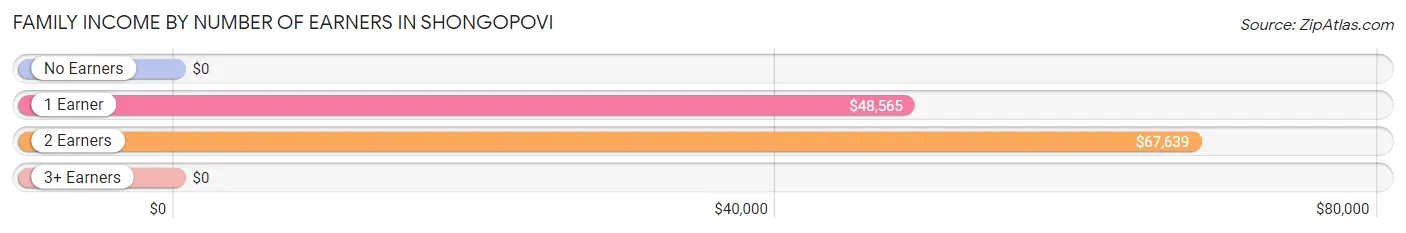
| Number of Earners | # Families | Median Income |
| No Earners | 38 (20.5%) | $0 |
| 1 Earner | 81 (43.8%) | $48,565 |
| 2 Earners | 51 (27.6%) | $67,639 |
| 3+ Earners | 15 (8.1%) | $0 |
| Total | 185 (100.0%) | $42,386 |
Household Income in Shongopovi
Household Income Brackets in Shongopovi
With 93 households falling in the category, the less than $10,000 income range is the most frequent in Shongopovi, accounting for 32.3% of all households.
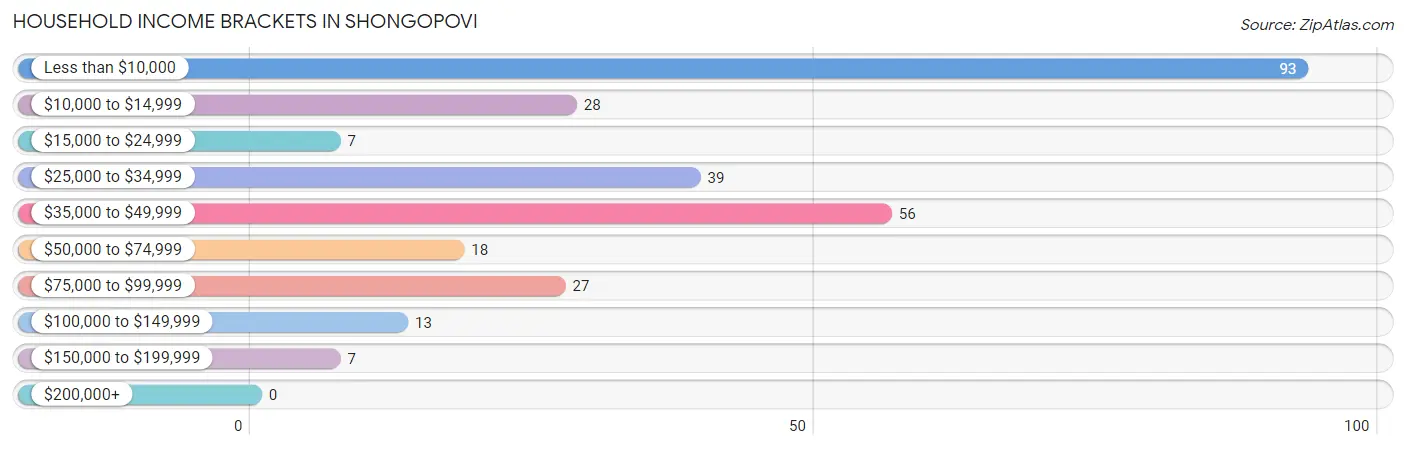
| Income Bracket | # Households | % Households |
| Less than $10,000 | 93 | 32.3% |
| $10,000 to $14,999 | 28 | 9.7% |
| $15,000 to $24,999 | 7 | 2.4% |
| $25,000 to $34,999 | 39 | 13.5% |
| $35,000 to $49,999 | 56 | 19.4% |
| $50,000 to $74,999 | 18 | 6.3% |
| $75,000 to $99,999 | 27 | 9.4% |
| $100,000 to $149,999 | 13 | 4.5% |
| $150,000 to $199,999 | 7 | 2.4% |
| $200,000+ | 0 | 0.0% |
Household Income by Householder Age in Shongopovi
The median household income in Shongopovi is $27,353, with the highest median household income of $47,757 found in the 45 to 64 years age bracket for the primary householder. A total of 145 households (50.3%) fall into this category.
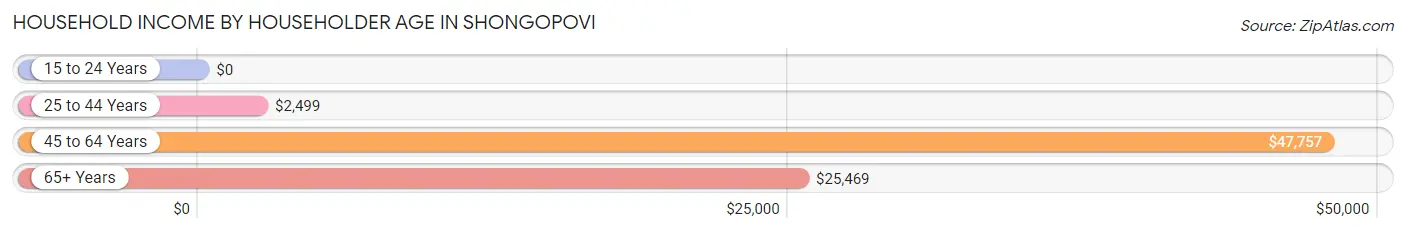
| Income Bracket | # Households | Median Income |
| 15 to 24 Years | 0 (0.0%) | $0 |
| 25 to 44 Years | 76 (26.4%) | $2,499 |
| 45 to 64 Years | 145 (50.3%) | $47,757 |
| 65+ Years | 67 (23.3%) | $25,469 |
| Total | 288 (100.0%) | $27,353 |
Poverty in Shongopovi
Income Below Poverty by Sex and Age in Shongopovi
With 41.2% poverty level for males and 44.8% for females among the residents of Shongopovi, 5 year old males and 12 to 14 year old females are the most vulnerable to poverty, with 5 males (100.0%) and 16 females (100.0%) in their respective age groups living below the poverty level.
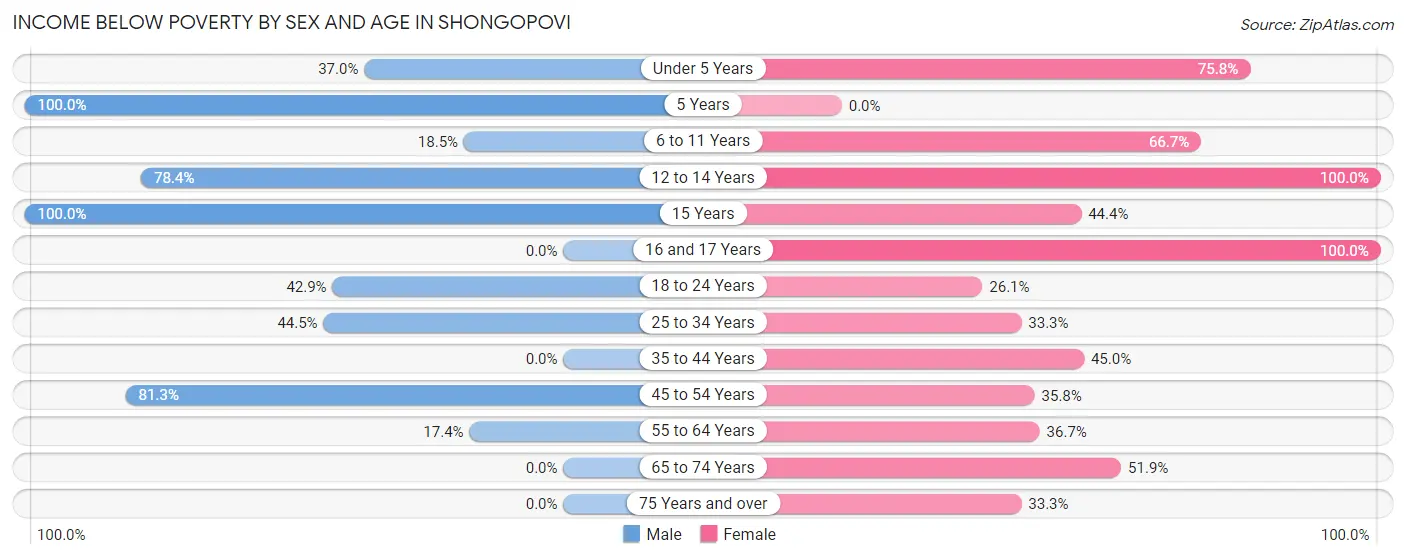
| Age Bracket | Male | Female |
| Under 5 Years | 17 (37.0%) | 25 (75.8%) |
| 5 Years | 5 (100.0%) | 0 (0.0%) |
| 6 to 11 Years | 12 (18.5%) | 62 (66.7%) |
| 12 to 14 Years | 29 (78.4%) | 16 (100.0%) |
| 15 Years | 14 (100.0%) | 16 (44.4%) |
| 16 and 17 Years | 0 (0.0%) | 4 (100.0%) |
| 18 to 24 Years | 24 (42.9%) | 30 (26.1%) |
| 25 to 34 Years | 61 (44.5%) | 16 (33.3%) |
| 35 to 44 Years | 0 (0.0%) | 49 (45.0%) |
| 45 to 54 Years | 26 (81.2%) | 34 (35.8%) |
| 55 to 64 Years | 15 (17.4%) | 18 (36.7%) |
| 65 to 74 Years | 0 (0.0%) | 14 (51.8%) |
| 75 Years and over | 0 (0.0%) | 11 (33.3%) |
| Total | 203 (41.2%) | 295 (44.8%) |
Income Above Poverty by Sex and Age in Shongopovi
According to the poverty statistics in Shongopovi, males aged 16 and 17 years and females aged 18 to 24 years are the age groups that are most secure financially, with 100.0% of males and 73.9% of females in these age groups living above the poverty line.
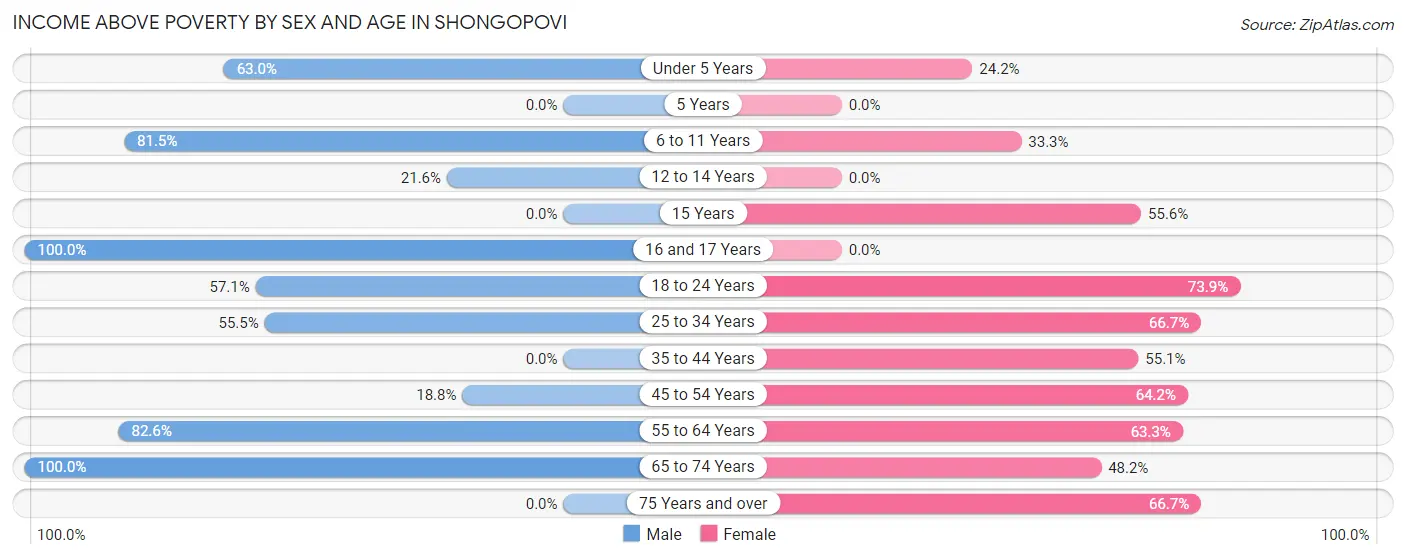
| Age Bracket | Male | Female |
| Under 5 Years | 29 (63.0%) | 8 (24.2%) |
| 5 Years | 0 (0.0%) | 0 (0.0%) |
| 6 to 11 Years | 53 (81.5%) | 31 (33.3%) |
| 12 to 14 Years | 8 (21.6%) | 0 (0.0%) |
| 15 Years | 0 (0.0%) | 20 (55.6%) |
| 16 and 17 Years | 8 (100.0%) | 0 (0.0%) |
| 18 to 24 Years | 32 (57.1%) | 85 (73.9%) |
| 25 to 34 Years | 76 (55.5%) | 32 (66.7%) |
| 35 to 44 Years | 0 (0.0%) | 60 (55.0%) |
| 45 to 54 Years | 6 (18.8%) | 61 (64.2%) |
| 55 to 64 Years | 71 (82.6%) | 31 (63.3%) |
| 65 to 74 Years | 7 (100.0%) | 13 (48.1%) |
| 75 Years and over | 0 (0.0%) | 22 (66.7%) |
| Total | 290 (58.8%) | 363 (55.2%) |
Income Below Poverty Among Married-Couple Families in Shongopovi
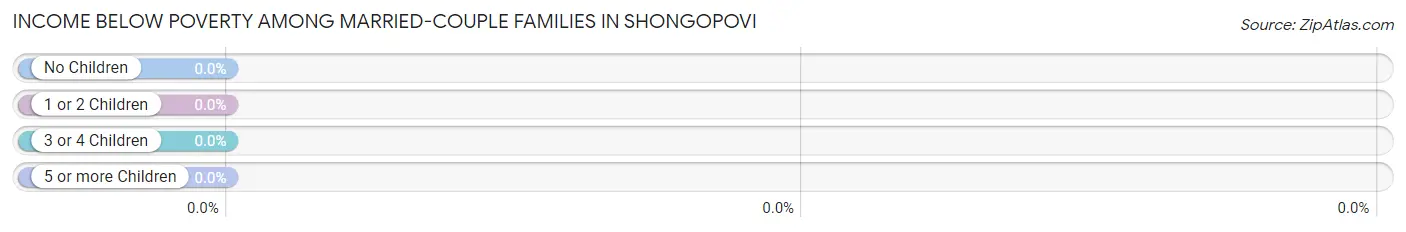
| Children | Above Poverty | Below Poverty |
| No Children | 8 (100.0%) | 0 (0.0%) |
| 1 or 2 Children | 18 (100.0%) | 0 (0.0%) |
| 3 or 4 Children | 0 (0.0%) | 0 (0.0%) |
| 5 or more Children | 0 (0.0%) | 0 (0.0%) |
| Total | 26 (100.0%) | 0 (0.0%) |
Income Below Poverty Among Single-Parent Households in Shongopovi
According to the poverty data in Shongopovi, 100.0% or 9 single-father households and 40.0% or 60 single-mother households are living below the poverty line. Among single-father households, those with 5 or more children have the highest poverty rate, with 9 households (100.0%) experiencing poverty. Likewise, among single-mother households, those with 5 or more children have the highest poverty rate, with 15 households (100.0%) falling below the poverty line.
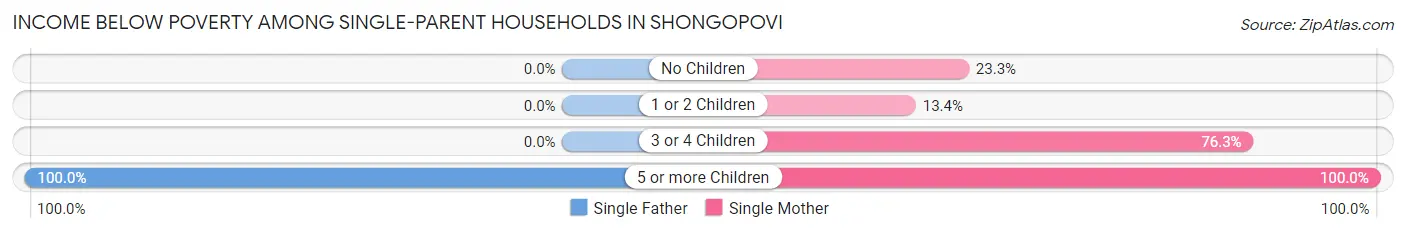
| Children | Single Father | Single Mother |
| No Children | 0 (0.0%) | 7 (23.3%) |
| 1 or 2 Children | 0 (0.0%) | 9 (13.4%) |
| 3 or 4 Children | 0 (0.0%) | 29 (76.3%) |
| 5 or more Children | 9 (100.0%) | 15 (100.0%) |
| Total | 9 (100.0%) | 60 (40.0%) |
Income Below Poverty Among Married-Couple vs Single-Parent Households in Shongopovi
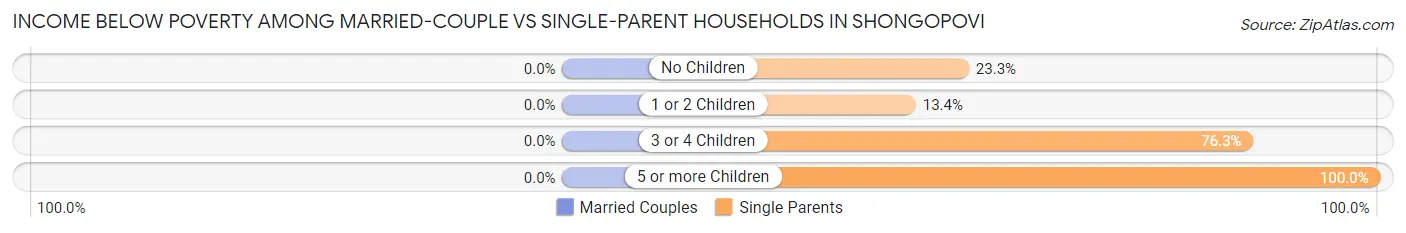
| Children | Married-Couple Families | Single-Parent Households |
| No Children | 0 (0.0%) | 7 (23.3%) |
| 1 or 2 Children | 0 (0.0%) | 9 (13.4%) |
| 3 or 4 Children | 0 (0.0%) | 29 (76.3%) |
| 5 or more Children | 0 (0.0%) | 24 (100.0%) |
| Total | 0 (0.0%) | 69 (43.4%) |
Race in Shongopovi
The most populous races in Shongopovi are Native / Alaskan (1,151 | 100.0%), and Hispanic or Latino (45 | 3.9%).
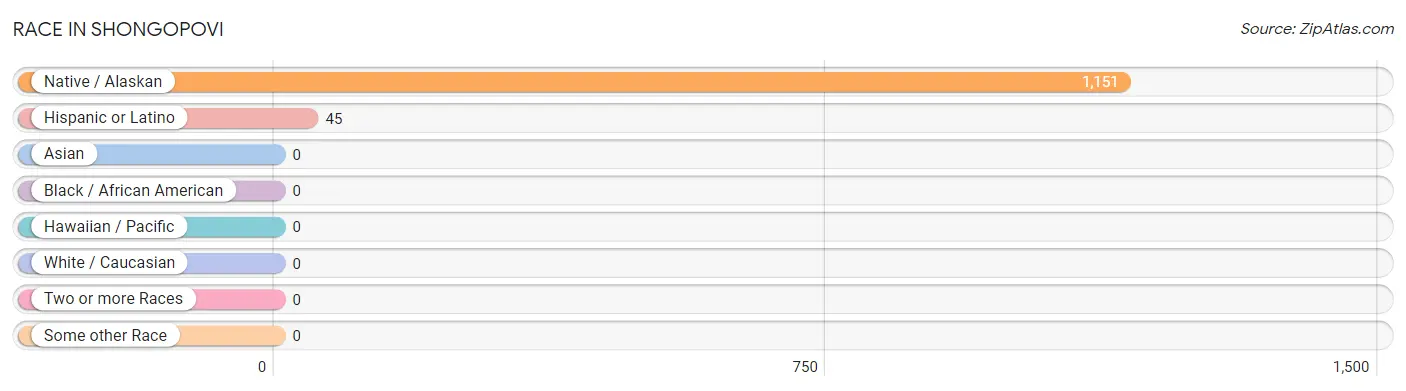
| Race | # Population | % Population |
| Asian | 0 | 0.0% |
| Black / African American | 0 | 0.0% |
| Hawaiian / Pacific | 0 | 0.0% |
| Hispanic or Latino | 45 | 3.9% |
| Native / Alaskan | 1,151 | 100.0% |
| White / Caucasian | 0 | 0.0% |
| Two or more Races | 0 | 0.0% |
| Some other Race | 0 | 0.0% |
| Total | 1,151 | 100.0% |
Ancestry in Shongopovi
The most populous ancestries reported in Shongopovi are Hopi (1,098 | 95.4%), Mexican (45 | 3.9%), Navajo (34 | 2.9%), Tohono O'Odham (11 | 1.0%), and Pima (8 | 0.7%), together accounting for 103.9% of all Shongopovi residents.
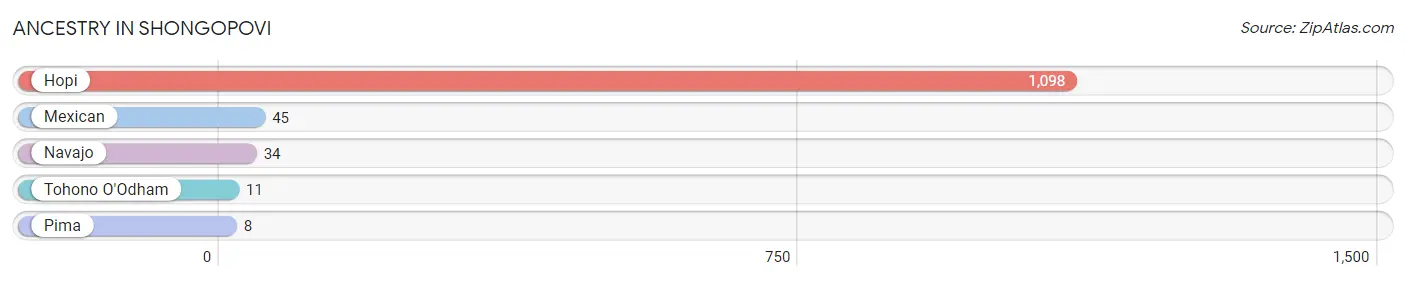
| Ancestry | # Population | % Population |
| Hopi | 1,098 | 95.4% |
| Mexican | 45 | 3.9% |
| Navajo | 34 | 2.9% |
| Pima | 8 | 0.7% |
| Tohono O'Odham | 11 | 1.0% | View All 5 Rows |
Immigrants in Shongopovi

| Immigration Origin | # Population | % Population | View All 0 Rows |
Sex and Age in Shongopovi
Sex and Age in Shongopovi
The most populous age groups in Shongopovi are 25 to 29 Years (112 | 22.7%) for men and 15 to 19 Years (116 | 17.6%) for women.
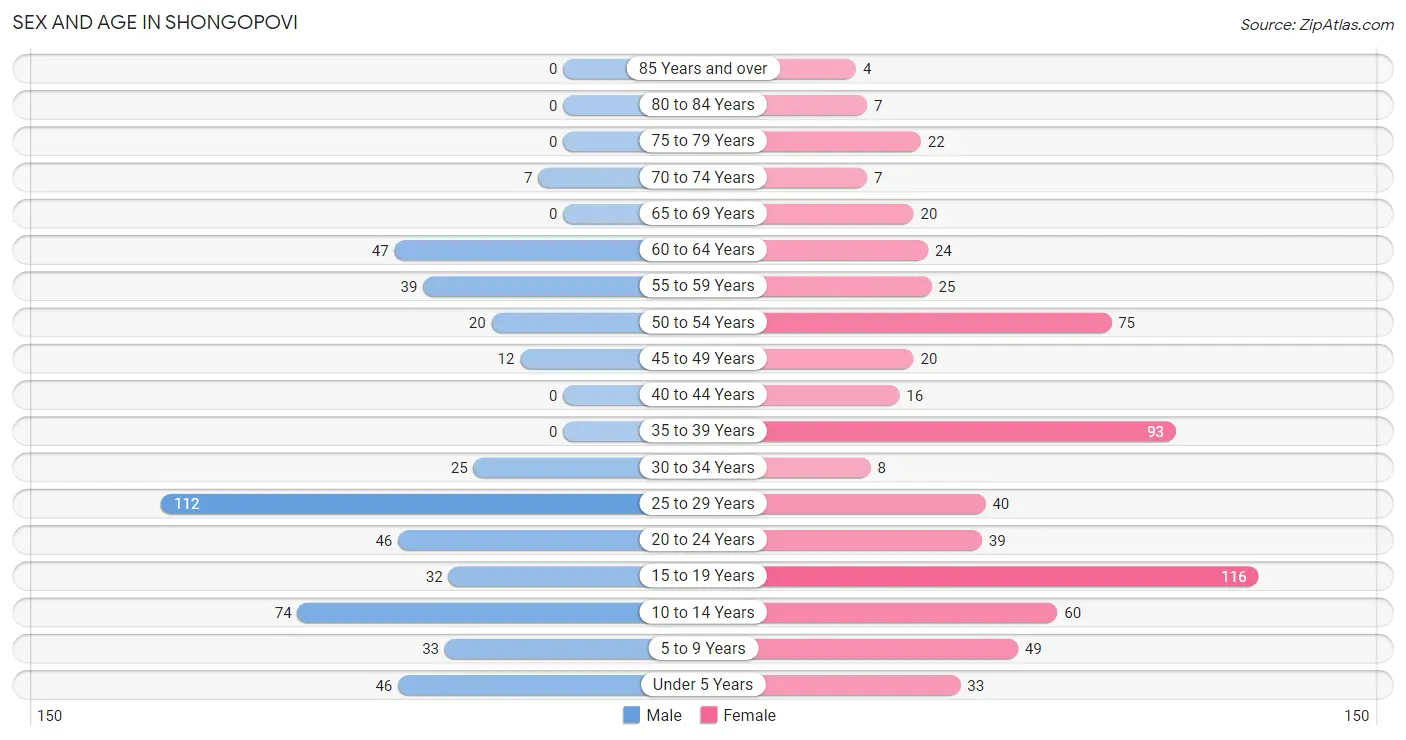
| Age Bracket | Male | Female |
| Under 5 Years | 46 (9.3%) | 33 (5.0%) |
| 5 to 9 Years | 33 (6.7%) | 49 (7.4%) |
| 10 to 14 Years | 74 (15.0%) | 60 (9.1%) |
| 15 to 19 Years | 32 (6.5%) | 116 (17.6%) |
| 20 to 24 Years | 46 (9.3%) | 39 (5.9%) |
| 25 to 29 Years | 112 (22.7%) | 40 (6.1%) |
| 30 to 34 Years | 25 (5.1%) | 8 (1.2%) |
| 35 to 39 Years | 0 (0.0%) | 93 (14.1%) |
| 40 to 44 Years | 0 (0.0%) | 16 (2.4%) |
| 45 to 49 Years | 12 (2.4%) | 20 (3.0%) |
| 50 to 54 Years | 20 (4.1%) | 75 (11.4%) |
| 55 to 59 Years | 39 (7.9%) | 25 (3.8%) |
| 60 to 64 Years | 47 (9.5%) | 24 (3.6%) |
| 65 to 69 Years | 0 (0.0%) | 20 (3.0%) |
| 70 to 74 Years | 7 (1.4%) | 7 (1.1%) |
| 75 to 79 Years | 0 (0.0%) | 22 (3.3%) |
| 80 to 84 Years | 0 (0.0%) | 7 (1.1%) |
| 85 Years and over | 0 (0.0%) | 4 (0.6%) |
| Total | 493 (100.0%) | 658 (100.0%) |
Families and Households in Shongopovi
Median Family Size in Shongopovi
The median family size in Shongopovi is 5.45 persons per family, with married-couple families (26 | 14.1%) accounting for the largest median family size of 5.81 persons per family. On the other hand, single male/father families (9 | 4.9%) represent the smallest median family size with 5.22 persons per family.
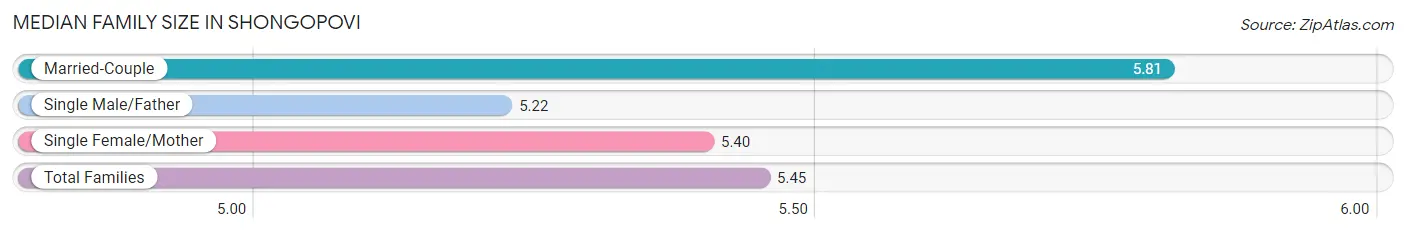
| Family Type | # Families | Family Size |
| Married-Couple | 26 (14.1%) | 5.81 |
| Single Male/Father | 9 (4.9%) | 5.22 |
| Single Female/Mother | 150 (81.1%) | 5.40 |
| Total Families | 185 (100.0%) | 5.45 |
Median Household Size in Shongopovi
The median household size in Shongopovi is 4.00 persons per household, with single male/father households (9 | 3.1%) accounting for the largest median household size of 6 persons per household. non-family households (103 | 35.8%) represent the smallest median household size with 1.08 persons per household.
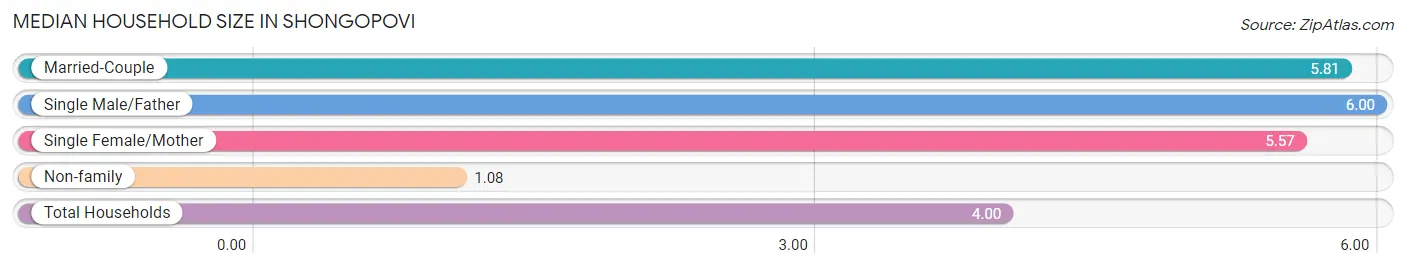
| Household Type | # Households | Household Size |
| Married-Couple | 26 (9.0%) | 5.81 |
| Single Male/Father | 9 (3.1%) | 6.00 |
| Single Female/Mother | 150 (52.1%) | 5.57 |
| Non-family | 103 (35.8%) | 1.08 |
| Total Households | 288 (100.0%) | 4.00 |
Household Size by Marriage Status in Shongopovi
Out of a total of 288 households in Shongopovi, 185 (64.2%) are family households, while 103 (35.8%) are nonfamily households. The most numerous type of family households are 6-person households, comprising 58, and the most common type of nonfamily households are 1-person households, comprising 94.
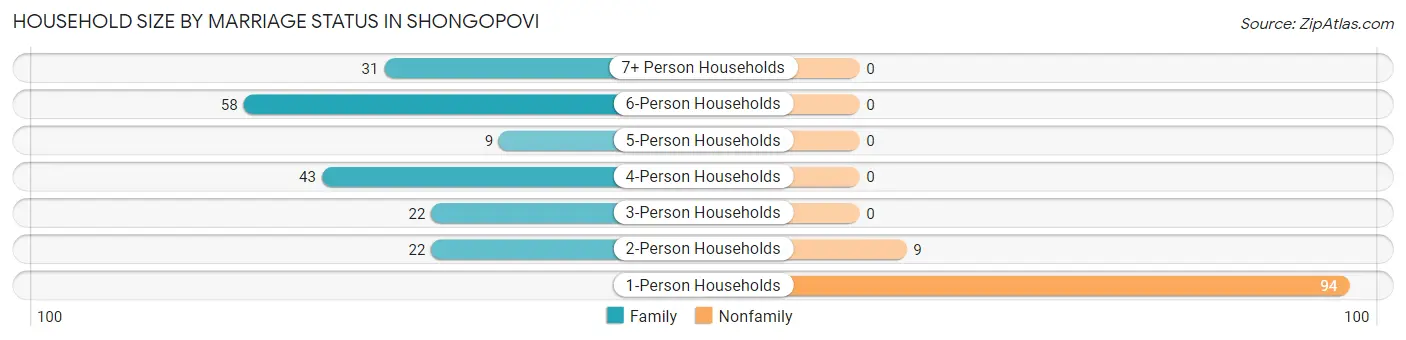
| Household Size | Family Households | Nonfamily Households |
| 1-Person Households | - | 94 (32.6%) |
| 2-Person Households | 22 (7.6%) | 9 (3.1%) |
| 3-Person Households | 22 (7.6%) | 0 (0.0%) |
| 4-Person Households | 43 (14.9%) | 0 (0.0%) |
| 5-Person Households | 9 (3.1%) | 0 (0.0%) |
| 6-Person Households | 58 (20.1%) | 0 (0.0%) |
| 7+ Person Households | 31 (10.8%) | 0 (0.0%) |
| Total | 185 (64.2%) | 103 (35.8%) |
Female Fertility in Shongopovi
Fertility by Age in Shongopovi
Average fertility rate in Shongopovi is 24.0 births per 1,000 women. Women in the age bracket of 20 to 34 years have the highest fertility rate with 92.0 births per 1,000 women. Women in the age bracket of 20 to 34 years acount for 100.0% of all women with births.
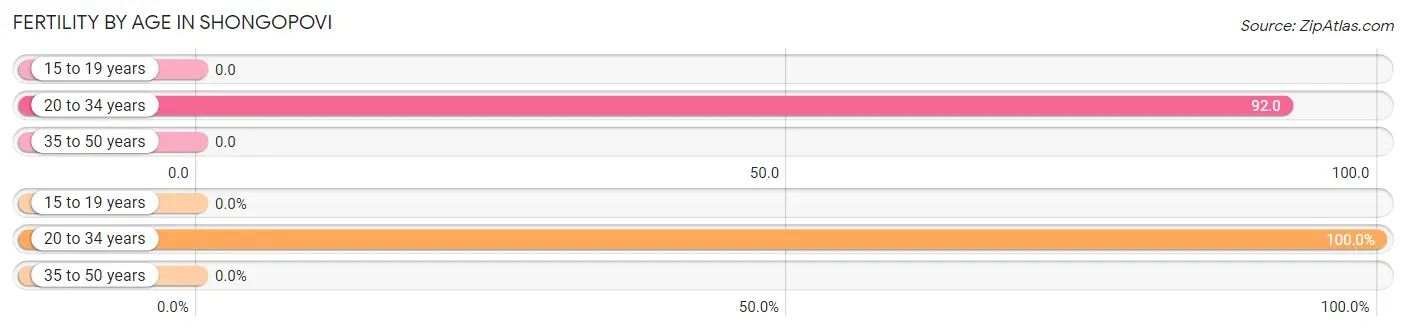
| Age Bracket | Women with Births | Births / 1,000 Women |
| 15 to 19 years | 0 (0.0%) | 0.0 |
| 20 to 34 years | 8 (100.0%) | 92.0 |
| 35 to 50 years | 0 (0.0%) | 0.0 |
| Total | 8 (100.0%) | 24.0 |
Fertility by Age by Marriage Status in Shongopovi
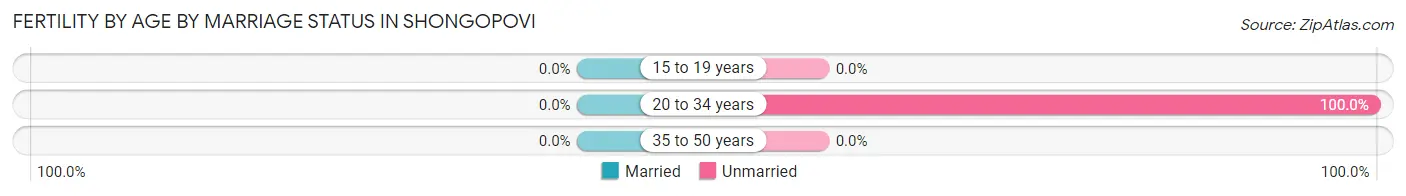
| Age Bracket | Married | Unmarried |
| 15 to 19 years | 0 (0.0%) | 0 (0.0%) |
| 20 to 34 years | 0 (0.0%) | 8 (100.0%) |
| 35 to 50 years | 0 (0.0%) | 0 (0.0%) |
| Total | 0 (0.0%) | 8 (100.0%) |
Fertility by Education in Shongopovi
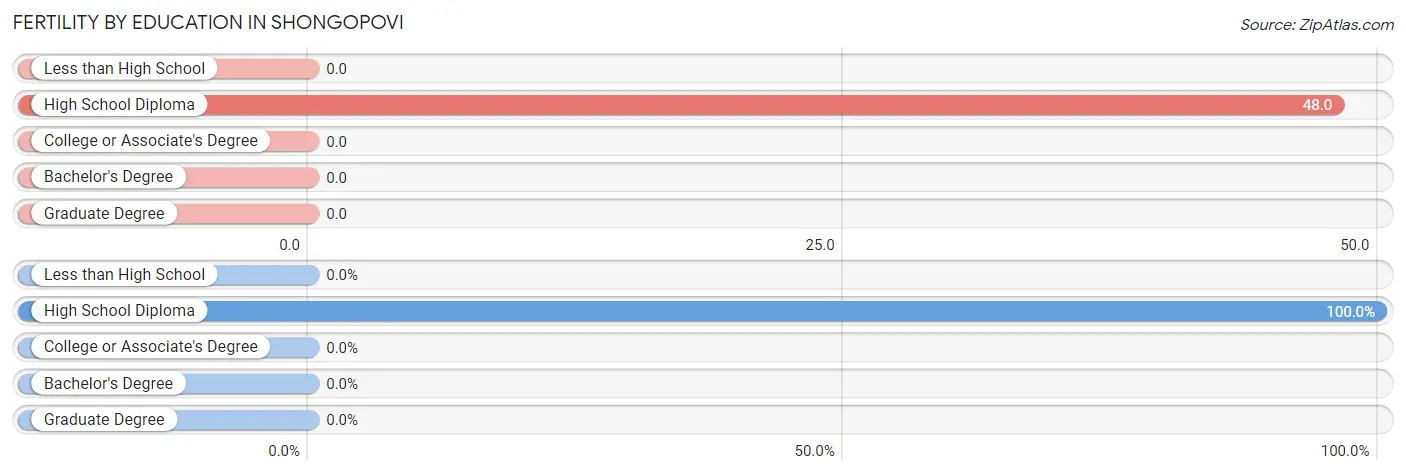
| Educational Attainment | Women with Births | Births / 1,000 Women |
| Less than High School | 0 (0.0%) | 0.0 |
| High School Diploma | 8 (100.0%) | 48.0 |
| College or Associate's Degree | 0 (0.0%) | 0.0 |
| Bachelor's Degree | 0 (0.0%) | 0.0 |
| Graduate Degree | 0 (0.0%) | 0.0 |
| Total | 8 (100.0%) | 24.0 |
Fertility by Education by Marriage Status in Shongopovi
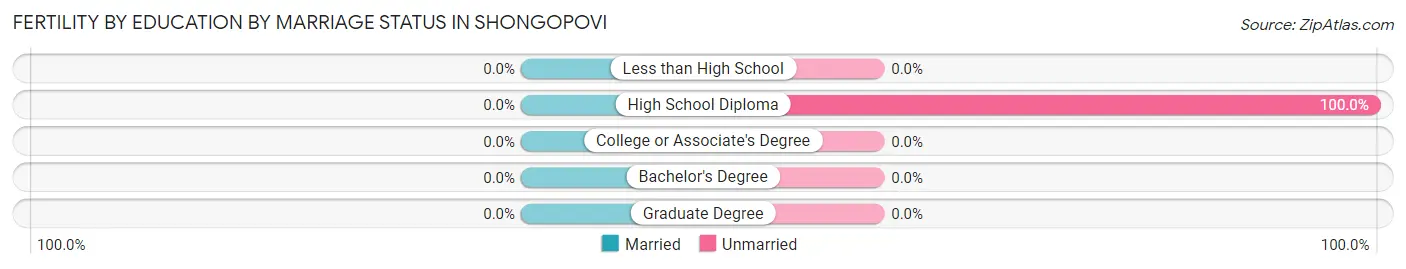
| Educational Attainment | Married | Unmarried |
| Less than High School | 0 (0.0%) | 0 (0.0%) |
| High School Diploma | 0 (0.0%) | 8 (100.0%) |
| College or Associate's Degree | 0 (0.0%) | 0 (0.0%) |
| Bachelor's Degree | 0 (0.0%) | 0 (0.0%) |
| Graduate Degree | 0 (0.0%) | 0 (0.0%) |
| Total | 0 (0.0%) | 8 (100.0%) |
Employment Characteristics in Shongopovi
Employment by Class of Employer in Shongopovi
Among the 236 employed individuals in Shongopovi, local government employees (84 | 35.6%), federal government employees (77 | 32.6%), and private company employees (28 | 11.9%) make up the most common classes of employment.
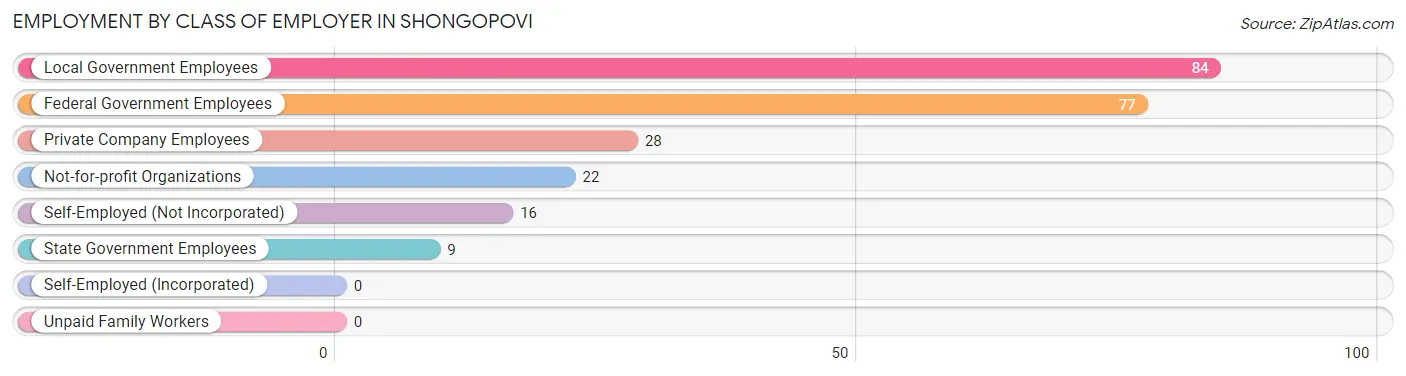
| Employer Class | # Employees | % Employees |
| Private Company Employees | 28 | 11.9% |
| Self-Employed (Incorporated) | 0 | 0.0% |
| Self-Employed (Not Incorporated) | 16 | 6.8% |
| Not-for-profit Organizations | 22 | 9.3% |
| Local Government Employees | 84 | 35.6% |
| State Government Employees | 9 | 3.8% |
| Federal Government Employees | 77 | 32.6% |
| Unpaid Family Workers | 0 | 0.0% |
| Total | 236 | 100.0% |
Employment Status by Age in Shongopovi
According to the labor force statistics for Shongopovi, out of the total population over 16 years of age (806), 40.8% or 329 individuals are in the labor force, with 28.3% or 93 of them unemployed. The age group with the highest labor force participation rate is 55 to 59 years, with 81.3% or 52 individuals in the labor force. Within the labor force, the 16 to 19 years age range has the highest percentage of unemployed individuals, with 100.0% or 8 of them being unemployed.

| Age Bracket | In Labor Force | Unemployed |
| 16 to 19 Years | 8 (8.2%) | 8 (100.0%) |
| 20 to 24 Years | 22 (25.9%) | 12 (54.5%) |
| 25 to 29 Years | 40 (26.3%) | 12 (30.0%) |
| 30 to 34 Years | 14 (42.4%) | 5 (35.7%) |
| 35 to 44 Years | 87 (79.8%) | 20 (23.0%) |
| 45 to 54 Years | 83 (65.4%) | 21 (25.3%) |
| 55 to 59 Years | 52 (81.3%) | 15 (28.8%) |
| 60 to 64 Years | 9 (12.7%) | 0 (0.0%) |
| 65 to 74 Years | 14 (41.2%) | 0 (0.0%) |
| 75 Years and over | 0 (0.0%) | 0 (0.0%) |
| Total | 329 (40.8%) | 93 (28.3%) |
Employment Status by Educational Attainment in Shongopovi
According to labor force statistics for Shongopovi, 51.3% of individuals (285) out of the total population between 25 and 64 years of age (556) are in the labor force, with 25.6% or 73 of them being unemployed. The group with the highest labor force participation rate are those with the educational attainment of bachelor's degree or higher, with 100.0% or 6 individuals in the labor force. Within the labor force, individuals with less than high school education have the highest percentage of unemployment, with 100.0% or 16 of them being unemployed.
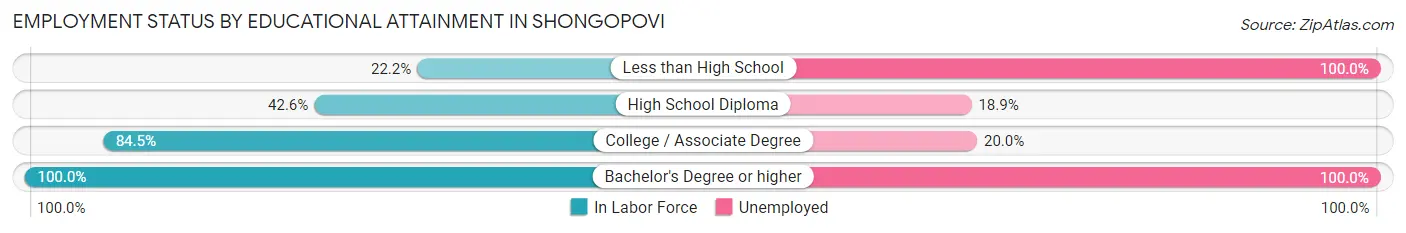
| Educational Attainment | In Labor Force | Unemployed |
| Less than High School | 16 (22.2%) | 72 (100.0%) |
| High School Diploma | 143 (42.6%) | 64 (18.9%) |
| College / Associate Degree | 120 (84.5%) | 28 (20.0%) |
| Bachelor's Degree or higher | 6 (100.0%) | 6 (100.0%) |
| Total | 285 (51.3%) | 142 (25.6%) |
Employment Occupations by Sex in Shongopovi
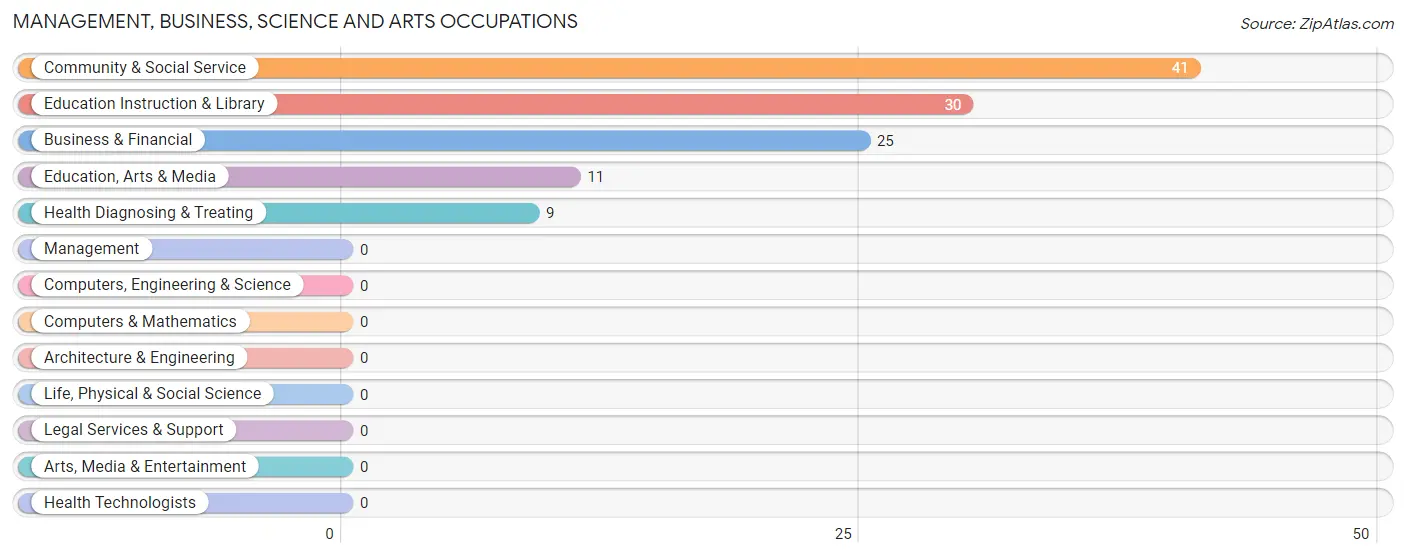
Management, Business, Science and Arts Occupations
The most common Management, Business, Science and Arts occupations in Shongopovi are Community & Social Service (41 | 17.4%), Education Instruction & Library (30 | 12.7%), Business & Financial (25 | 10.6%), Education, Arts & Media (11 | 4.7%), and Health Diagnosing & Treating (9 | 3.8%).
Management, Business, Science and Arts Occupations by Sex
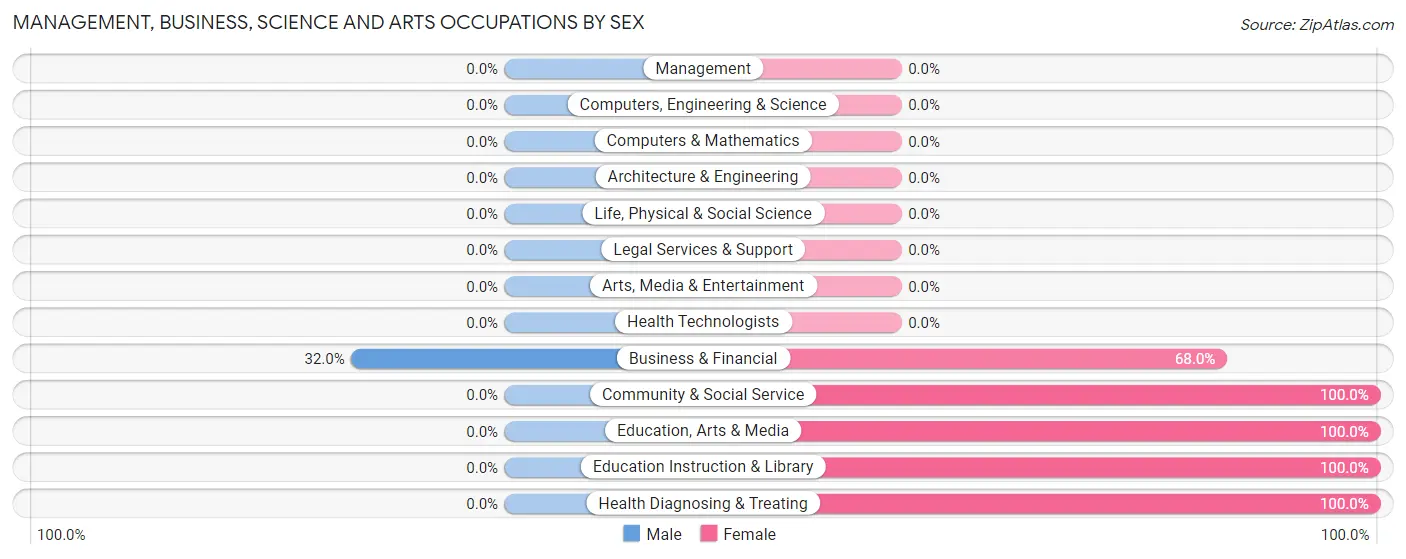
| Occupation | Male | Female |
| Management | 0 (0.0%) | 0 (0.0%) |
| Business & Financial | 8 (32.0%) | 17 (68.0%) |
| Computers, Engineering & Science | 0 (0.0%) | 0 (0.0%) |
| Computers & Mathematics | 0 (0.0%) | 0 (0.0%) |
| Architecture & Engineering | 0 (0.0%) | 0 (0.0%) |
| Life, Physical & Social Science | 0 (0.0%) | 0 (0.0%) |
| Community & Social Service | 0 (0.0%) | 41 (100.0%) |
| Education, Arts & Media | 0 (0.0%) | 11 (100.0%) |
| Legal Services & Support | 0 (0.0%) | 0 (0.0%) |
| Education Instruction & Library | 0 (0.0%) | 30 (100.0%) |
| Arts, Media & Entertainment | 0 (0.0%) | 0 (0.0%) |
| Health Diagnosing & Treating | 0 (0.0%) | 9 (100.0%) |
| Health Technologists | 0 (0.0%) | 0 (0.0%) |
| Total (Category) | 8 (10.7%) | 67 (89.3%) |
| Total (Overall) | 80 (33.9%) | 156 (66.1%) |
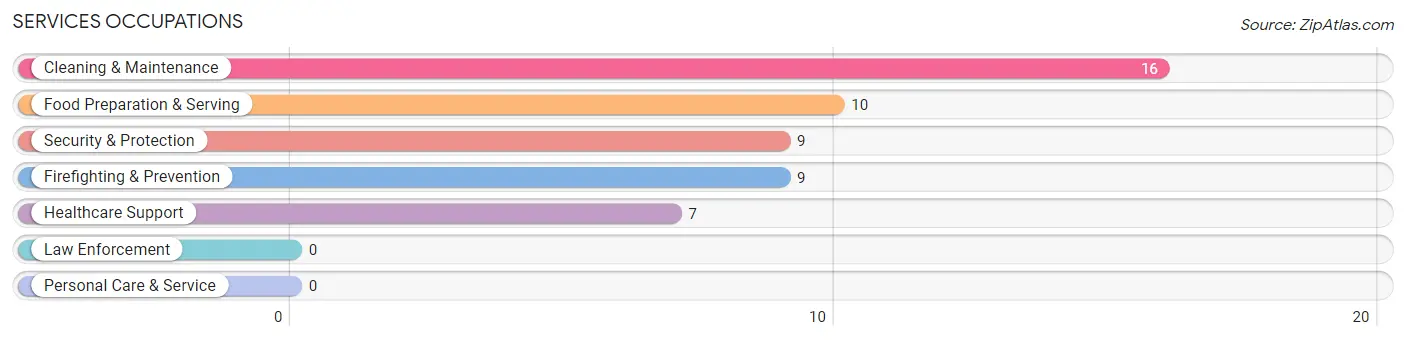
Services Occupations
The most common Services occupations in Shongopovi are Cleaning & Maintenance (16 | 6.8%), Food Preparation & Serving (10 | 4.2%), Security & Protection (9 | 3.8%), Firefighting & Prevention (9 | 3.8%), and Healthcare Support (7 | 3.0%).
Services Occupations by Sex
Within the Services occupations in Shongopovi, the most male-oriented occupations are Security & Protection (100.0%), Firefighting & Prevention (100.0%), and Food Preparation & Serving (100.0%), while the most female-oriented occupations are Healthcare Support (100.0%), and Cleaning & Maintenance (100.0%).
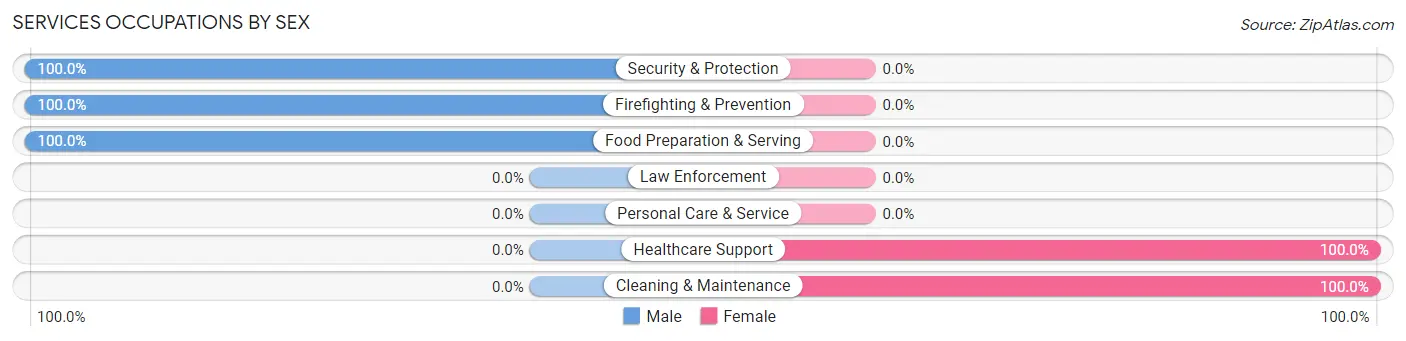
| Occupation | Male | Female |
| Healthcare Support | 0 (0.0%) | 7 (100.0%) |
| Security & Protection | 9 (100.0%) | 0 (0.0%) |
| Firefighting & Prevention | 9 (100.0%) | 0 (0.0%) |
| Law Enforcement | 0 (0.0%) | 0 (0.0%) |
| Food Preparation & Serving | 10 (100.0%) | 0 (0.0%) |
| Cleaning & Maintenance | 0 (0.0%) | 16 (100.0%) |
| Personal Care & Service | 0 (0.0%) | 0 (0.0%) |
| Total (Category) | 19 (45.2%) | 23 (54.8%) |
| Total (Overall) | 80 (33.9%) | 156 (66.1%) |
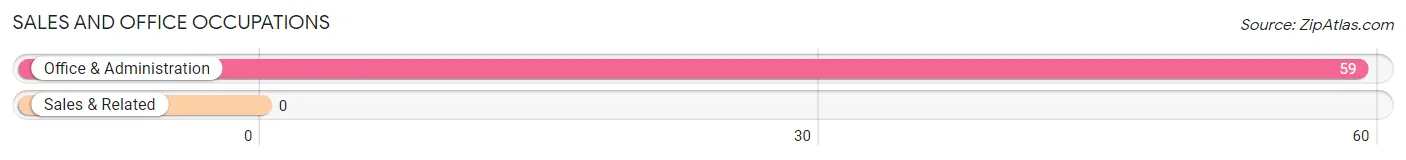
Sales and Office Occupations
The most common Sales and Office occupations in Shongopovi are , and Office & Administration (59 | 25.0%).
Sales and Office Occupations by Sex
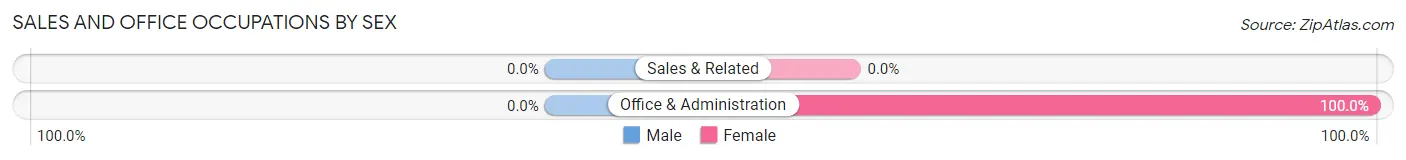
| Occupation | Male | Female |
| Sales & Related | 0 (0.0%) | 0 (0.0%) |
| Office & Administration | 0 (0.0%) | 59 (100.0%) |
| Total (Category) | 0 (0.0%) | 59 (100.0%) |
| Total (Overall) | 80 (33.9%) | 156 (66.1%) |
Natural Resources, Construction and Maintenance Occupations
The most common Natural Resources, Construction and Maintenance occupations in Shongopovi are Installation, Maintenance & Repair (15 | 6.4%), and Construction & Extraction (11 | 4.7%).
Natural Resources, Construction and Maintenance Occupations by Sex
| Occupation | Male | Female |
| Farming, Fishing & Forestry | 0 (0.0%) | 0 (0.0%) |
| Construction & Extraction | 11 (100.0%) | 0 (0.0%) |
| Installation, Maintenance & Repair | 15 (100.0%) | 0 (0.0%) |
| Total (Category) | 26 (100.0%) | 0 (0.0%) |
| Total (Overall) | 80 (33.9%) | 156 (66.1%) |
Production, Transportation and Moving Occupations
The most common Production, Transportation and Moving occupations in Shongopovi are Production (16 | 6.8%), Material Moving (11 | 4.7%), and Transportation (7 | 3.0%).
Production, Transportation and Moving Occupations by Sex
| Occupation | Male | Female |
| Production | 16 (100.0%) | 0 (0.0%) |
| Transportation | 0 (0.0%) | 7 (100.0%) |
| Material Moving | 11 (100.0%) | 0 (0.0%) |
| Total (Category) | 27 (79.4%) | 7 (20.6%) |
| Total (Overall) | 80 (33.9%) | 156 (66.1%) |
Employment Industries by Sex in Shongopovi
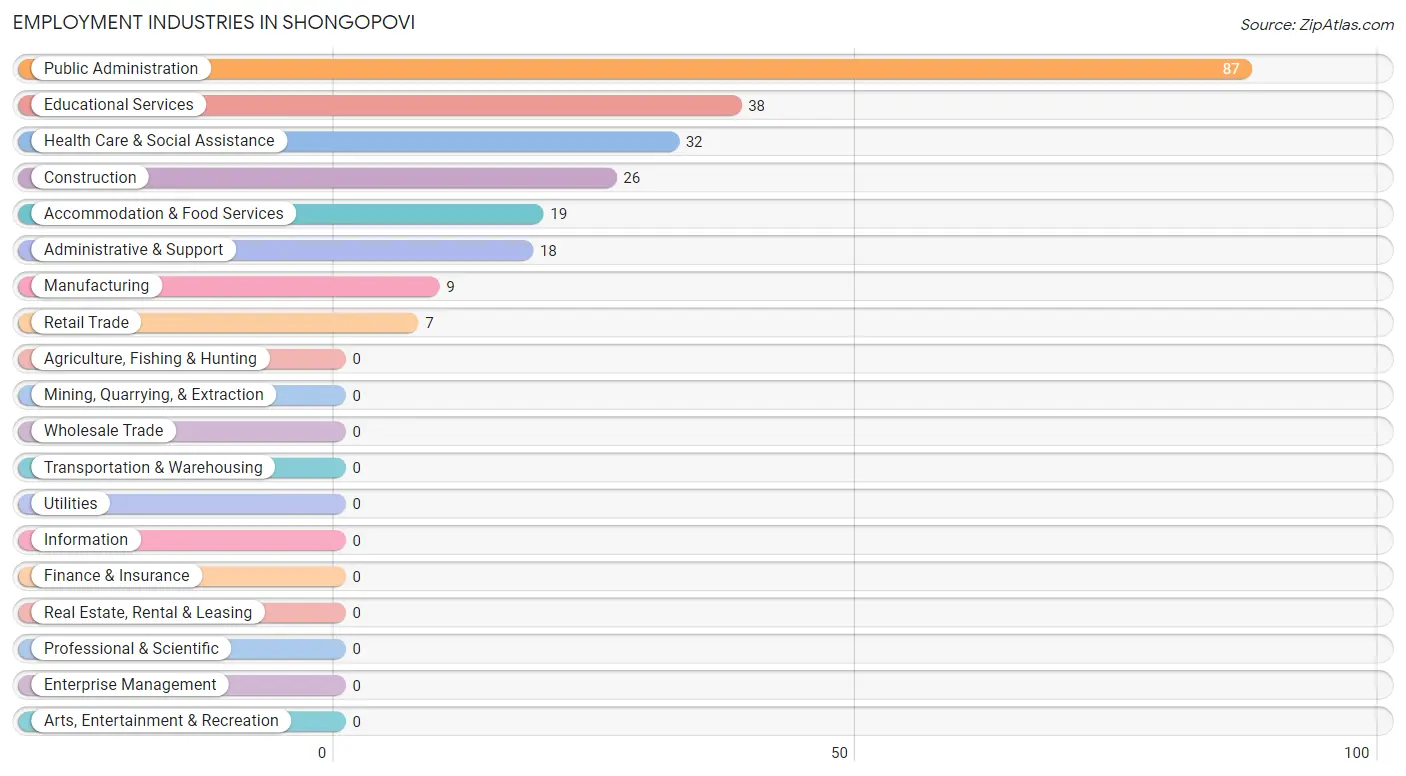
Employment Industries in Shongopovi
The major employment industries in Shongopovi include Public Administration (87 | 36.9%), Educational Services (38 | 16.1%), Health Care & Social Assistance (32 | 13.6%), Construction (26 | 11.0%), and Accommodation & Food Services (19 | 8.1%).
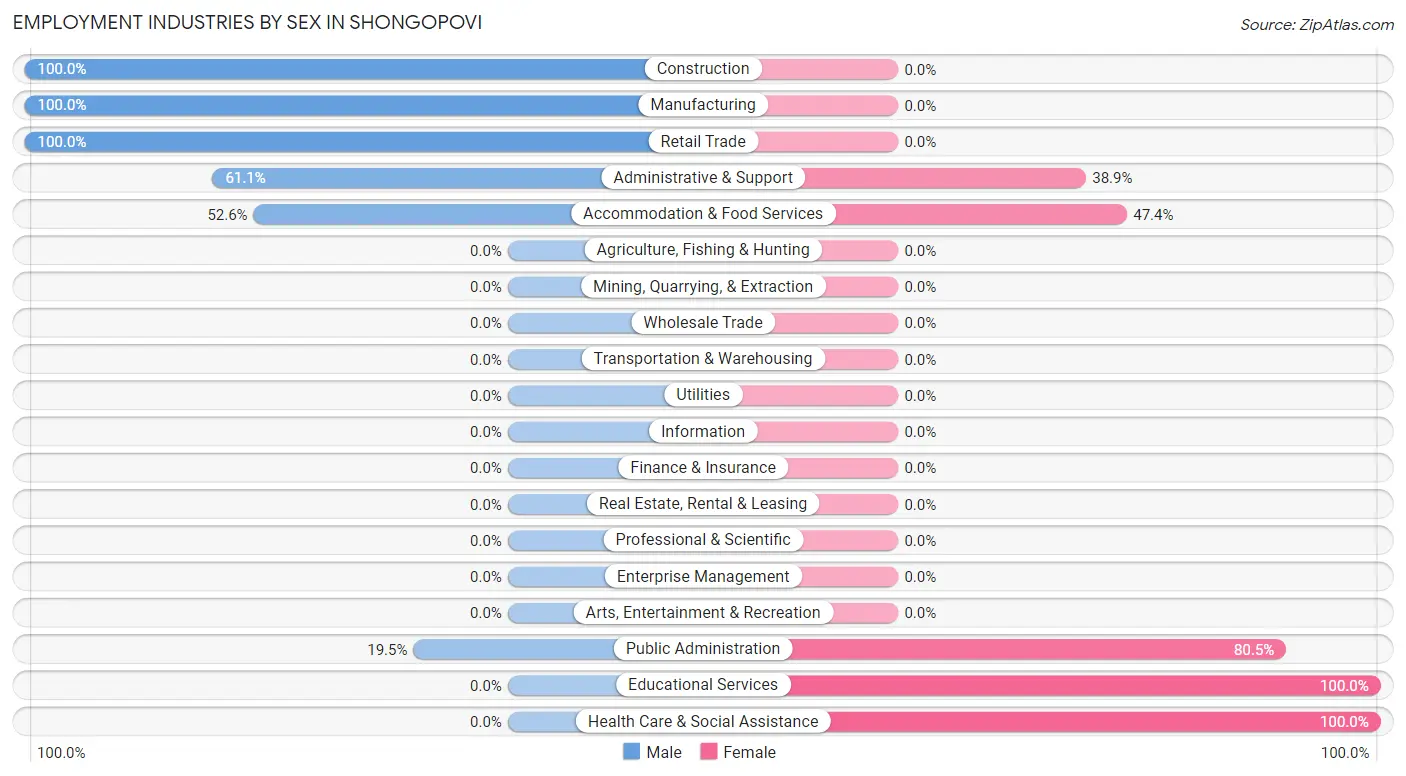
Employment Industries by Sex in Shongopovi
The Shongopovi industries that see more men than women are Construction (100.0%), Manufacturing (100.0%), and Retail Trade (100.0%), whereas the industries that tend to have a higher number of women are Educational Services (100.0%), Health Care & Social Assistance (100.0%), and Public Administration (80.5%).
| Industry | Male | Female |
| Agriculture, Fishing & Hunting | 0 (0.0%) | 0 (0.0%) |
| Mining, Quarrying, & Extraction | 0 (0.0%) | 0 (0.0%) |
| Construction | 26 (100.0%) | 0 (0.0%) |
| Manufacturing | 9 (100.0%) | 0 (0.0%) |
| Wholesale Trade | 0 (0.0%) | 0 (0.0%) |
| Retail Trade | 7 (100.0%) | 0 (0.0%) |
| Transportation & Warehousing | 0 (0.0%) | 0 (0.0%) |
| Utilities | 0 (0.0%) | 0 (0.0%) |
| Information | 0 (0.0%) | 0 (0.0%) |
| Finance & Insurance | 0 (0.0%) | 0 (0.0%) |
| Real Estate, Rental & Leasing | 0 (0.0%) | 0 (0.0%) |
| Professional & Scientific | 0 (0.0%) | 0 (0.0%) |
| Enterprise Management | 0 (0.0%) | 0 (0.0%) |
| Administrative & Support | 11 (61.1%) | 7 (38.9%) |
| Educational Services | 0 (0.0%) | 38 (100.0%) |
| Health Care & Social Assistance | 0 (0.0%) | 32 (100.0%) |
| Arts, Entertainment & Recreation | 0 (0.0%) | 0 (0.0%) |
| Accommodation & Food Services | 10 (52.6%) | 9 (47.4%) |
| Public Administration | 17 (19.5%) | 70 (80.5%) |
| Total | 80 (33.9%) | 156 (66.1%) |
Education in Shongopovi
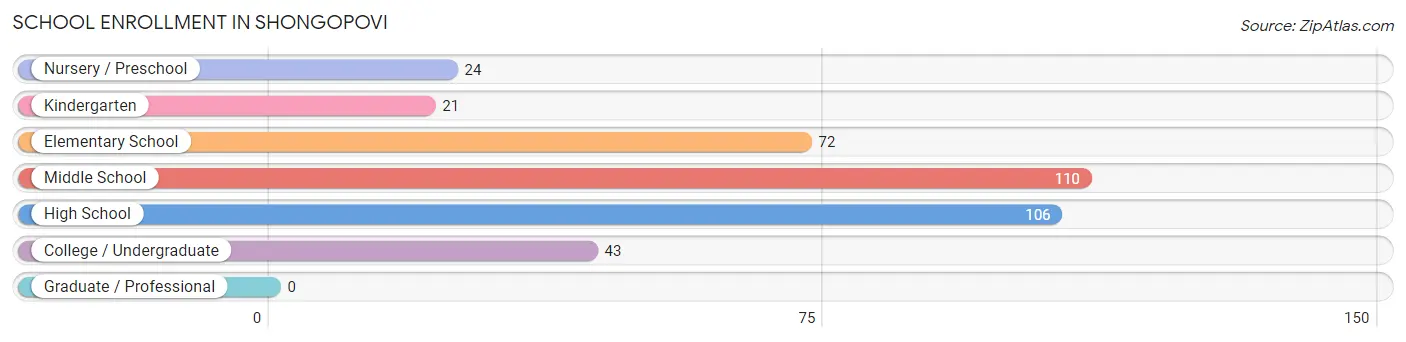
School Enrollment in Shongopovi
The most common levels of schooling among the 376 students in Shongopovi are middle school (110 | 29.3%), high school (106 | 28.2%), and elementary school (72 | 19.2%).
| School Level | # Students | % Students |
| Nursery / Preschool | 24 | 6.4% |
| Kindergarten | 21 | 5.6% |
| Elementary School | 72 | 19.2% |
| Middle School | 110 | 29.3% |
| High School | 106 | 28.2% |
| College / Undergraduate | 43 | 11.4% |
| Graduate / Professional | 0 | 0.0% |
| Total | 376 | 100.0% |
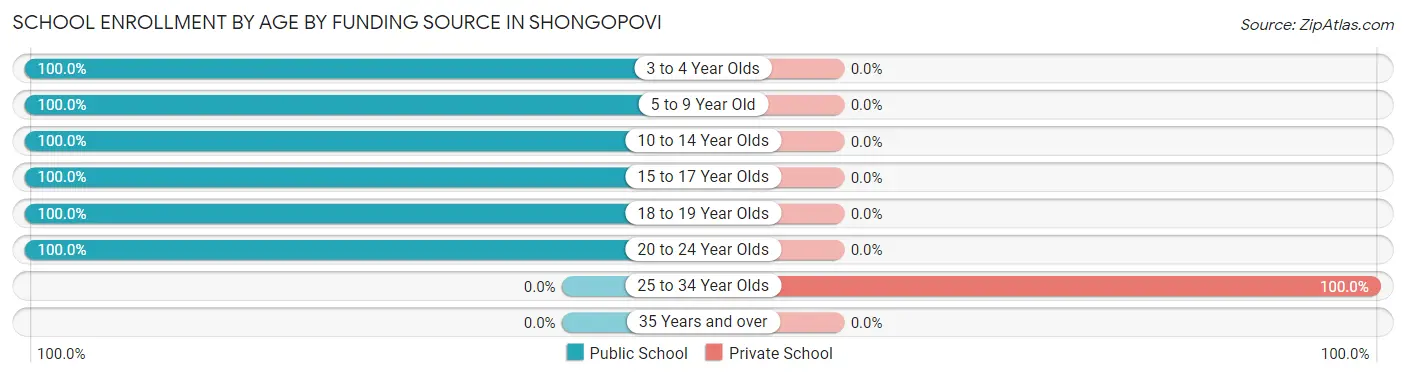
School Enrollment by Age by Funding Source in Shongopovi
Out of a total of 376 students who are enrolled in schools in Shongopovi, 17 (4.5%) attend a private institution, while the remaining 359 (95.5%) are enrolled in public schools. The age group of 25 to 34 year olds has the highest likelihood of being enrolled in private schools, with 17 (100.0% in the age bracket) enrolled. Conversely, the age group of 3 to 4 year olds has the lowest likelihood of being enrolled in a private school, with 24 (100.0% in the age bracket) attending a public institution.
| Age Bracket | Public School | Private School |
| 3 to 4 Year Olds | 24 (100.0%) | 0 (0.0%) |
| 5 to 9 Year Old | 74 (100.0%) | 0 (0.0%) |
| 10 to 14 Year Olds | 134 (100.0%) | 0 (0.0%) |
| 15 to 17 Year Olds | 54 (100.0%) | 0 (0.0%) |
| 18 to 19 Year Olds | 62 (100.0%) | 0 (0.0%) |
| 20 to 24 Year Olds | 11 (100.0%) | 0 (0.0%) |
| 25 to 34 Year Olds | 0 (0.0%) | 17 (100.0%) |
| 35 Years and over | 0 (0.0%) | 0 (0.0%) |
| Total | 359 (95.5%) | 17 (4.5%) |
Educational Attainment by Field of Study in Shongopovi
Education (18 | 75.0%), and business (6 | 25.0%) are the most common fields of study among 24 individuals in Shongopovi who have obtained a bachelor's degree or higher.
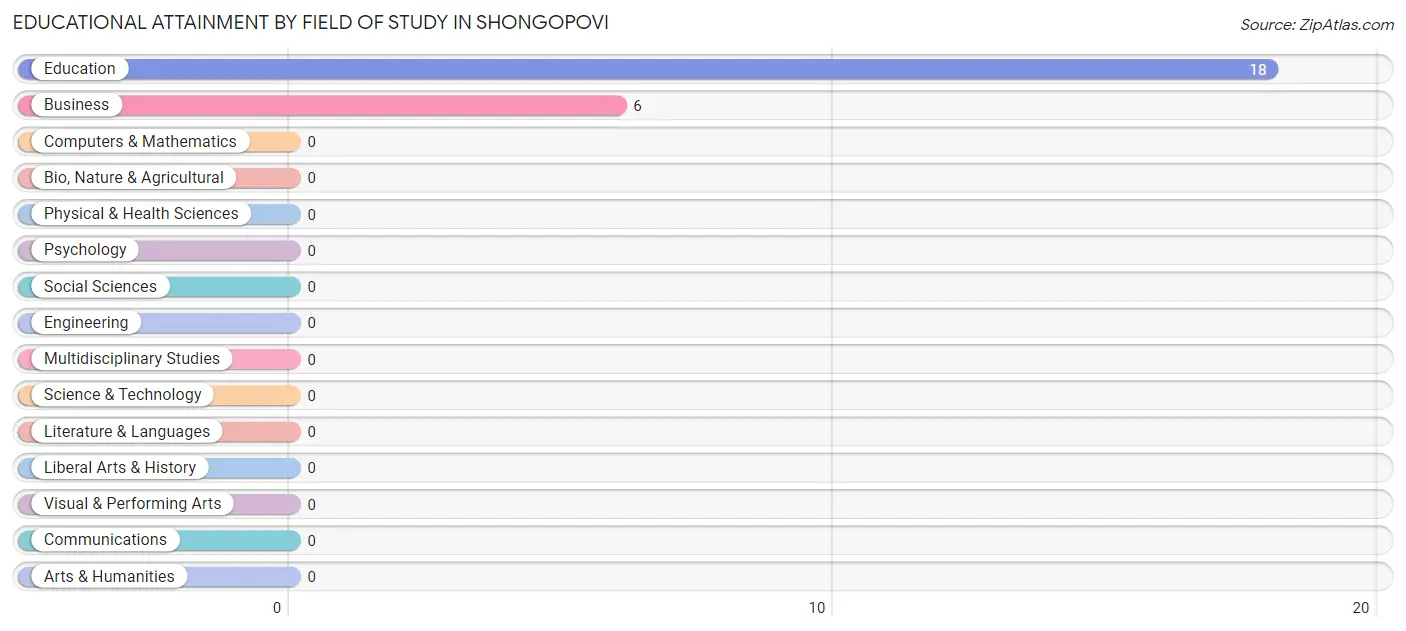
| Field of Study | # Graduates | % Graduates |
| Computers & Mathematics | 0 | 0.0% |
| Bio, Nature & Agricultural | 0 | 0.0% |
| Physical & Health Sciences | 0 | 0.0% |
| Psychology | 0 | 0.0% |
| Social Sciences | 0 | 0.0% |
| Engineering | 0 | 0.0% |
| Multidisciplinary Studies | 0 | 0.0% |
| Science & Technology | 0 | 0.0% |
| Business | 6 | 25.0% |
| Education | 18 | 75.0% |
| Literature & Languages | 0 | 0.0% |
| Liberal Arts & History | 0 | 0.0% |
| Visual & Performing Arts | 0 | 0.0% |
| Communications | 0 | 0.0% |
| Arts & Humanities | 0 | 0.0% |
| Total | 24 | 100.0% |
Transportation & Commute in Shongopovi
Vehicle Availability by Sex in Shongopovi
The most prevalent vehicle ownership categories in Shongopovi are males with 3 vehicles (40, accounting for 50.0%) and females with 3 vehicles (27, making up 25.6%).
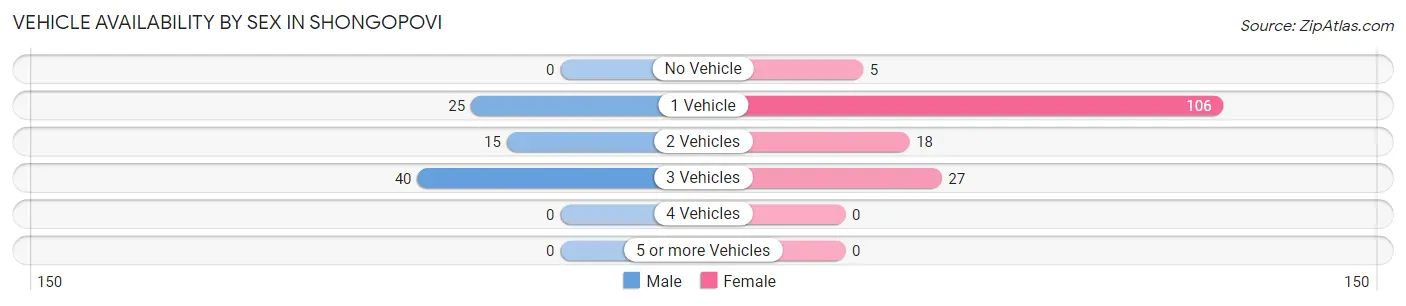
| Vehicles Available | Male | Female |
| No Vehicle | 0 (0.0%) | 5 (3.2%) |
| 1 Vehicle | 25 (31.2%) | 106 (67.9%) |
| 2 Vehicles | 15 (18.8%) | 18 (11.5%) |
| 3 Vehicles | 40 (50.0%) | 27 (17.3%) |
| 4 Vehicles | 0 (0.0%) | 0 (0.0%) |
| 5 or more Vehicles | 0 (0.0%) | 0 (0.0%) |
| Total | 80 (100.0%) | 156 (100.0%) |
Commute Time in Shongopovi
The most frequently occuring commute durations in Shongopovi are 10 to 14 minutes (92 commuters, 41.8%), 45 to 59 minutes (40 commuters, 18.2%), and 15 to 19 minutes (31 commuters, 14.1%).
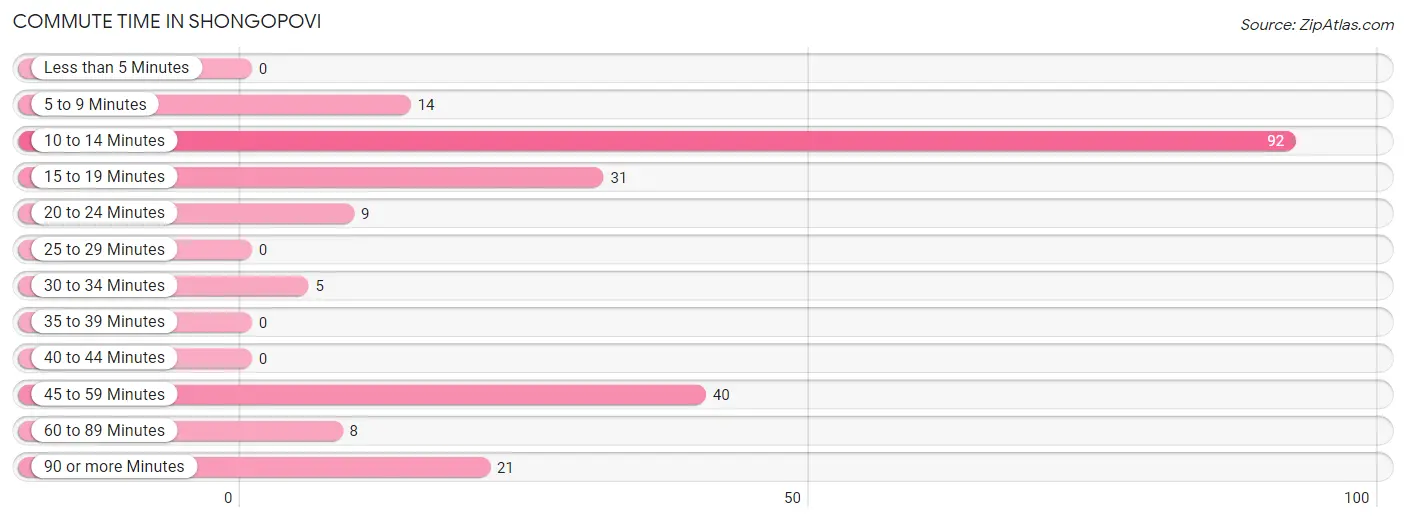
| Commute Time | # Commuters | % Commuters |
| Less than 5 Minutes | 0 | 0.0% |
| 5 to 9 Minutes | 14 | 6.4% |
| 10 to 14 Minutes | 92 | 41.8% |
| 15 to 19 Minutes | 31 | 14.1% |
| 20 to 24 Minutes | 9 | 4.1% |
| 25 to 29 Minutes | 0 | 0.0% |
| 30 to 34 Minutes | 5 | 2.3% |
| 35 to 39 Minutes | 0 | 0.0% |
| 40 to 44 Minutes | 0 | 0.0% |
| 45 to 59 Minutes | 40 | 18.2% |
| 60 to 89 Minutes | 8 | 3.6% |
| 90 or more Minutes | 21 | 9.6% |
Commute Time by Sex in Shongopovi
The most common commute times in Shongopovi are 90 or more minutes (21 commuters, 32.8%) for males and 10 to 14 minutes (84 commuters, 53.8%) for females.
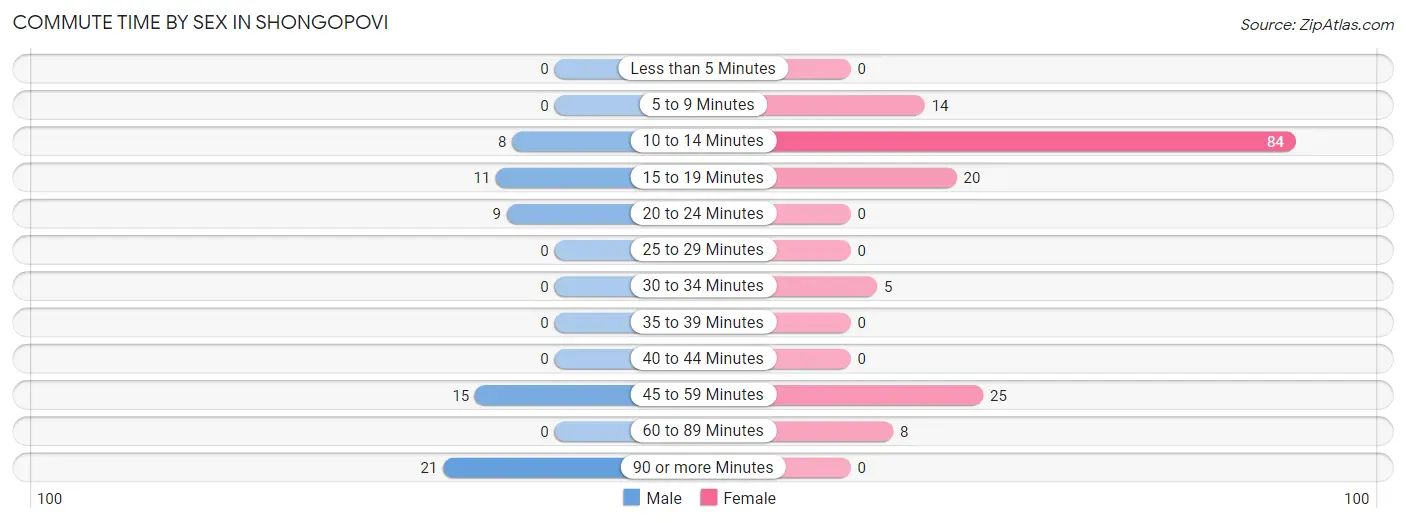
| Commute Time | Male | Female |
| Less than 5 Minutes | 0 (0.0%) | 0 (0.0%) |
| 5 to 9 Minutes | 0 (0.0%) | 14 (9.0%) |
| 10 to 14 Minutes | 8 (12.5%) | 84 (53.8%) |
| 15 to 19 Minutes | 11 (17.2%) | 20 (12.8%) |
| 20 to 24 Minutes | 9 (14.1%) | 0 (0.0%) |
| 25 to 29 Minutes | 0 (0.0%) | 0 (0.0%) |
| 30 to 34 Minutes | 0 (0.0%) | 5 (3.2%) |
| 35 to 39 Minutes | 0 (0.0%) | 0 (0.0%) |
| 40 to 44 Minutes | 0 (0.0%) | 0 (0.0%) |
| 45 to 59 Minutes | 15 (23.4%) | 25 (16.0%) |
| 60 to 89 Minutes | 0 (0.0%) | 8 (5.1%) |
| 90 or more Minutes | 21 (32.8%) | 0 (0.0%) |
Time of Departure to Work by Sex in Shongopovi
The most frequent times of departure to work in Shongopovi are 12:00 AM to 4:59 AM (21, 32.8%) for males and 7:30 AM to 7:59 AM (96, 61.5%) for females.
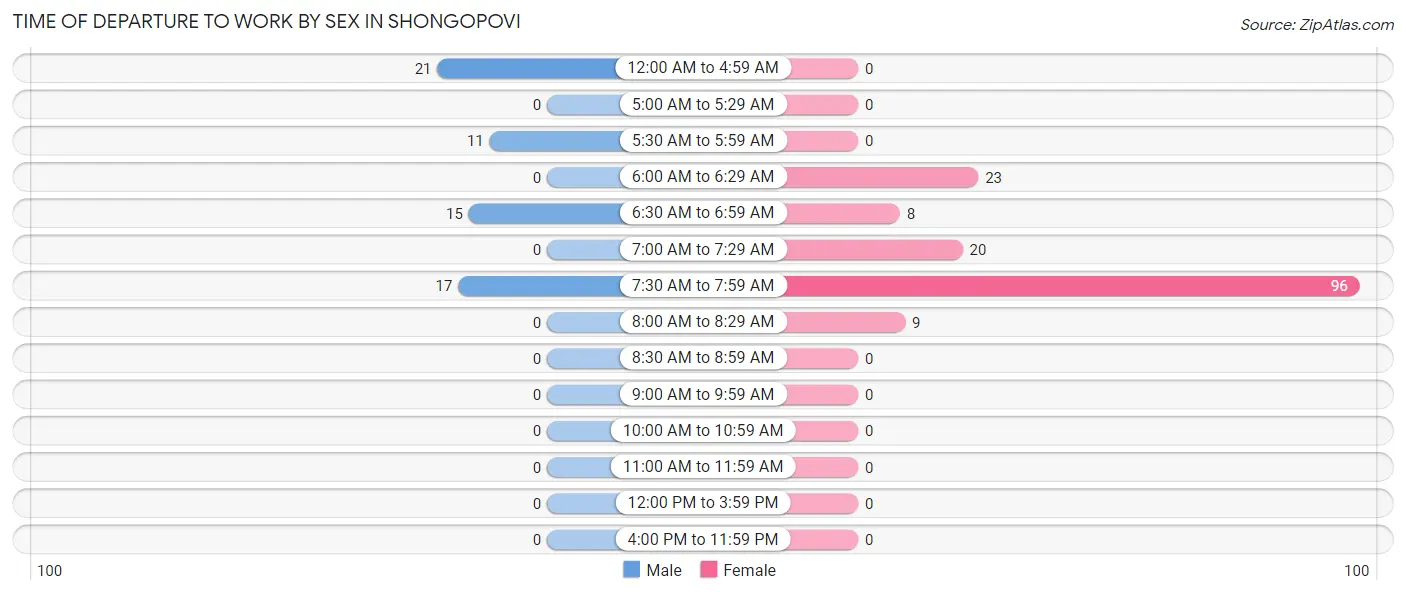
| Time of Departure | Male | Female |
| 12:00 AM to 4:59 AM | 21 (32.8%) | 0 (0.0%) |
| 5:00 AM to 5:29 AM | 0 (0.0%) | 0 (0.0%) |
| 5:30 AM to 5:59 AM | 11 (17.2%) | 0 (0.0%) |
| 6:00 AM to 6:29 AM | 0 (0.0%) | 23 (14.7%) |
| 6:30 AM to 6:59 AM | 15 (23.4%) | 8 (5.1%) |
| 7:00 AM to 7:29 AM | 0 (0.0%) | 20 (12.8%) |
| 7:30 AM to 7:59 AM | 17 (26.6%) | 96 (61.5%) |
| 8:00 AM to 8:29 AM | 0 (0.0%) | 9 (5.8%) |
| 8:30 AM to 8:59 AM | 0 (0.0%) | 0 (0.0%) |
| 9:00 AM to 9:59 AM | 0 (0.0%) | 0 (0.0%) |
| 10:00 AM to 10:59 AM | 0 (0.0%) | 0 (0.0%) |
| 11:00 AM to 11:59 AM | 0 (0.0%) | 0 (0.0%) |
| 12:00 PM to 3:59 PM | 0 (0.0%) | 0 (0.0%) |
| 4:00 PM to 11:59 PM | 0 (0.0%) | 0 (0.0%) |
| Total | 64 (100.0%) | 156 (100.0%) |
Housing Occupancy in Shongopovi
Occupancy by Ownership in Shongopovi
Of the total 288 dwellings in Shongopovi, owner-occupied units account for 199 (69.1%), while renter-occupied units make up 89 (30.9%).
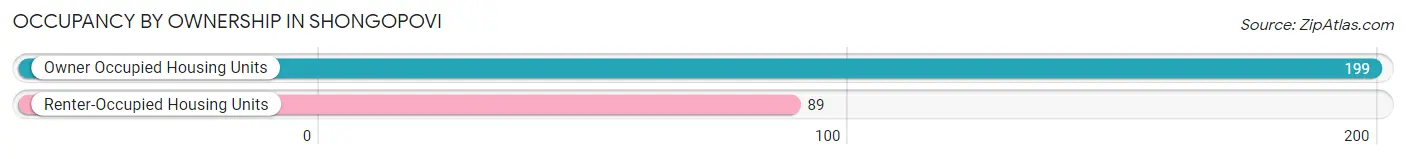
| Occupancy | # Housing Units | % Housing Units |
| Owner Occupied Housing Units | 199 | 69.1% |
| Renter-Occupied Housing Units | 89 | 30.9% |
| Total Occupied Housing Units | 288 | 100.0% |
Occupancy by Household Size in Shongopovi
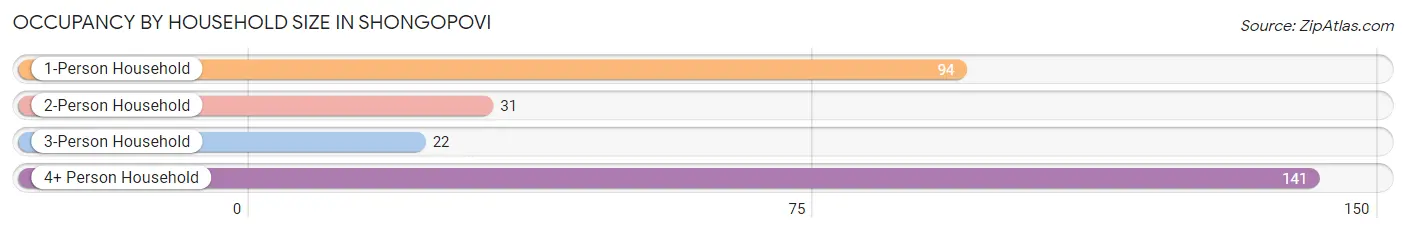
| Household Size | # Housing Units | % Housing Units |
| 1-Person Household | 94 | 32.6% |
| 2-Person Household | 31 | 10.8% |
| 3-Person Household | 22 | 7.6% |
| 4+ Person Household | 141 | 49.0% |
| Total Housing Units | 288 | 100.0% |
Occupancy by Ownership by Household Size in Shongopovi
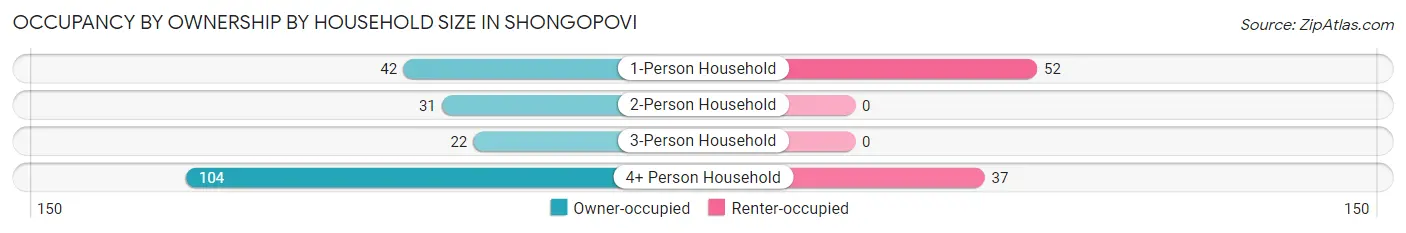
| Household Size | Owner-occupied | Renter-occupied |
| 1-Person Household | 42 (44.7%) | 52 (55.3%) |
| 2-Person Household | 31 (100.0%) | 0 (0.0%) |
| 3-Person Household | 22 (100.0%) | 0 (0.0%) |
| 4+ Person Household | 104 (73.8%) | 37 (26.2%) |
| Total Housing Units | 199 (69.1%) | 89 (30.9%) |
Occupancy by Educational Attainment in Shongopovi
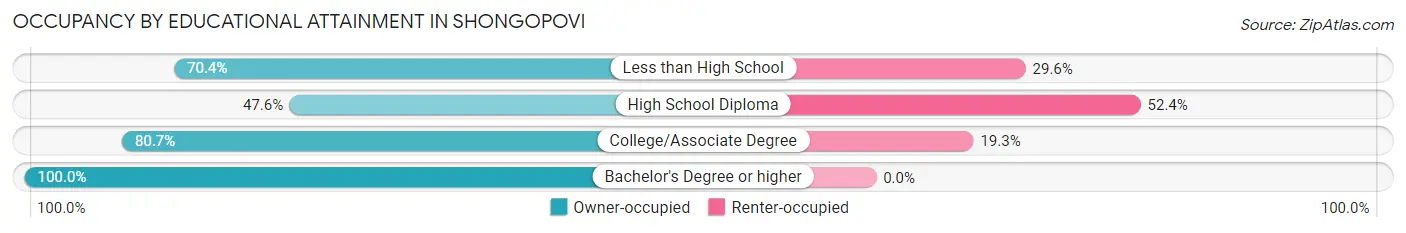
| Household Size | Owner-occupied | Renter-occupied |
| Less than High School | 19 (70.4%) | 8 (29.6%) |
| High School Diploma | 49 (47.6%) | 54 (52.4%) |
| College/Associate Degree | 113 (80.7%) | 27 (19.3%) |
| Bachelor's Degree or higher | 18 (100.0%) | 0 (0.0%) |
Occupancy by Age of Householder in Shongopovi
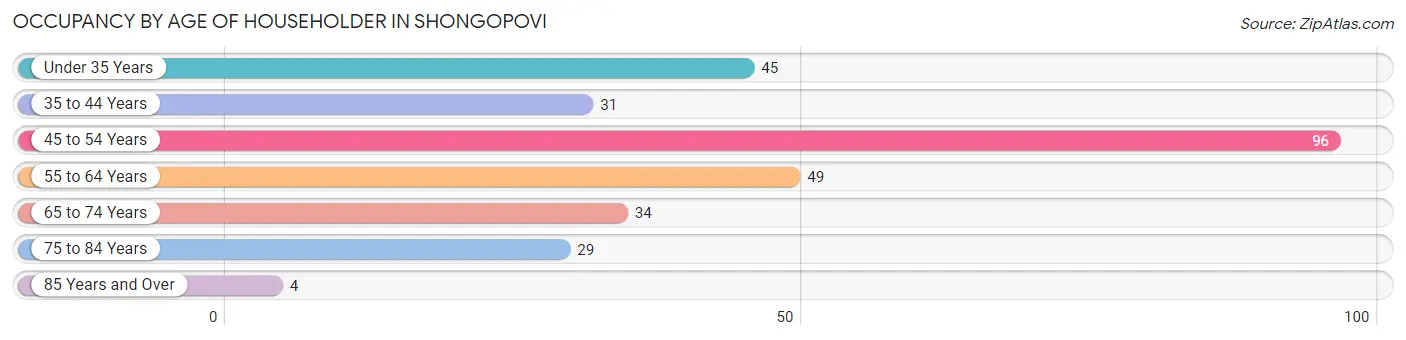
| Age Bracket | # Households | % Households |
| Under 35 Years | 45 | 15.6% |
| 35 to 44 Years | 31 | 10.8% |
| 45 to 54 Years | 96 | 33.3% |
| 55 to 64 Years | 49 | 17.0% |
| 65 to 74 Years | 34 | 11.8% |
| 75 to 84 Years | 29 | 10.1% |
| 85 Years and Over | 4 | 1.4% |
| Total | 288 | 100.0% |
Housing Finances in Shongopovi
Median Income by Occupancy in Shongopovi
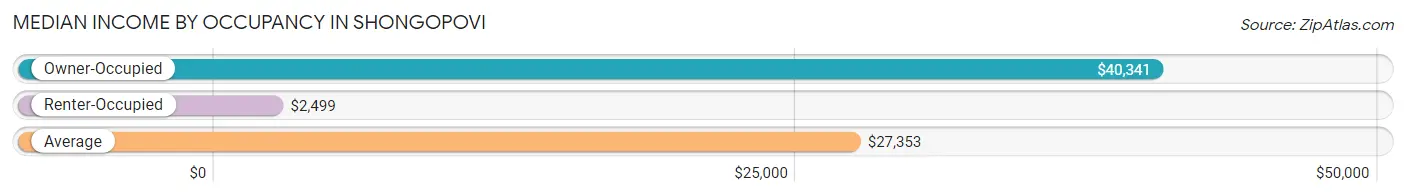
| Occupancy Type | # Households | Median Income |
| Owner-Occupied | 199 (69.1%) | $40,341 |
| Renter-Occupied | 89 (30.9%) | $2,499 |
| Average | 288 (100.0%) | $27,353 |
Occupancy by Householder Income Bracket in Shongopovi
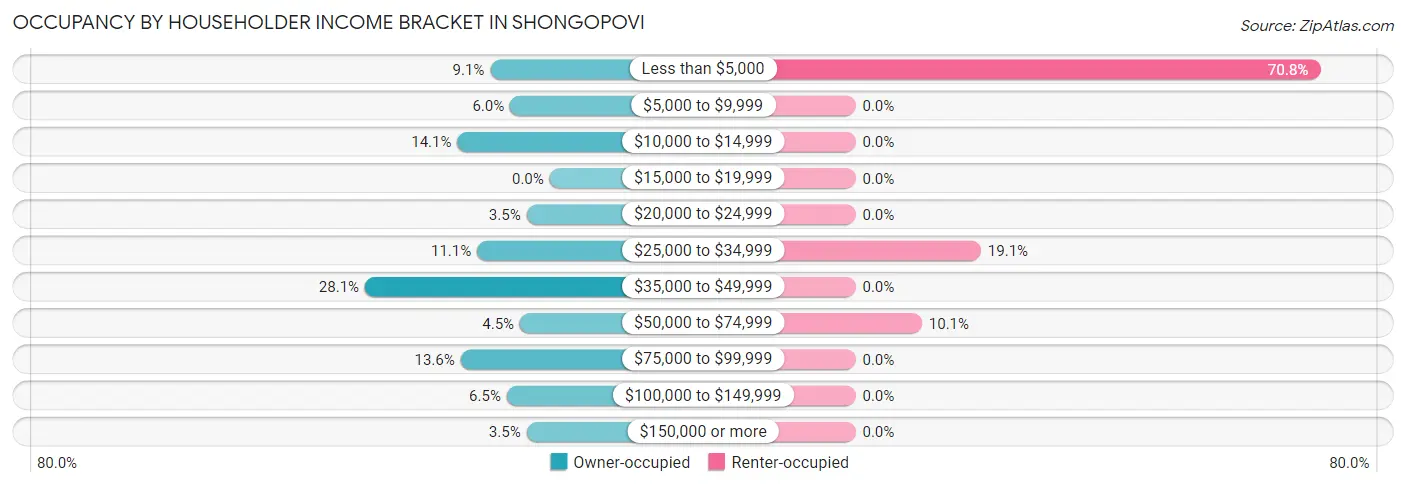
| Income Bracket | Owner-occupied | Renter-occupied |
| Less than $5,000 | 18 (9.0%) | 63 (70.8%) |
| $5,000 to $9,999 | 12 (6.0%) | 0 (0.0%) |
| $10,000 to $14,999 | 28 (14.1%) | 0 (0.0%) |
| $15,000 to $19,999 | 0 (0.0%) | 0 (0.0%) |
| $20,000 to $24,999 | 7 (3.5%) | 0 (0.0%) |
| $25,000 to $34,999 | 22 (11.1%) | 17 (19.1%) |
| $35,000 to $49,999 | 56 (28.1%) | 0 (0.0%) |
| $50,000 to $74,999 | 9 (4.5%) | 9 (10.1%) |
| $75,000 to $99,999 | 27 (13.6%) | 0 (0.0%) |
| $100,000 to $149,999 | 13 (6.5%) | 0 (0.0%) |
| $150,000 or more | 7 (3.5%) | 0 (0.0%) |
| Total | 199 (100.0%) | 89 (100.0%) |
Monthly Housing Cost Tiers in Shongopovi
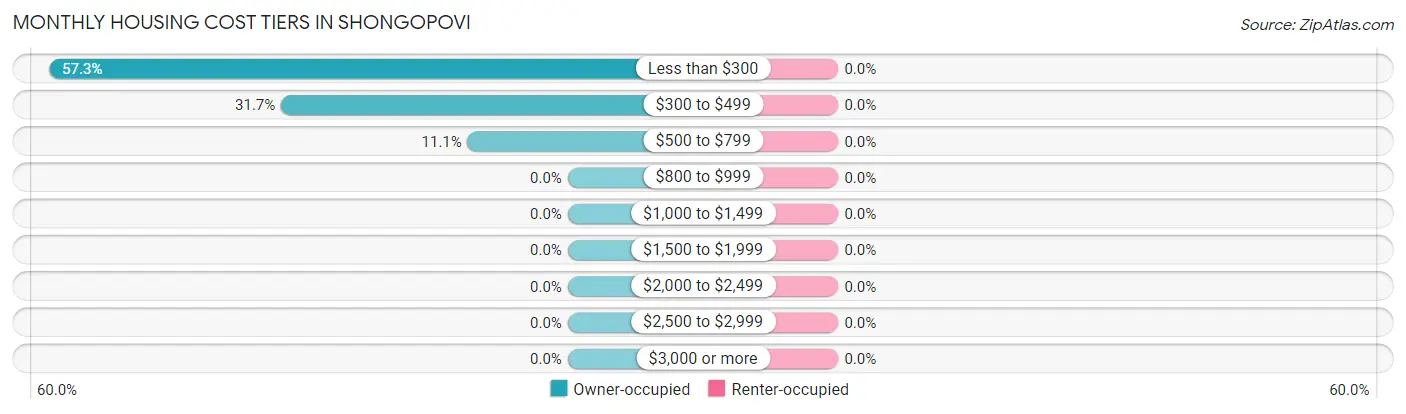
| Monthly Cost | Owner-occupied | Renter-occupied |
| Less than $300 | 114 (57.3%) | 0 (0.0%) |
| $300 to $499 | 63 (31.7%) | 0 (0.0%) |
| $500 to $799 | 22 (11.1%) | 0 (0.0%) |
| $800 to $999 | 0 (0.0%) | 0 (0.0%) |
| $1,000 to $1,499 | 0 (0.0%) | 0 (0.0%) |
| $1,500 to $1,999 | 0 (0.0%) | 0 (0.0%) |
| $2,000 to $2,499 | 0 (0.0%) | 0 (0.0%) |
| $2,500 to $2,999 | 0 (0.0%) | 0 (0.0%) |
| $3,000 or more | 0 (0.0%) | 0 (0.0%) |
| Total | 199 (100.0%) | 89 (100.0%) |
Physical Housing Characteristics in Shongopovi
Housing Structures in Shongopovi
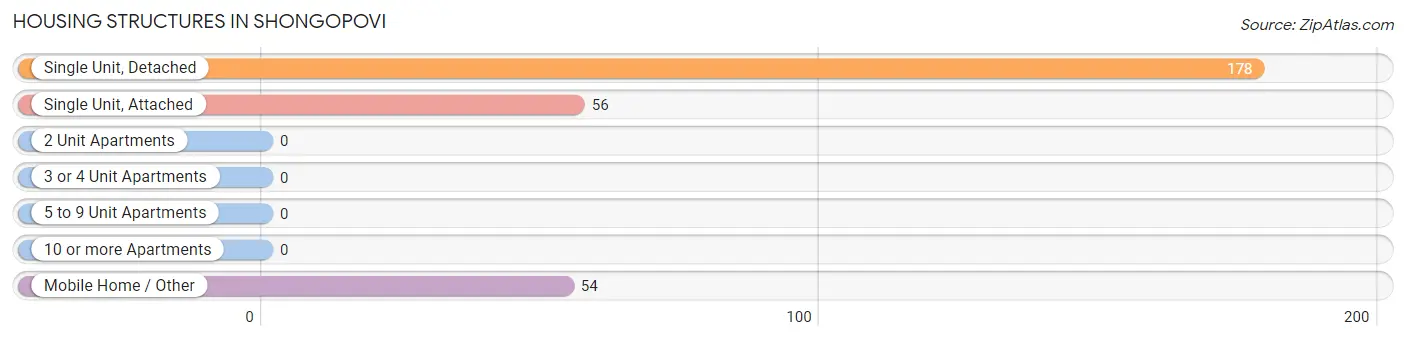
| Structure Type | # Housing Units | % Housing Units |
| Single Unit, Detached | 178 | 61.8% |
| Single Unit, Attached | 56 | 19.4% |
| 2 Unit Apartments | 0 | 0.0% |
| 3 or 4 Unit Apartments | 0 | 0.0% |
| 5 to 9 Unit Apartments | 0 | 0.0% |
| 10 or more Apartments | 0 | 0.0% |
| Mobile Home / Other | 54 | 18.8% |
| Total | 288 | 100.0% |
Housing Structures by Occupancy in Shongopovi
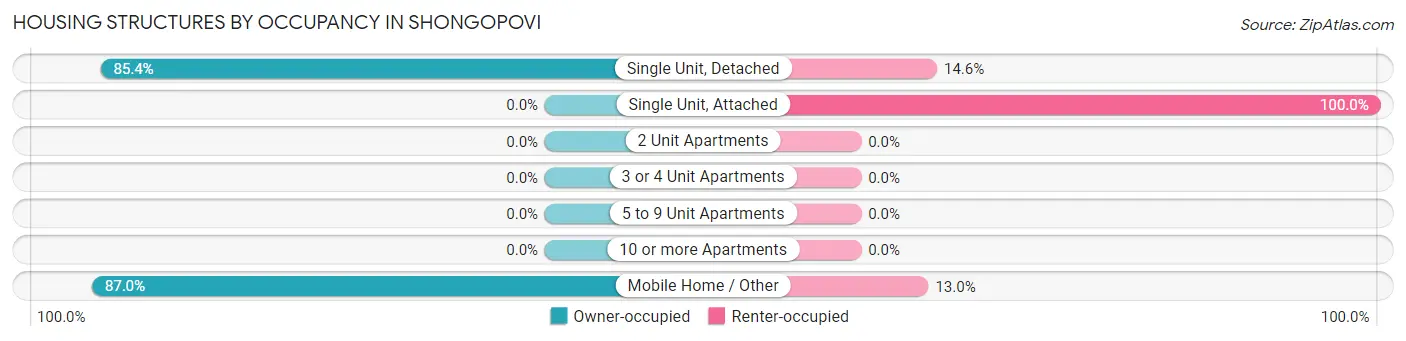
| Structure Type | Owner-occupied | Renter-occupied |
| Single Unit, Detached | 152 (85.4%) | 26 (14.6%) |
| Single Unit, Attached | 0 (0.0%) | 56 (100.0%) |
| 2 Unit Apartments | 0 (0.0%) | 0 (0.0%) |
| 3 or 4 Unit Apartments | 0 (0.0%) | 0 (0.0%) |
| 5 to 9 Unit Apartments | 0 (0.0%) | 0 (0.0%) |
| 10 or more Apartments | 0 (0.0%) | 0 (0.0%) |
| Mobile Home / Other | 47 (87.0%) | 7 (13.0%) |
| Total | 199 (69.1%) | 89 (30.9%) |
Housing Structures by Number of Rooms in Shongopovi
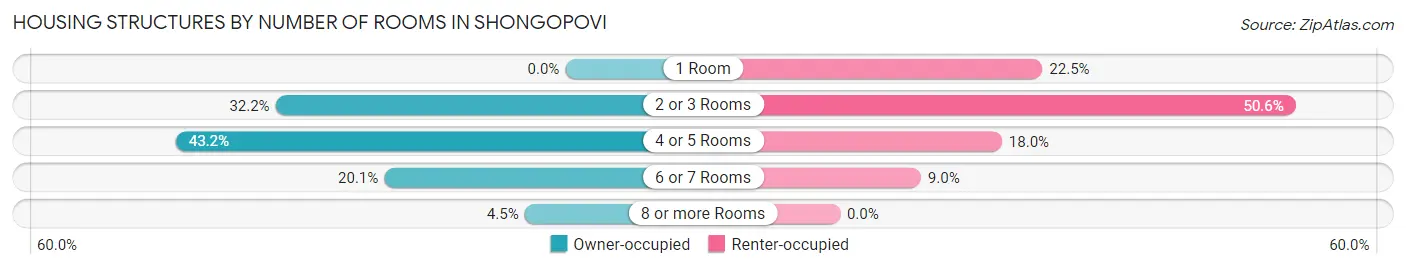
| Number of Rooms | Owner-occupied | Renter-occupied |
| 1 Room | 0 (0.0%) | 20 (22.5%) |
| 2 or 3 Rooms | 64 (32.2%) | 45 (50.6%) |
| 4 or 5 Rooms | 86 (43.2%) | 16 (18.0%) |
| 6 or 7 Rooms | 40 (20.1%) | 8 (9.0%) |
| 8 or more Rooms | 9 (4.5%) | 0 (0.0%) |
| Total | 199 (100.0%) | 89 (100.0%) |
Housing Structure by Heating Type in Shongopovi
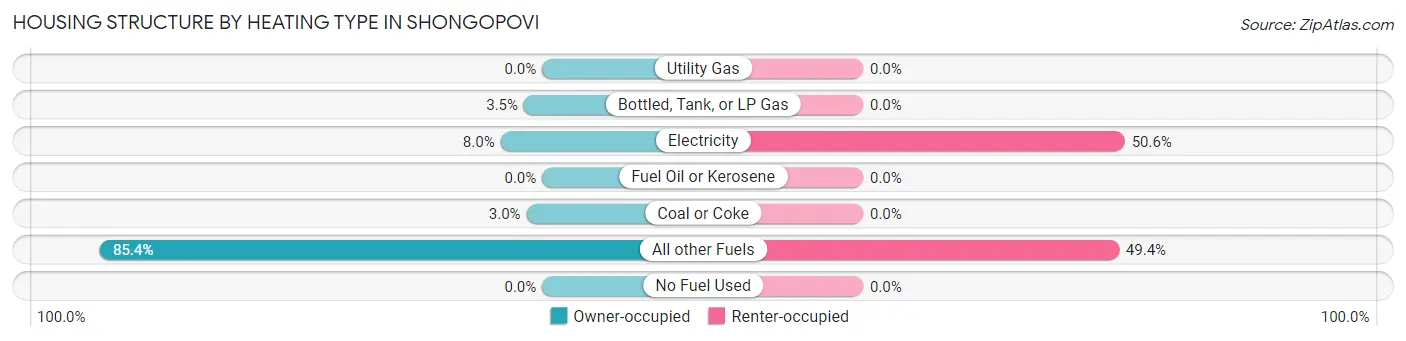
| Heating Type | Owner-occupied | Renter-occupied |
| Utility Gas | 0 (0.0%) | 0 (0.0%) |
| Bottled, Tank, or LP Gas | 7 (3.5%) | 0 (0.0%) |
| Electricity | 16 (8.0%) | 45 (50.6%) |
| Fuel Oil or Kerosene | 0 (0.0%) | 0 (0.0%) |
| Coal or Coke | 6 (3.0%) | 0 (0.0%) |
| All other Fuels | 170 (85.4%) | 44 (49.4%) |
| No Fuel Used | 0 (0.0%) | 0 (0.0%) |
| Total | 199 (100.0%) | 89 (100.0%) |
Household Vehicle Usage in Shongopovi
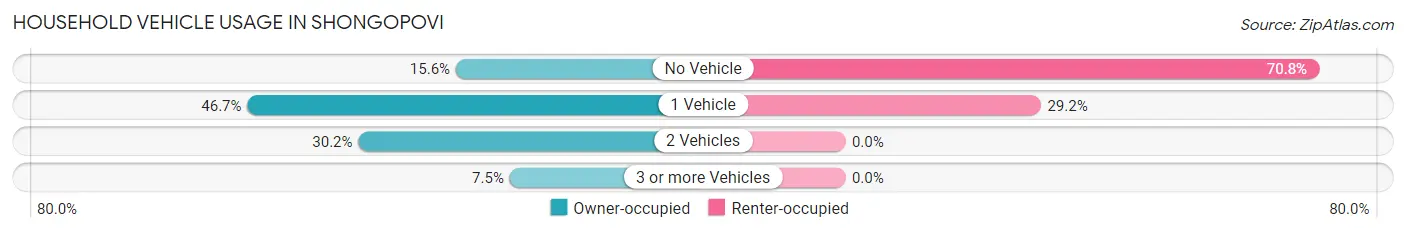
| Vehicles per Household | Owner-occupied | Renter-occupied |
| No Vehicle | 31 (15.6%) | 63 (70.8%) |
| 1 Vehicle | 93 (46.7%) | 26 (29.2%) |
| 2 Vehicles | 60 (30.1%) | 0 (0.0%) |
| 3 or more Vehicles | 15 (7.5%) | 0 (0.0%) |
| Total | 199 (100.0%) | 89 (100.0%) |
Real Estate & Mortgages in Shongopovi
Real Estate and Mortgage Overview in Shongopovi
| Characteristic | Without Mortgage | With Mortgage |
| Housing Units | 192 | 7 |
| Median Property Value | $79,000 | $0 |
| Median Household Income | $39,286 | $7 |
| Monthly Housing Costs | $271 | $0 |
| Real Estate Taxes | - | - |
Property Value by Mortgage Status in Shongopovi
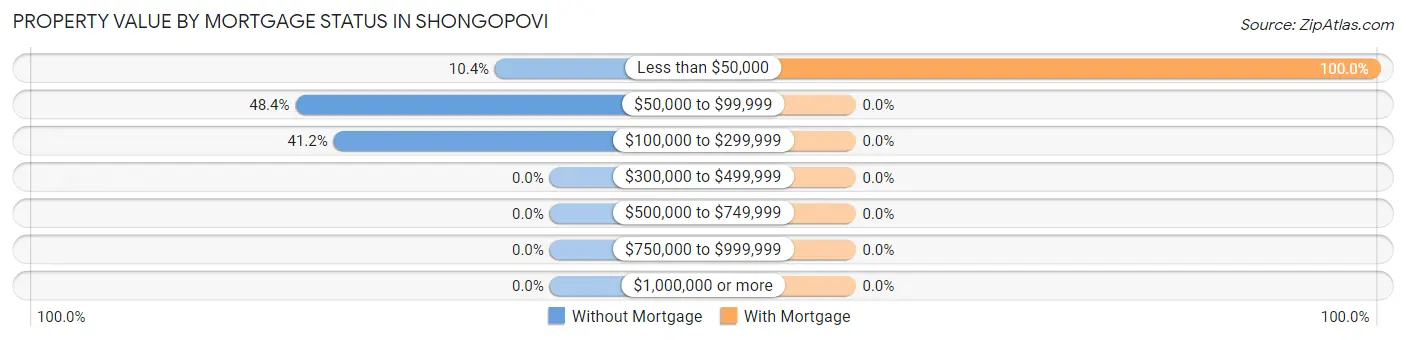
| Property Value | Without Mortgage | With Mortgage |
| Less than $50,000 | 20 (10.4%) | 7 (100.0%) |
| $50,000 to $99,999 | 93 (48.4%) | 0 (0.0%) |
| $100,000 to $299,999 | 79 (41.1%) | 0 (0.0%) |
| $300,000 to $499,999 | 0 (0.0%) | 0 (0.0%) |
| $500,000 to $749,999 | 0 (0.0%) | 0 (0.0%) |
| $750,000 to $999,999 | 0 (0.0%) | 0 (0.0%) |
| $1,000,000 or more | 0 (0.0%) | 0 (0.0%) |
| Total | 192 (100.0%) | 7 (100.0%) |
Household Income by Mortgage Status in Shongopovi
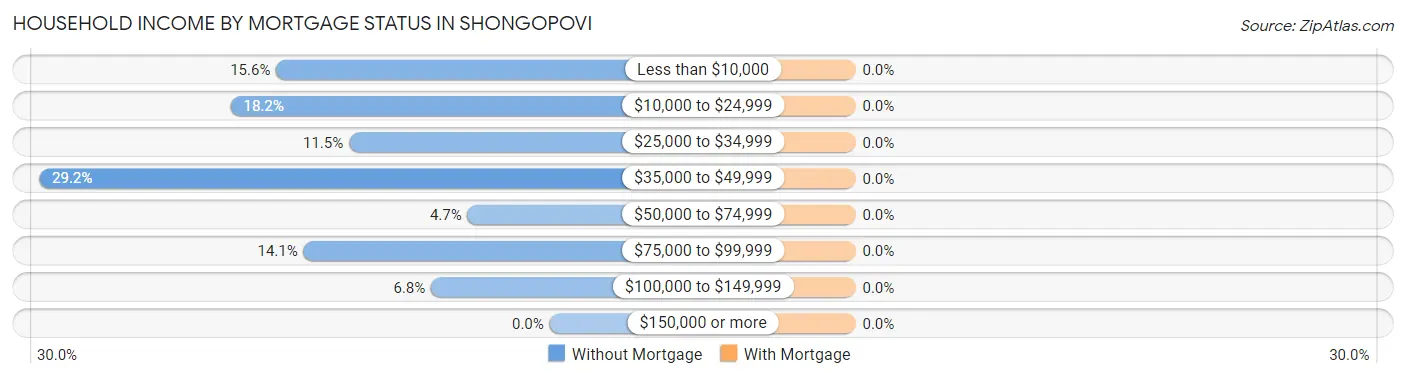
| Household Income | Without Mortgage | With Mortgage |
| Less than $10,000 | 30 (15.6%) | 0 (0.0%) |
| $10,000 to $24,999 | 35 (18.2%) | 0 (0.0%) |
| $25,000 to $34,999 | 22 (11.5%) | 0 (0.0%) |
| $35,000 to $49,999 | 56 (29.2%) | 0 (0.0%) |
| $50,000 to $74,999 | 9 (4.7%) | 0 (0.0%) |
| $75,000 to $99,999 | 27 (14.1%) | 0 (0.0%) |
| $100,000 to $149,999 | 13 (6.8%) | 0 (0.0%) |
| $150,000 or more | 0 (0.0%) | 0 (0.0%) |
| Total | 192 (100.0%) | 7 (100.0%) |
Property Value to Household Income Ratio in Shongopovi
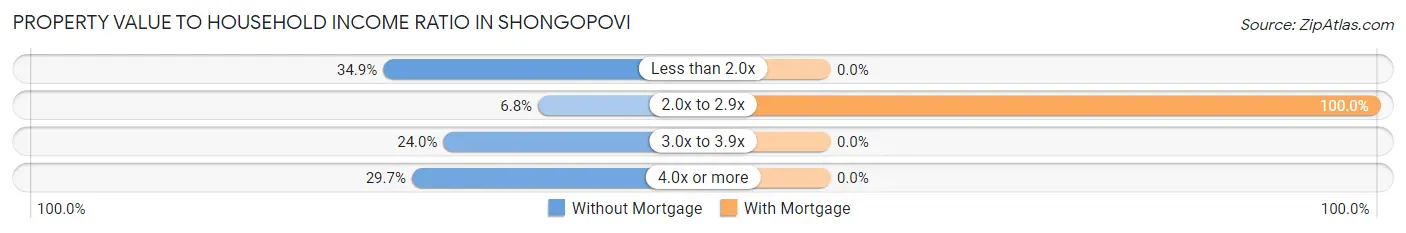
| Value-to-Income Ratio | Without Mortgage | With Mortgage |
| Less than 2.0x | 67 (34.9%) | 0 (0.0%) |
| 2.0x to 2.9x | 13 (6.8%) | 7 (100.0%) |
| 3.0x to 3.9x | 46 (24.0%) | 0 (0.0%) |
| 4.0x or more | 57 (29.7%) | 0 (0.0%) |
| Total | 192 (100.0%) | 7 (100.0%) |
Real Estate Taxes by Mortgage Status in Shongopovi
| Property Taxes | Without Mortgage | With Mortgage |
| Less than $800 | 0 (0.0%) | 0 (0.0%) |
| $800 to $1,499 | 0 (0.0%) | 0 (0.0%) |
| $800 to $1,499 | 0 (0.0%) | 0 (0.0%) |
| Total | 192 (100.0%) | 7 (100.0%) |
Health & Disability in Shongopovi
Health Insurance Coverage by Age in Shongopovi
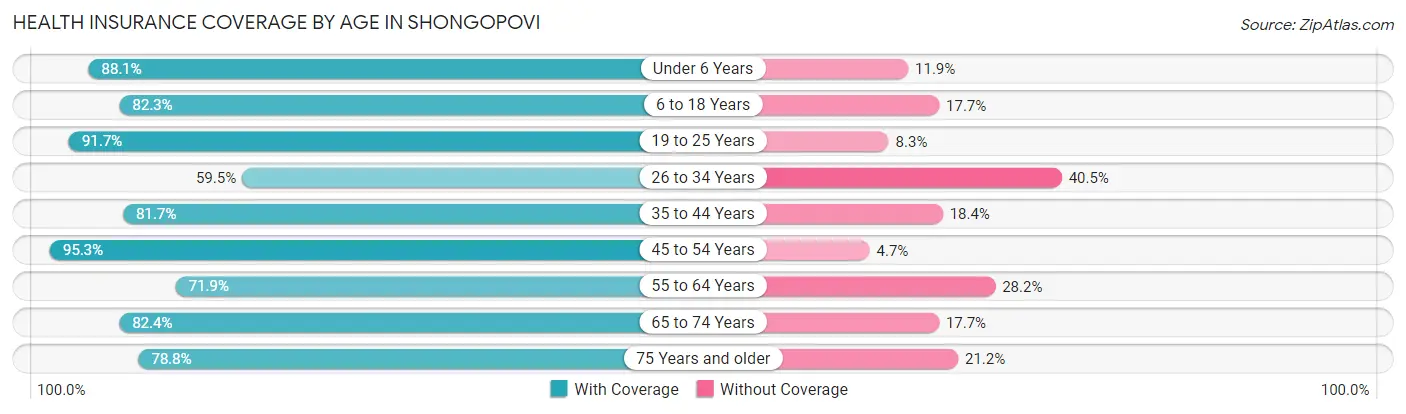
| Age Bracket | With Coverage | Without Coverage |
| Under 6 Years | 74 (88.1%) | 10 (11.9%) |
| 6 to 18 Years | 256 (82.3%) | 55 (17.7%) |
| 19 to 25 Years | 122 (91.7%) | 11 (8.3%) |
| 26 to 34 Years | 110 (59.5%) | 75 (40.5%) |
| 35 to 44 Years | 89 (81.7%) | 20 (18.3%) |
| 45 to 54 Years | 121 (95.3%) | 6 (4.7%) |
| 55 to 64 Years | 97 (71.9%) | 38 (28.1%) |
| 65 to 74 Years | 28 (82.4%) | 6 (17.6%) |
| 75 Years and older | 26 (78.8%) | 7 (21.2%) |
| Total | 923 (80.2%) | 228 (19.8%) |
Health Insurance Coverage by Citizenship Status in Shongopovi
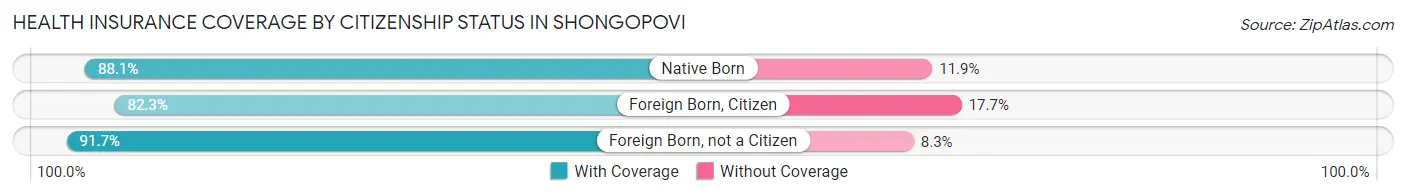
| Citizenship Status | With Coverage | Without Coverage |
| Native Born | 74 (88.1%) | 10 (11.9%) |
| Foreign Born, Citizen | 256 (82.3%) | 55 (17.7%) |
| Foreign Born, not a Citizen | 122 (91.7%) | 11 (8.3%) |
Health Insurance Coverage by Household Income in Shongopovi
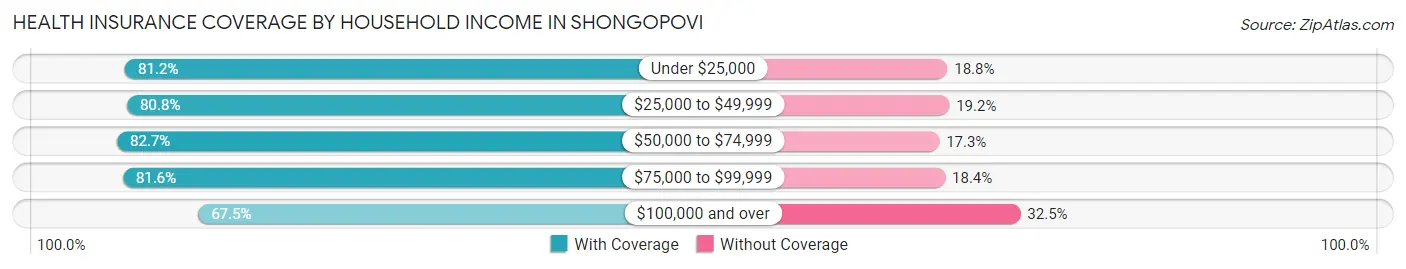
| Household Income | With Coverage | Without Coverage |
| Under $25,000 | 250 (81.2%) | 58 (18.8%) |
| $25,000 to $49,999 | 438 (80.8%) | 104 (19.2%) |
| $50,000 to $74,999 | 86 (82.7%) | 18 (17.3%) |
| $75,000 to $99,999 | 93 (81.6%) | 21 (18.4%) |
| $100,000 and over | 56 (67.5%) | 27 (32.5%) |
Public vs Private Health Insurance Coverage by Age in Shongopovi
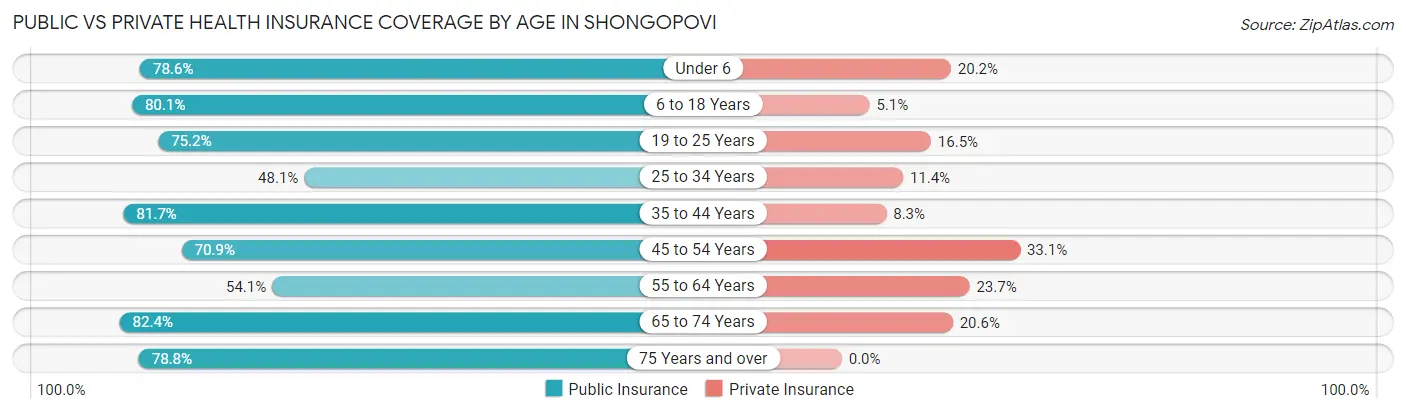
| Age Bracket | Public Insurance | Private Insurance |
| Under 6 | 66 (78.6%) | 17 (20.2%) |
| 6 to 18 Years | 249 (80.1%) | 16 (5.1%) |
| 19 to 25 Years | 100 (75.2%) | 22 (16.5%) |
| 25 to 34 Years | 89 (48.1%) | 21 (11.4%) |
| 35 to 44 Years | 89 (81.7%) | 9 (8.3%) |
| 45 to 54 Years | 90 (70.9%) | 42 (33.1%) |
| 55 to 64 Years | 73 (54.1%) | 32 (23.7%) |
| 65 to 74 Years | 28 (82.4%) | 7 (20.6%) |
| 75 Years and over | 26 (78.8%) | 0 (0.0%) |
| Total | 810 (70.4%) | 166 (14.4%) |
Disability Status by Sex by Age in Shongopovi
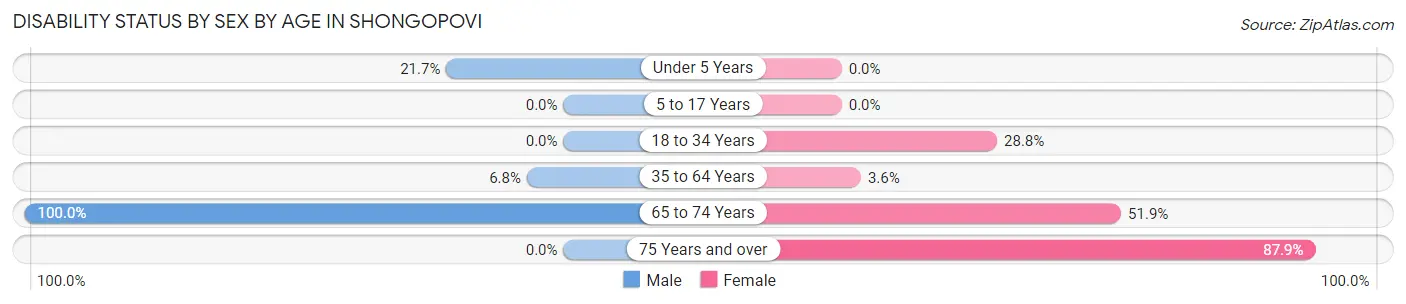
| Age Bracket | Male | Female |
| Under 5 Years | 10 (21.7%) | 0 (0.0%) |
| 5 to 17 Years | 0 (0.0%) | 0 (0.0%) |
| 18 to 34 Years | 0 (0.0%) | 47 (28.8%) |
| 35 to 64 Years | 8 (6.8%) | 9 (3.6%) |
| 65 to 74 Years | 7 (100.0%) | 14 (51.8%) |
| 75 Years and over | 0 (0.0%) | 29 (87.9%) |
Disability Class by Sex by Age in Shongopovi
Disability Class: Hearing Difficulty
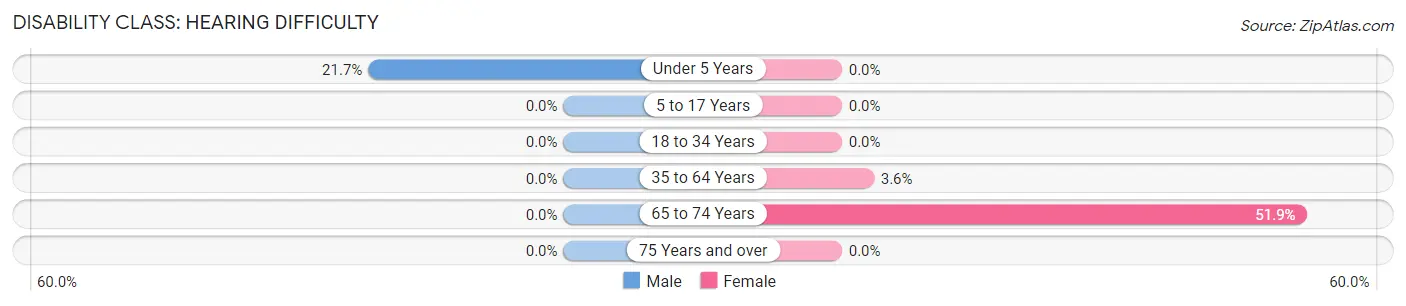
| Age Bracket | Male | Female |
| Under 5 Years | 10 (21.7%) | 0 (0.0%) |
| 5 to 17 Years | 0 (0.0%) | 0 (0.0%) |
| 18 to 34 Years | 0 (0.0%) | 0 (0.0%) |
| 35 to 64 Years | 0 (0.0%) | 9 (3.6%) |
| 65 to 74 Years | 0 (0.0%) | 14 (51.8%) |
| 75 Years and over | 0 (0.0%) | 0 (0.0%) |
Disability Class: Vision Difficulty
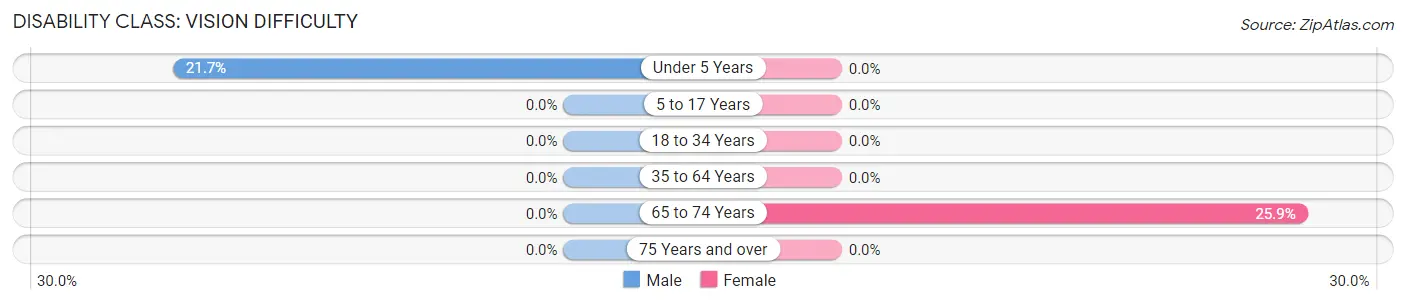
| Age Bracket | Male | Female |
| Under 5 Years | 10 (21.7%) | 0 (0.0%) |
| 5 to 17 Years | 0 (0.0%) | 0 (0.0%) |
| 18 to 34 Years | 0 (0.0%) | 0 (0.0%) |
| 35 to 64 Years | 0 (0.0%) | 0 (0.0%) |
| 65 to 74 Years | 0 (0.0%) | 7 (25.9%) |
| 75 Years and over | 0 (0.0%) | 0 (0.0%) |
Disability Class: Cognitive Difficulty
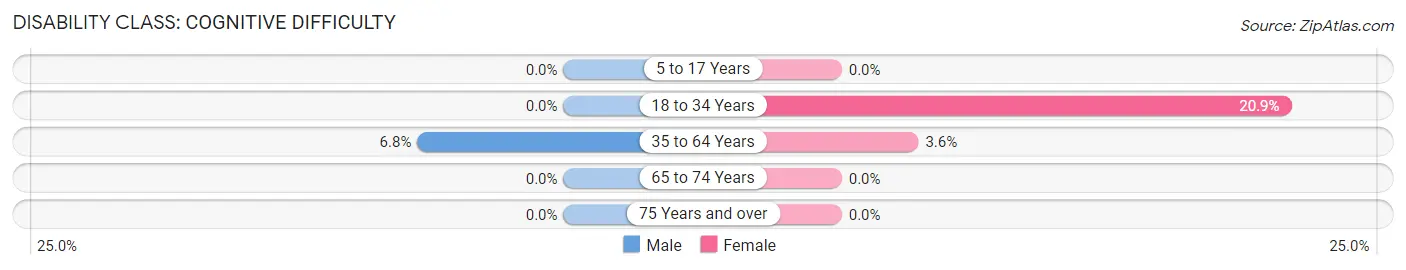
| Age Bracket | Male | Female |
| 5 to 17 Years | 0 (0.0%) | 0 (0.0%) |
| 18 to 34 Years | 0 (0.0%) | 34 (20.9%) |
| 35 to 64 Years | 8 (6.8%) | 9 (3.6%) |
| 65 to 74 Years | 0 (0.0%) | 0 (0.0%) |
| 75 Years and over | 0 (0.0%) | 0 (0.0%) |
Disability Class: Ambulatory Difficulty
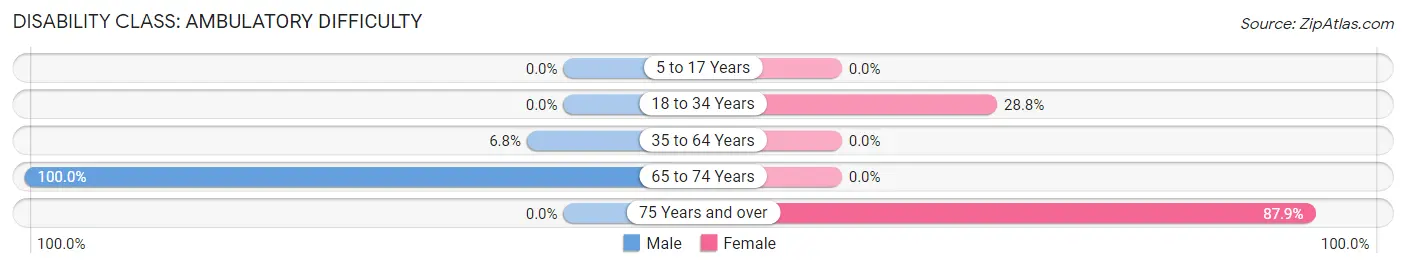
| Age Bracket | Male | Female |
| 5 to 17 Years | 0 (0.0%) | 0 (0.0%) |
| 18 to 34 Years | 0 (0.0%) | 47 (28.8%) |
| 35 to 64 Years | 8 (6.8%) | 0 (0.0%) |
| 65 to 74 Years | 7 (100.0%) | 0 (0.0%) |
| 75 Years and over | 0 (0.0%) | 29 (87.9%) |
Disability Class: Self-Care Difficulty
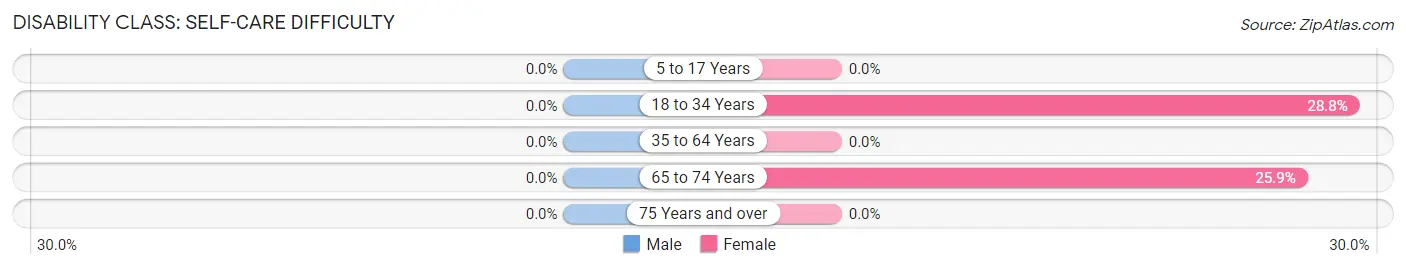
| Age Bracket | Male | Female |
| 5 to 17 Years | 0 (0.0%) | 0 (0.0%) |
| 18 to 34 Years | 0 (0.0%) | 47 (28.8%) |
| 35 to 64 Years | 0 (0.0%) | 0 (0.0%) |
| 65 to 74 Years | 0 (0.0%) | 7 (25.9%) |
| 75 Years and over | 0 (0.0%) | 0 (0.0%) |
Technology Access in Shongopovi
Computing Device Access in Shongopovi
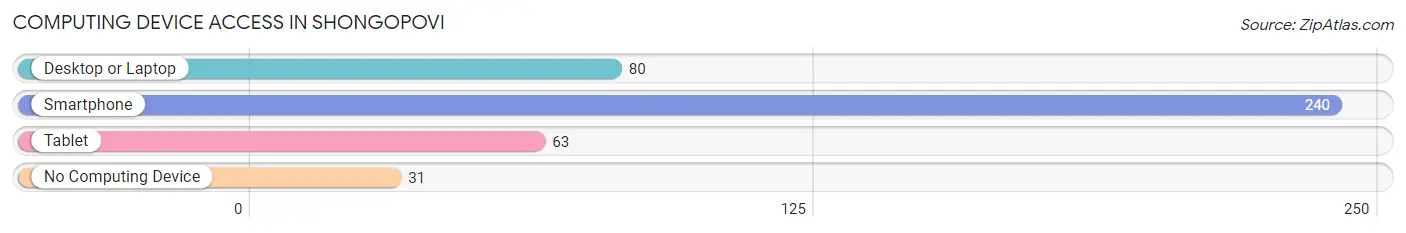
| Device Type | # Households | % Households |
| Desktop or Laptop | 80 | 27.8% |
| Smartphone | 240 | 83.3% |
| Tablet | 63 | 21.9% |
| No Computing Device | 31 | 10.8% |
| Total | 288 | 100.0% |
Internet Access in Shongopovi
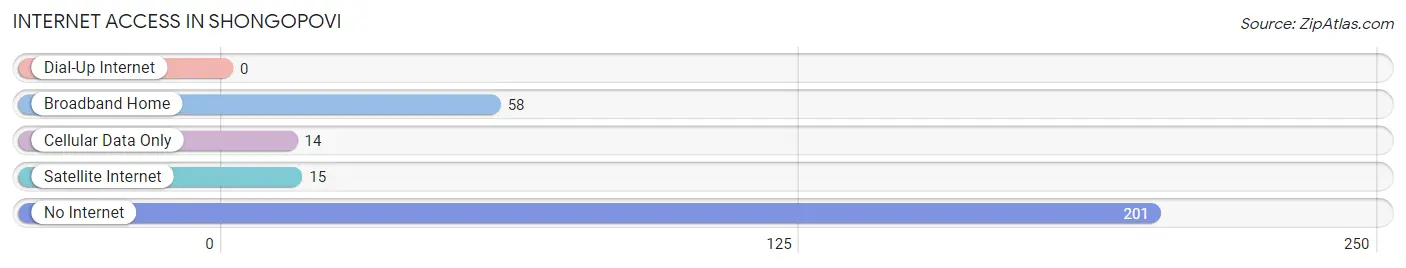
| Internet Type | # Households | % Households |
| Dial-Up Internet | 0 | 0.0% |
| Broadband Home | 58 | 20.1% |
| Cellular Data Only | 14 | 4.9% |
| Satellite Internet | 15 | 5.2% |
| No Internet | 201 | 69.8% |
| Total | 288 | 100.0% |
Shongopovi Summary
Shongopovi is a small community located in the northeastern part of Arizona, in the Navajo Nation. It is situated on the banks of the Little Colorado River, about 20 miles east of Flagstaff. The community is home to about 500 people, most of whom are members of the Hopi Tribe.
History
Shongopovi has a long and rich history. The Hopi people have lived in the area for centuries, and the community was established in the late 1800s. The Hopi people have a strong connection to the land, and the community has been a center of Hopi culture and tradition for generations.
The community was originally known as "Shungopavi," which means "place of the red willows" in the Hopi language. The name was changed to "Shongopovi" in the early 1900s.
Geography
Shongopovi is located in the northeastern part of Arizona, in the Navajo Nation. It is situated on the banks of the Little Colorado River, about 20 miles east of Flagstaff. The community is surrounded by the Coconino National Forest and is close to the Grand Canyon.
The climate in Shongopovi is arid and semi-arid, with hot summers and cold winters. The average annual temperature is around 60°F, and the average annual precipitation is around 10 inches.
Economy
The economy of Shongopovi is largely based on agriculture and tourism. The community is home to several farms, which produce a variety of crops, including corn, beans, squash, and melons. The community also has a small tourism industry, with visitors coming to experience the Hopi culture and to explore the nearby Grand Canyon.
Demographics
As of the 2010 census, the population of Shongopovi was 498. The population is primarily Native American, with the majority being members of the Hopi Tribe. The median age is 33.5, and the median household income is $25,000. The unemployment rate is around 10%.
Conclusion
Shongopovi is a small community located in the northeastern part of Arizona, in the Navajo Nation. It is home to about 500 people, most of whom are members of the Hopi Tribe. The community has a long and rich history, and the economy is largely based on agriculture and tourism. The population is primarily Native American, with the majority being members of the Hopi Tribe. The median age is 33.5, and the median household income is $25,000. The unemployment rate is around 10%.
Common Questions
What is Per Capita Income in Shongopovi?
Per Capita income in Shongopovi is $10,015.
What is the Median Family Income in Shongopovi?
Median Family Income in Shongopovi is $42,386.
What is the Median Household income in Shongopovi?
Median Household Income in Shongopovi is $27,353.
What is Inequality or Gini Index in Shongopovi?
Inequality or Gini Index in Shongopovi is 0.55.
What is the Total Population of Shongopovi?
Total Population of Shongopovi is 1,151.
What is the Total Male Population of Shongopovi?
Total Male Population of Shongopovi is 493.
What is the Total Female Population of Shongopovi?
Total Female Population of Shongopovi is 658.
What is the Ratio of Males per 100 Females in Shongopovi?
There are 74.92 Males per 100 Females in Shongopovi.
What is the Ratio of Females per 100 Males in Shongopovi?
There are 133.47 Females per 100 Males in Shongopovi.
What is the Median Population Age in Shongopovi?
Median Population Age in Shongopovi is 27.8 Years.
What is the Average Family Size in Shongopovi
Average Family Size in Shongopovi is 5.5 People.
What is the Average Household Size in Shongopovi
Average Household Size in Shongopovi is 4.0 People.
How Large is the Labor Force in Shongopovi?
There are 329 People in the Labor Forcein in Shongopovi.
What is the Percentage of People in the Labor Force in Shongopovi?
40.8% of People are in the Labor Force in Shongopovi.
What is the Unemployment Rate in Shongopovi?
Unemployment Rate in Shongopovi is 28.3%.