Mcnary, AZ Map & Demographics
Mcnary Map
Mcnary Overview
$14,455
PER CAPITA INCOME
$71,000
AVG FAMILY INCOME
$67,292
AVG HOUSEHOLD INCOME
12.3%
WAGE / INCOME GAP [ % ]
87.7¢/ $1
WAGE / INCOME GAP [ $ ]
0.33
INEQUALITY / GINI INDEX
980
TOTAL POPULATION
467
MALE POPULATION
513
FEMALE POPULATION
91.03
MALES / 100 FEMALES
109.85
FEMALES / 100 MALES
26.3
MEDIAN AGE
5.9
AVG FAMILY SIZE
5.6
AVG HOUSEHOLD SIZE
309
LABOR FORCE [ PEOPLE ]
45.3%
PERCENT IN LABOR FORCE
10.7%
UNEMPLOYMENT RATE
Mcnary Zip Codes
Mcnary Area Codes
Income in Mcnary
Income Overview in Mcnary
Per Capita Income in Mcnary is $14,455, while median incomes of families and households are $71,000 and $67,292 respectively.
| Characteristic | Number | Measure |
| Per Capita Income | 980 | $14,455 |
| Median Family Income | 150 | $71,000 |
| Mean Family Income | 150 | $68,820 |
| Median Household Income | 175 | $67,292 |
| Mean Household Income | 175 | $68,587 |
| Income Deficit | 150 | $0 |
| Wage / Income Gap (%) | 980 | 12.28% |
| Wage / Income Gap ($) | 980 | 87.72¢ per $1 |
| Gini / Inequality Index | 980 | 0.33 |
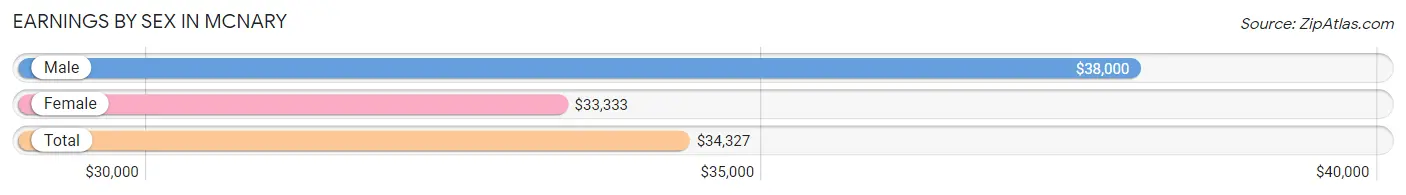
Earnings by Sex in Mcnary
Average Earnings in Mcnary are $34,327, $38,000 for men and $33,333 for women, a difference of 12.3%.
| Sex | Number | Average Earnings |
| Male | 172 (54.8%) | $38,000 |
| Female | 142 (45.2%) | $33,333 |
| Total | 314 (100.0%) | $34,327 |
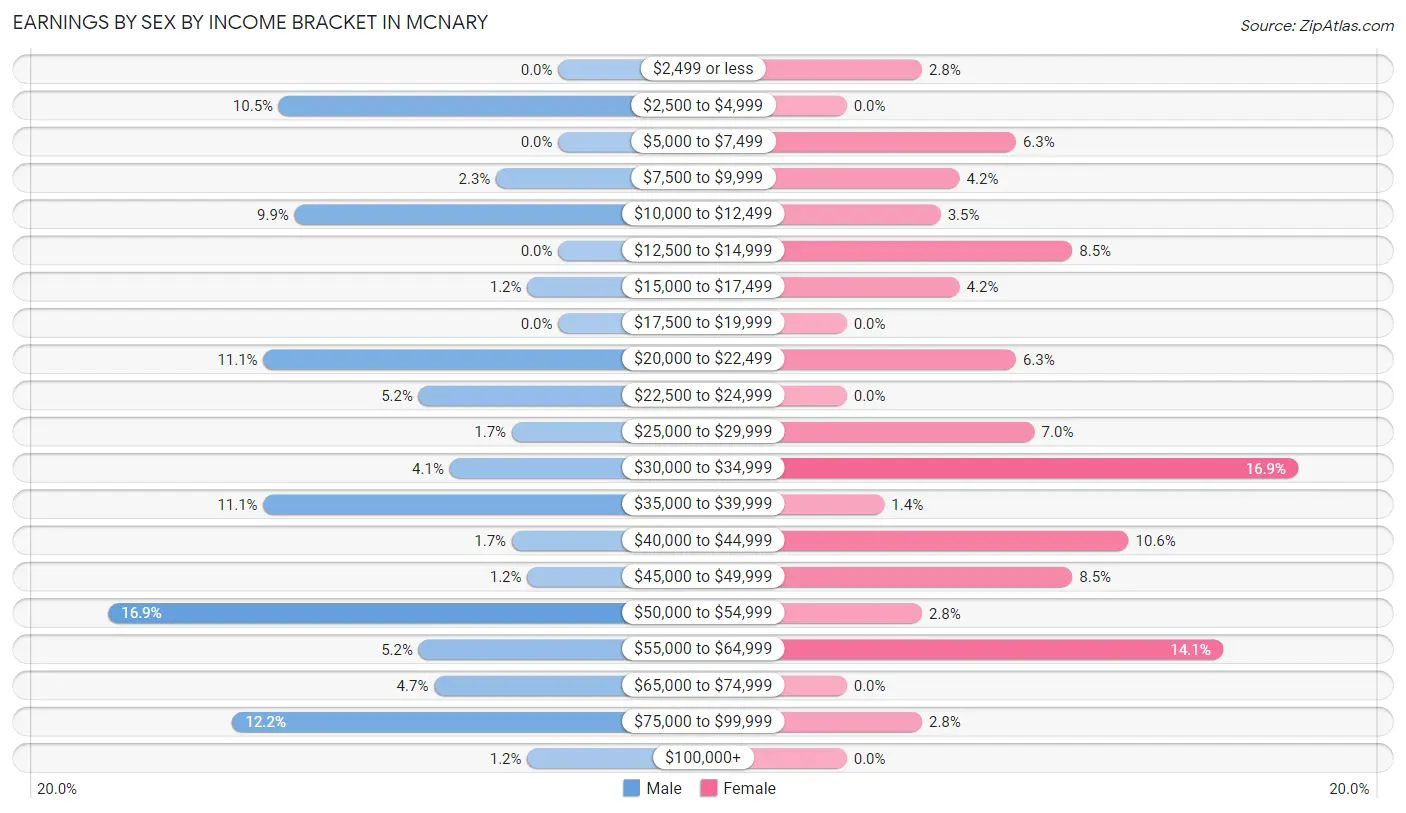
Earnings by Sex by Income Bracket in Mcnary
The most common earnings brackets in Mcnary are $50,000 to $54,999 for men (29 | 16.9%) and $30,000 to $34,999 for women (24 | 16.9%).
| Income | Male | Female |
| $2,499 or less | 0 (0.0%) | 4 (2.8%) |
| $2,500 to $4,999 | 18 (10.5%) | 0 (0.0%) |
| $5,000 to $7,499 | 0 (0.0%) | 9 (6.3%) |
| $7,500 to $9,999 | 4 (2.3%) | 6 (4.2%) |
| $10,000 to $12,499 | 17 (9.9%) | 5 (3.5%) |
| $12,500 to $14,999 | 0 (0.0%) | 12 (8.5%) |
| $15,000 to $17,499 | 2 (1.2%) | 6 (4.2%) |
| $17,500 to $19,999 | 0 (0.0%) | 0 (0.0%) |
| $20,000 to $22,499 | 19 (11.1%) | 9 (6.3%) |
| $22,500 to $24,999 | 9 (5.2%) | 0 (0.0%) |
| $25,000 to $29,999 | 3 (1.7%) | 10 (7.0%) |
| $30,000 to $34,999 | 7 (4.1%) | 24 (16.9%) |
| $35,000 to $39,999 | 19 (11.1%) | 2 (1.4%) |
| $40,000 to $44,999 | 3 (1.7%) | 15 (10.6%) |
| $45,000 to $49,999 | 2 (1.2%) | 12 (8.5%) |
| $50,000 to $54,999 | 29 (16.9%) | 4 (2.8%) |
| $55,000 to $64,999 | 9 (5.2%) | 20 (14.1%) |
| $65,000 to $74,999 | 8 (4.6%) | 0 (0.0%) |
| $75,000 to $99,999 | 21 (12.2%) | 4 (2.8%) |
| $100,000+ | 2 (1.2%) | 0 (0.0%) |
| Total | 172 (100.0%) | 142 (100.0%) |
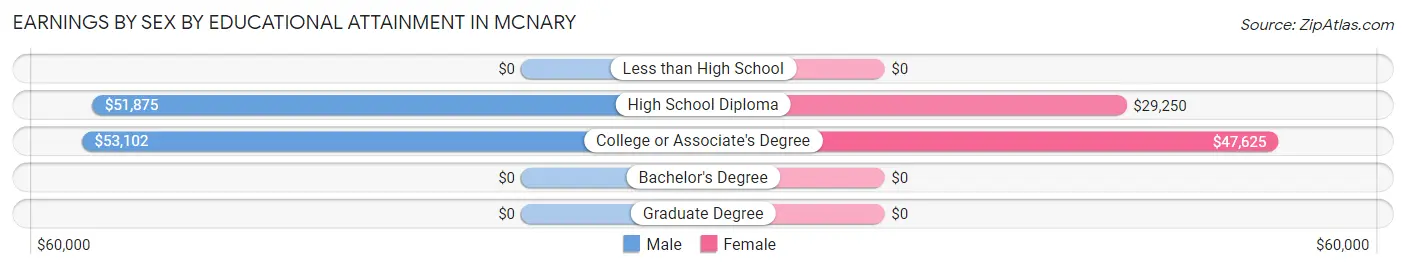
Earnings by Sex by Educational Attainment in Mcnary
Average earnings in Mcnary are $51,250 for men and $41,538 for women, a difference of 19.0%. Men with an educational attainment of college or associate's degree enjoy the highest average annual earnings of $53,102, while those with high school diploma education earn the least with $51,875. Women with an educational attainment of college or associate's degree earn the most with the average annual earnings of $47,625, while those with high school diploma education have the smallest earnings of $29,250.
| Educational Attainment | Male Income | Female Income |
| Less than High School | - | - |
| High School Diploma | $51,875 | $29,250 |
| College or Associate's Degree | $53,102 | $47,625 |
| Bachelor's Degree | - | - |
| Graduate Degree | - | - |
| Total | $51,250 | $41,538 |
Family Income in Mcnary
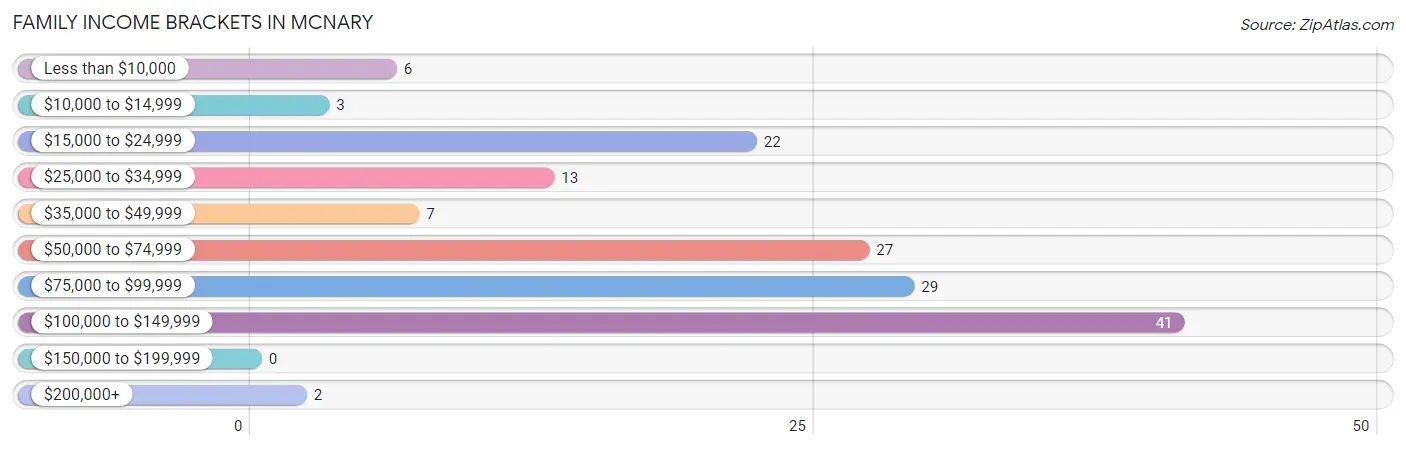
Family Income Brackets in Mcnary
According to the Mcnary family income data, there are 41 families falling into the $100,000 to $149,999 income range, which is the most common income bracket and makes up 27.3% of all families.
| Income Bracket | # Families | % Families |
| Less than $10,000 | 6 | 4.0% |
| $10,000 to $14,999 | 3 | 2.0% |
| $15,000 to $24,999 | 22 | 14.7% |
| $25,000 to $34,999 | 13 | 8.7% |
| $35,000 to $49,999 | 7 | 4.7% |
| $50,000 to $74,999 | 27 | 18.0% |
| $75,000 to $99,999 | 29 | 19.3% |
| $100,000 to $149,999 | 41 | 27.3% |
| $150,000 to $199,999 | 0 | 0.0% |
| $200,000+ | 2 | 1.3% |
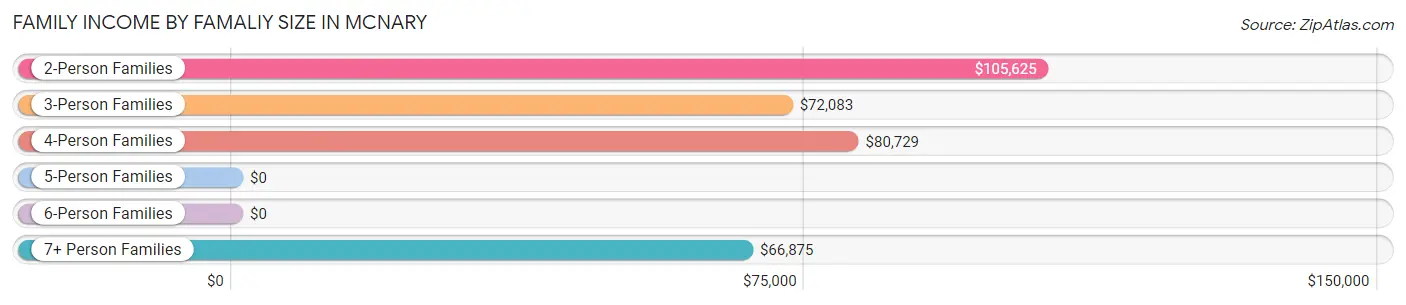
Family Income by Famaliy Size in Mcnary
2-person families (24 | 16.0%) account for the highest median family income in Mcnary with $105,625 per family, while 2-person families (24 | 16.0%) have the highest median income of $52,812 per family member.
| Income Bracket | # Families | Median Income |
| 2-Person Families | 24 (16.0%) | $105,625 |
| 3-Person Families | 35 (23.3%) | $72,083 |
| 4-Person Families | 25 (16.7%) | $80,729 |
| 5-Person Families | 33 (22.0%) | $0 |
| 6-Person Families | 6 (4.0%) | $0 |
| 7+ Person Families | 27 (18.0%) | $66,875 |
| Total | 150 (100.0%) | $71,000 |
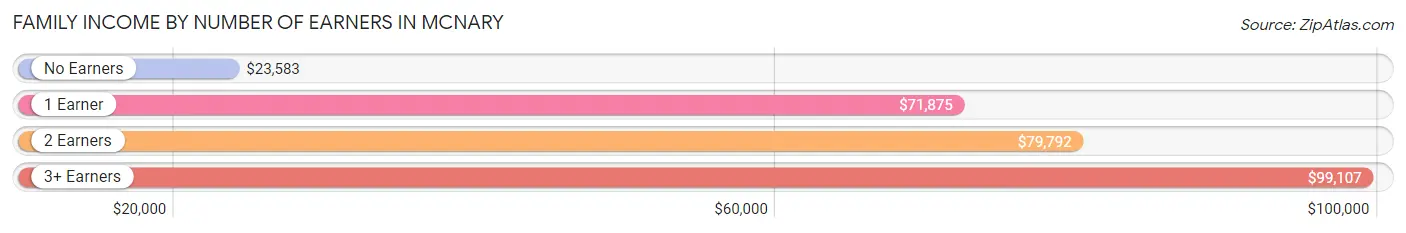
Family Income by Number of Earners in Mcnary
The median family income in Mcnary is $71,000, with families comprising 3+ earners (21) having the highest median family income of $99,107, while families with no earners (29) have the lowest median family income of $23,583, accounting for 14.0% and 19.3% of families, respectively.
| Number of Earners | # Families | Median Income |
| No Earners | 29 (19.3%) | $23,583 |
| 1 Earner | 63 (42.0%) | $71,875 |
| 2 Earners | 37 (24.7%) | $79,792 |
| 3+ Earners | 21 (14.0%) | $99,107 |
| Total | 150 (100.0%) | $71,000 |
Household Income in Mcnary
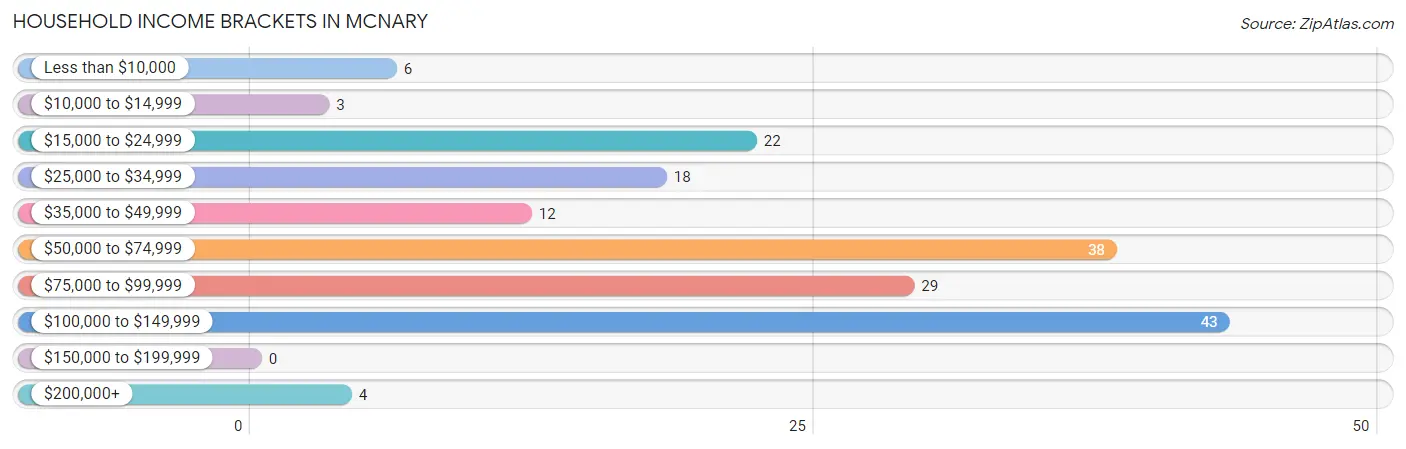
Household Income Brackets in Mcnary
With 43 households falling in the category, the $100,000 to $149,999 income range is the most frequent in Mcnary, accounting for 24.6% of all households.
| Income Bracket | # Households | % Households |
| Less than $10,000 | 6 | 3.4% |
| $10,000 to $14,999 | 3 | 1.7% |
| $15,000 to $24,999 | 22 | 12.6% |
| $25,000 to $34,999 | 18 | 10.3% |
| $35,000 to $49,999 | 12 | 6.9% |
| $50,000 to $74,999 | 38 | 21.7% |
| $75,000 to $99,999 | 29 | 16.6% |
| $100,000 to $149,999 | 43 | 24.6% |
| $150,000 to $199,999 | 0 | 0.0% |
| $200,000+ | 4 | 2.3% |
Household Income by Householder Age in Mcnary
The median household income in Mcnary is $67,292, with the highest median household income of $80,268 found in the 45 to 64 years age bracket for the primary householder. A total of 75 households (42.9%) fall into this category. Meanwhile, the 15 to 24 years age bracket for the primary householder has the lowest median household income of $0, with 3 households (1.7%) in this group.
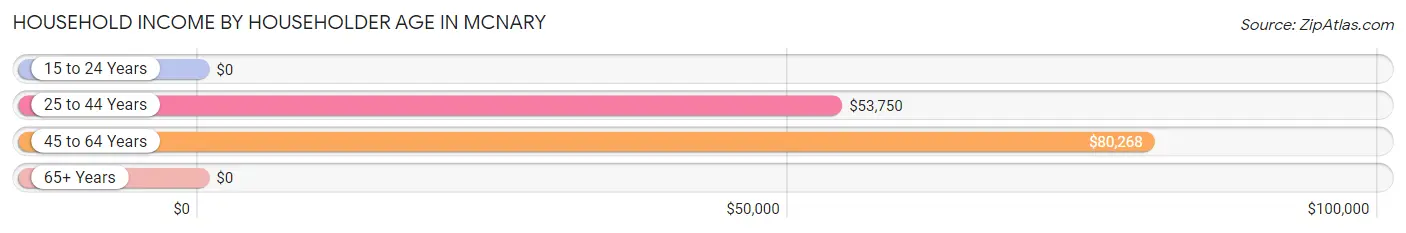
| Income Bracket | # Households | Median Income |
| 15 to 24 Years | 3 (1.7%) | $0 |
| 25 to 44 Years | 37 (21.1%) | $53,750 |
| 45 to 64 Years | 75 (42.9%) | $80,268 |
| 65+ Years | 60 (34.3%) | $0 |
| Total | 175 (100.0%) | $67,292 |
Poverty in Mcnary
Income Below Poverty by Sex and Age in Mcnary
With 30.3% poverty level for males and 34.9% for females among the residents of Mcnary, 15 year old males and 35 to 44 year old females are the most vulnerable to poverty, with 6 males (66.7%) and 50 females (70.4%) in their respective age groups living below the poverty level.
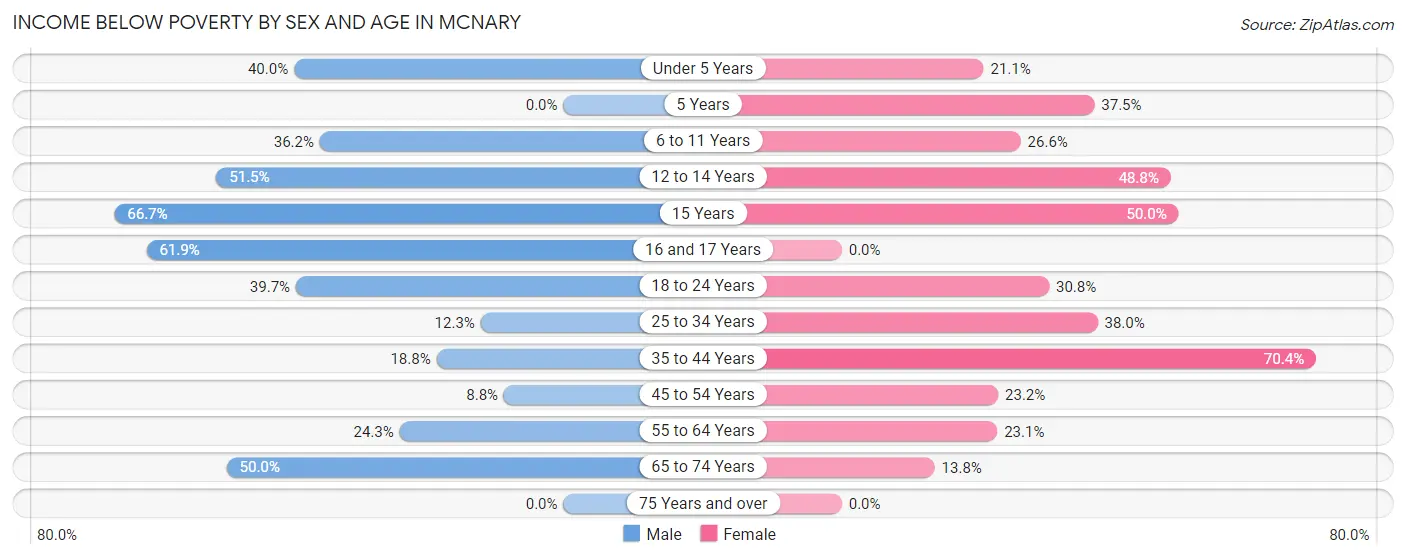
| Age Bracket | Male | Female |
| Under 5 Years | 10 (40.0%) | 4 (21.0%) |
| 5 Years | 0 (0.0%) | 6 (37.5%) |
| 6 to 11 Years | 17 (36.2%) | 17 (26.6%) |
| 12 to 14 Years | 17 (51.5%) | 21 (48.8%) |
| 15 Years | 6 (66.7%) | 6 (50.0%) |
| 16 and 17 Years | 13 (61.9%) | 0 (0.0%) |
| 18 to 24 Years | 27 (39.7%) | 24 (30.8%) |
| 25 to 34 Years | 7 (12.3%) | 30 (38.0%) |
| 35 to 44 Years | 13 (18.8%) | 50 (70.4%) |
| 45 to 54 Years | 3 (8.8%) | 13 (23.2%) |
| 55 to 64 Years | 9 (24.3%) | 3 (23.1%) |
| 65 to 74 Years | 16 (50.0%) | 4 (13.8%) |
| 75 Years and over | 0 (0.0%) | 0 (0.0%) |
| Total | 138 (30.3%) | 178 (34.9%) |
Income Above Poverty by Sex and Age in Mcnary
According to the poverty statistics in Mcnary, males aged 5 years and females aged 16 and 17 years are the age groups that are most secure financially, with 100.0% of males and 100.0% of females in these age groups living above the poverty line.
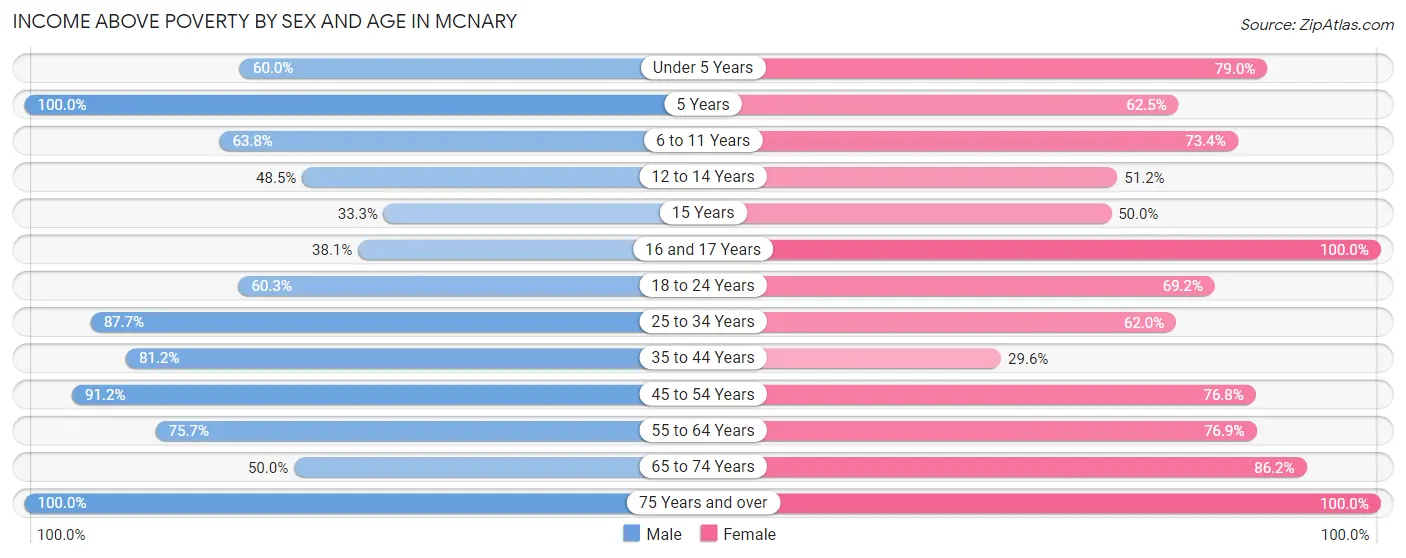
| Age Bracket | Male | Female |
| Under 5 Years | 15 (60.0%) | 15 (78.9%) |
| 5 Years | 15 (100.0%) | 10 (62.5%) |
| 6 to 11 Years | 30 (63.8%) | 47 (73.4%) |
| 12 to 14 Years | 16 (48.5%) | 22 (51.2%) |
| 15 Years | 3 (33.3%) | 6 (50.0%) |
| 16 and 17 Years | 8 (38.1%) | 14 (100.0%) |
| 18 to 24 Years | 41 (60.3%) | 54 (69.2%) |
| 25 to 34 Years | 50 (87.7%) | 49 (62.0%) |
| 35 to 44 Years | 56 (81.2%) | 21 (29.6%) |
| 45 to 54 Years | 31 (91.2%) | 43 (76.8%) |
| 55 to 64 Years | 28 (75.7%) | 10 (76.9%) |
| 65 to 74 Years | 16 (50.0%) | 25 (86.2%) |
| 75 Years and over | 8 (100.0%) | 16 (100.0%) |
| Total | 317 (69.7%) | 332 (65.1%) |
Income Below Poverty Among Married-Couple Families in Mcnary
The poverty statistics for married-couple families in Mcnary show that 10.3% or 7 of the total 68 families live below the poverty line. Families with 3 or 4 children have the highest poverty rate of 14.3%, comprising of 2 families. On the other hand, families with no children have the lowest poverty rate of 0.0%, which includes 0 families.
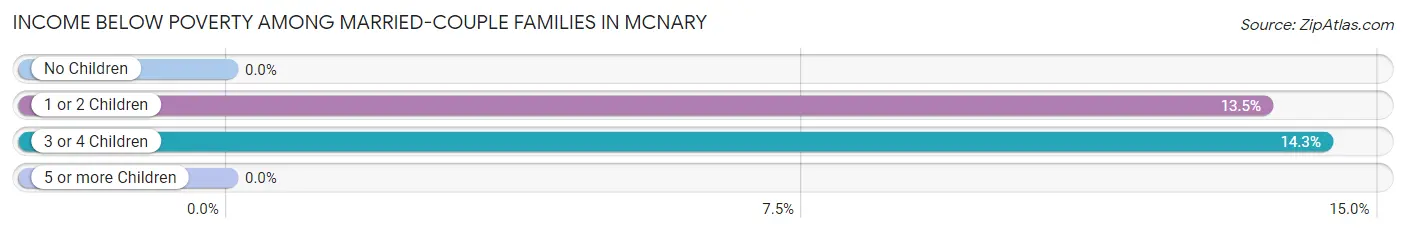
| Children | Above Poverty | Below Poverty |
| No Children | 17 (100.0%) | 0 (0.0%) |
| 1 or 2 Children | 32 (86.5%) | 5 (13.5%) |
| 3 or 4 Children | 12 (85.7%) | 2 (14.3%) |
| 5 or more Children | 0 (0.0%) | 0 (0.0%) |
| Total | 61 (89.7%) | 7 (10.3%) |
Income Below Poverty Among Single-Parent Households in Mcnary
According to the poverty data in Mcnary, 64.0% or 16 single-father households and 33.3% or 19 single-mother households are living below the poverty line. Among single-father households, those with 3 or 4 children have the highest poverty rate, with 2 households (100.0%) experiencing poverty. Likewise, among single-mother households, those with 3 or 4 children have the highest poverty rate, with 8 households (66.7%) falling below the poverty line.
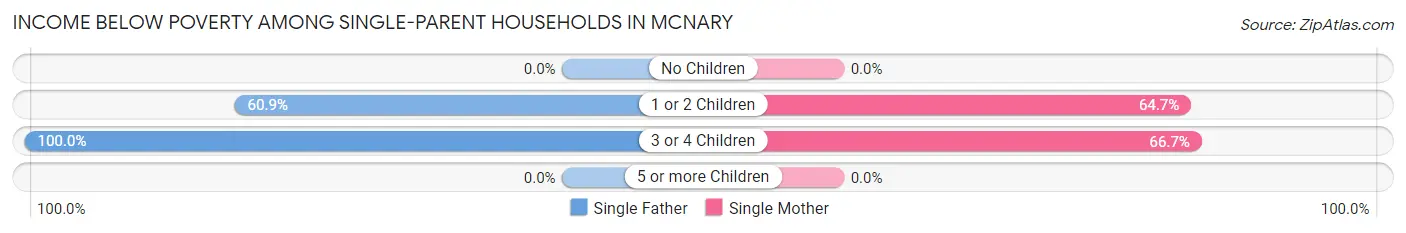
| Children | Single Father | Single Mother |
| No Children | 0 (0.0%) | 0 (0.0%) |
| 1 or 2 Children | 14 (60.9%) | 11 (64.7%) |
| 3 or 4 Children | 2 (100.0%) | 8 (66.7%) |
| 5 or more Children | 0 (0.0%) | 0 (0.0%) |
| Total | 16 (64.0%) | 19 (33.3%) |
Income Below Poverty Among Married-Couple vs Single-Parent Households in Mcnary
The poverty data for Mcnary shows that 7 of the married-couple family households (10.3%) and 35 of the single-parent households (42.7%) are living below the poverty level. Within the married-couple family households, those with 3 or 4 children have the highest poverty rate, with 2 households (14.3%) falling below the poverty line. Among the single-parent households, those with 3 or 4 children have the highest poverty rate, with 10 household (71.4%) living below poverty.
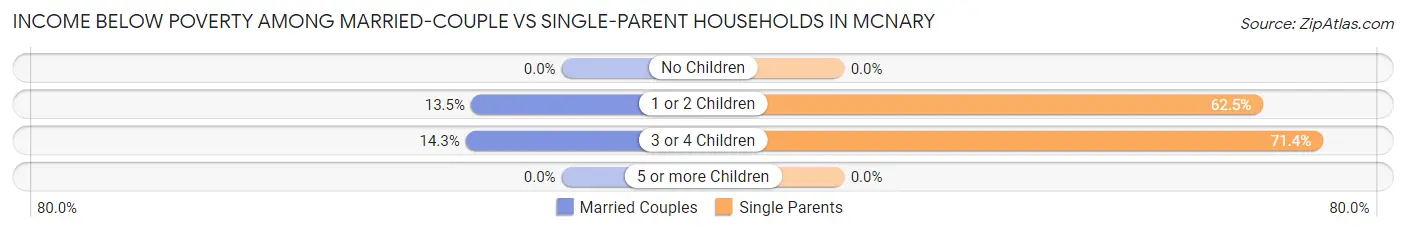
| Children | Married-Couple Families | Single-Parent Households |
| No Children | 0 (0.0%) | 0 (0.0%) |
| 1 or 2 Children | 5 (13.5%) | 25 (62.5%) |
| 3 or 4 Children | 2 (14.3%) | 10 (71.4%) |
| 5 or more Children | 0 (0.0%) | 0 (0.0%) |
| Total | 7 (10.3%) | 35 (42.7%) |
Race in Mcnary
The most populous races in Mcnary are Native / Alaskan (863 | 88.1%), Two or more Races (82 | 8.4%), and Hispanic or Latino (56 | 5.7%).
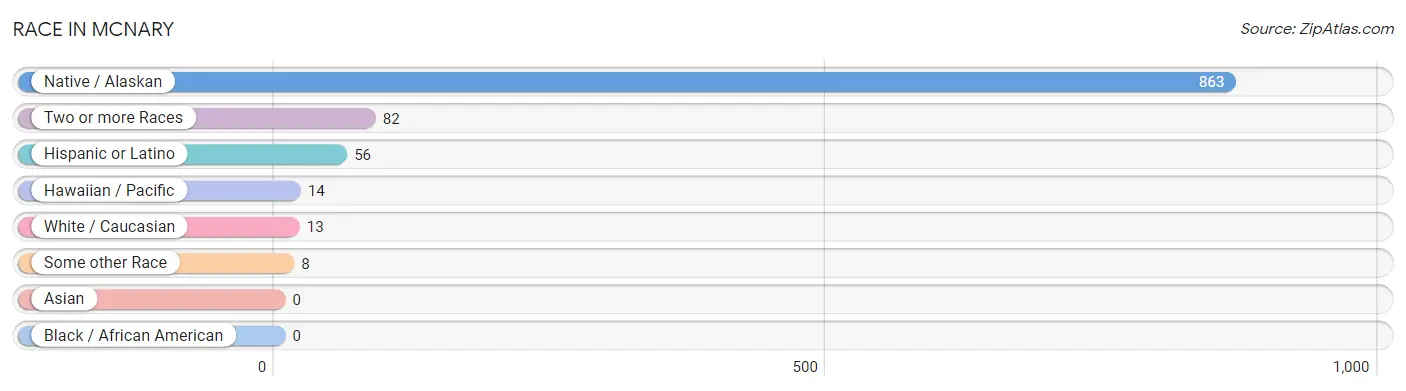
| Race | # Population | % Population |
| Asian | 0 | 0.0% |
| Black / African American | 0 | 0.0% |
| Hawaiian / Pacific | 14 | 1.4% |
| Hispanic or Latino | 56 | 5.7% |
| Native / Alaskan | 863 | 88.1% |
| White / Caucasian | 13 | 1.3% |
| Two or more Races | 82 | 8.4% |
| Some other Race | 8 | 0.8% |
| Total | 980 | 100.0% |
Ancestry in Mcnary
The most populous ancestries reported in Mcnary are Apache (800 | 81.6%), Navajo (128 | 13.1%), Mexican (31 | 3.2%), Tohono O'Odham (19 | 1.9%), and Puerto Rican (17 | 1.7%), together accounting for 101.5% of all Mcnary residents.
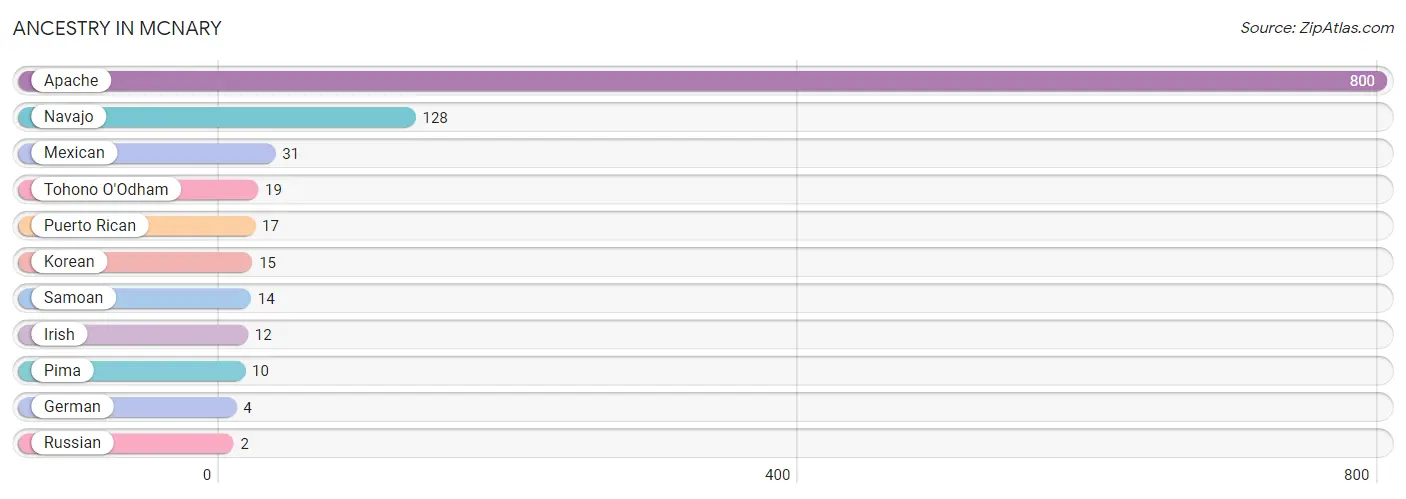
| Ancestry | # Population | % Population |
| Apache | 800 | 81.6% |
| German | 4 | 0.4% |
| Irish | 12 | 1.2% |
| Korean | 15 | 1.5% |
| Mexican | 31 | 3.2% |
| Navajo | 128 | 13.1% |
| Pima | 10 | 1.0% |
| Puerto Rican | 17 | 1.7% |
| Russian | 2 | 0.2% |
| Samoan | 14 | 1.4% |
| Tohono O'Odham | 19 | 1.9% | View All 11 Rows |
Immigrants in Mcnary
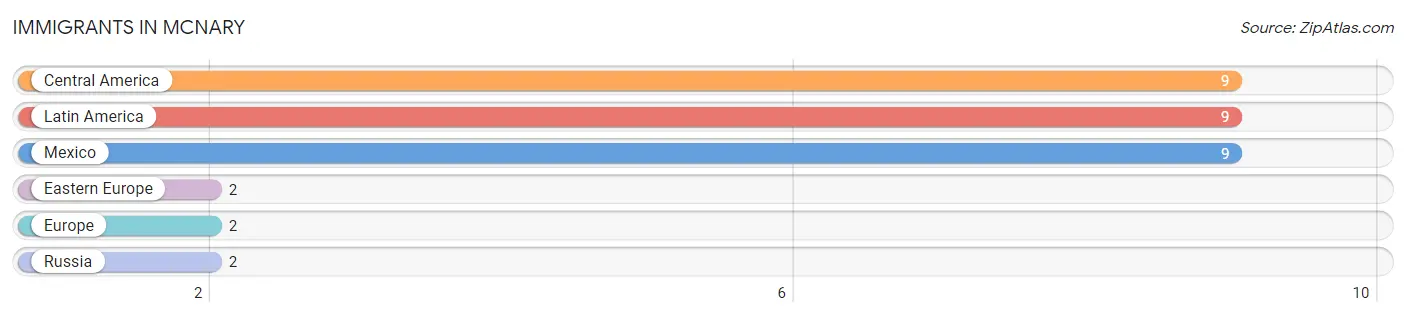
The most numerous immigrant groups reported in Mcnary came from Central America (9 | 0.9%), Latin America (9 | 0.9%), Mexico (9 | 0.9%), Eastern Europe (2 | 0.2%), and Europe (2 | 0.2%), together accounting for 3.2% of all Mcnary residents.
| Immigration Origin | # Population | % Population |
| Central America | 9 | 0.9% |
| Eastern Europe | 2 | 0.2% |
| Europe | 2 | 0.2% |
| Latin America | 9 | 0.9% |
| Mexico | 9 | 0.9% |
| Russia | 2 | 0.2% | View All 6 Rows |
Sex and Age in Mcnary
Sex and Age in Mcnary
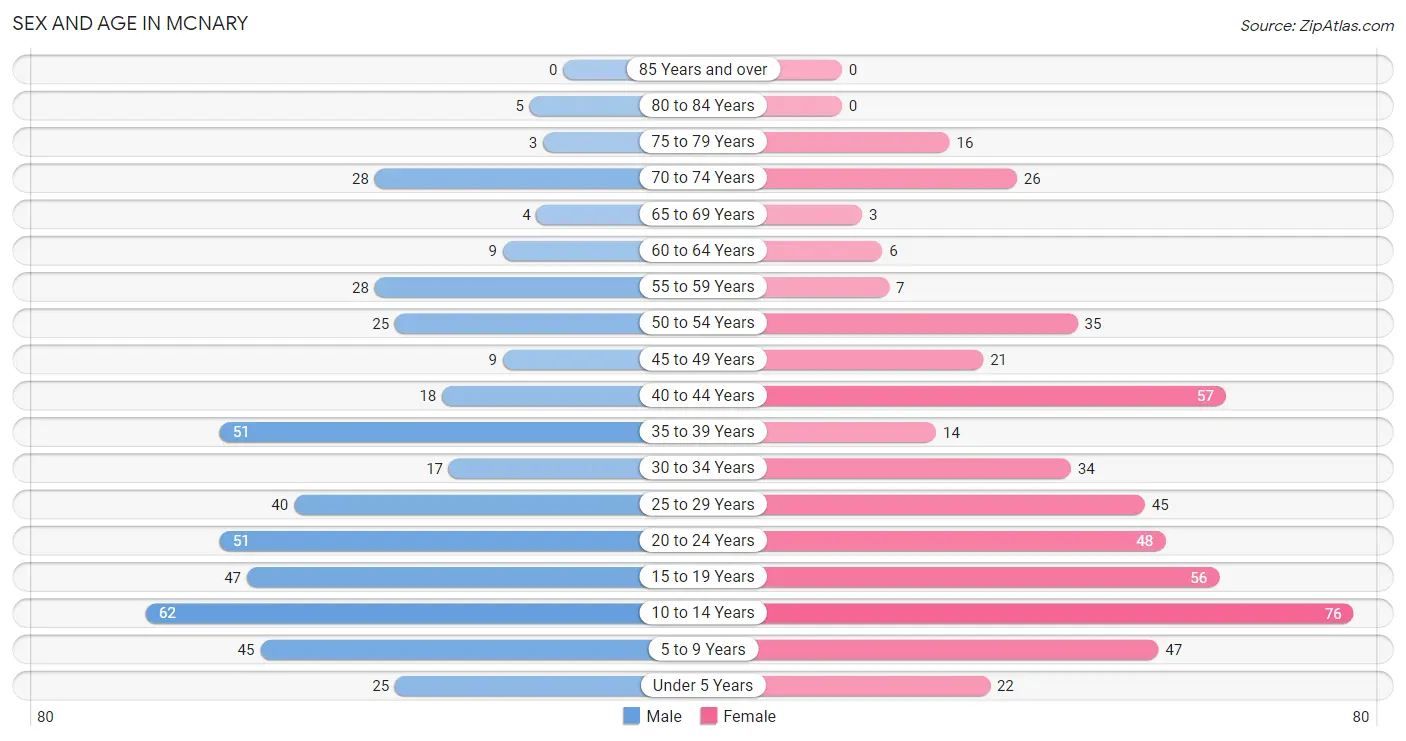
The most populous age groups in Mcnary are 10 to 14 Years (62 | 13.3%) for men and 10 to 14 Years (76 | 14.8%) for women.
| Age Bracket | Male | Female |
| Under 5 Years | 25 (5.3%) | 22 (4.3%) |
| 5 to 9 Years | 45 (9.6%) | 47 (9.2%) |
| 10 to 14 Years | 62 (13.3%) | 76 (14.8%) |
| 15 to 19 Years | 47 (10.1%) | 56 (10.9%) |
| 20 to 24 Years | 51 (10.9%) | 48 (9.4%) |
| 25 to 29 Years | 40 (8.6%) | 45 (8.8%) |
| 30 to 34 Years | 17 (3.6%) | 34 (6.6%) |
| 35 to 39 Years | 51 (10.9%) | 14 (2.7%) |
| 40 to 44 Years | 18 (3.8%) | 57 (11.1%) |
| 45 to 49 Years | 9 (1.9%) | 21 (4.1%) |
| 50 to 54 Years | 25 (5.3%) | 35 (6.8%) |
| 55 to 59 Years | 28 (6.0%) | 7 (1.4%) |
| 60 to 64 Years | 9 (1.9%) | 6 (1.2%) |
| 65 to 69 Years | 4 (0.9%) | 3 (0.6%) |
| 70 to 74 Years | 28 (6.0%) | 26 (5.1%) |
| 75 to 79 Years | 3 (0.6%) | 16 (3.1%) |
| 80 to 84 Years | 5 (1.1%) | 0 (0.0%) |
| 85 Years and over | 0 (0.0%) | 0 (0.0%) |
| Total | 467 (100.0%) | 513 (100.0%) |
Families and Households in Mcnary
Median Family Size in Mcnary
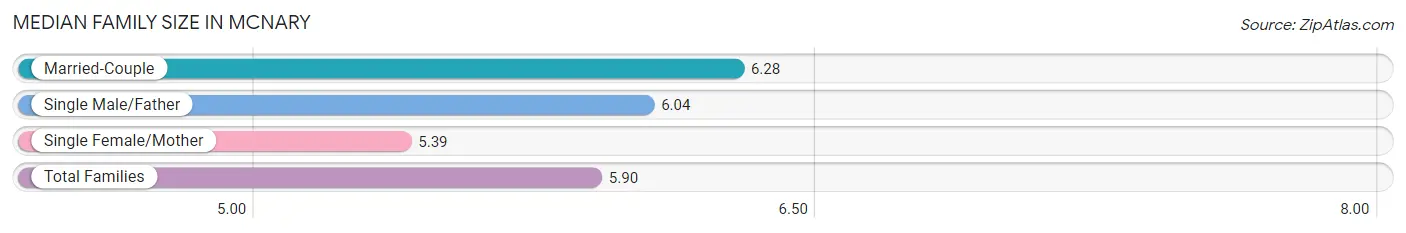
The median family size in Mcnary is 5.90 persons per family, with married-couple families (68 | 45.3%) accounting for the largest median family size of 6.28 persons per family. On the other hand, single female/mother families (57 | 38.0%) represent the smallest median family size with 5.39 persons per family.
| Family Type | # Families | Family Size |
| Married-Couple | 68 (45.3%) | 6.28 |
| Single Male/Father | 25 (16.7%) | 6.04 |
| Single Female/Mother | 57 (38.0%) | 5.39 |
| Total Families | 150 (100.0%) | 5.90 |
Median Household Size in Mcnary
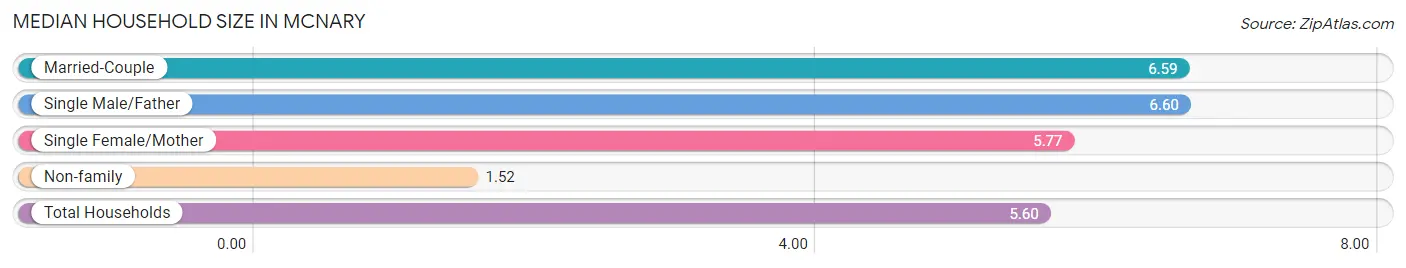
The median household size in Mcnary is 5.60 persons per household, with single male/father households (25 | 14.3%) accounting for the largest median household size of 6.6 persons per household. non-family households (25 | 14.3%) represent the smallest median household size with 1.52 persons per household.
| Household Type | # Households | Household Size |
| Married-Couple | 68 (38.9%) | 6.59 |
| Single Male/Father | 25 (14.3%) | 6.60 |
| Single Female/Mother | 57 (32.6%) | 5.77 |
| Non-family | 25 (14.3%) | 1.52 |
| Total Households | 175 (100.0%) | 5.60 |
Household Size by Marriage Status in Mcnary
Out of a total of 175 households in Mcnary, 150 (85.7%) are family households, while 25 (14.3%) are nonfamily households. The most numerous type of family households are 3-person households, comprising 33, and the most common type of nonfamily households are 1-person households, comprising 18.
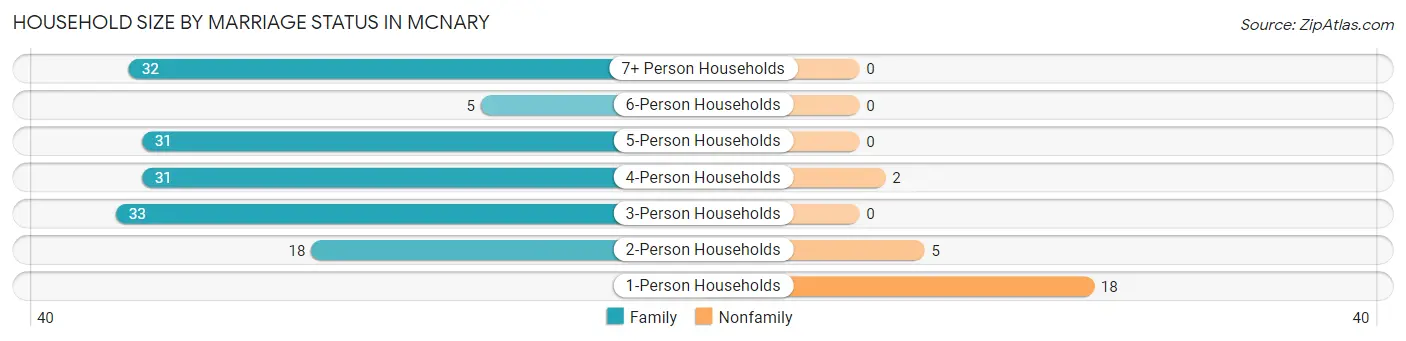
| Household Size | Family Households | Nonfamily Households |
| 1-Person Households | - | 18 (10.3%) |
| 2-Person Households | 18 (10.3%) | 5 (2.9%) |
| 3-Person Households | 33 (18.9%) | 0 (0.0%) |
| 4-Person Households | 31 (17.7%) | 2 (1.1%) |
| 5-Person Households | 31 (17.7%) | 0 (0.0%) |
| 6-Person Households | 5 (2.9%) | 0 (0.0%) |
| 7+ Person Households | 32 (18.3%) | 0 (0.0%) |
| Total | 150 (85.7%) | 25 (14.3%) |
Female Fertility in Mcnary
Fertility by Age in Mcnary
Average fertility rate in Mcnary is 25.0 births per 1,000 women. Women in the age bracket of 35 to 50 years have the highest fertility rate with 33.0 births per 1,000 women. Women in the age bracket of 20 to 34 years acount for 57.1% of all women with births.
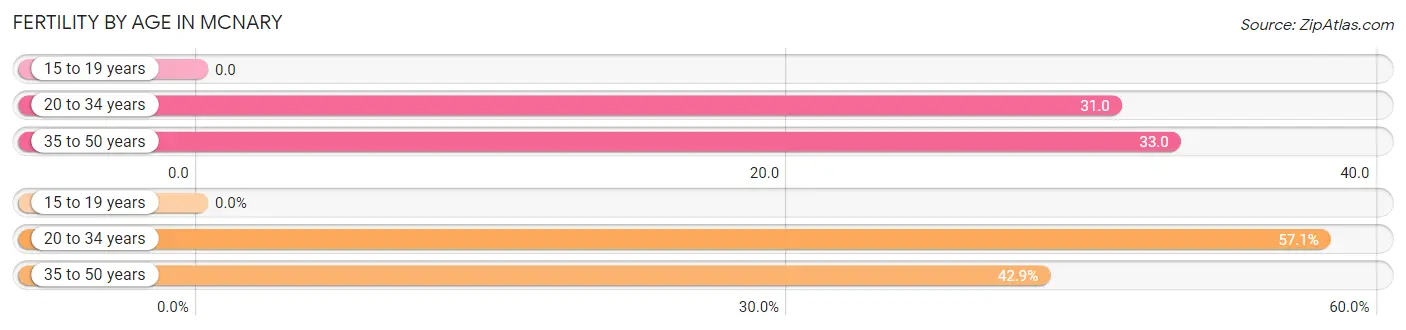
| Age Bracket | Women with Births | Births / 1,000 Women |
| 15 to 19 years | 0 (0.0%) | 0.0 |
| 20 to 34 years | 4 (57.1%) | 31.0 |
| 35 to 50 years | 3 (42.9%) | 33.0 |
| Total | 7 (100.0%) | 25.0 |
Fertility by Age by Marriage Status in Mcnary
85.7% of women with births (7) in Mcnary are married. The highest percentage of unmarried women with births falls into 35 to 50 years age bracket with 33.3% of them unmarried at the time of birth, while the lowest percentage of unmarried women with births belong to 20 to 34 years age bracket with 0.0% of them unmarried.
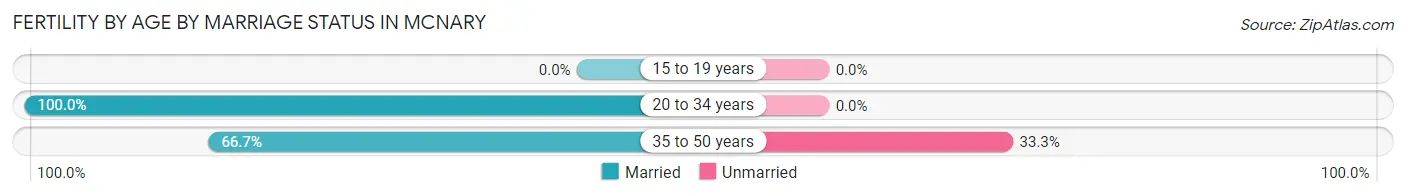
| Age Bracket | Married | Unmarried |
| 15 to 19 years | 0 (0.0%) | 0 (0.0%) |
| 20 to 34 years | 4 (100.0%) | 0 (0.0%) |
| 35 to 50 years | 2 (66.7%) | 1 (33.3%) |
| Total | 6 (85.7%) | 1 (14.3%) |
Fertility by Education in Mcnary
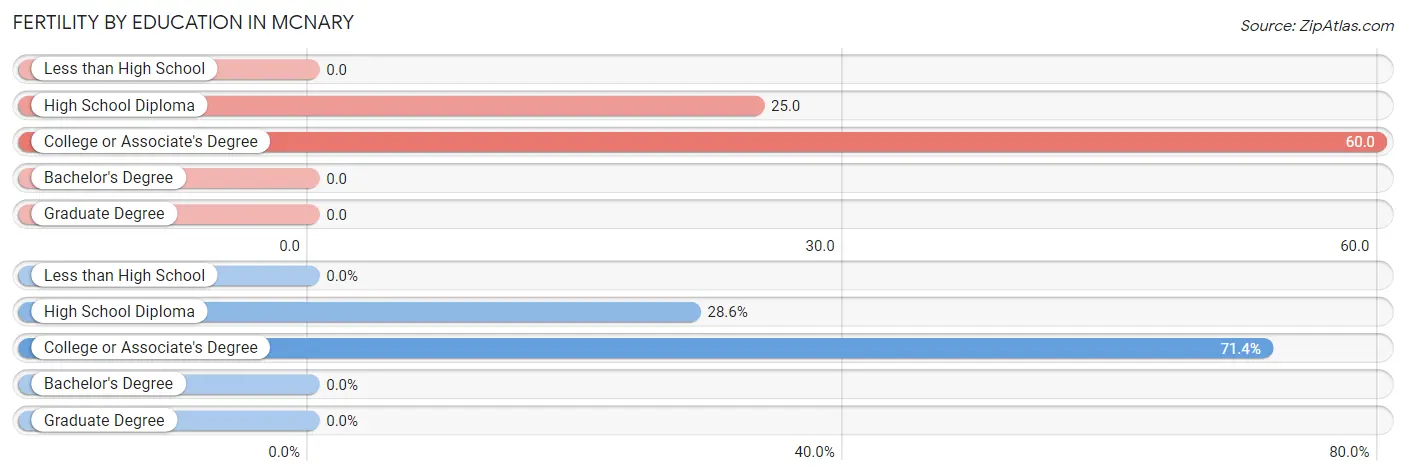
| Educational Attainment | Women with Births | Births / 1,000 Women |
| Less than High School | 0 (0.0%) | 0.0 |
| High School Diploma | 2 (28.6%) | 25.0 |
| College or Associate's Degree | 5 (71.4%) | 60.0 |
| Bachelor's Degree | 0 (0.0%) | 0.0 |
| Graduate Degree | 0 (0.0%) | 0.0 |
| Total | 7 (100.0%) | 25.0 |
Fertility by Education by Marriage Status in Mcnary
14.3% of women with births in Mcnary are unmarried. Women with the educational attainment of high school diploma are most likely to be married with 100.0% of them married at childbirth, while women with the educational attainment of college or associate's degree are least likely to be married with 20.0% of them unmarried at childbirth.
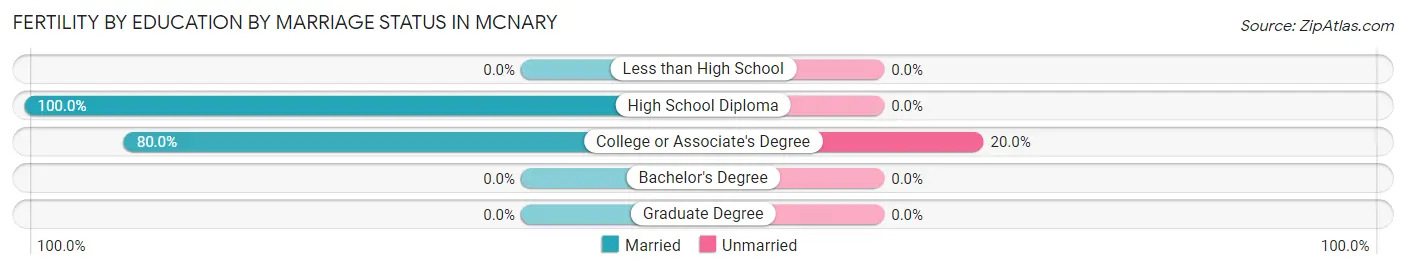
| Educational Attainment | Married | Unmarried |
| Less than High School | 0 (0.0%) | 0 (0.0%) |
| High School Diploma | 2 (100.0%) | 0 (0.0%) |
| College or Associate's Degree | 4 (80.0%) | 1 (20.0%) |
| Bachelor's Degree | 0 (0.0%) | 0 (0.0%) |
| Graduate Degree | 0 (0.0%) | 0 (0.0%) |
| Total | 6 (85.7%) | 1 (14.3%) |
Employment Characteristics in Mcnary
Employment by Class of Employer in Mcnary
Among the 274 employed individuals in Mcnary, private company employees (125 | 45.6%), local government employees (62 | 22.6%), and federal government employees (46 | 16.8%) make up the most common classes of employment.
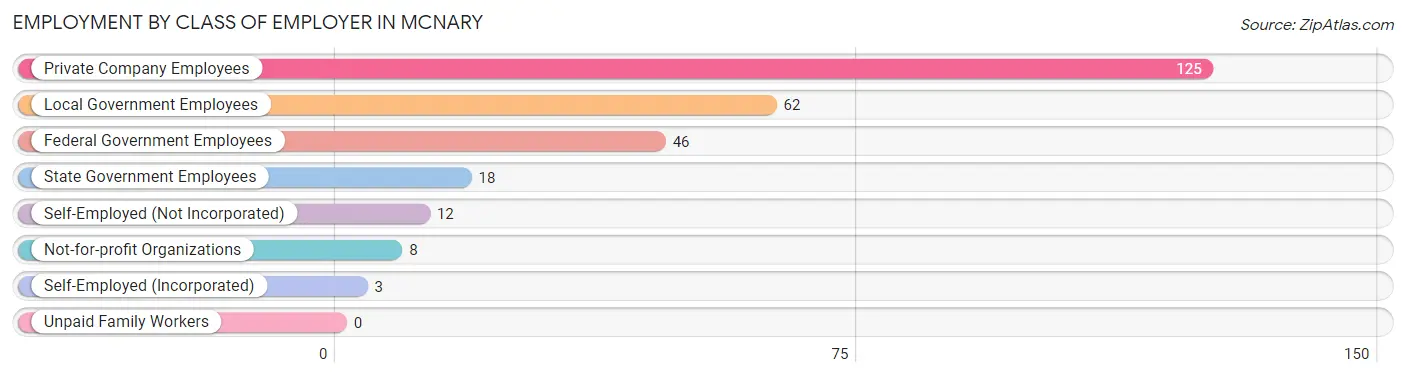
| Employer Class | # Employees | % Employees |
| Private Company Employees | 125 | 45.6% |
| Self-Employed (Incorporated) | 3 | 1.1% |
| Self-Employed (Not Incorporated) | 12 | 4.4% |
| Not-for-profit Organizations | 8 | 2.9% |
| Local Government Employees | 62 | 22.6% |
| State Government Employees | 18 | 6.6% |
| Federal Government Employees | 46 | 16.8% |
| Unpaid Family Workers | 0 | 0.0% |
| Total | 274 | 100.0% |
Employment Status by Age in Mcnary
According to the labor force statistics for Mcnary, out of the total population over 16 years of age (682), 45.3% or 309 individuals are in the labor force, with 10.7% or 33 of them unemployed. The age group with the highest labor force participation rate is 30 to 34 years, with 64.7% or 33 individuals in the labor force. Within the labor force, the 35 to 44 years age range has the highest percentage of unemployed individuals, with 19.2% or 14 of them being unemployed.
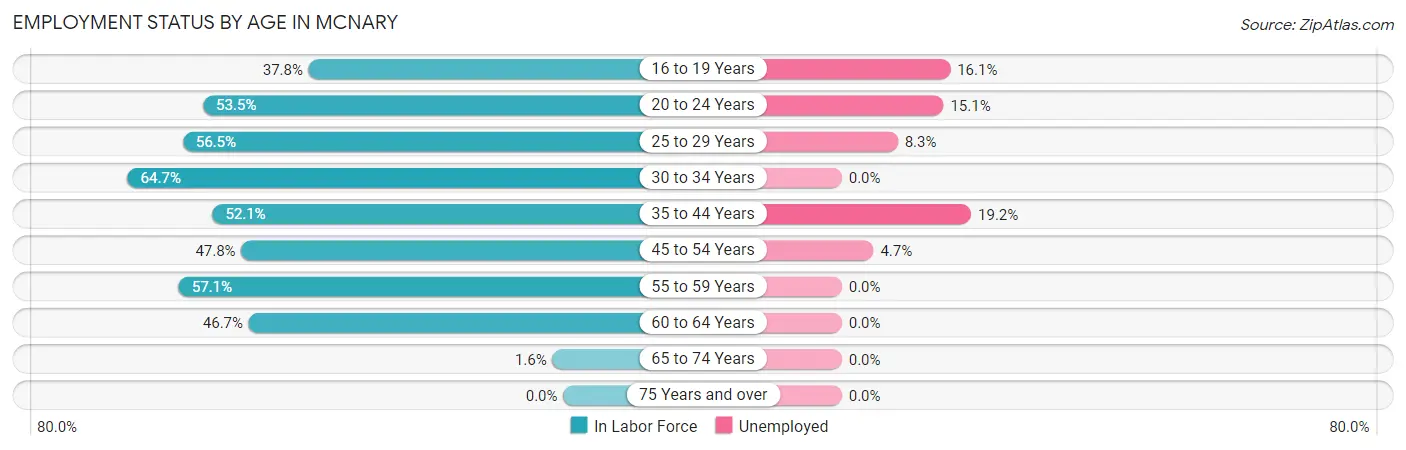
| Age Bracket | In Labor Force | Unemployed |
| 16 to 19 Years | 31 (37.8%) | 5 (16.1%) |
| 20 to 24 Years | 53 (53.5%) | 8 (15.1%) |
| 25 to 29 Years | 48 (56.5%) | 4 (8.3%) |
| 30 to 34 Years | 33 (64.7%) | 0 (0.0%) |
| 35 to 44 Years | 73 (52.1%) | 14 (19.2%) |
| 45 to 54 Years | 43 (47.8%) | 2 (4.7%) |
| 55 to 59 Years | 20 (57.1%) | 0 (0.0%) |
| 60 to 64 Years | 7 (46.7%) | 0 (0.0%) |
| 65 to 74 Years | 1 (1.6%) | 0 (0.0%) |
| 75 Years and over | 0 (0.0%) | 0 (0.0%) |
| Total | 309 (45.3%) | 33 (10.7%) |
Employment Status by Educational Attainment in Mcnary
According to labor force statistics for Mcnary, 53.8% of individuals (224) out of the total population between 25 and 64 years of age (416) are in the labor force, with 8.9% or 20 of them being unemployed. The group with the highest labor force participation rate are those with the educational attainment of bachelor's degree or higher, with 70.6% or 24 individuals in the labor force. Within the labor force, individuals with high school diploma education have the highest percentage of unemployment, with 14.1% or 9 of them being unemployed.
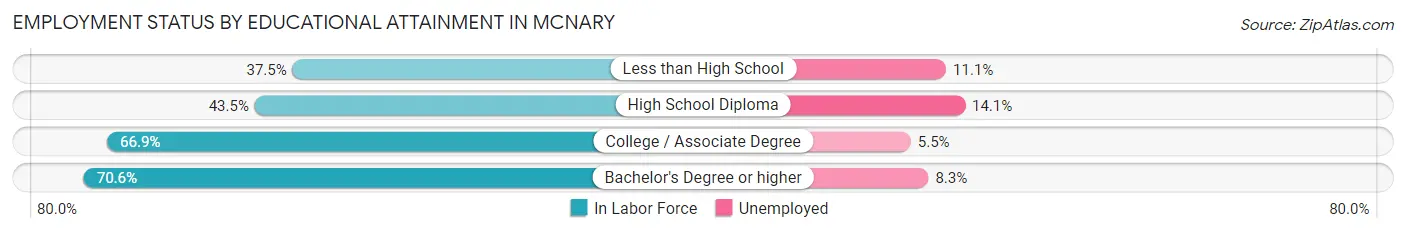
| Educational Attainment | In Labor Force | Unemployed |
| Less than High School | 27 (37.5%) | 8 (11.1%) |
| High School Diploma | 64 (43.5%) | 21 (14.1%) |
| College / Associate Degree | 109 (66.9%) | 9 (5.5%) |
| Bachelor's Degree or higher | 24 (70.6%) | 3 (8.3%) |
| Total | 224 (53.8%) | 37 (8.9%) |
Employment Occupations by Sex in Mcnary
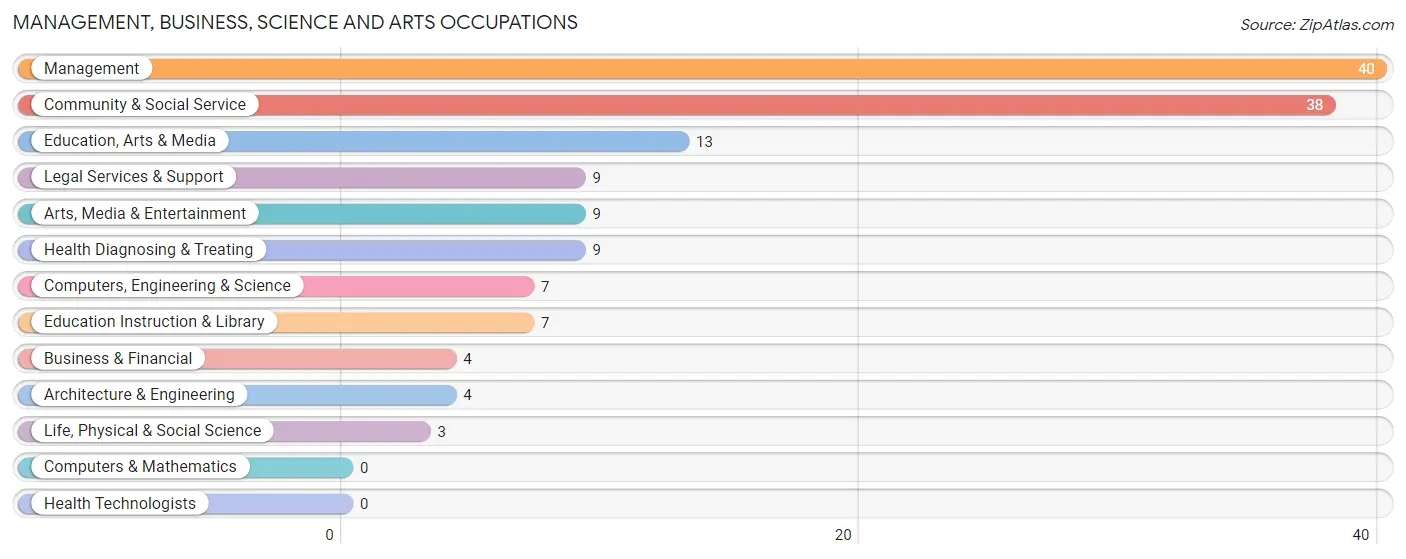
Management, Business, Science and Arts Occupations
The most common Management, Business, Science and Arts occupations in Mcnary are Management (40 | 14.5%), Community & Social Service (38 | 13.8%), Education, Arts & Media (13 | 4.7%), Legal Services & Support (9 | 3.3%), and Arts, Media & Entertainment (9 | 3.3%).
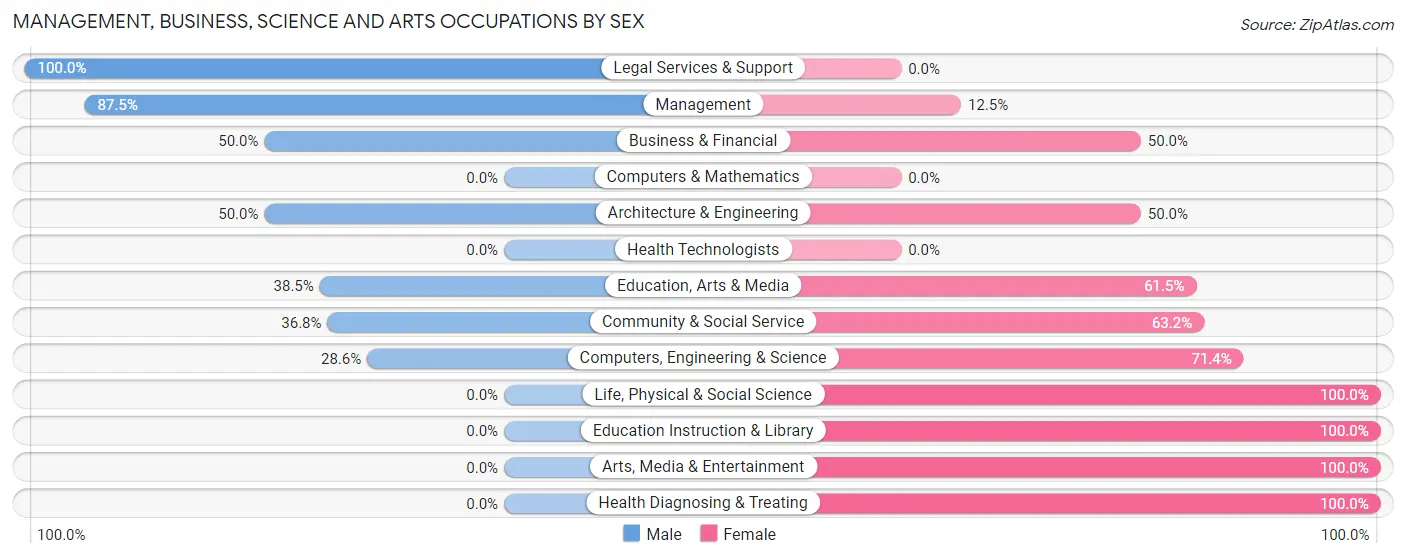
Management, Business, Science and Arts Occupations by Sex
Within the Management, Business, Science and Arts occupations in Mcnary, the most male-oriented occupations are Legal Services & Support (100.0%), Management (87.5%), and Business & Financial (50.0%), while the most female-oriented occupations are Life, Physical & Social Science (100.0%), Education Instruction & Library (100.0%), and Arts, Media & Entertainment (100.0%).
| Occupation | Male | Female |
| Management | 35 (87.5%) | 5 (12.5%) |
| Business & Financial | 2 (50.0%) | 2 (50.0%) |
| Computers, Engineering & Science | 2 (28.6%) | 5 (71.4%) |
| Computers & Mathematics | 0 (0.0%) | 0 (0.0%) |
| Architecture & Engineering | 2 (50.0%) | 2 (50.0%) |
| Life, Physical & Social Science | 0 (0.0%) | 3 (100.0%) |
| Community & Social Service | 14 (36.8%) | 24 (63.2%) |
| Education, Arts & Media | 5 (38.5%) | 8 (61.5%) |
| Legal Services & Support | 9 (100.0%) | 0 (0.0%) |
| Education Instruction & Library | 0 (0.0%) | 7 (100.0%) |
| Arts, Media & Entertainment | 0 (0.0%) | 9 (100.0%) |
| Health Diagnosing & Treating | 0 (0.0%) | 9 (100.0%) |
| Health Technologists | 0 (0.0%) | 0 (0.0%) |
| Total (Category) | 53 (54.1%) | 45 (45.9%) |
| Total (Overall) | 144 (52.2%) | 132 (47.8%) |
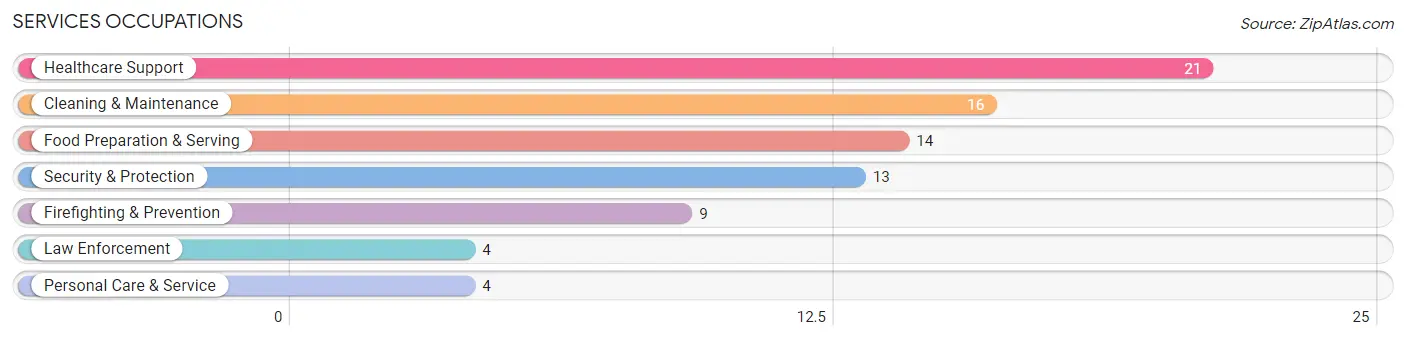
Services Occupations
The most common Services occupations in Mcnary are Healthcare Support (21 | 7.6%), Cleaning & Maintenance (16 | 5.8%), Food Preparation & Serving (14 | 5.1%), Security & Protection (13 | 4.7%), and Firefighting & Prevention (9 | 3.3%).
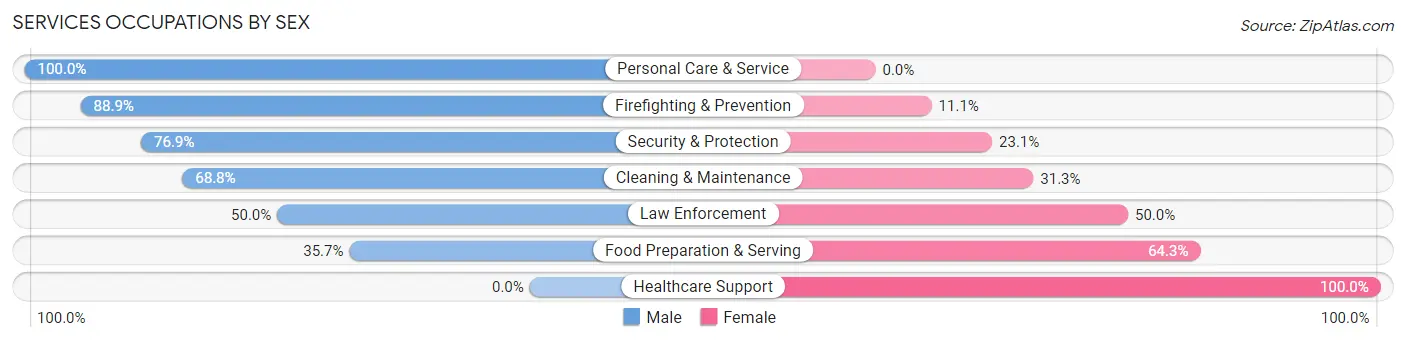
Services Occupations by Sex
Within the Services occupations in Mcnary, the most male-oriented occupations are Personal Care & Service (100.0%), Firefighting & Prevention (88.9%), and Security & Protection (76.9%), while the most female-oriented occupations are Healthcare Support (100.0%), Food Preparation & Serving (64.3%), and Law Enforcement (50.0%).
| Occupation | Male | Female |
| Healthcare Support | 0 (0.0%) | 21 (100.0%) |
| Security & Protection | 10 (76.9%) | 3 (23.1%) |
| Firefighting & Prevention | 8 (88.9%) | 1 (11.1%) |
| Law Enforcement | 2 (50.0%) | 2 (50.0%) |
| Food Preparation & Serving | 5 (35.7%) | 9 (64.3%) |
| Cleaning & Maintenance | 11 (68.8%) | 5 (31.2%) |
| Personal Care & Service | 4 (100.0%) | 0 (0.0%) |
| Total (Category) | 30 (44.1%) | 38 (55.9%) |
| Total (Overall) | 144 (52.2%) | 132 (47.8%) |
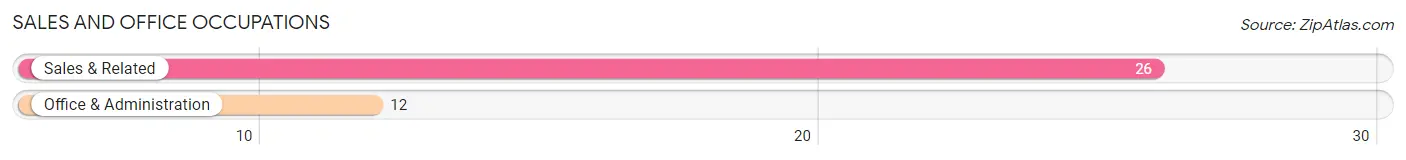
Sales and Office Occupations
The most common Sales and Office occupations in Mcnary are Sales & Related (26 | 9.4%), and Office & Administration (12 | 4.3%).
Sales and Office Occupations by Sex
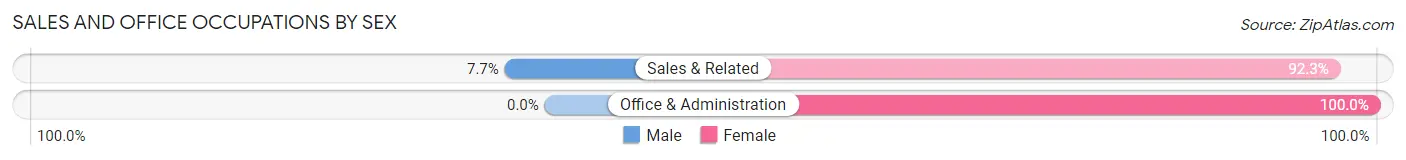
| Occupation | Male | Female |
| Sales & Related | 2 (7.7%) | 24 (92.3%) |
| Office & Administration | 0 (0.0%) | 12 (100.0%) |
| Total (Category) | 2 (5.3%) | 36 (94.7%) |
| Total (Overall) | 144 (52.2%) | 132 (47.8%) |
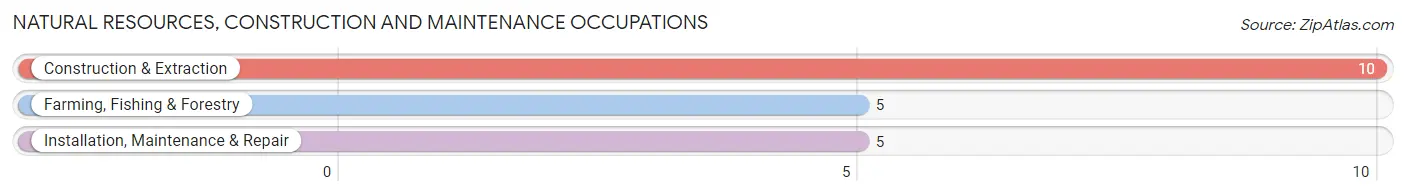
Natural Resources, Construction and Maintenance Occupations
The most common Natural Resources, Construction and Maintenance occupations in Mcnary are Construction & Extraction (10 | 3.6%), Farming, Fishing & Forestry (5 | 1.8%), and Installation, Maintenance & Repair (5 | 1.8%).
Natural Resources, Construction and Maintenance Occupations by Sex
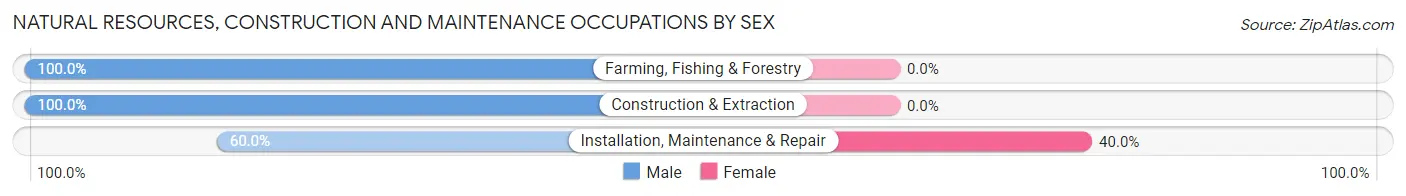
| Occupation | Male | Female |
| Farming, Fishing & Forestry | 5 (100.0%) | 0 (0.0%) |
| Construction & Extraction | 10 (100.0%) | 0 (0.0%) |
| Installation, Maintenance & Repair | 3 (60.0%) | 2 (40.0%) |
| Total (Category) | 18 (90.0%) | 2 (10.0%) |
| Total (Overall) | 144 (52.2%) | 132 (47.8%) |
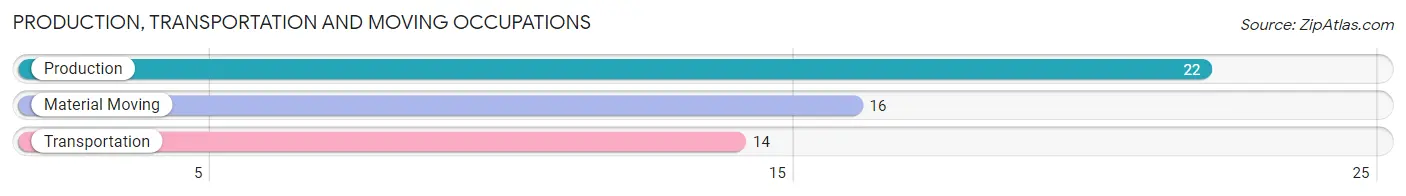
Production, Transportation and Moving Occupations
The most common Production, Transportation and Moving occupations in Mcnary are Production (22 | 8.0%), Material Moving (16 | 5.8%), and Transportation (14 | 5.1%).
Production, Transportation and Moving Occupations by Sex
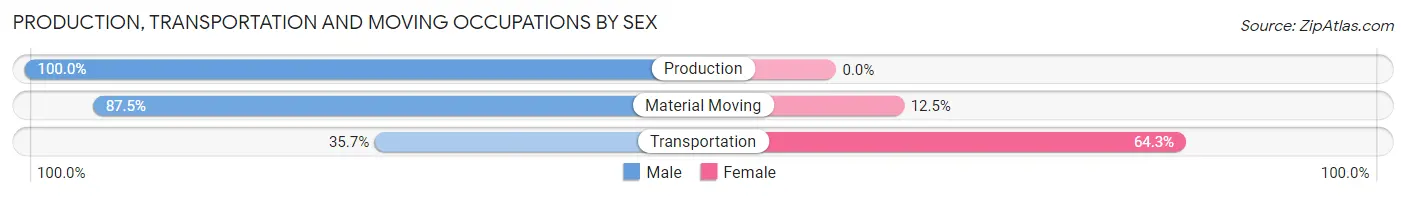
| Occupation | Male | Female |
| Production | 22 (100.0%) | 0 (0.0%) |
| Transportation | 5 (35.7%) | 9 (64.3%) |
| Material Moving | 14 (87.5%) | 2 (12.5%) |
| Total (Category) | 41 (78.8%) | 11 (21.1%) |
| Total (Overall) | 144 (52.2%) | 132 (47.8%) |
Employment Industries by Sex in Mcnary
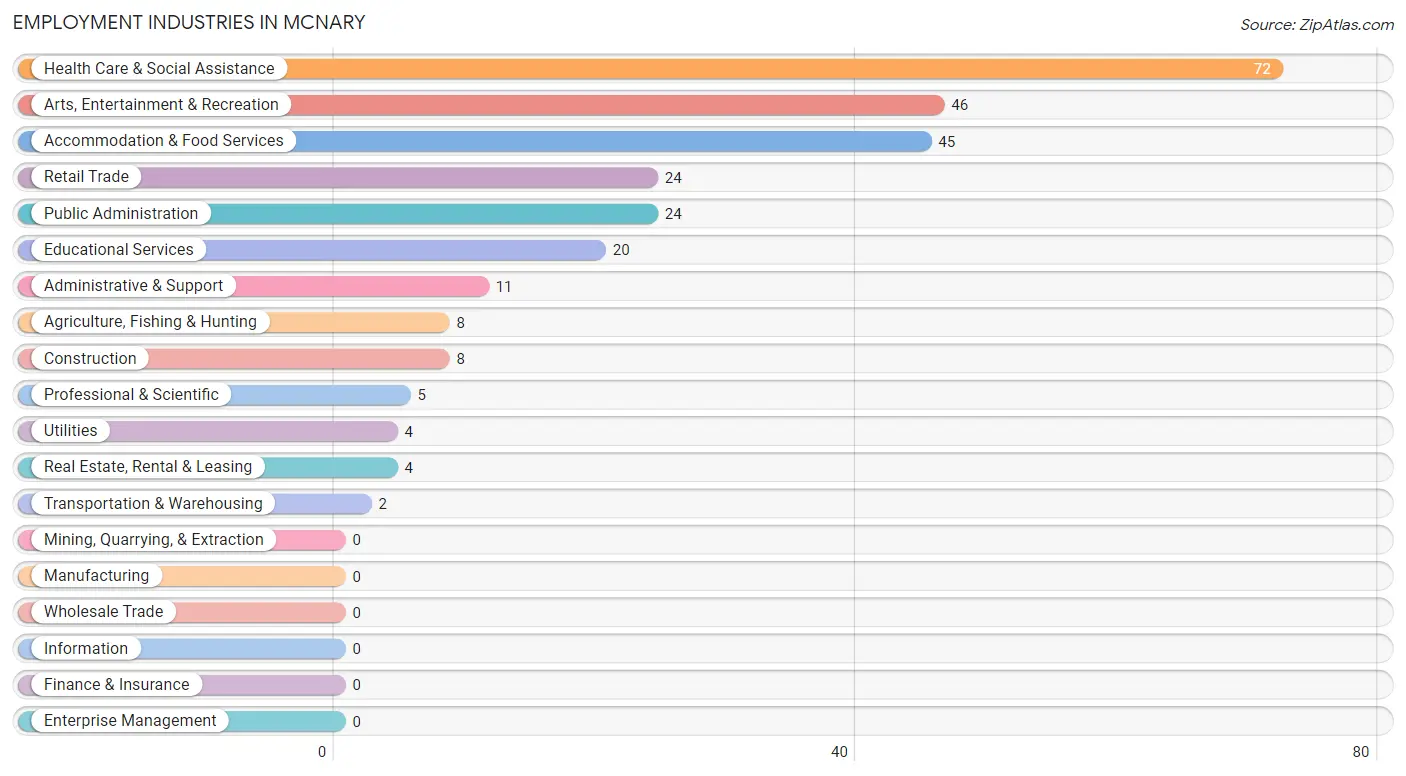
Employment Industries in Mcnary
The major employment industries in Mcnary include Health Care & Social Assistance (72 | 26.1%), Arts, Entertainment & Recreation (46 | 16.7%), Accommodation & Food Services (45 | 16.3%), Retail Trade (24 | 8.7%), and Public Administration (24 | 8.7%).
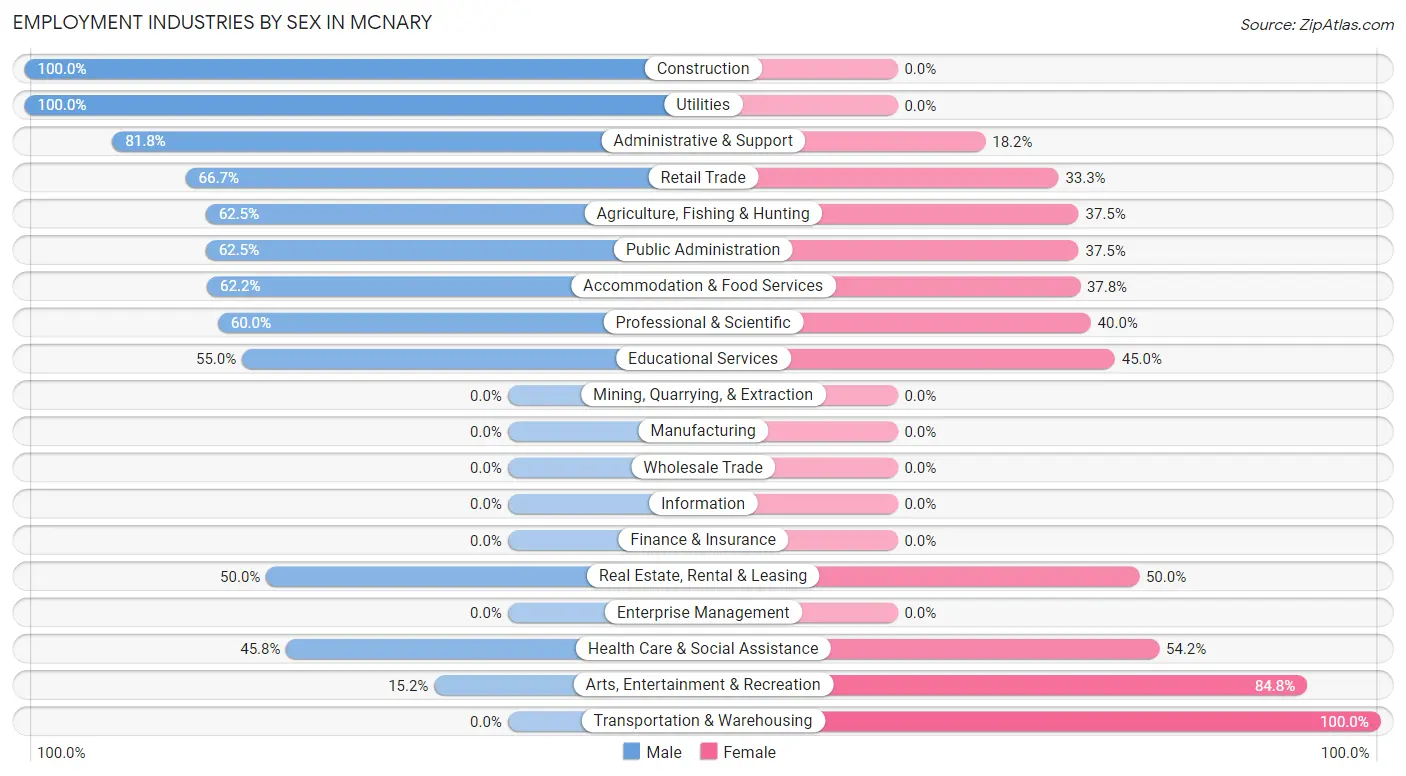
Employment Industries by Sex in Mcnary
The Mcnary industries that see more men than women are Construction (100.0%), Utilities (100.0%), and Administrative & Support (81.8%), whereas the industries that tend to have a higher number of women are Transportation & Warehousing (100.0%), Arts, Entertainment & Recreation (84.8%), and Health Care & Social Assistance (54.2%).
| Industry | Male | Female |
| Agriculture, Fishing & Hunting | 5 (62.5%) | 3 (37.5%) |
| Mining, Quarrying, & Extraction | 0 (0.0%) | 0 (0.0%) |
| Construction | 8 (100.0%) | 0 (0.0%) |
| Manufacturing | 0 (0.0%) | 0 (0.0%) |
| Wholesale Trade | 0 (0.0%) | 0 (0.0%) |
| Retail Trade | 16 (66.7%) | 8 (33.3%) |
| Transportation & Warehousing | 0 (0.0%) | 2 (100.0%) |
| Utilities | 4 (100.0%) | 0 (0.0%) |
| Information | 0 (0.0%) | 0 (0.0%) |
| Finance & Insurance | 0 (0.0%) | 0 (0.0%) |
| Real Estate, Rental & Leasing | 2 (50.0%) | 2 (50.0%) |
| Professional & Scientific | 3 (60.0%) | 2 (40.0%) |
| Enterprise Management | 0 (0.0%) | 0 (0.0%) |
| Administrative & Support | 9 (81.8%) | 2 (18.2%) |
| Educational Services | 11 (55.0%) | 9 (45.0%) |
| Health Care & Social Assistance | 33 (45.8%) | 39 (54.2%) |
| Arts, Entertainment & Recreation | 7 (15.2%) | 39 (84.8%) |
| Accommodation & Food Services | 28 (62.2%) | 17 (37.8%) |
| Public Administration | 15 (62.5%) | 9 (37.5%) |
| Total | 144 (52.2%) | 132 (47.8%) |
Education in Mcnary
School Enrollment in Mcnary
The most common levels of schooling among the 353 students in Mcnary are middle school (98 | 27.8%), high school (86 | 24.4%), and elementary school (73 | 20.7%).
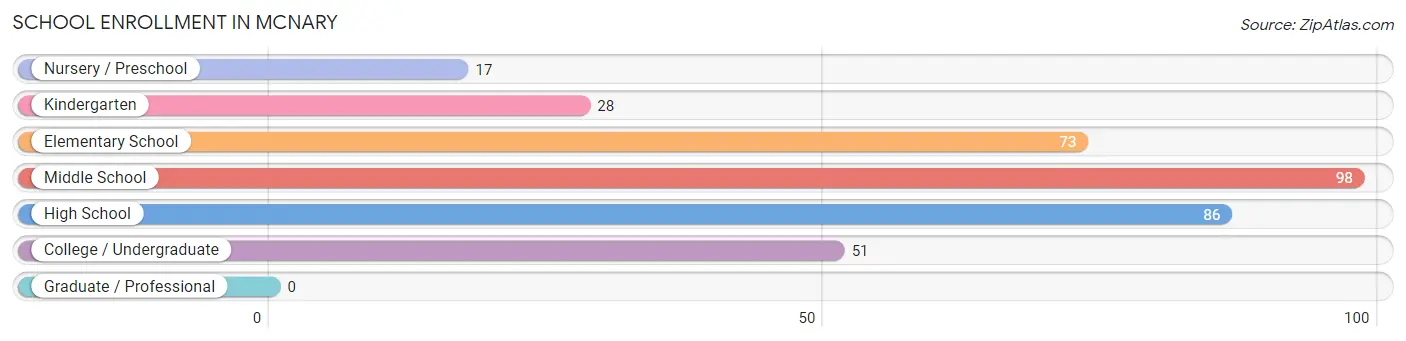
| School Level | # Students | % Students |
| Nursery / Preschool | 17 | 4.8% |
| Kindergarten | 28 | 7.9% |
| Elementary School | 73 | 20.7% |
| Middle School | 98 | 27.8% |
| High School | 86 | 24.4% |
| College / Undergraduate | 51 | 14.4% |
| Graduate / Professional | 0 | 0.0% |
| Total | 353 | 100.0% |
School Enrollment by Age by Funding Source in Mcnary
Out of a total of 353 students who are enrolled in schools in Mcnary, 17 (4.8%) attend a private institution, while the remaining 336 (95.2%) are enrolled in public schools. The age group of 10 to 14 year olds has the highest likelihood of being enrolled in private schools, with 17 (12.6% in the age bracket) enrolled. Conversely, the age group of 3 to 4 year olds has the lowest likelihood of being enrolled in a private school, with 10 (100.0% in the age bracket) attending a public institution.
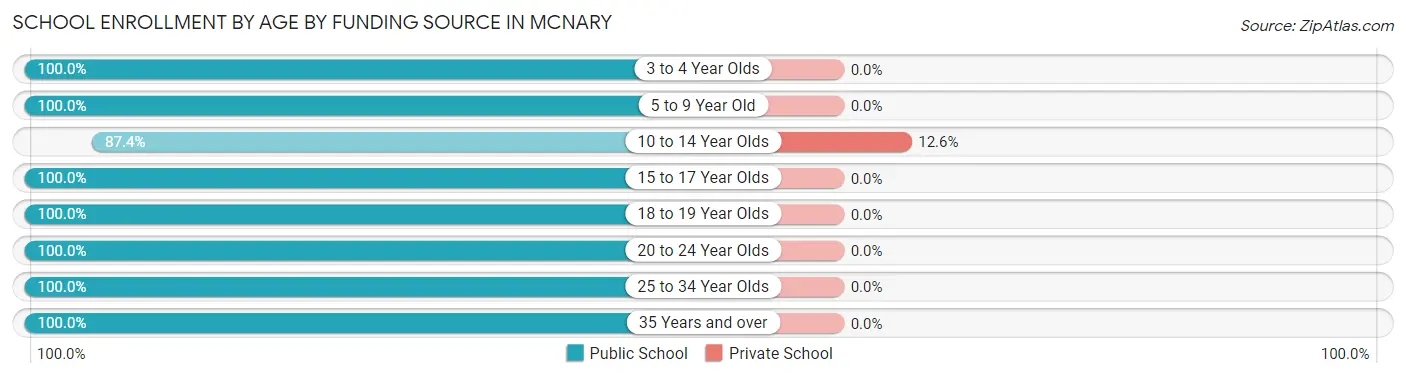
| Age Bracket | Public School | Private School |
| 3 to 4 Year Olds | 10 (100.0%) | 0 (0.0%) |
| 5 to 9 Year Old | 89 (100.0%) | 0 (0.0%) |
| 10 to 14 Year Olds | 118 (87.4%) | 17 (12.6%) |
| 15 to 17 Year Olds | 48 (100.0%) | 0 (0.0%) |
| 18 to 19 Year Olds | 15 (100.0%) | 0 (0.0%) |
| 20 to 24 Year Olds | 24 (100.0%) | 0 (0.0%) |
| 25 to 34 Year Olds | 27 (100.0%) | 0 (0.0%) |
| 35 Years and over | 5 (100.0%) | 0 (0.0%) |
| Total | 336 (95.2%) | 17 (4.8%) |
Educational Attainment by Field of Study in Mcnary
Liberal arts & history (14 | 35.9%), social sciences (9 | 23.1%), business (8 | 20.5%), engineering (4 | 10.3%), and education (2 | 5.1%) are the most common fields of study among 39 individuals in Mcnary who have obtained a bachelor's degree or higher.
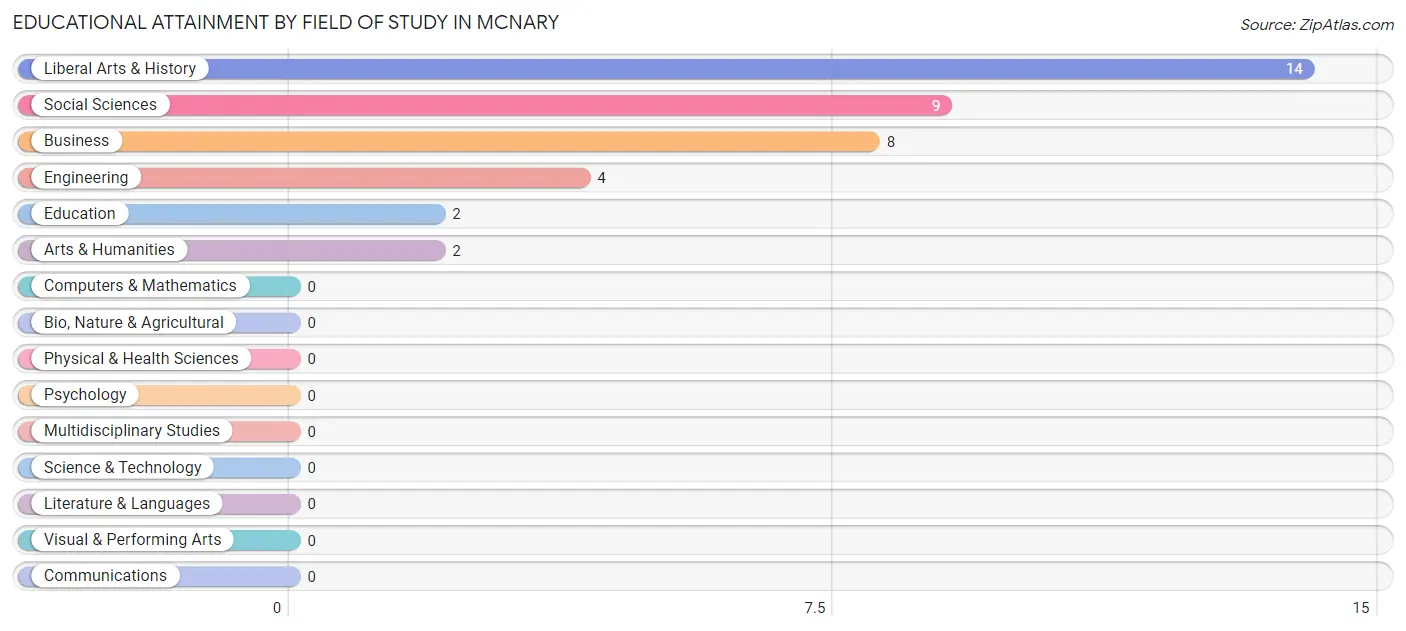
| Field of Study | # Graduates | % Graduates |
| Computers & Mathematics | 0 | 0.0% |
| Bio, Nature & Agricultural | 0 | 0.0% |
| Physical & Health Sciences | 0 | 0.0% |
| Psychology | 0 | 0.0% |
| Social Sciences | 9 | 23.1% |
| Engineering | 4 | 10.3% |
| Multidisciplinary Studies | 0 | 0.0% |
| Science & Technology | 0 | 0.0% |
| Business | 8 | 20.5% |
| Education | 2 | 5.1% |
| Literature & Languages | 0 | 0.0% |
| Liberal Arts & History | 14 | 35.9% |
| Visual & Performing Arts | 0 | 0.0% |
| Communications | 0 | 0.0% |
| Arts & Humanities | 2 | 5.1% |
| Total | 39 | 100.0% |
Transportation & Commute in Mcnary
Vehicle Availability by Sex in Mcnary
The most prevalent vehicle ownership categories in Mcnary are males with 2 vehicles (46, accounting for 31.9%) and females with 2 vehicles (36, making up 35.4%).
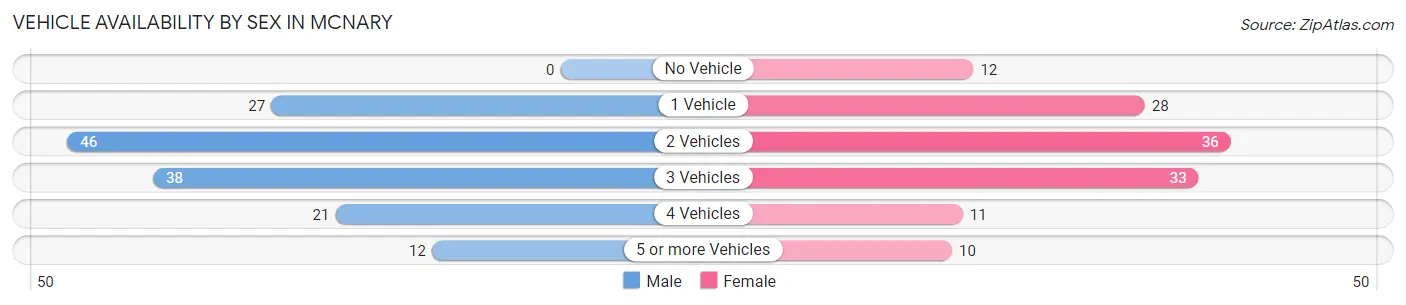
| Vehicles Available | Male | Female |
| No Vehicle | 0 (0.0%) | 12 (9.2%) |
| 1 Vehicle | 27 (18.8%) | 28 (21.5%) |
| 2 Vehicles | 46 (31.9%) | 36 (27.7%) |
| 3 Vehicles | 38 (26.4%) | 33 (25.4%) |
| 4 Vehicles | 21 (14.6%) | 11 (8.5%) |
| 5 or more Vehicles | 12 (8.3%) | 10 (7.7%) |
| Total | 144 (100.0%) | 130 (100.0%) |
Commute Time in Mcnary
The most frequently occuring commute durations in Mcnary are 30 to 34 minutes (81 commuters, 31.0%), 25 to 29 minutes (48 commuters, 18.4%), and 15 to 19 minutes (28 commuters, 10.7%).
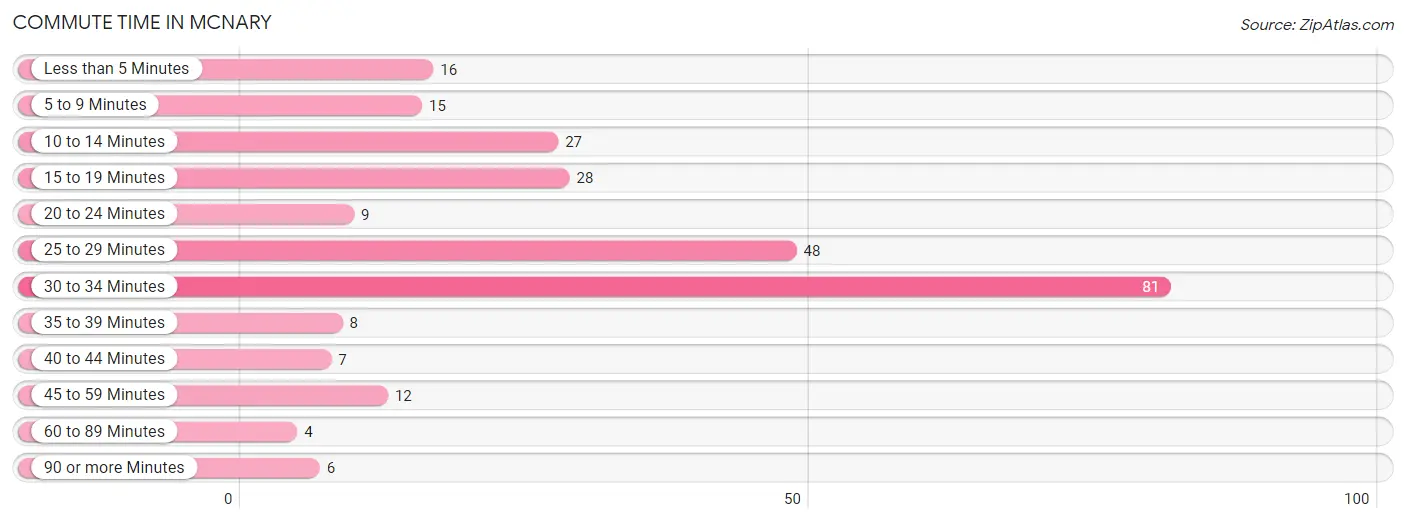
| Commute Time | # Commuters | % Commuters |
| Less than 5 Minutes | 16 | 6.1% |
| 5 to 9 Minutes | 15 | 5.8% |
| 10 to 14 Minutes | 27 | 10.3% |
| 15 to 19 Minutes | 28 | 10.7% |
| 20 to 24 Minutes | 9 | 3.5% |
| 25 to 29 Minutes | 48 | 18.4% |
| 30 to 34 Minutes | 81 | 31.0% |
| 35 to 39 Minutes | 8 | 3.1% |
| 40 to 44 Minutes | 7 | 2.7% |
| 45 to 59 Minutes | 12 | 4.6% |
| 60 to 89 Minutes | 4 | 1.5% |
| 90 or more Minutes | 6 | 2.3% |
Commute Time by Sex in Mcnary
The most common commute times in Mcnary are 30 to 34 minutes (39 commuters, 27.9%) for males and 30 to 34 minutes (42 commuters, 34.7%) for females.
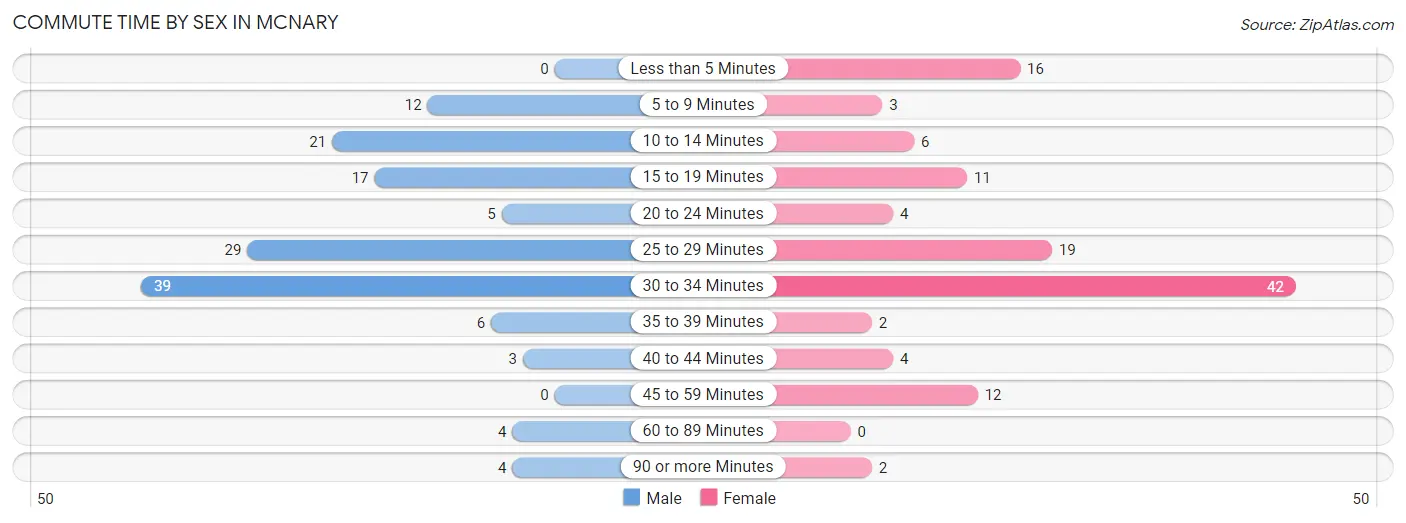
| Commute Time | Male | Female |
| Less than 5 Minutes | 0 (0.0%) | 16 (13.2%) |
| 5 to 9 Minutes | 12 (8.6%) | 3 (2.5%) |
| 10 to 14 Minutes | 21 (15.0%) | 6 (5.0%) |
| 15 to 19 Minutes | 17 (12.1%) | 11 (9.1%) |
| 20 to 24 Minutes | 5 (3.6%) | 4 (3.3%) |
| 25 to 29 Minutes | 29 (20.7%) | 19 (15.7%) |
| 30 to 34 Minutes | 39 (27.9%) | 42 (34.7%) |
| 35 to 39 Minutes | 6 (4.3%) | 2 (1.7%) |
| 40 to 44 Minutes | 3 (2.1%) | 4 (3.3%) |
| 45 to 59 Minutes | 0 (0.0%) | 12 (9.9%) |
| 60 to 89 Minutes | 4 (2.9%) | 0 (0.0%) |
| 90 or more Minutes | 4 (2.9%) | 2 (1.7%) |
Time of Departure to Work by Sex in Mcnary
The most frequent times of departure to work in Mcnary are 8:00 AM to 8:29 AM (36, 25.7%) for males and 6:30 AM to 6:59 AM (25, 20.7%) for females.
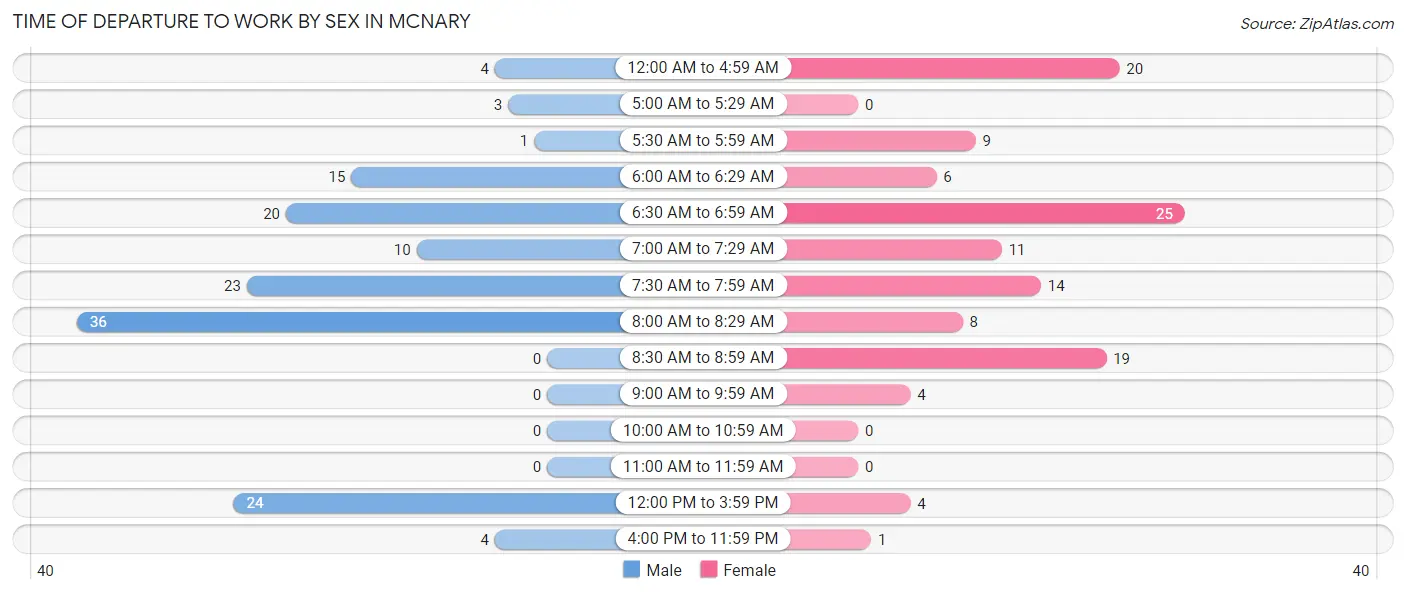
| Time of Departure | Male | Female |
| 12:00 AM to 4:59 AM | 4 (2.9%) | 20 (16.5%) |
| 5:00 AM to 5:29 AM | 3 (2.1%) | 0 (0.0%) |
| 5:30 AM to 5:59 AM | 1 (0.7%) | 9 (7.4%) |
| 6:00 AM to 6:29 AM | 15 (10.7%) | 6 (5.0%) |
| 6:30 AM to 6:59 AM | 20 (14.3%) | 25 (20.7%) |
| 7:00 AM to 7:29 AM | 10 (7.1%) | 11 (9.1%) |
| 7:30 AM to 7:59 AM | 23 (16.4%) | 14 (11.6%) |
| 8:00 AM to 8:29 AM | 36 (25.7%) | 8 (6.6%) |
| 8:30 AM to 8:59 AM | 0 (0.0%) | 19 (15.7%) |
| 9:00 AM to 9:59 AM | 0 (0.0%) | 4 (3.3%) |
| 10:00 AM to 10:59 AM | 0 (0.0%) | 0 (0.0%) |
| 11:00 AM to 11:59 AM | 0 (0.0%) | 0 (0.0%) |
| 12:00 PM to 3:59 PM | 24 (17.1%) | 4 (3.3%) |
| 4:00 PM to 11:59 PM | 4 (2.9%) | 1 (0.8%) |
| Total | 140 (100.0%) | 121 (100.0%) |
Housing Occupancy in Mcnary
Occupancy by Ownership in Mcnary
Of the total 175 dwellings in Mcnary, owner-occupied units account for 98 (56.0%), while renter-occupied units make up 77 (44.0%).
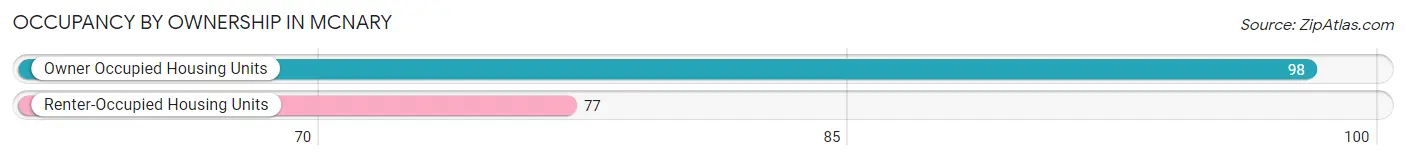
| Occupancy | # Housing Units | % Housing Units |
| Owner Occupied Housing Units | 98 | 56.0% |
| Renter-Occupied Housing Units | 77 | 44.0% |
| Total Occupied Housing Units | 175 | 100.0% |
Occupancy by Household Size in Mcnary
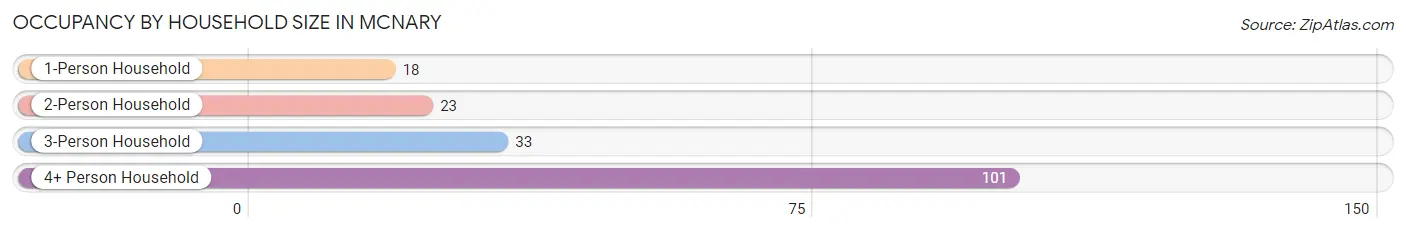
| Household Size | # Housing Units | % Housing Units |
| 1-Person Household | 18 | 10.3% |
| 2-Person Household | 23 | 13.1% |
| 3-Person Household | 33 | 18.9% |
| 4+ Person Household | 101 | 57.7% |
| Total Housing Units | 175 | 100.0% |
Occupancy by Ownership by Household Size in Mcnary
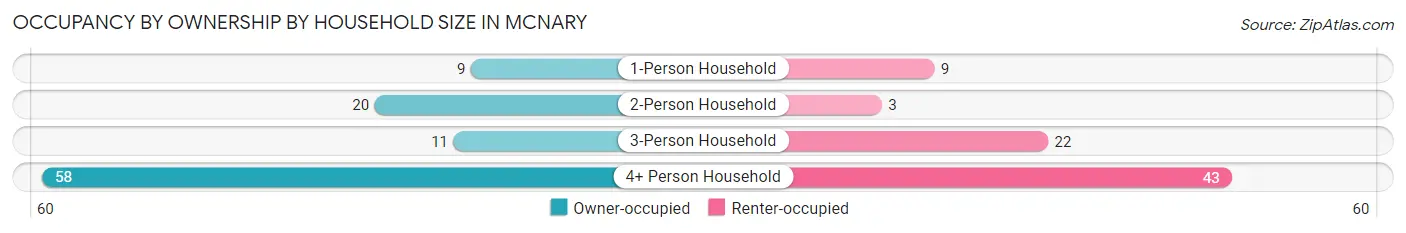
| Household Size | Owner-occupied | Renter-occupied |
| 1-Person Household | 9 (50.0%) | 9 (50.0%) |
| 2-Person Household | 20 (87.0%) | 3 (13.0%) |
| 3-Person Household | 11 (33.3%) | 22 (66.7%) |
| 4+ Person Household | 58 (57.4%) | 43 (42.6%) |
| Total Housing Units | 98 (56.0%) | 77 (44.0%) |
Occupancy by Educational Attainment in Mcnary
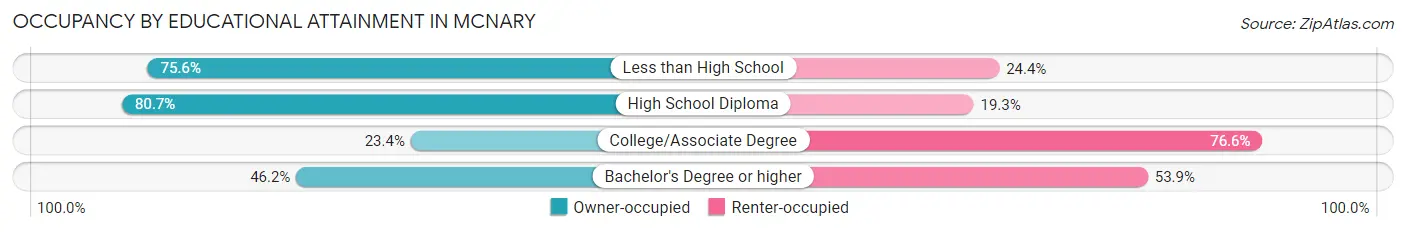
| Household Size | Owner-occupied | Renter-occupied |
| Less than High School | 31 (75.6%) | 10 (24.4%) |
| High School Diploma | 46 (80.7%) | 11 (19.3%) |
| College/Associate Degree | 15 (23.4%) | 49 (76.6%) |
| Bachelor's Degree or higher | 6 (46.2%) | 7 (53.8%) |
Occupancy by Age of Householder in Mcnary
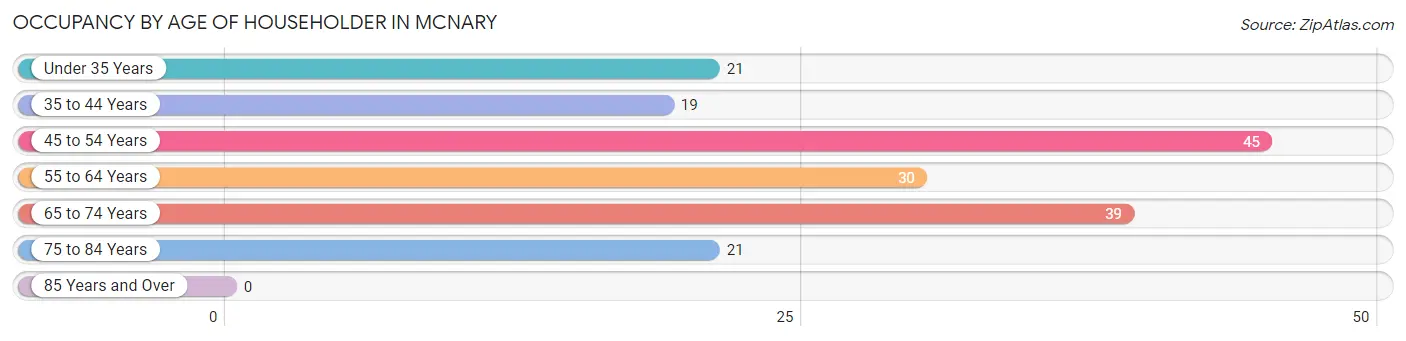
| Age Bracket | # Households | % Households |
| Under 35 Years | 21 | 12.0% |
| 35 to 44 Years | 19 | 10.9% |
| 45 to 54 Years | 45 | 25.7% |
| 55 to 64 Years | 30 | 17.1% |
| 65 to 74 Years | 39 | 22.3% |
| 75 to 84 Years | 21 | 12.0% |
| 85 Years and Over | 0 | 0.0% |
| Total | 175 | 100.0% |
Housing Finances in Mcnary
Median Income by Occupancy in Mcnary
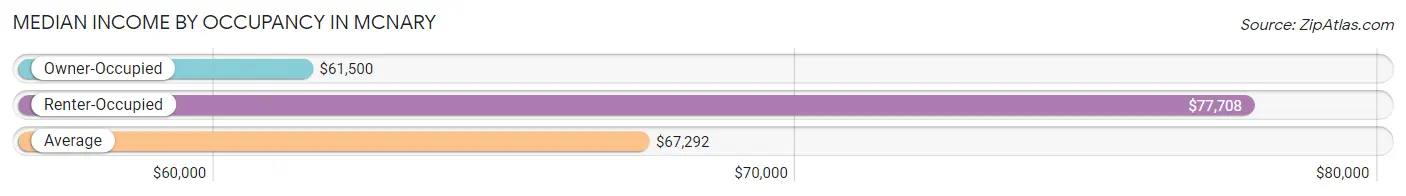
| Occupancy Type | # Households | Median Income |
| Owner-Occupied | 98 (56.0%) | $61,500 |
| Renter-Occupied | 77 (44.0%) | $77,708 |
| Average | 175 (100.0%) | $67,292 |
Occupancy by Householder Income Bracket in Mcnary
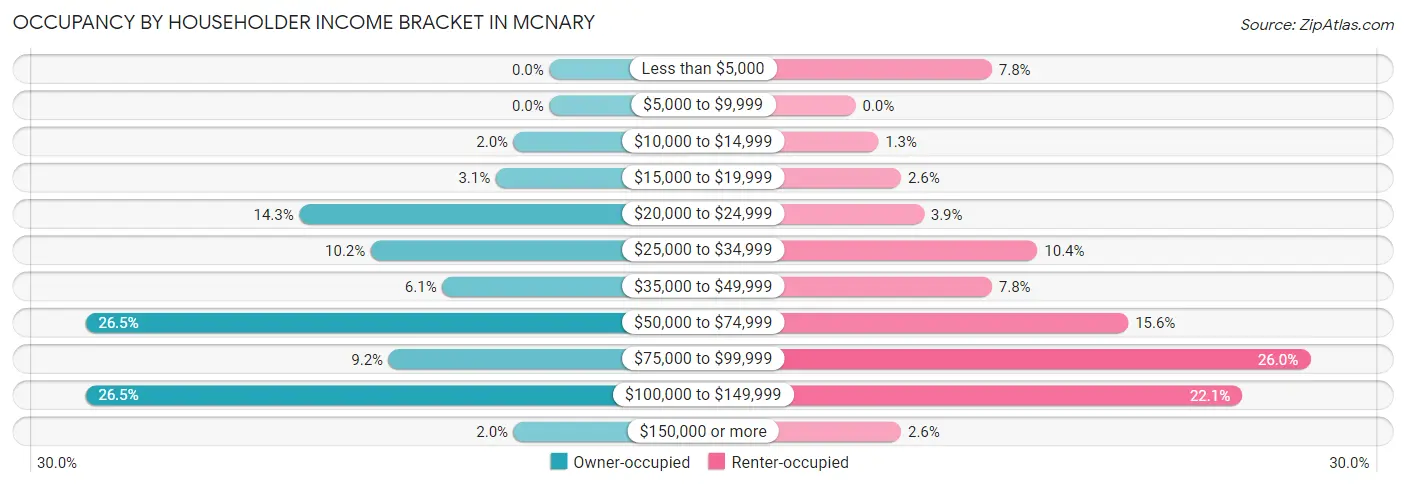
| Income Bracket | Owner-occupied | Renter-occupied |
| Less than $5,000 | 0 (0.0%) | 6 (7.8%) |
| $5,000 to $9,999 | 0 (0.0%) | 0 (0.0%) |
| $10,000 to $14,999 | 2 (2.0%) | 1 (1.3%) |
| $15,000 to $19,999 | 3 (3.1%) | 2 (2.6%) |
| $20,000 to $24,999 | 14 (14.3%) | 3 (3.9%) |
| $25,000 to $34,999 | 10 (10.2%) | 8 (10.4%) |
| $35,000 to $49,999 | 6 (6.1%) | 6 (7.8%) |
| $50,000 to $74,999 | 26 (26.5%) | 12 (15.6%) |
| $75,000 to $99,999 | 9 (9.2%) | 20 (26.0%) |
| $100,000 to $149,999 | 26 (26.5%) | 17 (22.1%) |
| $150,000 or more | 2 (2.0%) | 2 (2.6%) |
| Total | 98 (100.0%) | 77 (100.0%) |
Monthly Housing Cost Tiers in Mcnary
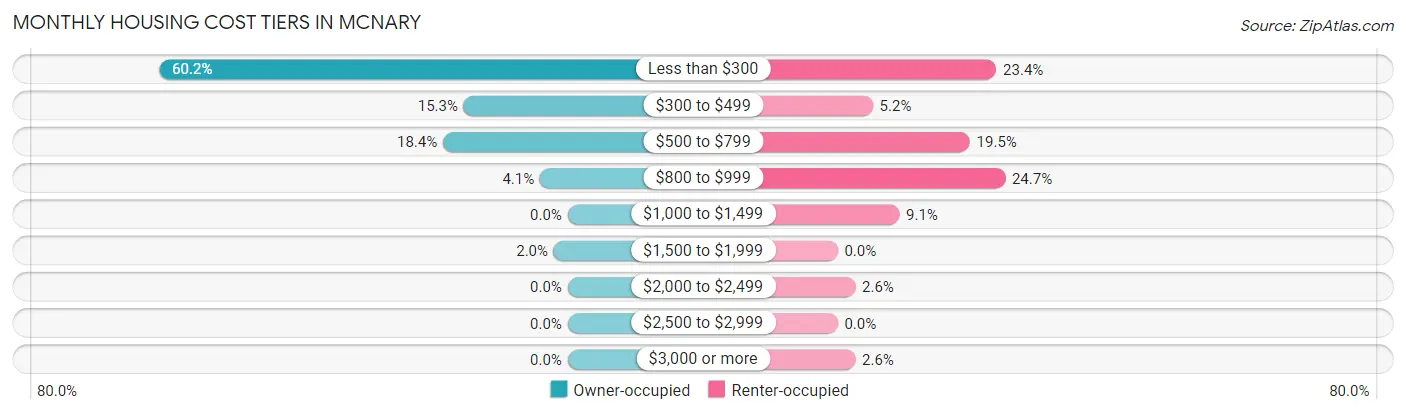
| Monthly Cost | Owner-occupied | Renter-occupied |
| Less than $300 | 59 (60.2%) | 18 (23.4%) |
| $300 to $499 | 15 (15.3%) | 4 (5.2%) |
| $500 to $799 | 18 (18.4%) | 15 (19.5%) |
| $800 to $999 | 4 (4.1%) | 19 (24.7%) |
| $1,000 to $1,499 | 0 (0.0%) | 7 (9.1%) |
| $1,500 to $1,999 | 2 (2.0%) | 0 (0.0%) |
| $2,000 to $2,499 | 0 (0.0%) | 2 (2.6%) |
| $2,500 to $2,999 | 0 (0.0%) | 0 (0.0%) |
| $3,000 or more | 0 (0.0%) | 2 (2.6%) |
| Total | 98 (100.0%) | 77 (100.0%) |
Physical Housing Characteristics in Mcnary
Housing Structures in Mcnary
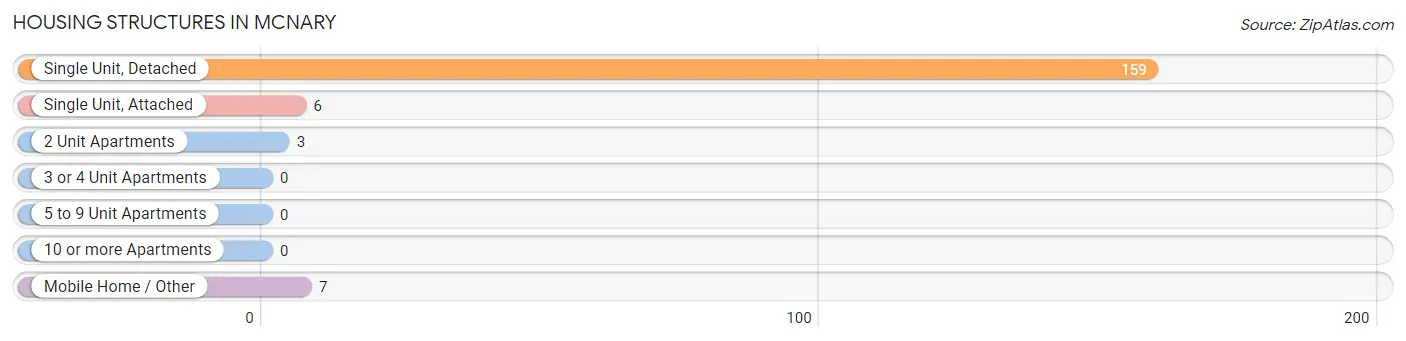
| Structure Type | # Housing Units | % Housing Units |
| Single Unit, Detached | 159 | 90.9% |
| Single Unit, Attached | 6 | 3.4% |
| 2 Unit Apartments | 3 | 1.7% |
| 3 or 4 Unit Apartments | 0 | 0.0% |
| 5 to 9 Unit Apartments | 0 | 0.0% |
| 10 or more Apartments | 0 | 0.0% |
| Mobile Home / Other | 7 | 4.0% |
| Total | 175 | 100.0% |
Housing Structures by Occupancy in Mcnary
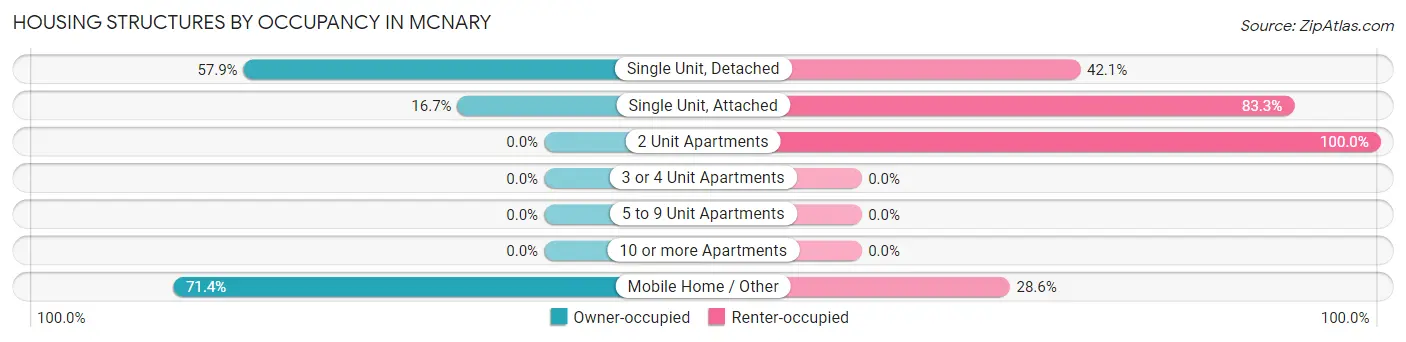
| Structure Type | Owner-occupied | Renter-occupied |
| Single Unit, Detached | 92 (57.9%) | 67 (42.1%) |
| Single Unit, Attached | 1 (16.7%) | 5 (83.3%) |
| 2 Unit Apartments | 0 (0.0%) | 3 (100.0%) |
| 3 or 4 Unit Apartments | 0 (0.0%) | 0 (0.0%) |
| 5 to 9 Unit Apartments | 0 (0.0%) | 0 (0.0%) |
| 10 or more Apartments | 0 (0.0%) | 0 (0.0%) |
| Mobile Home / Other | 5 (71.4%) | 2 (28.6%) |
| Total | 98 (56.0%) | 77 (44.0%) |
Housing Structures by Number of Rooms in Mcnary
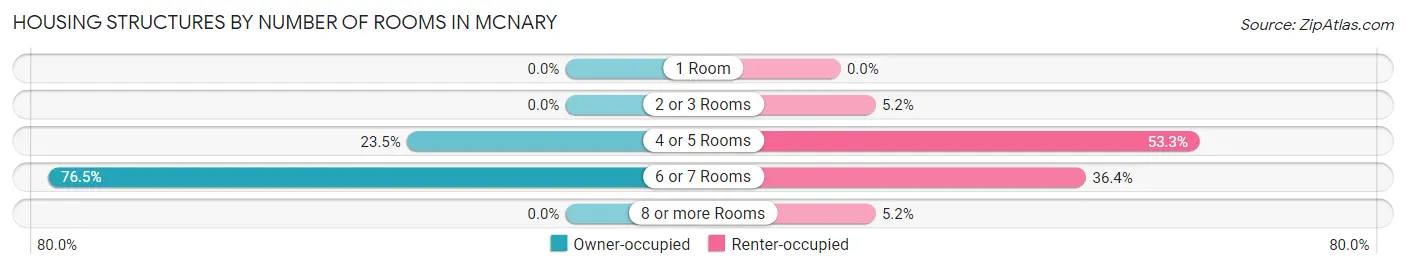
| Number of Rooms | Owner-occupied | Renter-occupied |
| 1 Room | 0 (0.0%) | 0 (0.0%) |
| 2 or 3 Rooms | 0 (0.0%) | 4 (5.2%) |
| 4 or 5 Rooms | 23 (23.5%) | 41 (53.2%) |
| 6 or 7 Rooms | 75 (76.5%) | 28 (36.4%) |
| 8 or more Rooms | 0 (0.0%) | 4 (5.2%) |
| Total | 98 (100.0%) | 77 (100.0%) |
Housing Structure by Heating Type in Mcnary
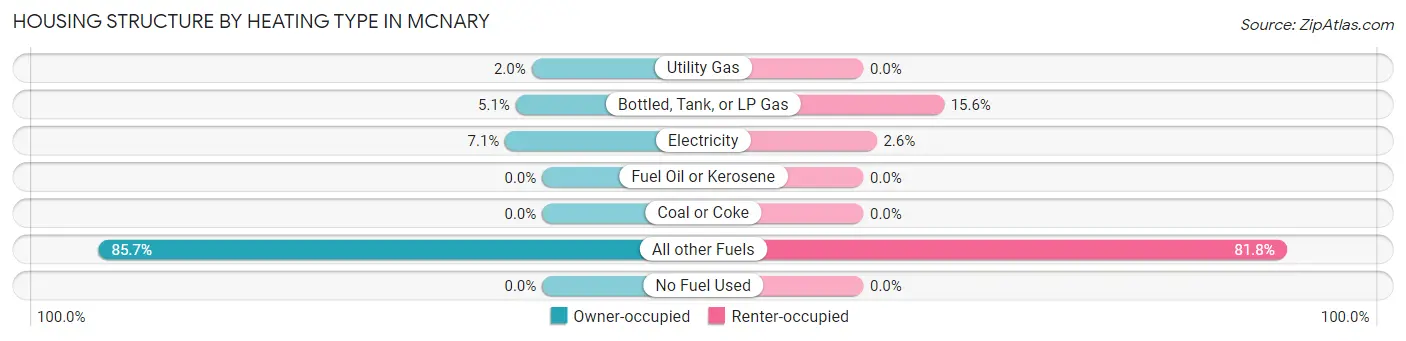
| Heating Type | Owner-occupied | Renter-occupied |
| Utility Gas | 2 (2.0%) | 0 (0.0%) |
| Bottled, Tank, or LP Gas | 5 (5.1%) | 12 (15.6%) |
| Electricity | 7 (7.1%) | 2 (2.6%) |
| Fuel Oil or Kerosene | 0 (0.0%) | 0 (0.0%) |
| Coal or Coke | 0 (0.0%) | 0 (0.0%) |
| All other Fuels | 84 (85.7%) | 63 (81.8%) |
| No Fuel Used | 0 (0.0%) | 0 (0.0%) |
| Total | 98 (100.0%) | 77 (100.0%) |
Household Vehicle Usage in Mcnary
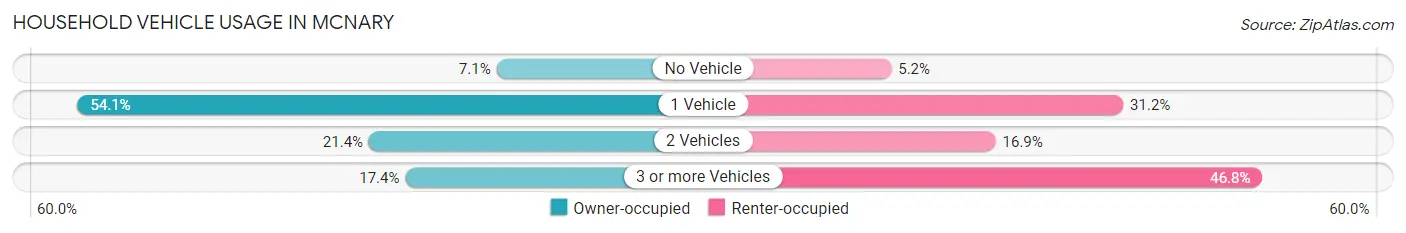
| Vehicles per Household | Owner-occupied | Renter-occupied |
| No Vehicle | 7 (7.1%) | 4 (5.2%) |
| 1 Vehicle | 53 (54.1%) | 24 (31.2%) |
| 2 Vehicles | 21 (21.4%) | 13 (16.9%) |
| 3 or more Vehicles | 17 (17.3%) | 36 (46.8%) |
| Total | 98 (100.0%) | 77 (100.0%) |
Real Estate & Mortgages in Mcnary
Real Estate and Mortgage Overview in Mcnary
| Characteristic | Without Mortgage | With Mortgage |
| Housing Units | 70 | 28 |
| Median Property Value | $44,300 | $88,600 |
| Median Household Income | $67,500 | $2 |
| Monthly Housing Costs | $147 | $0 |
| Real Estate Taxes | - | - |
Property Value by Mortgage Status in Mcnary
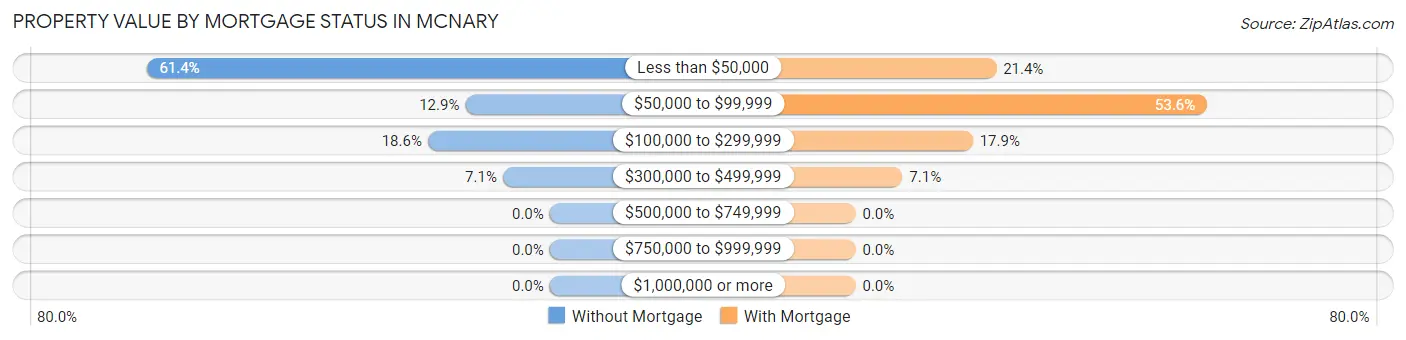
| Property Value | Without Mortgage | With Mortgage |
| Less than $50,000 | 43 (61.4%) | 6 (21.4%) |
| $50,000 to $99,999 | 9 (12.9%) | 15 (53.6%) |
| $100,000 to $299,999 | 13 (18.6%) | 5 (17.9%) |
| $300,000 to $499,999 | 5 (7.1%) | 2 (7.1%) |
| $500,000 to $749,999 | 0 (0.0%) | 0 (0.0%) |
| $750,000 to $999,999 | 0 (0.0%) | 0 (0.0%) |
| $1,000,000 or more | 0 (0.0%) | 0 (0.0%) |
| Total | 70 (100.0%) | 28 (100.0%) |
Household Income by Mortgage Status in Mcnary
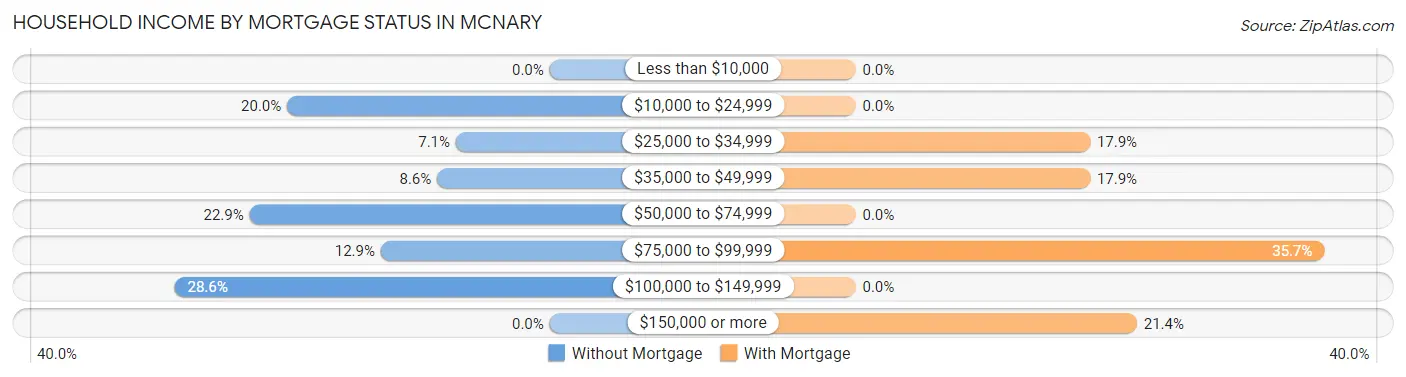
| Household Income | Without Mortgage | With Mortgage |
| Less than $10,000 | 0 (0.0%) | 0 (0.0%) |
| $10,000 to $24,999 | 14 (20.0%) | 0 (0.0%) |
| $25,000 to $34,999 | 5 (7.1%) | 5 (17.9%) |
| $35,000 to $49,999 | 6 (8.6%) | 5 (17.9%) |
| $50,000 to $74,999 | 16 (22.9%) | 0 (0.0%) |
| $75,000 to $99,999 | 9 (12.9%) | 10 (35.7%) |
| $100,000 to $149,999 | 20 (28.6%) | 0 (0.0%) |
| $150,000 or more | 0 (0.0%) | 6 (21.4%) |
| Total | 70 (100.0%) | 28 (100.0%) |
Property Value to Household Income Ratio in Mcnary
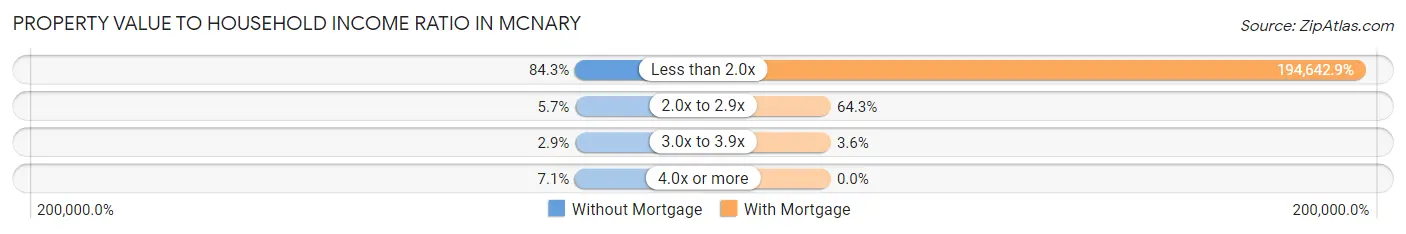
| Value-to-Income Ratio | Without Mortgage | With Mortgage |
| Less than 2.0x | 59 (84.3%) | 54,500 (194,642.9%) |
| 2.0x to 2.9x | 4 (5.7%) | 18 (64.3%) |
| 3.0x to 3.9x | 2 (2.9%) | 1 (3.6%) |
| 4.0x or more | 5 (7.1%) | 0 (0.0%) |
| Total | 70 (100.0%) | 28 (100.0%) |
Real Estate Taxes by Mortgage Status in Mcnary
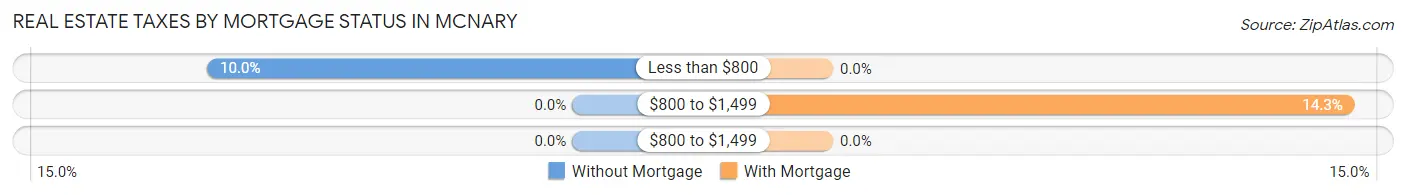
| Property Taxes | Without Mortgage | With Mortgage |
| Less than $800 | 7 (10.0%) | 0 (0.0%) |
| $800 to $1,499 | 0 (0.0%) | 4 (14.3%) |
| $800 to $1,499 | 0 (0.0%) | 0 (0.0%) |
| Total | 70 (100.0%) | 28 (100.0%) |
Health & Disability in Mcnary
Health Insurance Coverage by Age in Mcnary
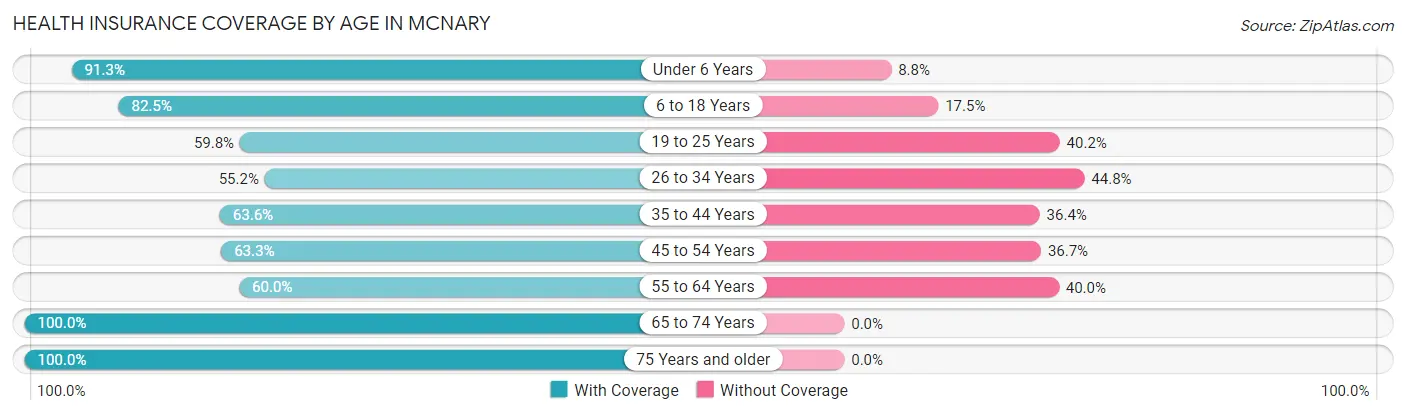
| Age Bracket | With Coverage | Without Coverage |
| Under 6 Years | 73 (91.2%) | 7 (8.7%) |
| 6 to 18 Years | 226 (82.5%) | 48 (17.5%) |
| 19 to 25 Years | 76 (59.8%) | 51 (40.2%) |
| 26 to 34 Years | 74 (55.2%) | 60 (44.8%) |
| 35 to 44 Years | 89 (63.6%) | 51 (36.4%) |
| 45 to 54 Years | 57 (63.3%) | 33 (36.7%) |
| 55 to 64 Years | 30 (60.0%) | 20 (40.0%) |
| 65 to 74 Years | 61 (100.0%) | 0 (0.0%) |
| 75 Years and older | 24 (100.0%) | 0 (0.0%) |
| Total | 710 (72.5%) | 270 (27.6%) |
Health Insurance Coverage by Citizenship Status in Mcnary
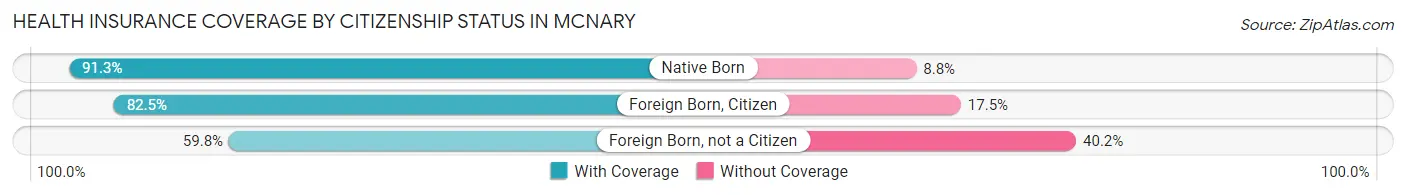
| Citizenship Status | With Coverage | Without Coverage |
| Native Born | 73 (91.2%) | 7 (8.7%) |
| Foreign Born, Citizen | 226 (82.5%) | 48 (17.5%) |
| Foreign Born, not a Citizen | 76 (59.8%) | 51 (40.2%) |
Health Insurance Coverage by Household Income in Mcnary
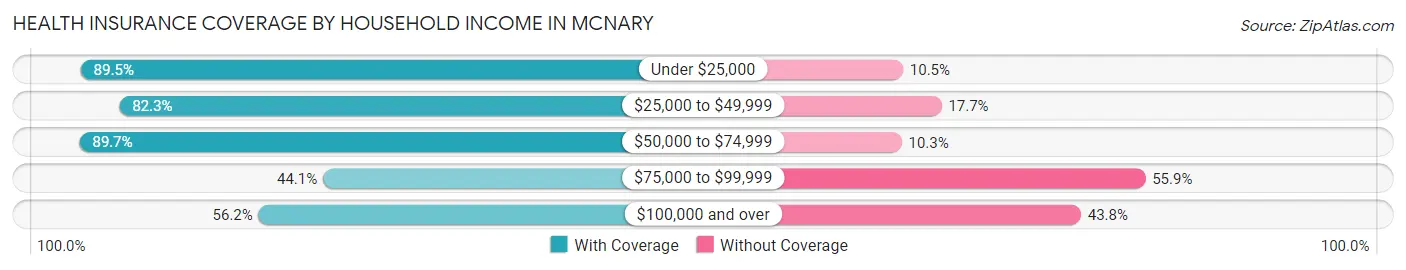
| Household Income | With Coverage | Without Coverage |
| Under $25,000 | 179 (89.5%) | 21 (10.5%) |
| $25,000 to $49,999 | 116 (82.3%) | 25 (17.7%) |
| $50,000 to $74,999 | 210 (89.7%) | 24 (10.3%) |
| $75,000 to $99,999 | 82 (44.1%) | 104 (55.9%) |
| $100,000 and over | 123 (56.2%) | 96 (43.8%) |
Public vs Private Health Insurance Coverage by Age in Mcnary
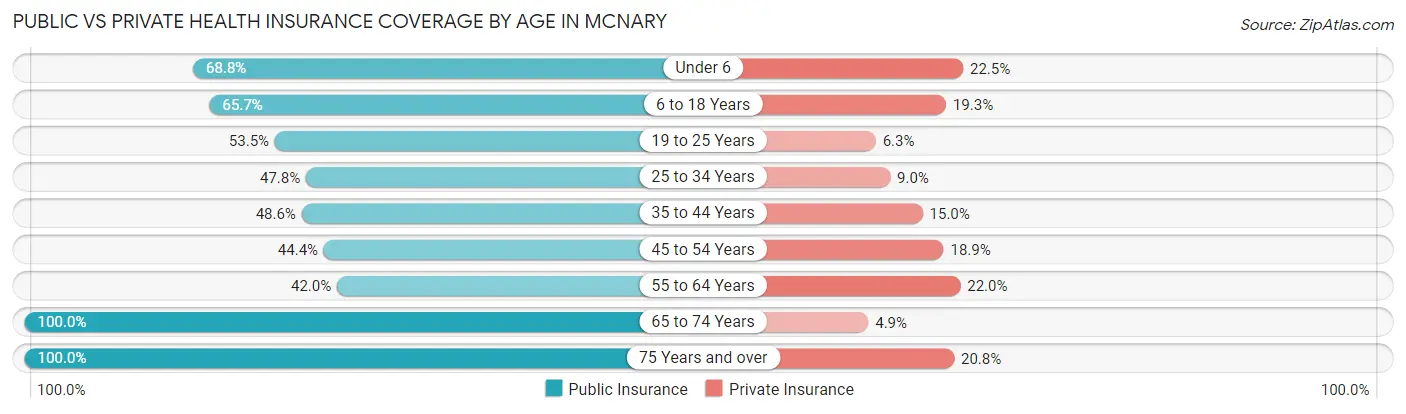
| Age Bracket | Public Insurance | Private Insurance |
| Under 6 | 55 (68.8%) | 18 (22.5%) |
| 6 to 18 Years | 180 (65.7%) | 53 (19.3%) |
| 19 to 25 Years | 68 (53.5%) | 8 (6.3%) |
| 25 to 34 Years | 64 (47.8%) | 12 (9.0%) |
| 35 to 44 Years | 68 (48.6%) | 21 (15.0%) |
| 45 to 54 Years | 40 (44.4%) | 17 (18.9%) |
| 55 to 64 Years | 21 (42.0%) | 11 (22.0%) |
| 65 to 74 Years | 61 (100.0%) | 3 (4.9%) |
| 75 Years and over | 24 (100.0%) | 5 (20.8%) |
| Total | 581 (59.3%) | 148 (15.1%) |
Disability Status by Sex by Age in Mcnary
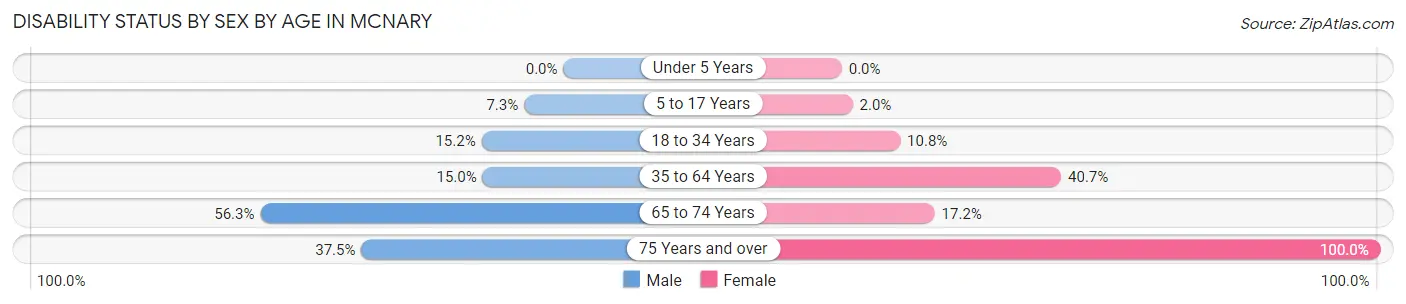
| Age Bracket | Male | Female |
| Under 5 Years | 0 (0.0%) | 0 (0.0%) |
| 5 to 17 Years | 10 (7.3%) | 3 (2.0%) |
| 18 to 34 Years | 19 (15.2%) | 17 (10.8%) |
| 35 to 64 Years | 21 (15.0%) | 57 (40.7%) |
| 65 to 74 Years | 18 (56.2%) | 5 (17.2%) |
| 75 Years and over | 3 (37.5%) | 16 (100.0%) |
Disability Class by Sex by Age in Mcnary
Disability Class: Hearing Difficulty
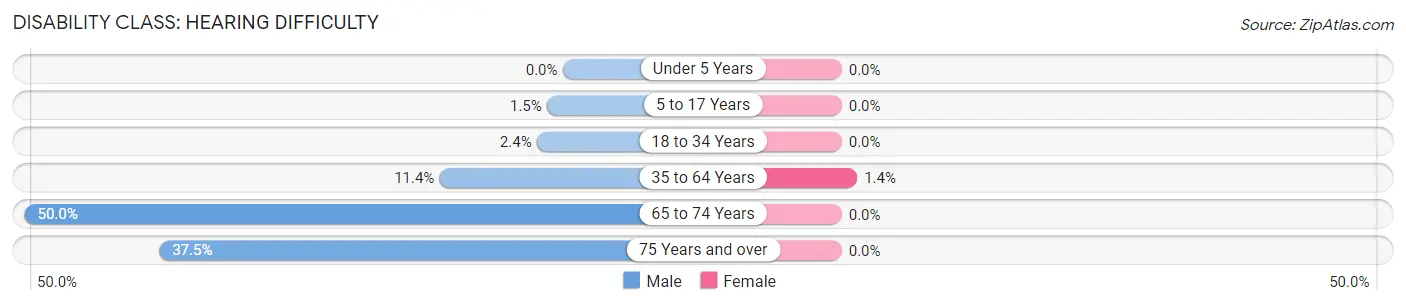
| Age Bracket | Male | Female |
| Under 5 Years | 0 (0.0%) | 0 (0.0%) |
| 5 to 17 Years | 2 (1.5%) | 0 (0.0%) |
| 18 to 34 Years | 3 (2.4%) | 0 (0.0%) |
| 35 to 64 Years | 16 (11.4%) | 2 (1.4%) |
| 65 to 74 Years | 16 (50.0%) | 0 (0.0%) |
| 75 Years and over | 3 (37.5%) | 0 (0.0%) |
Disability Class: Vision Difficulty
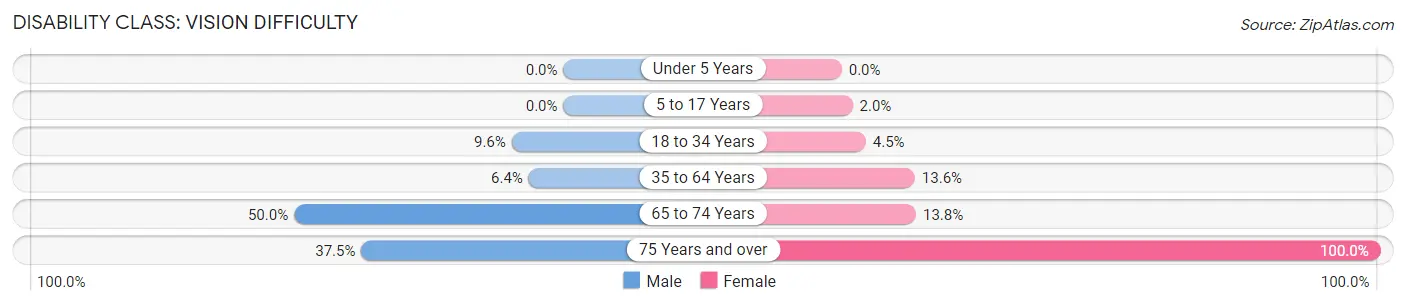
| Age Bracket | Male | Female |
| Under 5 Years | 0 (0.0%) | 0 (0.0%) |
| 5 to 17 Years | 0 (0.0%) | 3 (2.0%) |
| 18 to 34 Years | 12 (9.6%) | 7 (4.5%) |
| 35 to 64 Years | 9 (6.4%) | 19 (13.6%) |
| 65 to 74 Years | 16 (50.0%) | 4 (13.8%) |
| 75 Years and over | 3 (37.5%) | 16 (100.0%) |
Disability Class: Cognitive Difficulty
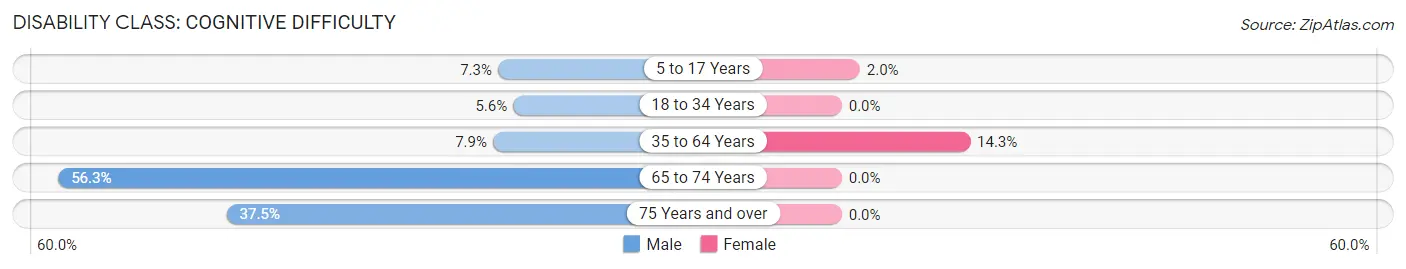
| Age Bracket | Male | Female |
| 5 to 17 Years | 10 (7.3%) | 3 (2.0%) |
| 18 to 34 Years | 7 (5.6%) | 0 (0.0%) |
| 35 to 64 Years | 11 (7.9%) | 20 (14.3%) |
| 65 to 74 Years | 18 (56.2%) | 0 (0.0%) |
| 75 Years and over | 3 (37.5%) | 0 (0.0%) |
Disability Class: Ambulatory Difficulty
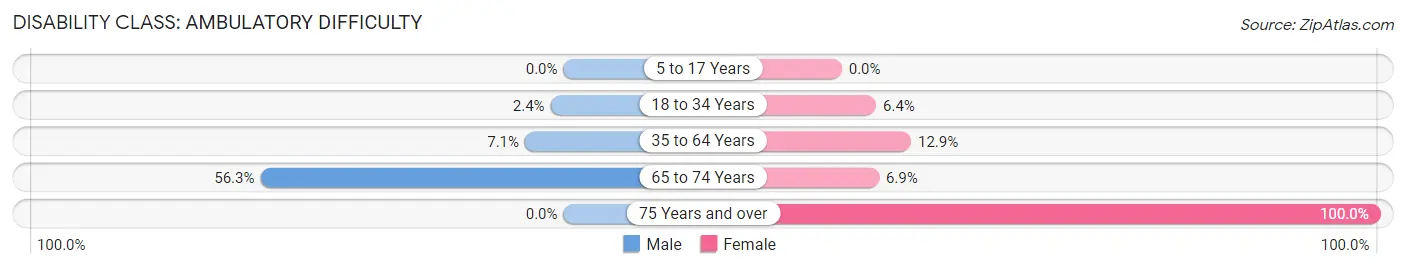
| Age Bracket | Male | Female |
| 5 to 17 Years | 0 (0.0%) | 0 (0.0%) |
| 18 to 34 Years | 3 (2.4%) | 10 (6.4%) |
| 35 to 64 Years | 10 (7.1%) | 18 (12.9%) |
| 65 to 74 Years | 18 (56.2%) | 2 (6.9%) |
| 75 Years and over | 0 (0.0%) | 16 (100.0%) |
Disability Class: Self-Care Difficulty
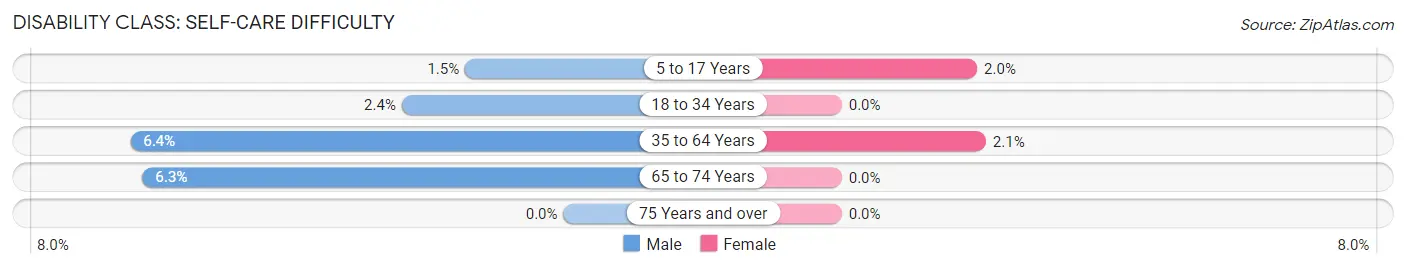
| Age Bracket | Male | Female |
| 5 to 17 Years | 2 (1.5%) | 3 (2.0%) |
| 18 to 34 Years | 3 (2.4%) | 0 (0.0%) |
| 35 to 64 Years | 9 (6.4%) | 3 (2.1%) |
| 65 to 74 Years | 2 (6.2%) | 0 (0.0%) |
| 75 Years and over | 0 (0.0%) | 0 (0.0%) |
Technology Access in Mcnary
Computing Device Access in Mcnary
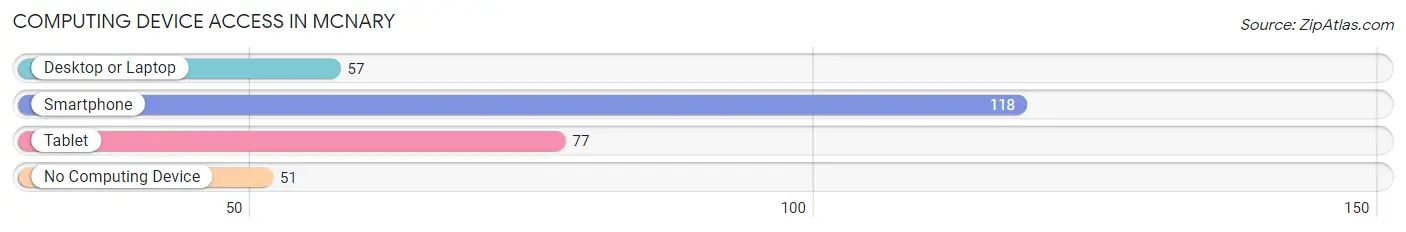
| Device Type | # Households | % Households |
| Desktop or Laptop | 57 | 32.6% |
| Smartphone | 118 | 67.4% |
| Tablet | 77 | 44.0% |
| No Computing Device | 51 | 29.1% |
| Total | 175 | 100.0% |
Internet Access in Mcnary
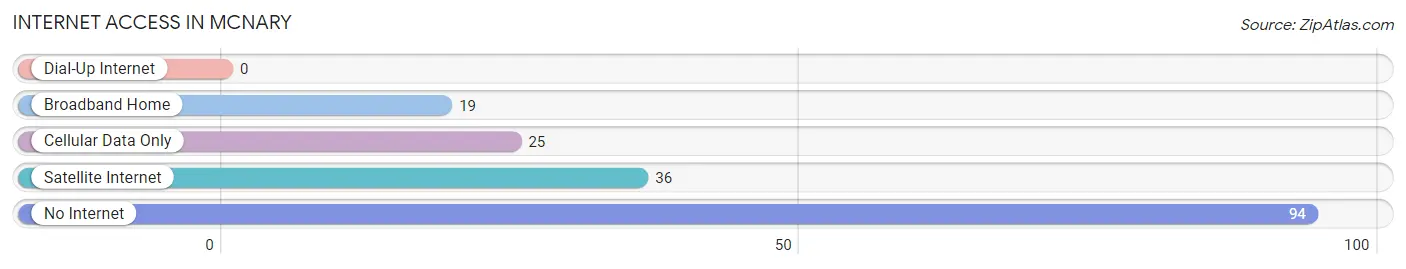
| Internet Type | # Households | % Households |
| Dial-Up Internet | 0 | 0.0% |
| Broadband Home | 19 | 10.9% |
| Cellular Data Only | 25 | 14.3% |
| Satellite Internet | 36 | 20.6% |
| No Internet | 94 | 53.7% |
| Total | 175 | 100.0% |
Mcnary Summary
Mcnary is a small unincorporated community located in Apache County, Arizona. It is situated on the Navajo Nation Reservation, approximately 20 miles east of the city of Show Low. The population of Mcnary was estimated to be around 1,000 in 2020.
History
Mcnary was founded in the late 1800s by a group of Mormon settlers. The settlers named the town after a local Native American chief, Chief McNary. The town was originally a trading post and a stop on the stagecoach line. In the early 1900s, the town was home to a number of businesses, including a hotel, a general store, a post office, and a blacksmith shop.
In the early 1900s, the town was also home to a number of Native American tribes, including the Navajo, Apache, and Hopi. The town was a popular trading post for the tribes, and many of the settlers in the area were of Native American descent.
Geography
Mcnary is located in the White Mountains of Arizona, at an elevation of 6,000 feet. The town is surrounded by the Apache-Sitgreaves National Forest, and is located near the headwaters of the Little Colorado River. The town is located approximately 20 miles east of Show Low, and is accessible via State Route 260.
The climate in Mcnary is semi-arid, with hot summers and cold winters. The average annual temperature is around 50 degrees Fahrenheit, and the average annual precipitation is around 12 inches.
Economy
The economy of Mcnary is largely based on tourism and agriculture. The town is home to a number of tourist attractions, including the White Mountain Apache Cultural Center, the Apache-Sitgreaves National Forest, and the Petrified Forest National Park. The town is also home to a number of agricultural operations, including cattle ranches, hay farms, and orchards.
Demographics
As of the 2010 census, the population of Mcnary was 1,000. The racial makeup of the town was 95.2% Native American, 2.2% White, 0.2% African American, 0.2% Asian, and 2.2% from other races. The median household income was $25,000, and the median home value was $50,000.
Mcnary is a small, rural community with a rich history and culture. The town is home to a number of tourist attractions, and is a popular destination for outdoor enthusiasts. The town is also home to a number of agricultural operations, and is a great place to live for those looking for a quiet, rural lifestyle.
Common Questions
What is Per Capita Income in Mcnary?
Per Capita income in Mcnary is $14,455.
What is the Median Family Income in Mcnary?
Median Family Income in Mcnary is $71,000.
What is the Median Household income in Mcnary?
Median Household Income in Mcnary is $67,292.
What is Income or Wage Gap in Mcnary?
Income or Wage Gap in Mcnary is 12.3%.
Women in Mcnary earn 87.7 cents for every dollar earned by a man.
What is Inequality or Gini Index in Mcnary?
Inequality or Gini Index in Mcnary is 0.33.
What is the Total Population of Mcnary?
Total Population of Mcnary is 980.
What is the Total Male Population of Mcnary?
Total Male Population of Mcnary is 467.
What is the Total Female Population of Mcnary?
Total Female Population of Mcnary is 513.
What is the Ratio of Males per 100 Females in Mcnary?
There are 91.03 Males per 100 Females in Mcnary.
What is the Ratio of Females per 100 Males in Mcnary?
There are 109.85 Females per 100 Males in Mcnary.
What is the Median Population Age in Mcnary?
Median Population Age in Mcnary is 26.3 Years.
What is the Average Family Size in Mcnary
Average Family Size in Mcnary is 5.9 People.
What is the Average Household Size in Mcnary
Average Household Size in Mcnary is 5.6 People.
How Large is the Labor Force in Mcnary?
There are 309 People in the Labor Forcein in Mcnary.
What is the Percentage of People in the Labor Force in Mcnary?
45.3% of People are in the Labor Force in Mcnary.
What is the Unemployment Rate in Mcnary?
Unemployment Rate in Mcnary is 10.7%.