Chilchinbito, AZ Map & Demographics
Chilchinbito Map
Chilchinbito Overview
$12,605
PER CAPITA INCOME
$22,875
AVG FAMILY INCOME
$12,941
AVG HOUSEHOLD INCOME
62.8%
WAGE / INCOME GAP [ % ]
37.2¢/ $1
WAGE / INCOME GAP [ $ ]
0.62
INEQUALITY / GINI INDEX
849
TOTAL POPULATION
418
MALE POPULATION
431
FEMALE POPULATION
96.98
MALES / 100 FEMALES
103.11
FEMALES / 100 MALES
35.4
MEDIAN AGE
3.3
AVG FAMILY SIZE
2.2
AVG HOUSEHOLD SIZE
230
LABOR FORCE [ PEOPLE ]
36.1%
PERCENT IN LABOR FORCE
23.9%
UNEMPLOYMENT RATE
Income in Chilchinbito
Income Overview in Chilchinbito
Per Capita Income in Chilchinbito is $12,605, while median incomes of families and households are $22,875 and $12,941 respectively.
| Characteristic | Number | Measure |
| Per Capita Income | 849 | $12,605 |
| Median Family Income | 180 | $22,875 |
| Mean Family Income | 180 | $35,422 |
| Median Household Income | 380 | $12,941 |
| Mean Household Income | 380 | $27,957 |
| Income Deficit | 180 | $0 |
| Wage / Income Gap (%) | 849 | 62.81% |
| Wage / Income Gap ($) | 849 | 37.19¢ per $1 |
| Gini / Inequality Index | 849 | 0.62 |
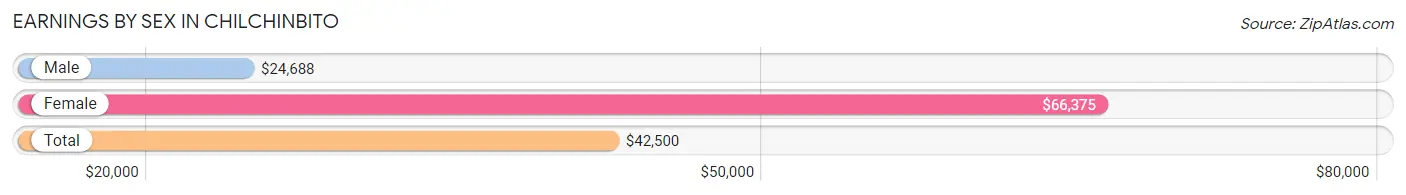
Earnings by Sex in Chilchinbito
Average Earnings in Chilchinbito are $42,500, $24,688 for men and $66,375 for women, a difference of 62.8%.
| Sex | Number | Average Earnings |
| Male | 85 (45.2%) | $24,688 |
| Female | 103 (54.8%) | $66,375 |
| Total | 188 (100.0%) | $42,500 |
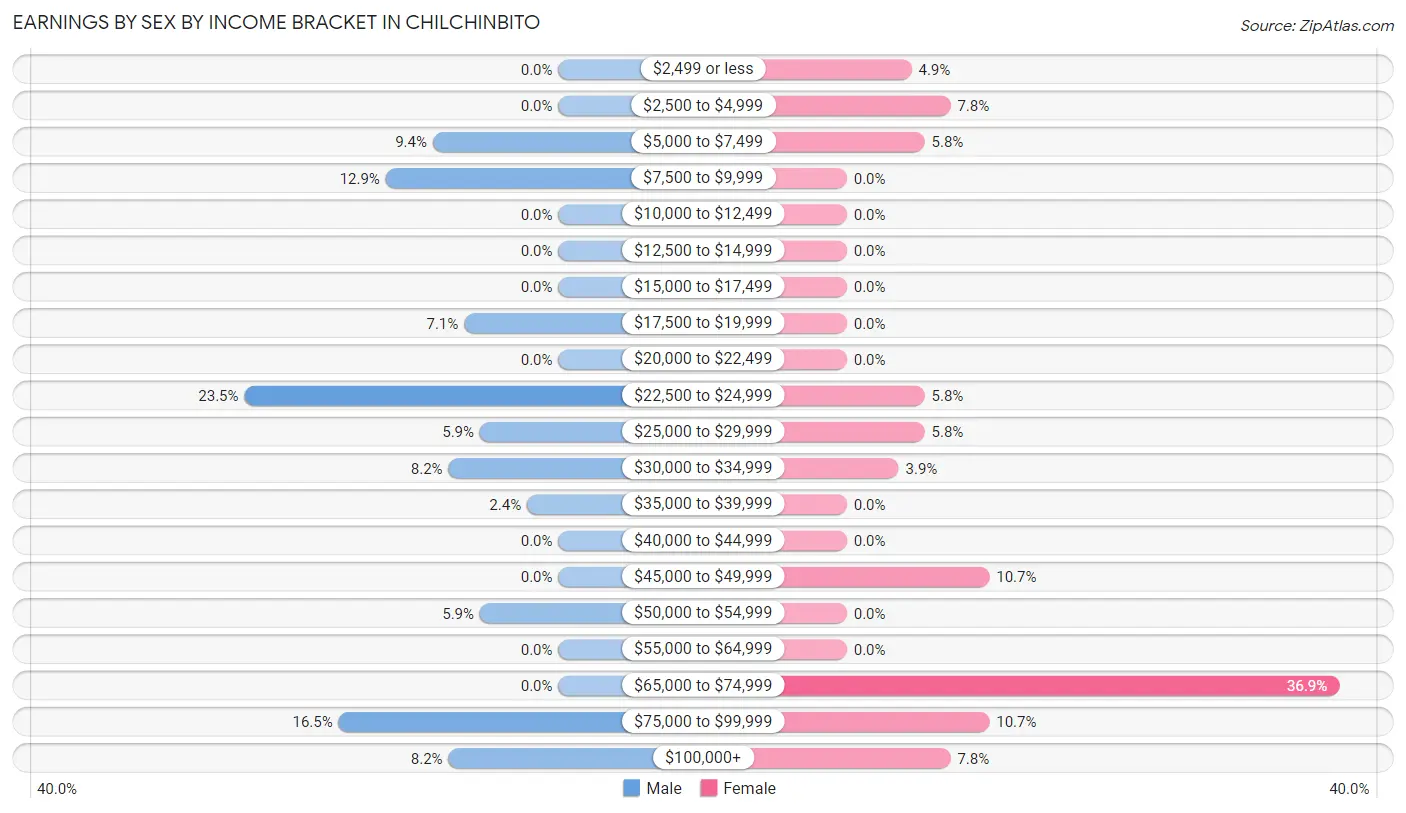
Earnings by Sex by Income Bracket in Chilchinbito
The most common earnings brackets in Chilchinbito are $22,500 to $24,999 for men (20 | 23.5%) and $65,000 to $74,999 for women (38 | 36.9%).
| Income | Male | Female |
| $2,499 or less | 0 (0.0%) | 5 (4.9%) |
| $2,500 to $4,999 | 0 (0.0%) | 8 (7.8%) |
| $5,000 to $7,499 | 8 (9.4%) | 6 (5.8%) |
| $7,500 to $9,999 | 11 (12.9%) | 0 (0.0%) |
| $10,000 to $12,499 | 0 (0.0%) | 0 (0.0%) |
| $12,500 to $14,999 | 0 (0.0%) | 0 (0.0%) |
| $15,000 to $17,499 | 0 (0.0%) | 0 (0.0%) |
| $17,500 to $19,999 | 6 (7.1%) | 0 (0.0%) |
| $20,000 to $22,499 | 0 (0.0%) | 0 (0.0%) |
| $22,500 to $24,999 | 20 (23.5%) | 6 (5.8%) |
| $25,000 to $29,999 | 5 (5.9%) | 6 (5.8%) |
| $30,000 to $34,999 | 7 (8.2%) | 4 (3.9%) |
| $35,000 to $39,999 | 2 (2.4%) | 0 (0.0%) |
| $40,000 to $44,999 | 0 (0.0%) | 0 (0.0%) |
| $45,000 to $49,999 | 0 (0.0%) | 11 (10.7%) |
| $50,000 to $54,999 | 5 (5.9%) | 0 (0.0%) |
| $55,000 to $64,999 | 0 (0.0%) | 0 (0.0%) |
| $65,000 to $74,999 | 0 (0.0%) | 38 (36.9%) |
| $75,000 to $99,999 | 14 (16.5%) | 11 (10.7%) |
| $100,000+ | 7 (8.2%) | 8 (7.8%) |
| Total | 85 (100.0%) | 103 (100.0%) |
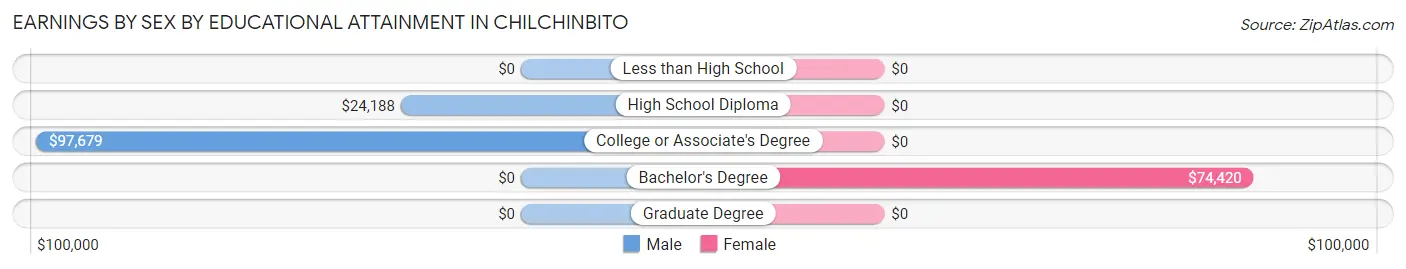
Earnings by Sex by Educational Attainment in Chilchinbito
Average earnings in Chilchinbito are $25,250 for men and $67,375 for women, a difference of 62.5%. Men with an educational attainment of college or associate's degree enjoy the highest average annual earnings of $97,679, while those with high school diploma education earn the least with $24,188. Women with an educational attainment of bachelor's degree earn the most with the average annual earnings of $74,420, while those with bachelor's degree education have the smallest earnings of $74,420.
| Educational Attainment | Male Income | Female Income |
| Less than High School | - | - |
| High School Diploma | $24,188 | $0 |
| College or Associate's Degree | $97,679 | $0 |
| Bachelor's Degree | - | - |
| Graduate Degree | - | - |
| Total | $25,250 | $67,375 |
Family Income in Chilchinbito
Family Income Brackets in Chilchinbito
According to the Chilchinbito family income data, there are 60 families falling into the less than $10,000 income range, which is the most common income bracket and makes up 33.3% of all families.
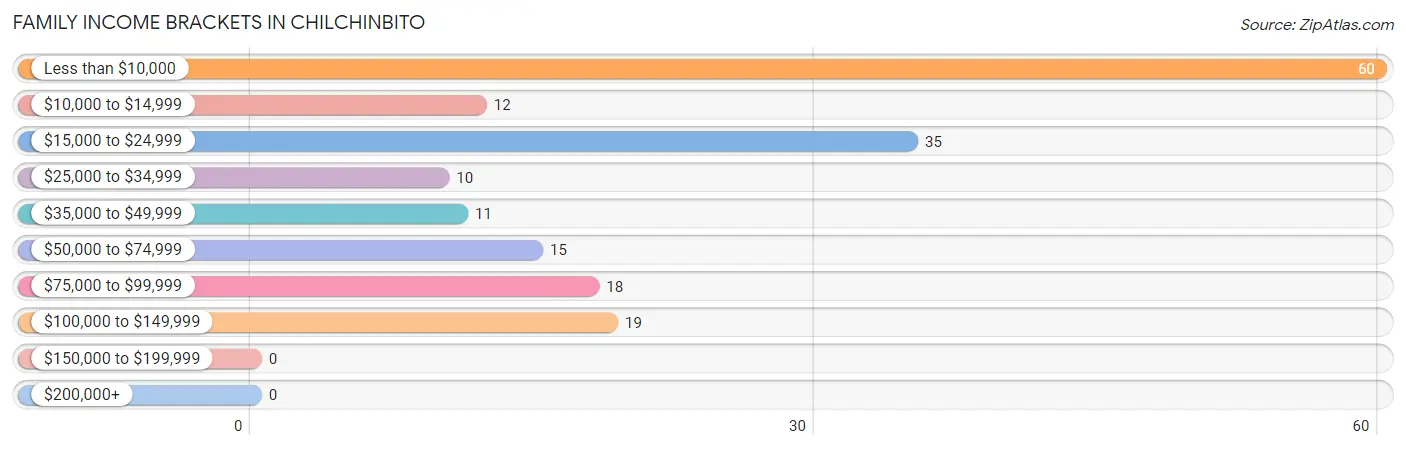
| Income Bracket | # Families | % Families |
| Less than $10,000 | 60 | 33.3% |
| $10,000 to $14,999 | 12 | 6.7% |
| $15,000 to $24,999 | 35 | 19.4% |
| $25,000 to $34,999 | 10 | 5.6% |
| $35,000 to $49,999 | 11 | 6.1% |
| $50,000 to $74,999 | 15 | 8.3% |
| $75,000 to $99,999 | 18 | 10.0% |
| $100,000 to $149,999 | 19 | 10.6% |
| $150,000 to $199,999 | 0 | 0.0% |
| $200,000+ | 0 | 0.0% |
Family Income by Famaliy Size in Chilchinbito
2-person families (56 | 31.1%) account for the highest median family income in Chilchinbito with $25,417 per family, while 2-person families (56 | 31.1%) have the highest median income of $12,708 per family member.
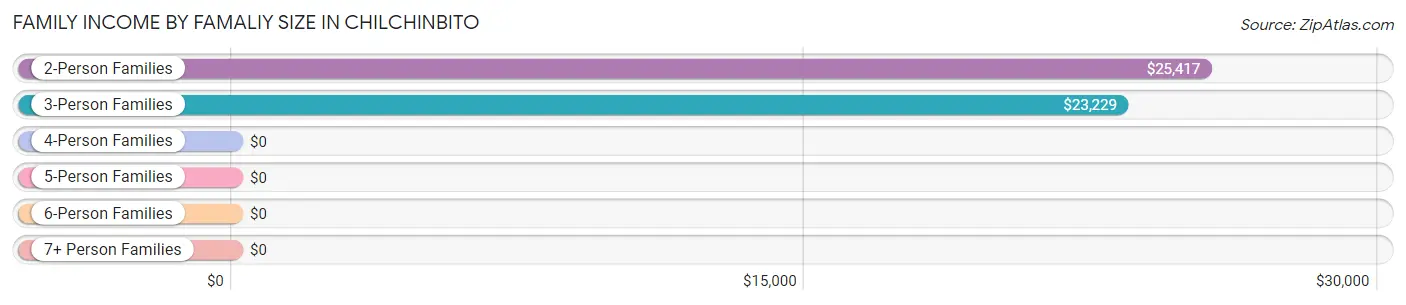
| Income Bracket | # Families | Median Income |
| 2-Person Families | 56 (31.1%) | $25,417 |
| 3-Person Families | 51 (28.3%) | $23,229 |
| 4-Person Families | 33 (18.3%) | $0 |
| 5-Person Families | 18 (10.0%) | $0 |
| 6-Person Families | 16 (8.9%) | $0 |
| 7+ Person Families | 6 (3.3%) | $0 |
| Total | 180 (100.0%) | $22,875 |
Family Income by Number of Earners in Chilchinbito
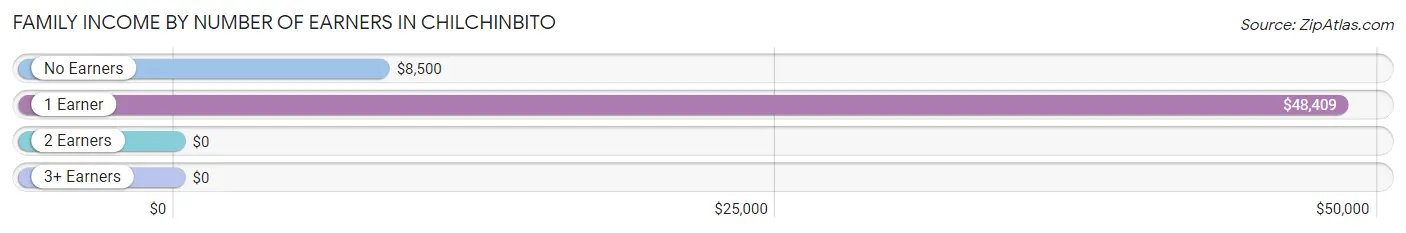
| Number of Earners | # Families | Median Income |
| No Earners | 76 (42.2%) | $8,500 |
| 1 Earner | 100 (55.6%) | $48,409 |
| 2 Earners | 4 (2.2%) | $0 |
| 3+ Earners | 0 (0.0%) | $0 |
| Total | 180 (100.0%) | $22,875 |
Household Income in Chilchinbito
Household Income Brackets in Chilchinbito
With 175 households falling in the category, the less than $10,000 income range is the most frequent in Chilchinbito, accounting for 46.1% of all households.
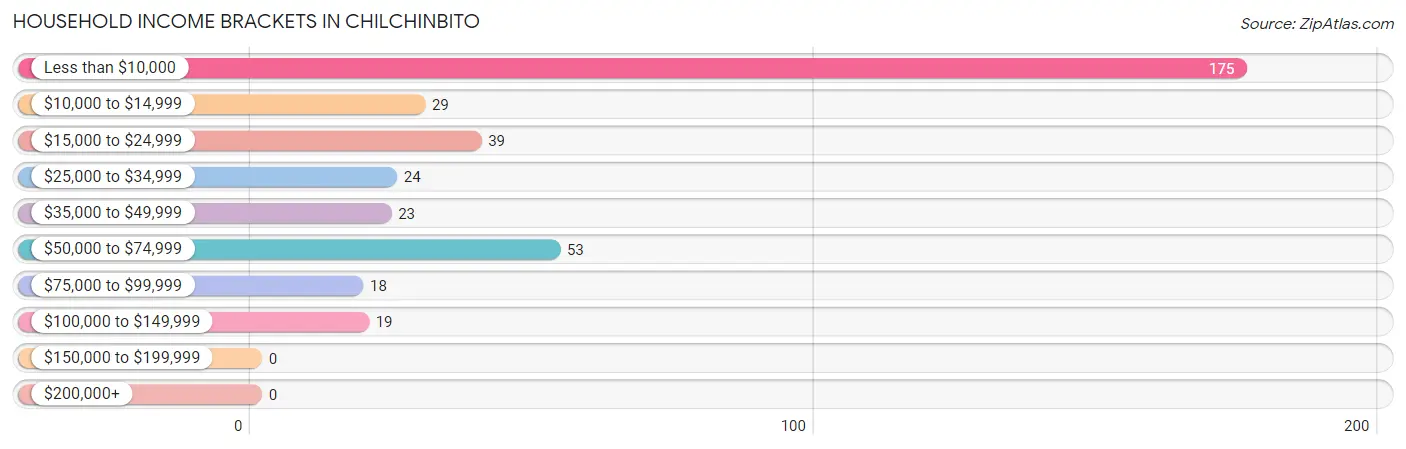
| Income Bracket | # Households | % Households |
| Less than $10,000 | 175 | 46.1% |
| $10,000 to $14,999 | 29 | 7.6% |
| $15,000 to $24,999 | 39 | 10.3% |
| $25,000 to $34,999 | 24 | 6.3% |
| $35,000 to $49,999 | 23 | 6.1% |
| $50,000 to $74,999 | 53 | 13.9% |
| $75,000 to $99,999 | 18 | 4.7% |
| $100,000 to $149,999 | 19 | 5.0% |
| $150,000 to $199,999 | 0 | 0.0% |
| $200,000+ | 0 | 0.0% |
Household Income by Householder Age in Chilchinbito
The median household income in Chilchinbito is $12,941, with the highest median household income of $14,750 found in the 65+ years age bracket for the primary householder. A total of 51 households (13.4%) fall into this category. Meanwhile, the 15 to 24 years age bracket for the primary householder has the lowest median household income of $0, with 6 households (1.6%) in this group.
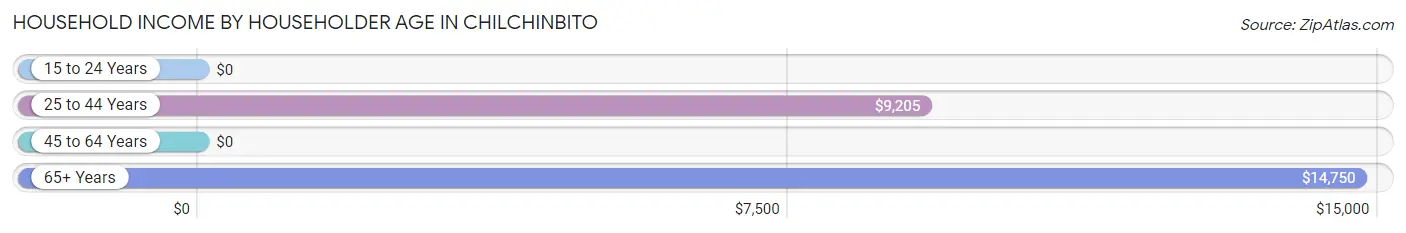
| Income Bracket | # Households | Median Income |
| 15 to 24 Years | 6 (1.6%) | $0 |
| 25 to 44 Years | 137 (36.0%) | $9,205 |
| 45 to 64 Years | 186 (48.9%) | $0 |
| 65+ Years | 51 (13.4%) | $14,750 |
| Total | 380 (100.0%) | $12,941 |
Poverty in Chilchinbito
Income Below Poverty by Sex and Age in Chilchinbito
With 63.6% poverty level for males and 55.2% for females among the residents of Chilchinbito, 5 year old males and 15 year old females are the most vulnerable to poverty, with 7 males (100.0%) and 5 females (100.0%) in their respective age groups living below the poverty level.
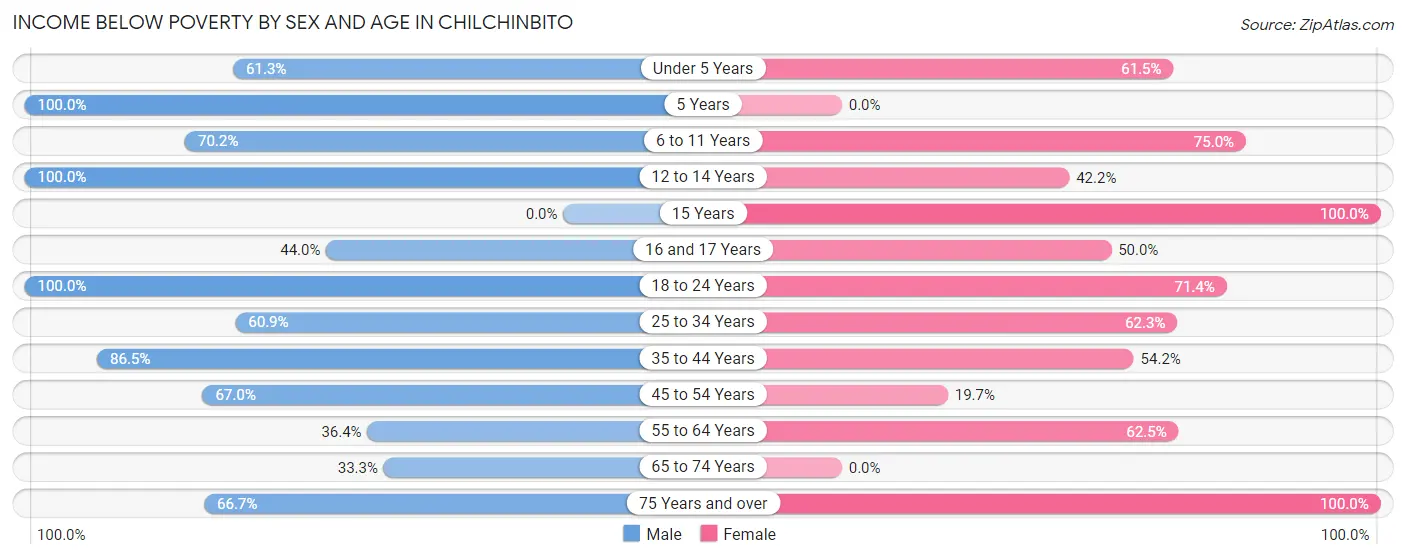
| Age Bracket | Male | Female |
| Under 5 Years | 19 (61.3%) | 8 (61.5%) |
| 5 Years | 7 (100.0%) | 0 (0.0%) |
| 6 to 11 Years | 33 (70.2%) | 36 (75.0%) |
| 12 to 14 Years | 9 (100.0%) | 19 (42.2%) |
| 15 Years | 0 (0.0%) | 5 (100.0%) |
| 16 and 17 Years | 11 (44.0%) | 5 (50.0%) |
| 18 to 24 Years | 11 (100.0%) | 45 (71.4%) |
| 25 to 34 Years | 28 (60.9%) | 33 (62.3%) |
| 35 to 44 Years | 45 (86.5%) | 39 (54.2%) |
| 45 to 54 Years | 71 (67.0%) | 12 (19.7%) |
| 55 to 64 Years | 12 (36.4%) | 20 (62.5%) |
| 65 to 74 Years | 10 (33.3%) | 0 (0.0%) |
| 75 Years and over | 10 (66.7%) | 16 (100.0%) |
| Total | 266 (63.6%) | 238 (55.2%) |
Income Above Poverty by Sex and Age in Chilchinbito
According to the poverty statistics in Chilchinbito, males aged 15 years and females aged 65 to 74 years are the age groups that are most secure financially, with 100.0% of males and 100.0% of females in these age groups living above the poverty line.
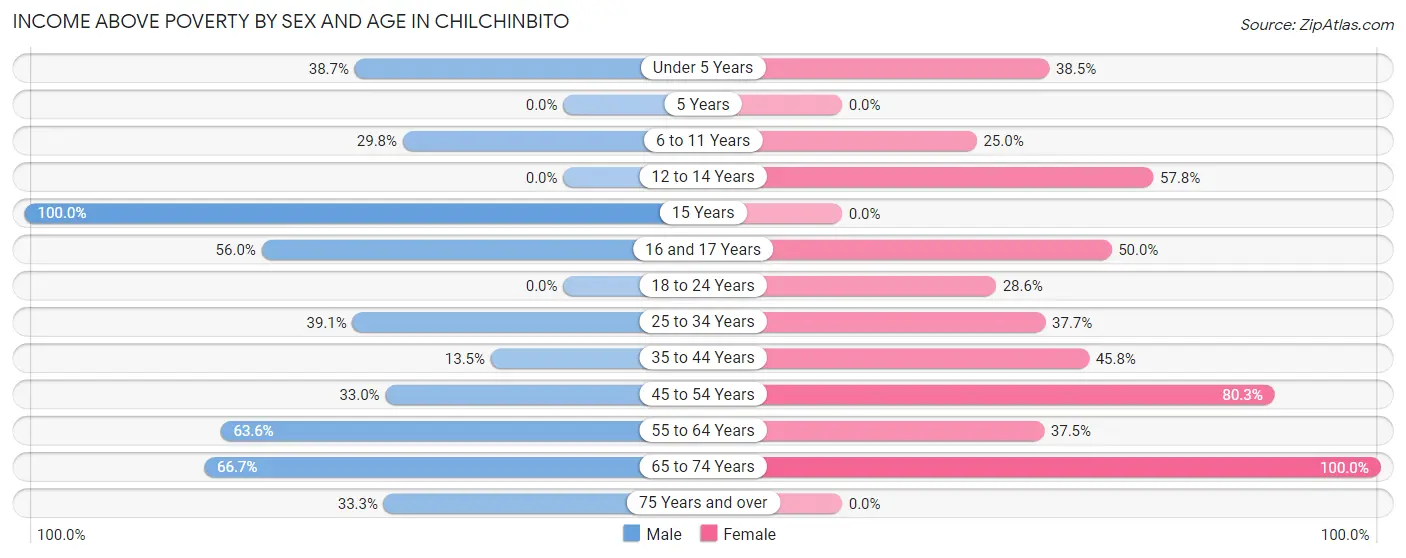
| Age Bracket | Male | Female |
| Under 5 Years | 12 (38.7%) | 5 (38.5%) |
| 5 Years | 0 (0.0%) | 0 (0.0%) |
| 6 to 11 Years | 14 (29.8%) | 12 (25.0%) |
| 12 to 14 Years | 0 (0.0%) | 26 (57.8%) |
| 15 Years | 6 (100.0%) | 0 (0.0%) |
| 16 and 17 Years | 14 (56.0%) | 5 (50.0%) |
| 18 to 24 Years | 0 (0.0%) | 18 (28.6%) |
| 25 to 34 Years | 18 (39.1%) | 20 (37.7%) |
| 35 to 44 Years | 7 (13.5%) | 33 (45.8%) |
| 45 to 54 Years | 35 (33.0%) | 49 (80.3%) |
| 55 to 64 Years | 21 (63.6%) | 12 (37.5%) |
| 65 to 74 Years | 20 (66.7%) | 13 (100.0%) |
| 75 Years and over | 5 (33.3%) | 0 (0.0%) |
| Total | 152 (36.4%) | 193 (44.8%) |
Income Below Poverty Among Married-Couple Families in Chilchinbito
The poverty statistics for married-couple families in Chilchinbito show that 10.4% or 5 of the total 48 families live below the poverty line. Families with no children have the highest poverty rate of 12.5%, comprising of 5 families. On the other hand, families with 1 or 2 children have the lowest poverty rate of 0.0%, which includes 0 families.
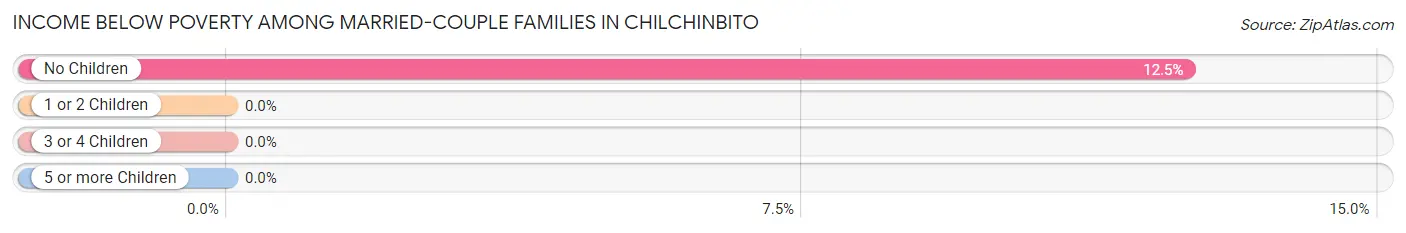
| Children | Above Poverty | Below Poverty |
| No Children | 35 (87.5%) | 5 (12.5%) |
| 1 or 2 Children | 8 (100.0%) | 0 (0.0%) |
| 3 or 4 Children | 0 (0.0%) | 0 (0.0%) |
| 5 or more Children | 0 (0.0%) | 0 (0.0%) |
| Total | 43 (89.6%) | 5 (10.4%) |
Income Below Poverty Among Single-Parent Households in Chilchinbito
According to the poverty data in Chilchinbito, 34.4% or 11 single-father households and 71.0% or 71 single-mother households are living below the poverty line. Among single-father households, those with no children have the highest poverty rate, with 11 households (84.6%) experiencing poverty. Likewise, among single-mother households, those with 5 or more children have the highest poverty rate, with 6 households (100.0%) falling below the poverty line.
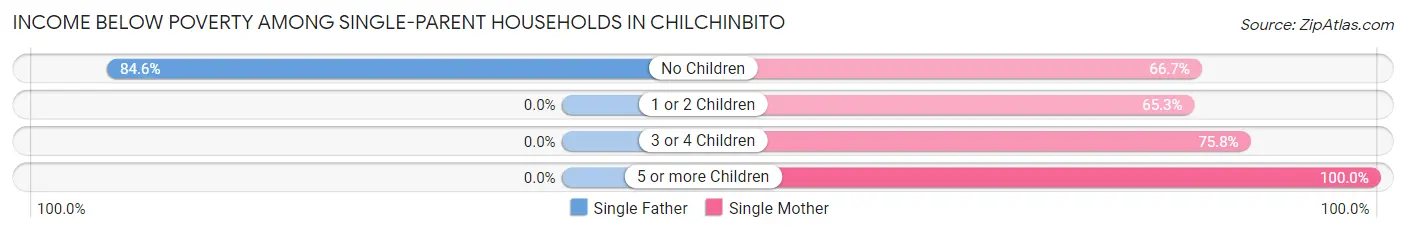
| Children | Single Father | Single Mother |
| No Children | 11 (84.6%) | 8 (66.7%) |
| 1 or 2 Children | 0 (0.0%) | 32 (65.3%) |
| 3 or 4 Children | 0 (0.0%) | 25 (75.8%) |
| 5 or more Children | 0 (0.0%) | 6 (100.0%) |
| Total | 11 (34.4%) | 71 (71.0%) |
Income Below Poverty Among Married-Couple vs Single-Parent Households in Chilchinbito
The poverty data for Chilchinbito shows that 5 of the married-couple family households (10.4%) and 82 of the single-parent households (62.1%) are living below the poverty level. Within the married-couple family households, those with no children have the highest poverty rate, with 5 households (12.5%) falling below the poverty line. Among the single-parent households, those with no children have the highest poverty rate, with 19 household (76.0%) living below poverty.
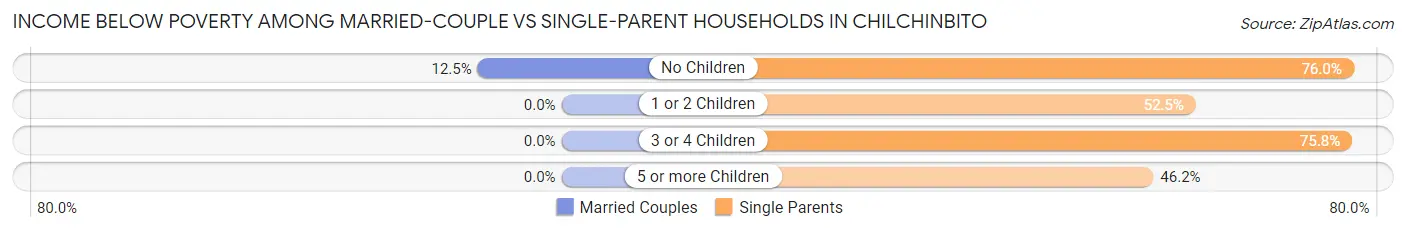
| Children | Married-Couple Families | Single-Parent Households |
| No Children | 5 (12.5%) | 19 (76.0%) |
| 1 or 2 Children | 0 (0.0%) | 32 (52.5%) |
| 3 or 4 Children | 0 (0.0%) | 25 (75.8%) |
| 5 or more Children | 0 (0.0%) | 6 (46.2%) |
| Total | 5 (10.4%) | 82 (62.1%) |
Race in Chilchinbito
The most populous races in Chilchinbito are Native / Alaskan (819 | 96.5%), Hispanic or Latino (20 | 2.4%), and Two or more Races (20 | 2.4%).
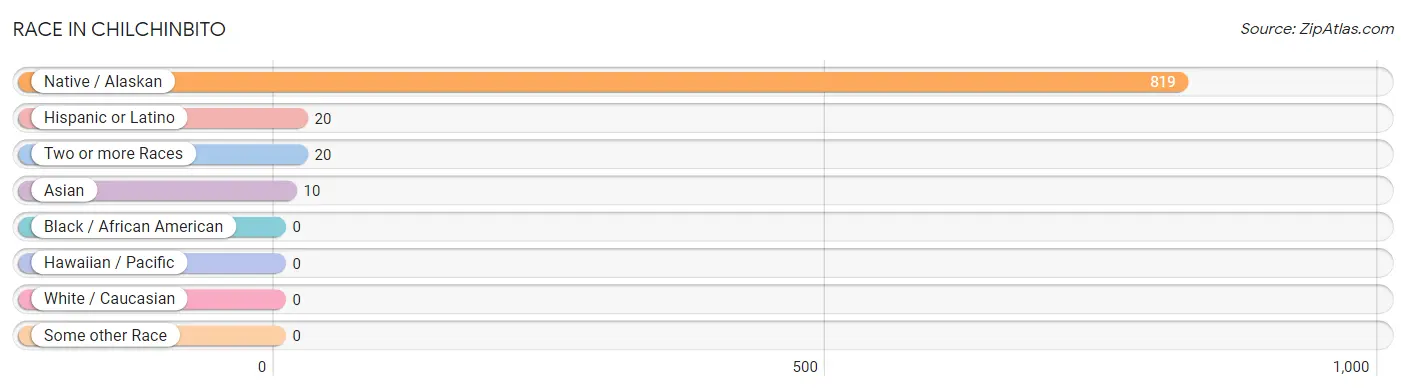
| Race | # Population | % Population |
| Asian | 10 | 1.2% |
| Black / African American | 0 | 0.0% |
| Hawaiian / Pacific | 0 | 0.0% |
| Hispanic or Latino | 20 | 2.4% |
| Native / Alaskan | 819 | 96.5% |
| White / Caucasian | 0 | 0.0% |
| Two or more Races | 20 | 2.4% |
| Some other Race | 0 | 0.0% |
| Total | 849 | 100.0% |
Ancestry in Chilchinbito
The most populous ancestries reported in Chilchinbito are Navajo (819 | 96.5%), Mexican (20 | 2.4%), and Korean (10 | 1.2%), together accounting for 100.0% of all Chilchinbito residents.
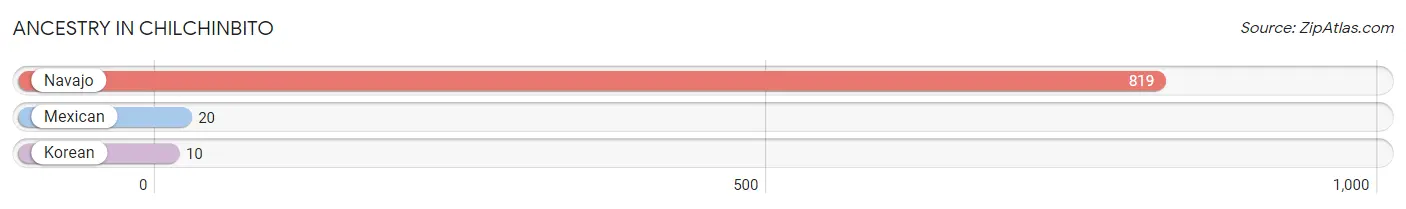
| Ancestry | # Population | % Population |
| Korean | 10 | 1.2% |
| Mexican | 20 | 2.4% |
| Navajo | 819 | 96.5% | View All 3 Rows |
Immigrants in Chilchinbito
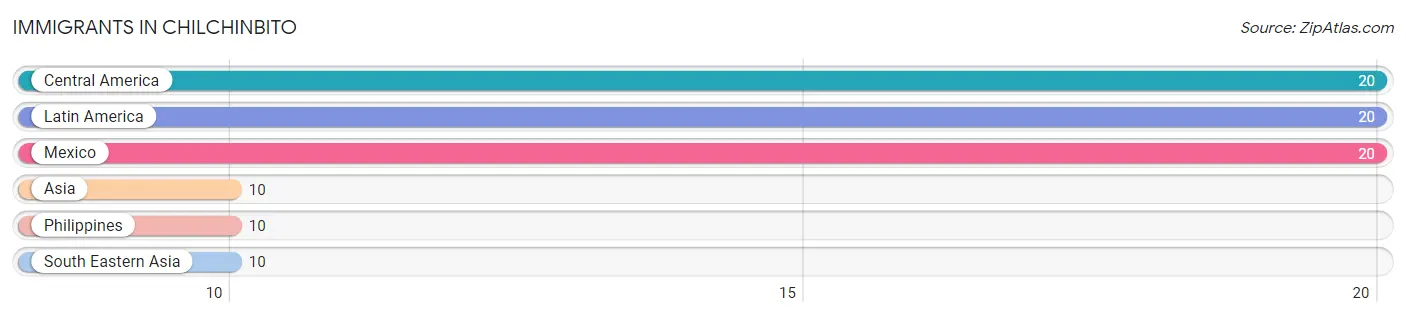
The most numerous immigrant groups reported in Chilchinbito came from Central America (20 | 2.4%), Latin America (20 | 2.4%), Mexico (20 | 2.4%), Asia (10 | 1.2%), and Philippines (10 | 1.2%), together accounting for 9.4% of all Chilchinbito residents.
| Immigration Origin | # Population | % Population |
| Asia | 10 | 1.2% |
| Central America | 20 | 2.4% |
| Latin America | 20 | 2.4% |
| Mexico | 20 | 2.4% |
| Philippines | 10 | 1.2% |
| South Eastern Asia | 10 | 1.2% | View All 6 Rows |
Sex and Age in Chilchinbito
Sex and Age in Chilchinbito
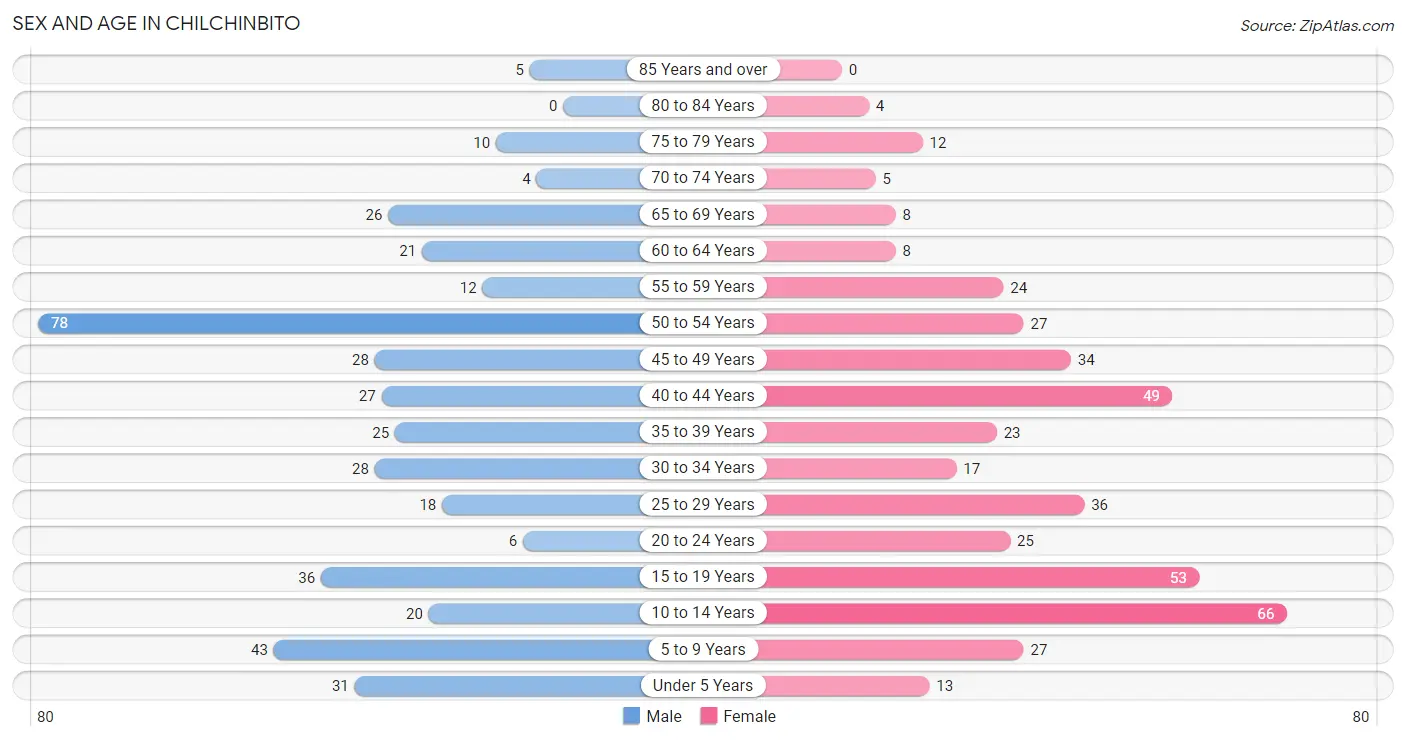
The most populous age groups in Chilchinbito are 50 to 54 Years (78 | 18.7%) for men and 10 to 14 Years (66 | 15.3%) for women.
| Age Bracket | Male | Female |
| Under 5 Years | 31 (7.4%) | 13 (3.0%) |
| 5 to 9 Years | 43 (10.3%) | 27 (6.3%) |
| 10 to 14 Years | 20 (4.8%) | 66 (15.3%) |
| 15 to 19 Years | 36 (8.6%) | 53 (12.3%) |
| 20 to 24 Years | 6 (1.4%) | 25 (5.8%) |
| 25 to 29 Years | 18 (4.3%) | 36 (8.4%) |
| 30 to 34 Years | 28 (6.7%) | 17 (3.9%) |
| 35 to 39 Years | 25 (6.0%) | 23 (5.3%) |
| 40 to 44 Years | 27 (6.5%) | 49 (11.4%) |
| 45 to 49 Years | 28 (6.7%) | 34 (7.9%) |
| 50 to 54 Years | 78 (18.7%) | 27 (6.3%) |
| 55 to 59 Years | 12 (2.9%) | 24 (5.6%) |
| 60 to 64 Years | 21 (5.0%) | 8 (1.9%) |
| 65 to 69 Years | 26 (6.2%) | 8 (1.9%) |
| 70 to 74 Years | 4 (1.0%) | 5 (1.2%) |
| 75 to 79 Years | 10 (2.4%) | 12 (2.8%) |
| 80 to 84 Years | 0 (0.0%) | 4 (0.9%) |
| 85 Years and over | 5 (1.2%) | 0 (0.0%) |
| Total | 418 (100.0%) | 431 (100.0%) |
Families and Households in Chilchinbito
Median Family Size in Chilchinbito
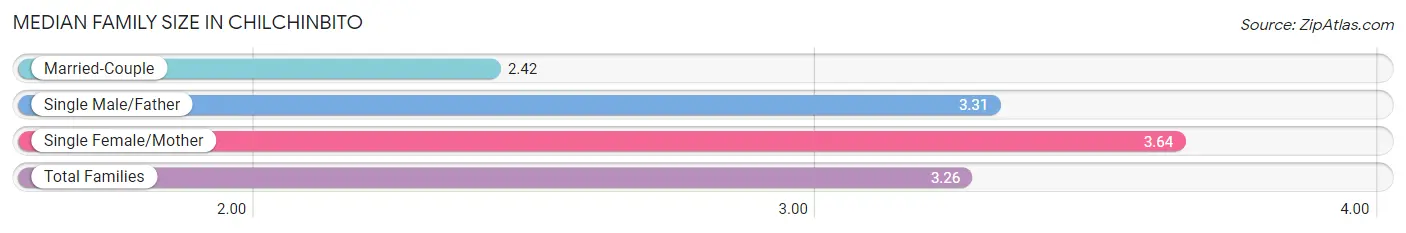
The median family size in Chilchinbito is 3.26 persons per family, with single female/mother families (100 | 55.6%) accounting for the largest median family size of 3.64 persons per family. On the other hand, married-couple families (48 | 26.7%) represent the smallest median family size with 2.42 persons per family.
| Family Type | # Families | Family Size |
| Married-Couple | 48 (26.7%) | 2.42 |
| Single Male/Father | 32 (17.8%) | 3.31 |
| Single Female/Mother | 100 (55.6%) | 3.64 |
| Total Families | 180 (100.0%) | 3.26 |
Median Household Size in Chilchinbito
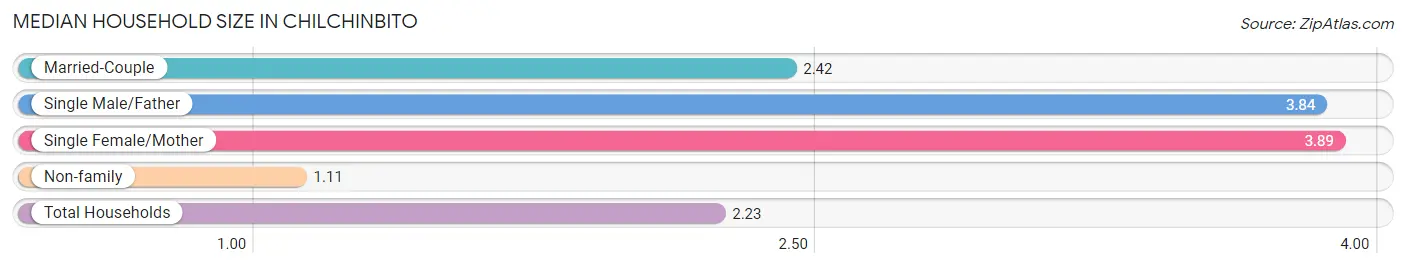
The median household size in Chilchinbito is 2.23 persons per household, with single female/mother households (100 | 26.3%) accounting for the largest median household size of 3.89 persons per household. non-family households (200 | 52.6%) represent the smallest median household size with 1.11 persons per household.
| Household Type | # Households | Household Size |
| Married-Couple | 48 (12.6%) | 2.42 |
| Single Male/Father | 32 (8.4%) | 3.84 |
| Single Female/Mother | 100 (26.3%) | 3.89 |
| Non-family | 200 (52.6%) | 1.11 |
| Total Households | 380 (100.0%) | 2.23 |
Household Size by Marriage Status in Chilchinbito
Out of a total of 380 households in Chilchinbito, 180 (47.4%) are family households, while 200 (52.6%) are nonfamily households. The most numerous type of family households are 4-person households, comprising 61, and the most common type of nonfamily households are 1-person households, comprising 187.
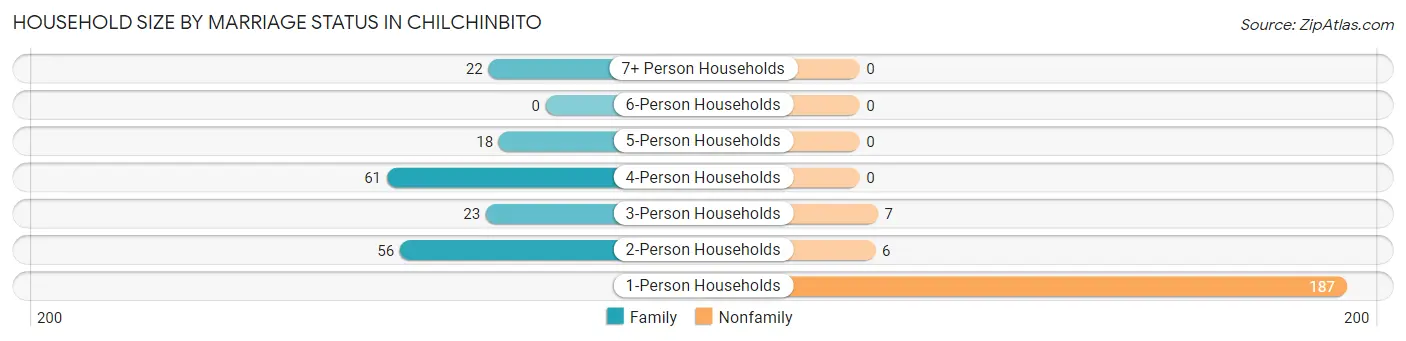
| Household Size | Family Households | Nonfamily Households |
| 1-Person Households | - | 187 (49.2%) |
| 2-Person Households | 56 (14.7%) | 6 (1.6%) |
| 3-Person Households | 23 (6.0%) | 7 (1.8%) |
| 4-Person Households | 61 (16.1%) | 0 (0.0%) |
| 5-Person Households | 18 (4.7%) | 0 (0.0%) |
| 6-Person Households | 0 (0.0%) | 0 (0.0%) |
| 7+ Person Households | 22 (5.8%) | 0 (0.0%) |
| Total | 180 (47.4%) | 200 (52.6%) |
Female Fertility in Chilchinbito
Fertility by Age in Chilchinbito
Average fertility rate in Chilchinbito is 25.0 births per 1,000 women. Women in the age bracket of 20 to 34 years have the highest fertility rate with 77.0 births per 1,000 women. Women in the age bracket of 20 to 34 years acount for 100.0% of all women with births.
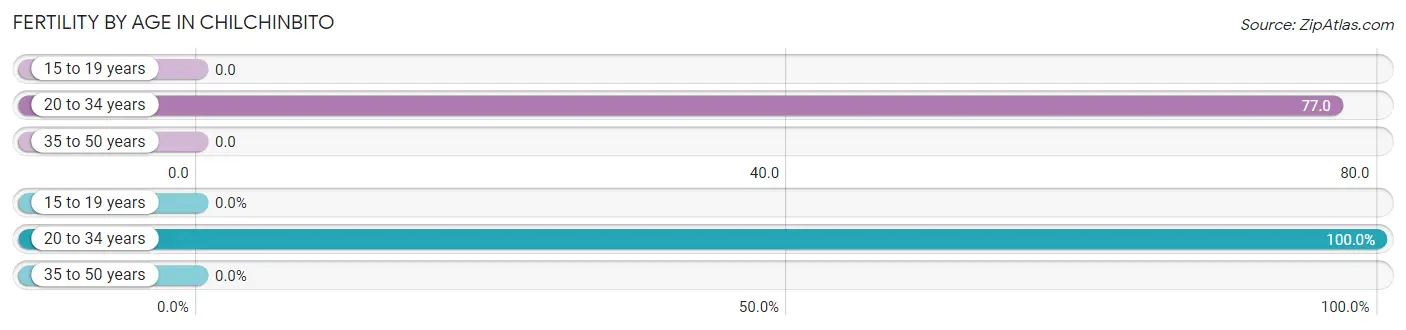
| Age Bracket | Women with Births | Births / 1,000 Women |
| 15 to 19 years | 0 (0.0%) | 0.0 |
| 20 to 34 years | 6 (100.0%) | 77.0 |
| 35 to 50 years | 0 (0.0%) | 0.0 |
| Total | 6 (100.0%) | 25.0 |
Fertility by Age by Marriage Status in Chilchinbito
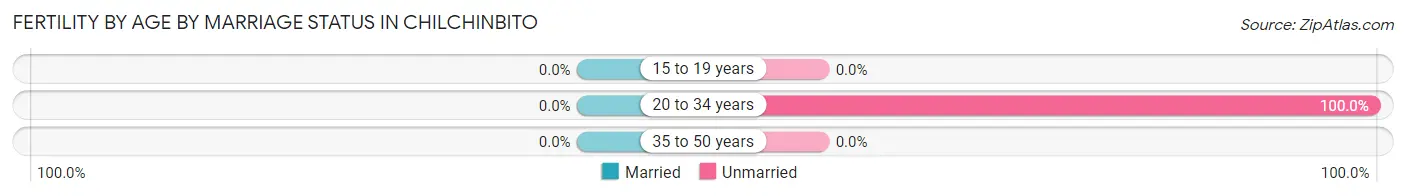
| Age Bracket | Married | Unmarried |
| 15 to 19 years | 0 (0.0%) | 0 (0.0%) |
| 20 to 34 years | 0 (0.0%) | 6 (100.0%) |
| 35 to 50 years | 0 (0.0%) | 0 (0.0%) |
| Total | 0 (0.0%) | 6 (100.0%) |
Fertility by Education in Chilchinbito
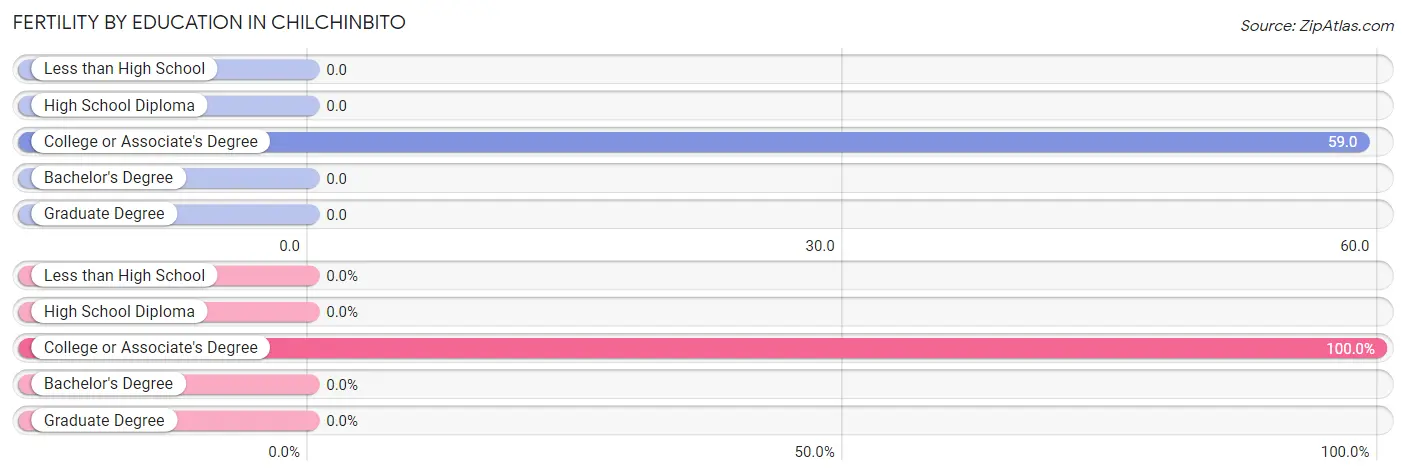
| Educational Attainment | Women with Births | Births / 1,000 Women |
| Less than High School | 0 (0.0%) | 0.0 |
| High School Diploma | 0 (0.0%) | 0.0 |
| College or Associate's Degree | 6 (100.0%) | 59.0 |
| Bachelor's Degree | 0 (0.0%) | 0.0 |
| Graduate Degree | 0 (0.0%) | 0.0 |
| Total | 6 (100.0%) | 25.0 |
Fertility by Education by Marriage Status in Chilchinbito
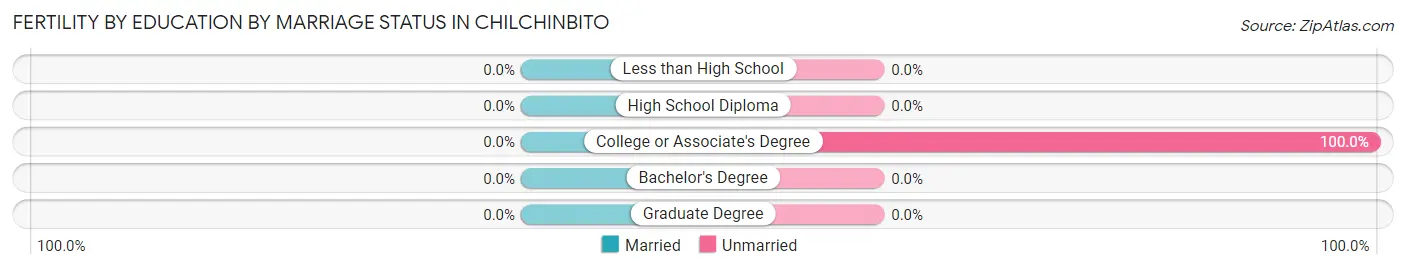
| Educational Attainment | Married | Unmarried |
| Less than High School | 0 (0.0%) | 0 (0.0%) |
| High School Diploma | 0 (0.0%) | 0 (0.0%) |
| College or Associate's Degree | 0 (0.0%) | 6 (100.0%) |
| Bachelor's Degree | 0 (0.0%) | 0 (0.0%) |
| Graduate Degree | 0 (0.0%) | 0 (0.0%) |
| Total | 0 (0.0%) | 6 (100.0%) |
Employment Characteristics in Chilchinbito
Employment by Class of Employer in Chilchinbito
Among the 175 employed individuals in Chilchinbito, private company employees (64 | 36.6%), self-employed (not incorporated) (50 | 28.6%), and state government employees (19 | 10.9%) make up the most common classes of employment.
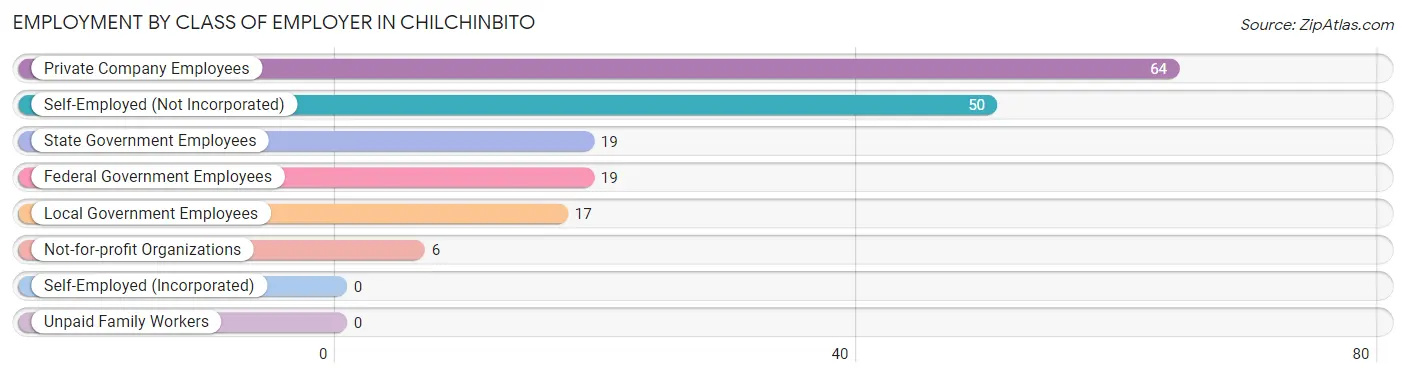
| Employer Class | # Employees | % Employees |
| Private Company Employees | 64 | 36.6% |
| Self-Employed (Incorporated) | 0 | 0.0% |
| Self-Employed (Not Incorporated) | 50 | 28.6% |
| Not-for-profit Organizations | 6 | 3.4% |
| Local Government Employees | 17 | 9.7% |
| State Government Employees | 19 | 10.9% |
| Federal Government Employees | 19 | 10.9% |
| Unpaid Family Workers | 0 | 0.0% |
| Total | 175 | 100.0% |
Employment Status by Age in Chilchinbito
According to the labor force statistics for Chilchinbito, out of the total population over 16 years of age (638), 36.1% or 230 individuals are in the labor force, with 23.9% or 55 of them unemployed. The age group with the highest labor force participation rate is 30 to 34 years, with 53.3% or 24 individuals in the labor force. Within the labor force, the 16 to 19 years age range has the highest percentage of unemployed individuals, with 100.0% or 14 of them being unemployed.
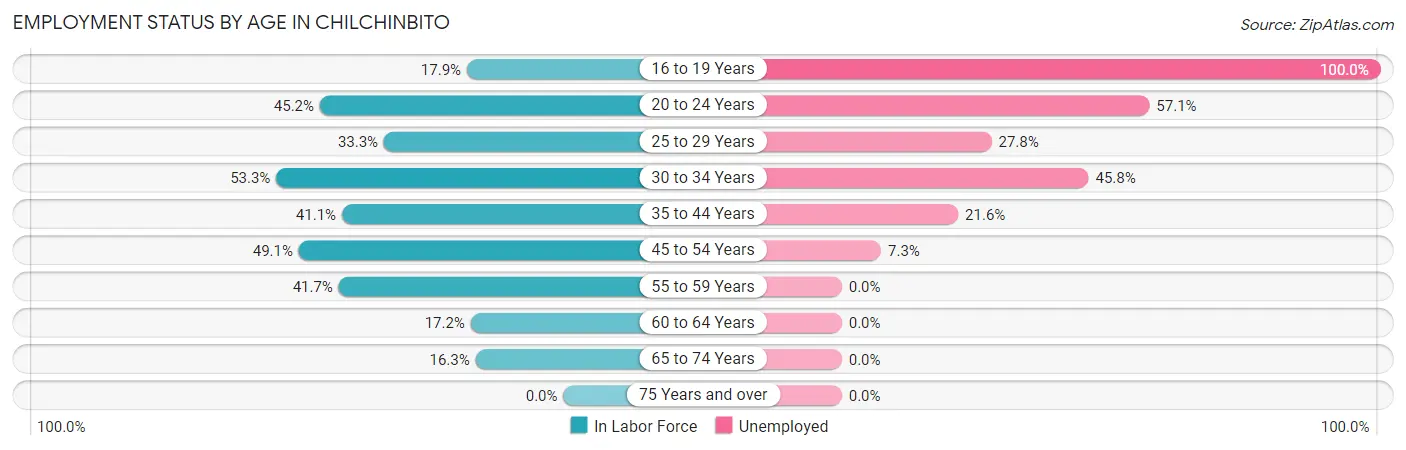
| Age Bracket | In Labor Force | Unemployed |
| 16 to 19 Years | 14 (17.9%) | 14 (100.0%) |
| 20 to 24 Years | 14 (45.2%) | 8 (57.1%) |
| 25 to 29 Years | 18 (33.3%) | 5 (27.8%) |
| 30 to 34 Years | 24 (53.3%) | 11 (45.8%) |
| 35 to 44 Years | 51 (41.1%) | 11 (21.6%) |
| 45 to 54 Years | 82 (49.1%) | 6 (7.3%) |
| 55 to 59 Years | 15 (41.7%) | 0 (0.0%) |
| 60 to 64 Years | 5 (17.2%) | 0 (0.0%) |
| 65 to 74 Years | 7 (16.3%) | 0 (0.0%) |
| 75 Years and over | 0 (0.0%) | 0 (0.0%) |
| Total | 230 (36.1%) | 55 (23.9%) |
Employment Status by Educational Attainment in Chilchinbito
According to labor force statistics for Chilchinbito, 42.9% of individuals (195) out of the total population between 25 and 64 years of age (455) are in the labor force, with 16.9% or 33 of them being unemployed. The group with the highest labor force participation rate are those with the educational attainment of bachelor's degree or higher, with 89.2% or 66 individuals in the labor force. Within the labor force, individuals with high school diploma education have the highest percentage of unemployment, with 29.6% or 16 of them being unemployed.
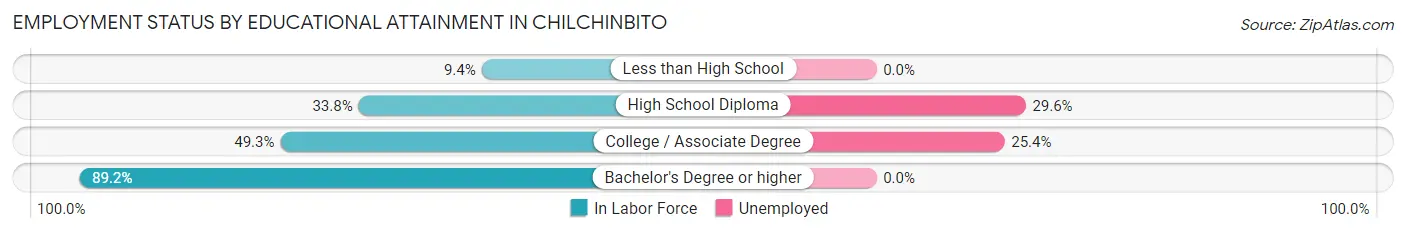
| Educational Attainment | In Labor Force | Unemployed |
| Less than High School | 8 (9.4%) | 0 (0.0%) |
| High School Diploma | 54 (33.8%) | 47 (29.6%) |
| College / Associate Degree | 67 (49.3%) | 35 (25.4%) |
| Bachelor's Degree or higher | 66 (89.2%) | 0 (0.0%) |
| Total | 195 (42.9%) | 77 (16.9%) |
Employment Occupations by Sex in Chilchinbito
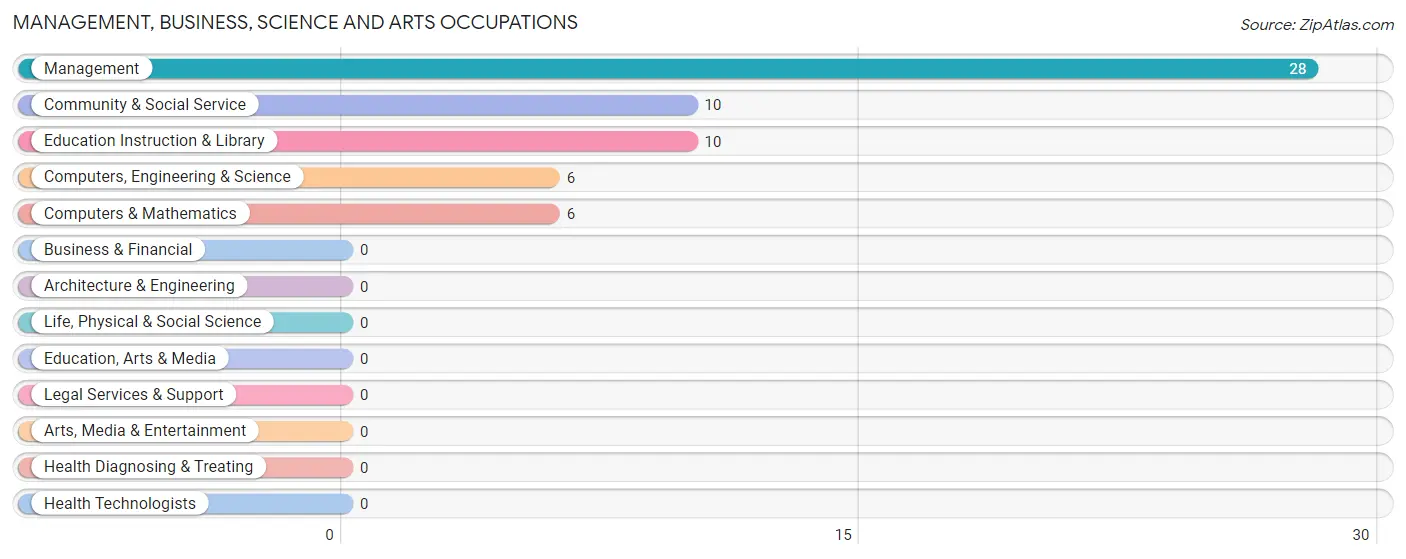
Management, Business, Science and Arts Occupations
The most common Management, Business, Science and Arts occupations in Chilchinbito are Management (28 | 16.0%), Community & Social Service (10 | 5.7%), Education Instruction & Library (10 | 5.7%), Computers, Engineering & Science (6 | 3.4%), and Computers & Mathematics (6 | 3.4%).
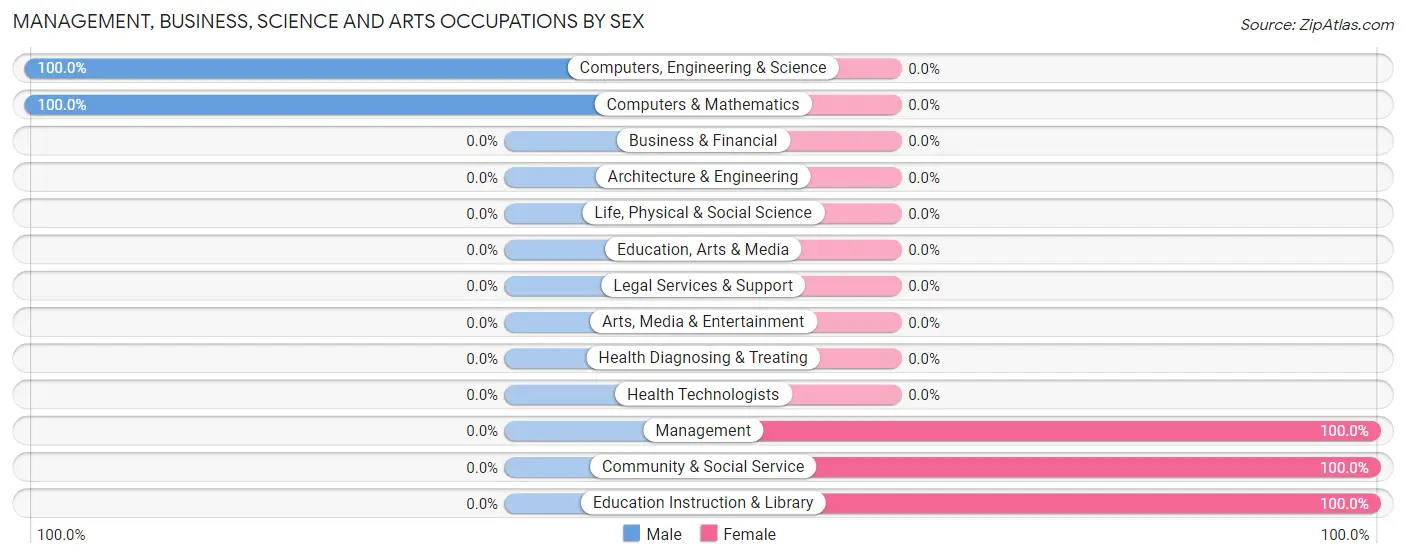
Management, Business, Science and Arts Occupations by Sex
Within the Management, Business, Science and Arts occupations in Chilchinbito, the most male-oriented occupations are Computers, Engineering & Science (100.0%), and Computers & Mathematics (100.0%), while the most female-oriented occupations are Management (100.0%), Community & Social Service (100.0%), and Education Instruction & Library (100.0%).
| Occupation | Male | Female |
| Management | 0 (0.0%) | 28 (100.0%) |
| Business & Financial | 0 (0.0%) | 0 (0.0%) |
| Computers, Engineering & Science | 6 (100.0%) | 0 (0.0%) |
| Computers & Mathematics | 6 (100.0%) | 0 (0.0%) |
| Architecture & Engineering | 0 (0.0%) | 0 (0.0%) |
| Life, Physical & Social Science | 0 (0.0%) | 0 (0.0%) |
| Community & Social Service | 0 (0.0%) | 10 (100.0%) |
| Education, Arts & Media | 0 (0.0%) | 0 (0.0%) |
| Legal Services & Support | 0 (0.0%) | 0 (0.0%) |
| Education Instruction & Library | 0 (0.0%) | 10 (100.0%) |
| Arts, Media & Entertainment | 0 (0.0%) | 0 (0.0%) |
| Health Diagnosing & Treating | 0 (0.0%) | 0 (0.0%) |
| Health Technologists | 0 (0.0%) | 0 (0.0%) |
| Total (Category) | 6 (13.6%) | 38 (86.4%) |
| Total (Overall) | 85 (48.6%) | 90 (51.4%) |
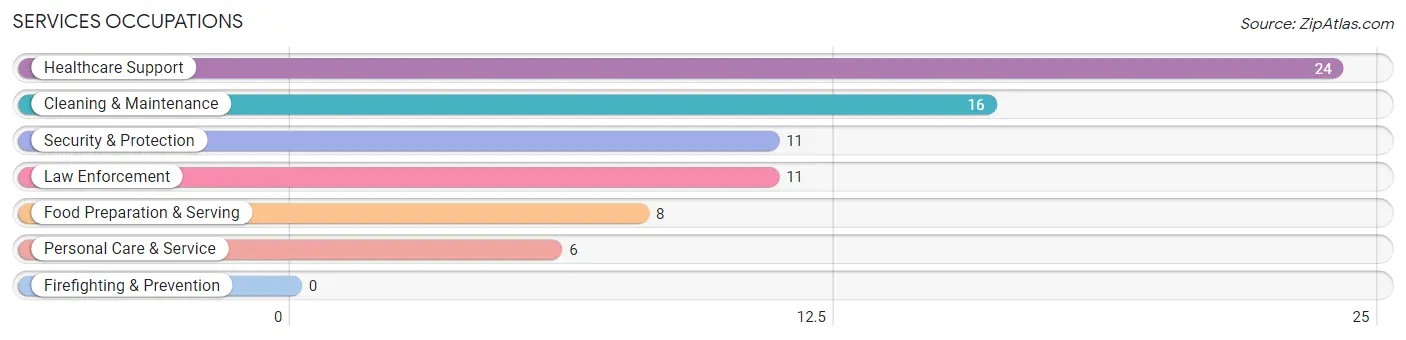
Services Occupations
The most common Services occupations in Chilchinbito are Healthcare Support (24 | 13.7%), Cleaning & Maintenance (16 | 9.1%), Security & Protection (11 | 6.3%), Law Enforcement (11 | 6.3%), and Food Preparation & Serving (8 | 4.6%).
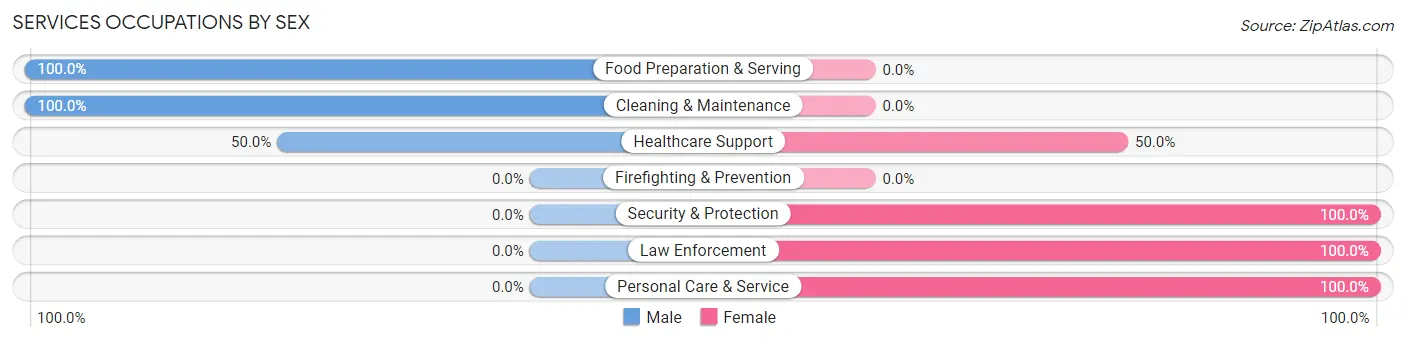
Services Occupations by Sex
Within the Services occupations in Chilchinbito, the most male-oriented occupations are Food Preparation & Serving (100.0%), Cleaning & Maintenance (100.0%), and Healthcare Support (50.0%), while the most female-oriented occupations are Security & Protection (100.0%), Law Enforcement (100.0%), and Personal Care & Service (100.0%).
| Occupation | Male | Female |
| Healthcare Support | 12 (50.0%) | 12 (50.0%) |
| Security & Protection | 0 (0.0%) | 11 (100.0%) |
| Firefighting & Prevention | 0 (0.0%) | 0 (0.0%) |
| Law Enforcement | 0 (0.0%) | 11 (100.0%) |
| Food Preparation & Serving | 8 (100.0%) | 0 (0.0%) |
| Cleaning & Maintenance | 16 (100.0%) | 0 (0.0%) |
| Personal Care & Service | 0 (0.0%) | 6 (100.0%) |
| Total (Category) | 36 (55.4%) | 29 (44.6%) |
| Total (Overall) | 85 (48.6%) | 90 (51.4%) |
Sales and Office Occupations
The most common Sales and Office occupations in Chilchinbito are Sales & Related (12 | 6.9%), and Office & Administration (12 | 6.9%).
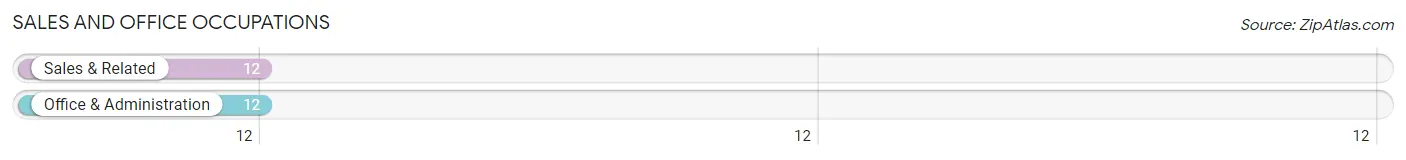
Sales and Office Occupations by Sex
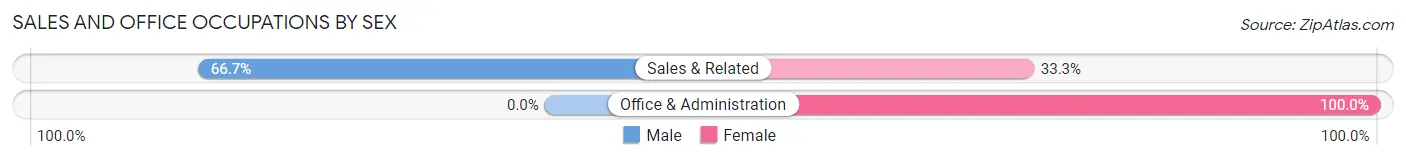
| Occupation | Male | Female |
| Sales & Related | 8 (66.7%) | 4 (33.3%) |
| Office & Administration | 0 (0.0%) | 12 (100.0%) |
| Total (Category) | 8 (33.3%) | 16 (66.7%) |
| Total (Overall) | 85 (48.6%) | 90 (51.4%) |
Natural Resources, Construction and Maintenance Occupations
The most common Natural Resources, Construction and Maintenance occupations in Chilchinbito are Construction & Extraction (24 | 13.7%), and Installation, Maintenance & Repair (7 | 4.0%).
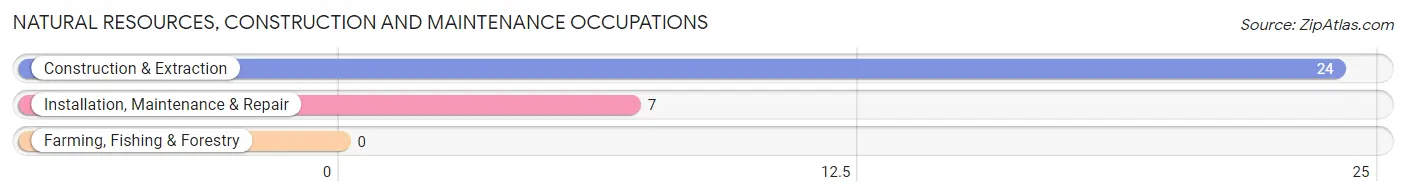
Natural Resources, Construction and Maintenance Occupations by Sex
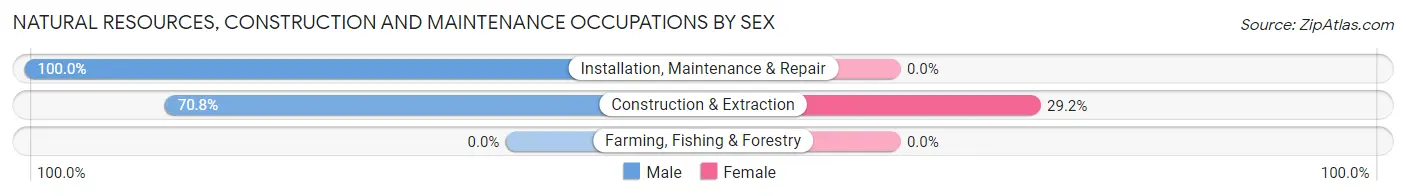
| Occupation | Male | Female |
| Farming, Fishing & Forestry | 0 (0.0%) | 0 (0.0%) |
| Construction & Extraction | 17 (70.8%) | 7 (29.2%) |
| Installation, Maintenance & Repair | 7 (100.0%) | 0 (0.0%) |
| Total (Category) | 24 (77.4%) | 7 (22.6%) |
| Total (Overall) | 85 (48.6%) | 90 (51.4%) |
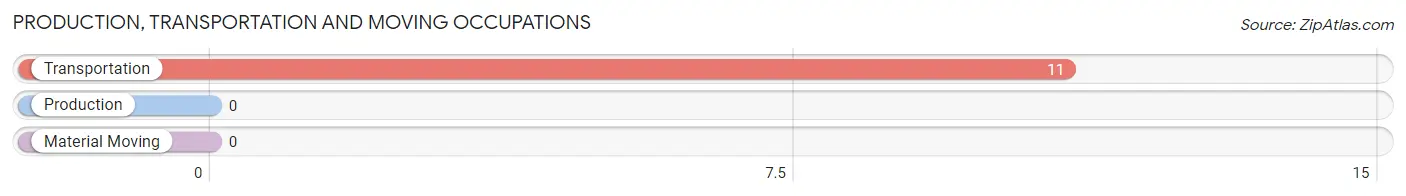
Production, Transportation and Moving Occupations
The most common Production, Transportation and Moving occupations in Chilchinbito are , and Transportation (11 | 6.3%).
Production, Transportation and Moving Occupations by Sex
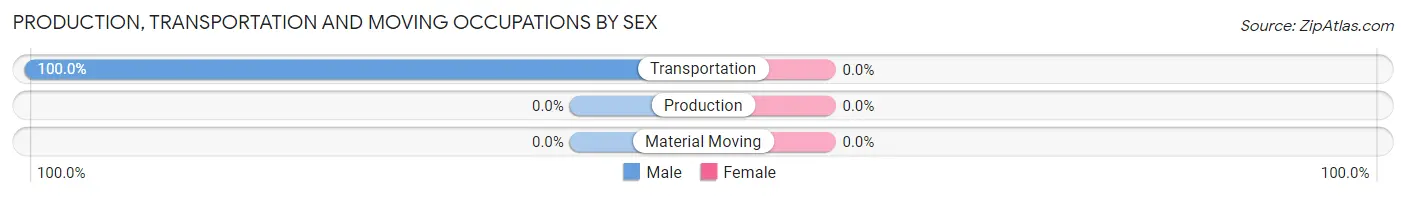
| Occupation | Male | Female |
| Production | 0 (0.0%) | 0 (0.0%) |
| Transportation | 11 (100.0%) | 0 (0.0%) |
| Material Moving | 0 (0.0%) | 0 (0.0%) |
| Total (Category) | 11 (100.0%) | 0 (0.0%) |
| Total (Overall) | 85 (48.6%) | 90 (51.4%) |
Employment Industries by Sex in Chilchinbito
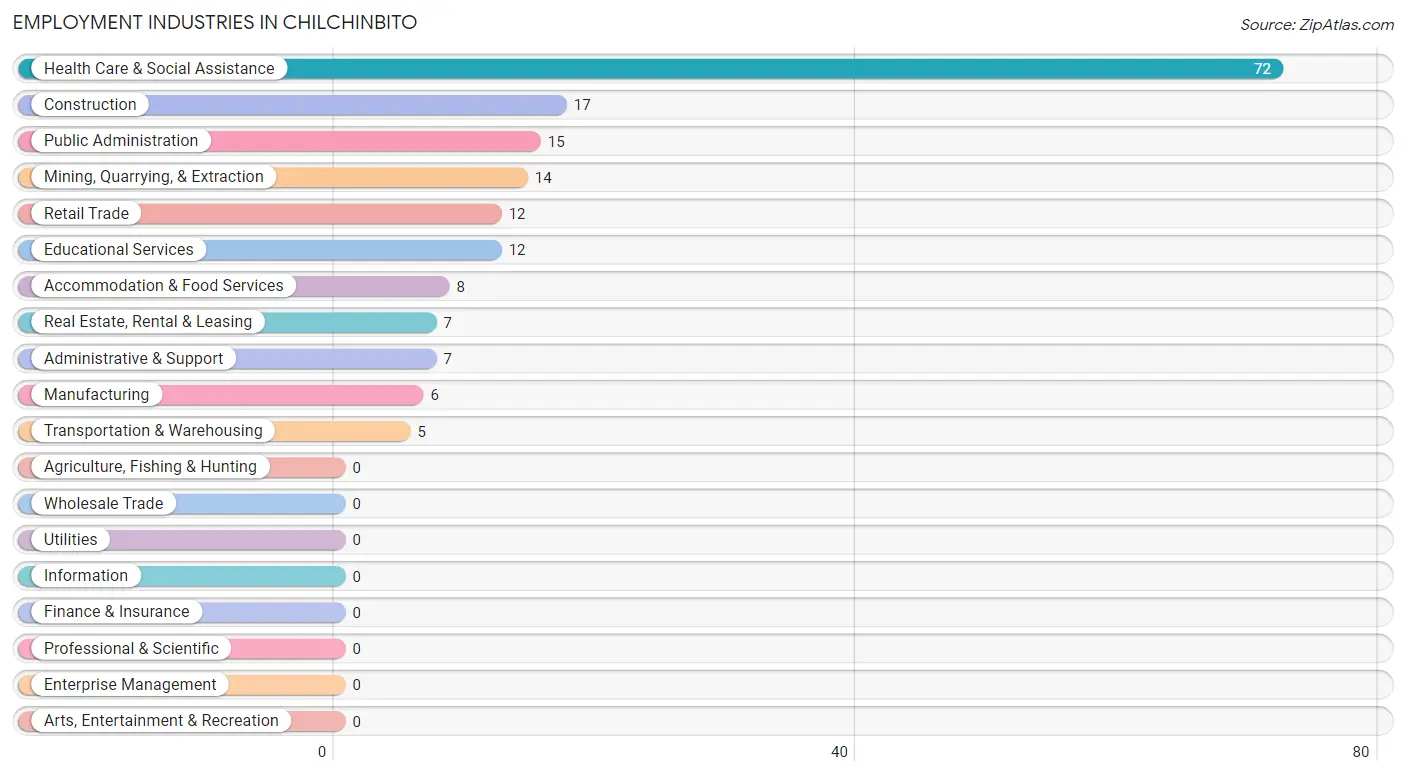
Employment Industries in Chilchinbito
The major employment industries in Chilchinbito include Health Care & Social Assistance (72 | 41.1%), Construction (17 | 9.7%), Public Administration (15 | 8.6%), Mining, Quarrying, & Extraction (14 | 8.0%), and Retail Trade (12 | 6.9%).
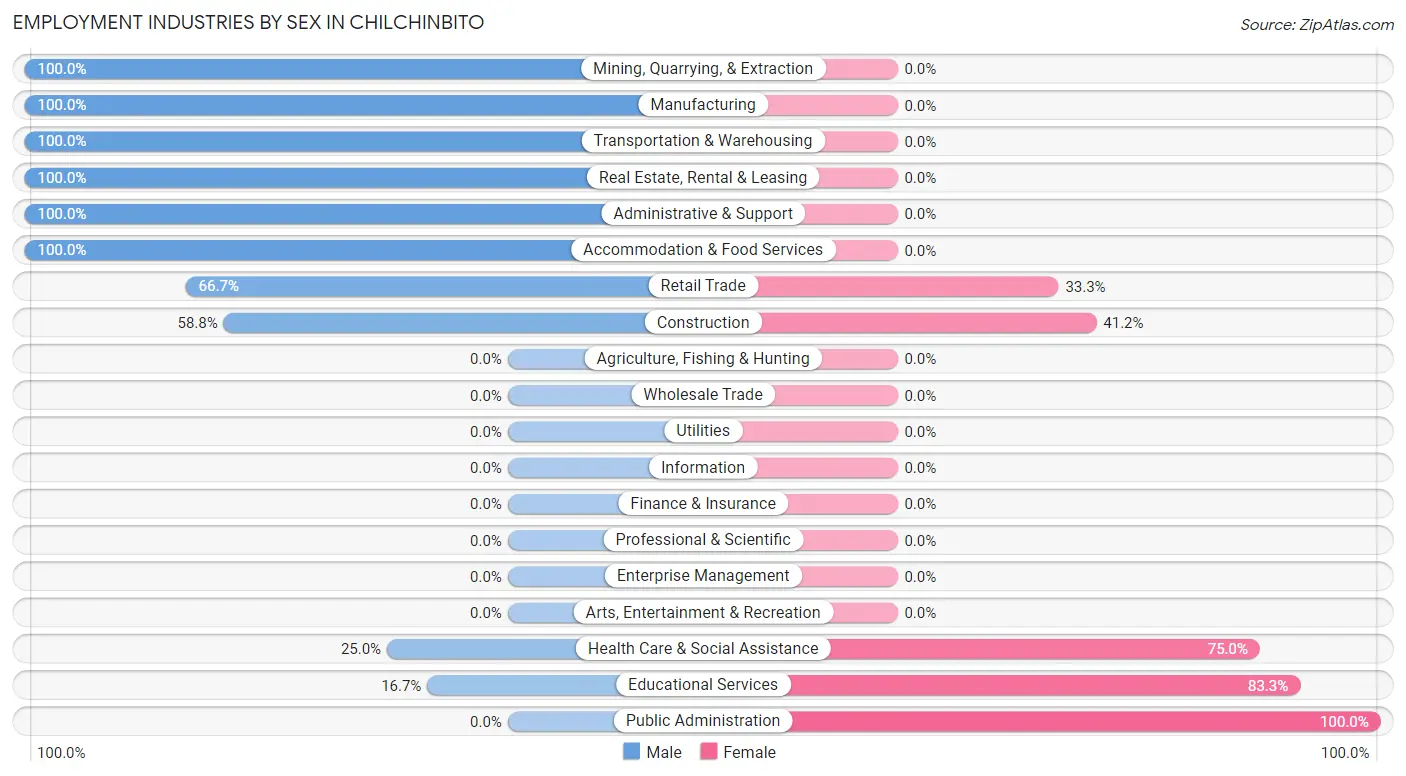
Employment Industries by Sex in Chilchinbito
The Chilchinbito industries that see more men than women are Mining, Quarrying, & Extraction (100.0%), Manufacturing (100.0%), and Transportation & Warehousing (100.0%), whereas the industries that tend to have a higher number of women are Public Administration (100.0%), Educational Services (83.3%), and Health Care & Social Assistance (75.0%).
| Industry | Male | Female |
| Agriculture, Fishing & Hunting | 0 (0.0%) | 0 (0.0%) |
| Mining, Quarrying, & Extraction | 14 (100.0%) | 0 (0.0%) |
| Construction | 10 (58.8%) | 7 (41.2%) |
| Manufacturing | 6 (100.0%) | 0 (0.0%) |
| Wholesale Trade | 0 (0.0%) | 0 (0.0%) |
| Retail Trade | 8 (66.7%) | 4 (33.3%) |
| Transportation & Warehousing | 5 (100.0%) | 0 (0.0%) |
| Utilities | 0 (0.0%) | 0 (0.0%) |
| Information | 0 (0.0%) | 0 (0.0%) |
| Finance & Insurance | 0 (0.0%) | 0 (0.0%) |
| Real Estate, Rental & Leasing | 7 (100.0%) | 0 (0.0%) |
| Professional & Scientific | 0 (0.0%) | 0 (0.0%) |
| Enterprise Management | 0 (0.0%) | 0 (0.0%) |
| Administrative & Support | 7 (100.0%) | 0 (0.0%) |
| Educational Services | 2 (16.7%) | 10 (83.3%) |
| Health Care & Social Assistance | 18 (25.0%) | 54 (75.0%) |
| Arts, Entertainment & Recreation | 0 (0.0%) | 0 (0.0%) |
| Accommodation & Food Services | 8 (100.0%) | 0 (0.0%) |
| Public Administration | 0 (0.0%) | 15 (100.0%) |
| Total | 85 (48.6%) | 90 (51.4%) |
Education in Chilchinbito
School Enrollment in Chilchinbito
The most common levels of schooling among the 239 students in Chilchinbito are high school (72 | 30.1%), middle school (66 | 27.6%), and elementary school (58 | 24.3%).
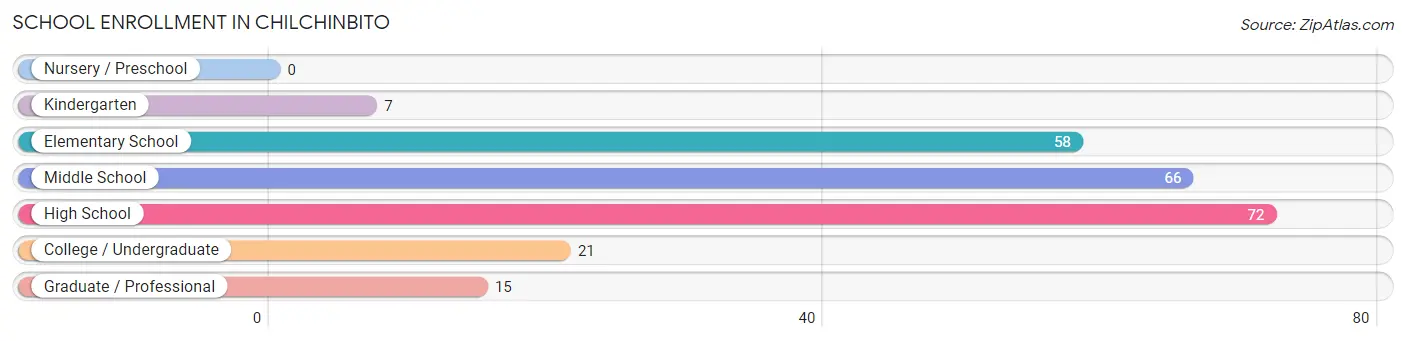
| School Level | # Students | % Students |
| Nursery / Preschool | 0 | 0.0% |
| Kindergarten | 7 | 2.9% |
| Elementary School | 58 | 24.3% |
| Middle School | 66 | 27.6% |
| High School | 72 | 30.1% |
| College / Undergraduate | 21 | 8.8% |
| Graduate / Professional | 15 | 6.3% |
| Total | 239 | 100.0% |
School Enrollment by Age by Funding Source in Chilchinbito
Out of a total of 239 students who are enrolled in schools in Chilchinbito, 4 (1.7%) attend a private institution, while the remaining 235 (98.3%) are enrolled in public schools. The age group of 20 to 24 year olds has the highest likelihood of being enrolled in private schools, with 4 (40.0% in the age bracket) enrolled. Conversely, the age group of 5 to 9 year old has the lowest likelihood of being enrolled in a private school, with 54 (100.0% in the age bracket) attending a public institution.
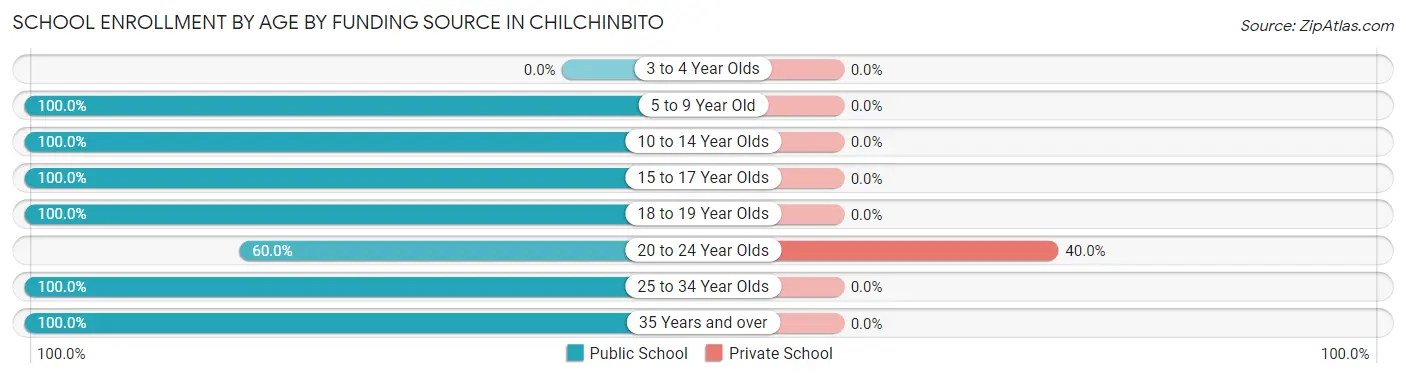
| Age Bracket | Public School | Private School |
| 3 to 4 Year Olds | 0 (0.0%) | 0 (0.0%) |
| 5 to 9 Year Old | 54 (100.0%) | 0 (0.0%) |
| 10 to 14 Year Olds | 86 (100.0%) | 0 (0.0%) |
| 15 to 17 Year Olds | 41 (100.0%) | 0 (0.0%) |
| 18 to 19 Year Olds | 22 (100.0%) | 0 (0.0%) |
| 20 to 24 Year Olds | 6 (60.0%) | 4 (40.0%) |
| 25 to 34 Year Olds | 18 (100.0%) | 0 (0.0%) |
| 35 Years and over | 8 (100.0%) | 0 (0.0%) |
| Total | 235 (98.3%) | 4 (1.7%) |
Educational Attainment by Field of Study in Chilchinbito
Science & technology (36 | 44.4%), education (16 | 19.8%), business (15 | 18.5%), engineering (7 | 8.6%), and communications (7 | 8.6%) are the most common fields of study among 81 individuals in Chilchinbito who have obtained a bachelor's degree or higher.
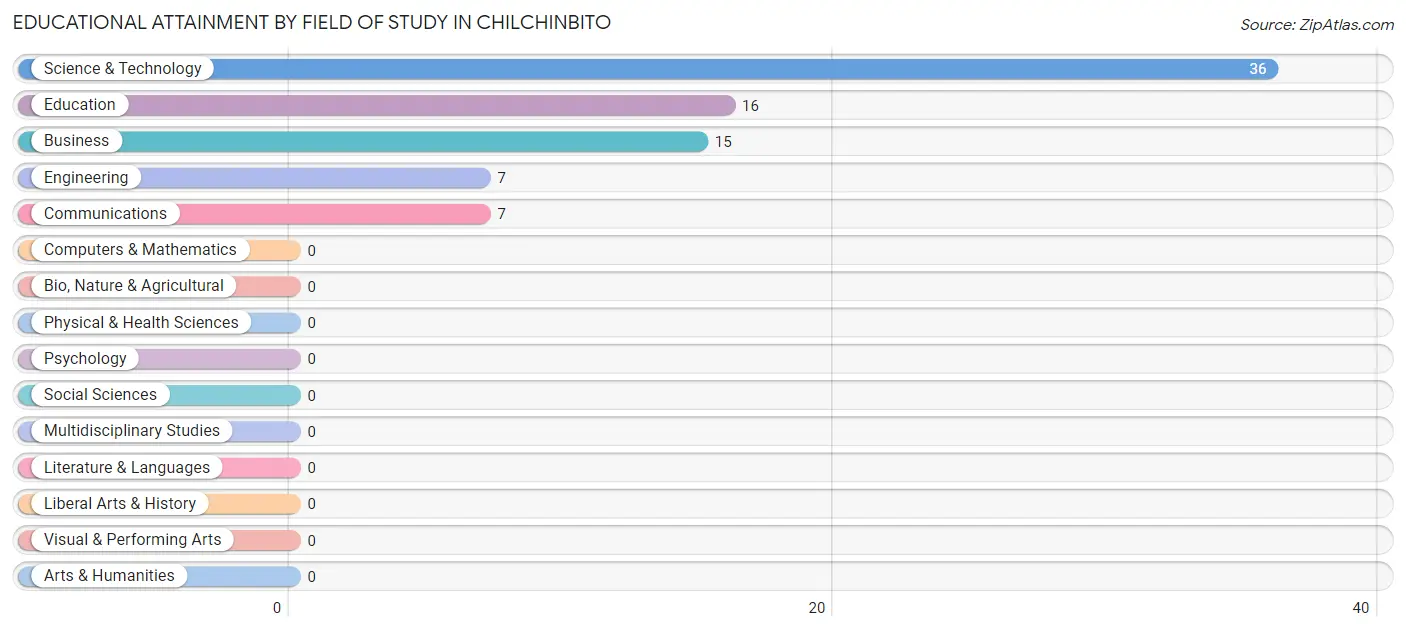
| Field of Study | # Graduates | % Graduates |
| Computers & Mathematics | 0 | 0.0% |
| Bio, Nature & Agricultural | 0 | 0.0% |
| Physical & Health Sciences | 0 | 0.0% |
| Psychology | 0 | 0.0% |
| Social Sciences | 0 | 0.0% |
| Engineering | 7 | 8.6% |
| Multidisciplinary Studies | 0 | 0.0% |
| Science & Technology | 36 | 44.4% |
| Business | 15 | 18.5% |
| Education | 16 | 19.8% |
| Literature & Languages | 0 | 0.0% |
| Liberal Arts & History | 0 | 0.0% |
| Visual & Performing Arts | 0 | 0.0% |
| Communications | 7 | 8.6% |
| Arts & Humanities | 0 | 0.0% |
| Total | 81 | 100.0% |
Transportation & Commute in Chilchinbito
Vehicle Availability by Sex in Chilchinbito
The most prevalent vehicle ownership categories in Chilchinbito are males with 1 vehicle (43, accounting for 50.6%) and females with 1 vehicle (37, making up 47.8%).
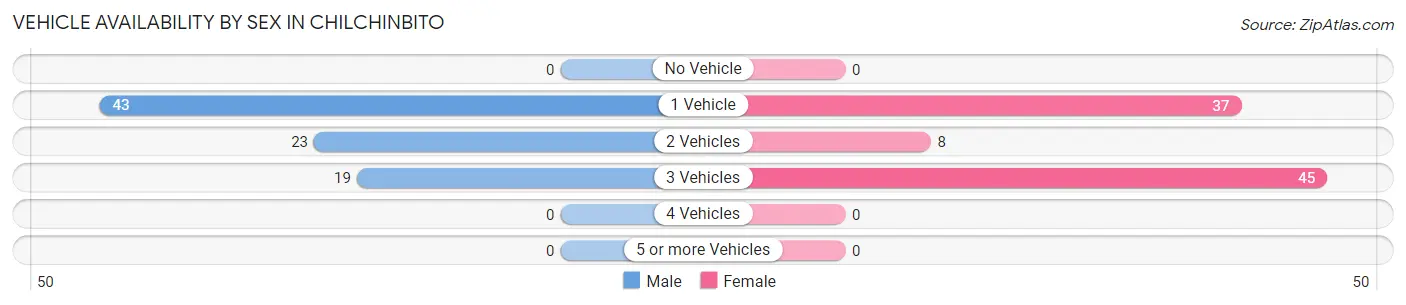
| Vehicles Available | Male | Female |
| No Vehicle | 0 (0.0%) | 0 (0.0%) |
| 1 Vehicle | 43 (50.6%) | 37 (41.1%) |
| 2 Vehicles | 23 (27.1%) | 8 (8.9%) |
| 3 Vehicles | 19 (22.4%) | 45 (50.0%) |
| 4 Vehicles | 0 (0.0%) | 0 (0.0%) |
| 5 or more Vehicles | 0 (0.0%) | 0 (0.0%) |
| Total | 85 (100.0%) | 90 (100.0%) |
Commute Time in Chilchinbito
The most frequently occuring commute durations in Chilchinbito are 30 to 34 minutes (37 commuters, 27.2%), 5 to 9 minutes (25 commuters, 18.4%), and 60 to 89 minutes (20 commuters, 14.7%).
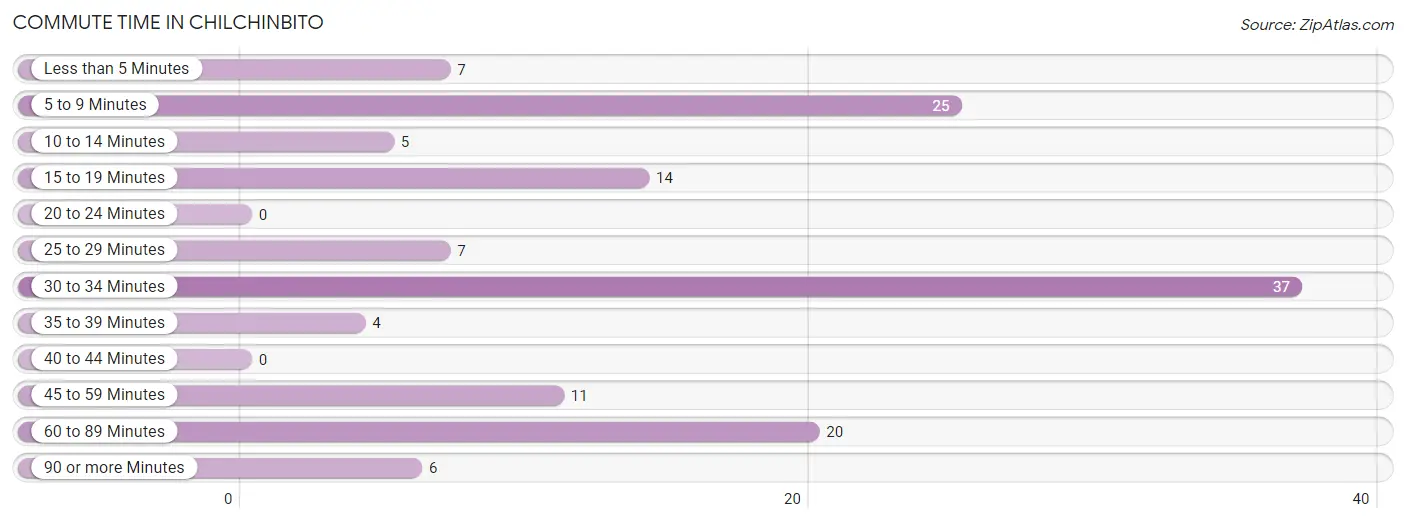
| Commute Time | # Commuters | % Commuters |
| Less than 5 Minutes | 7 | 5.1% |
| 5 to 9 Minutes | 25 | 18.4% |
| 10 to 14 Minutes | 5 | 3.7% |
| 15 to 19 Minutes | 14 | 10.3% |
| 20 to 24 Minutes | 0 | 0.0% |
| 25 to 29 Minutes | 7 | 5.1% |
| 30 to 34 Minutes | 37 | 27.2% |
| 35 to 39 Minutes | 4 | 2.9% |
| 40 to 44 Minutes | 0 | 0.0% |
| 45 to 59 Minutes | 11 | 8.1% |
| 60 to 89 Minutes | 20 | 14.7% |
| 90 or more Minutes | 6 | 4.4% |
Commute Time by Sex in Chilchinbito
The most common commute times in Chilchinbito are 5 to 9 minutes (21 commuters, 26.3%) for males and 30 to 34 minutes (24 commuters, 42.9%) for females.
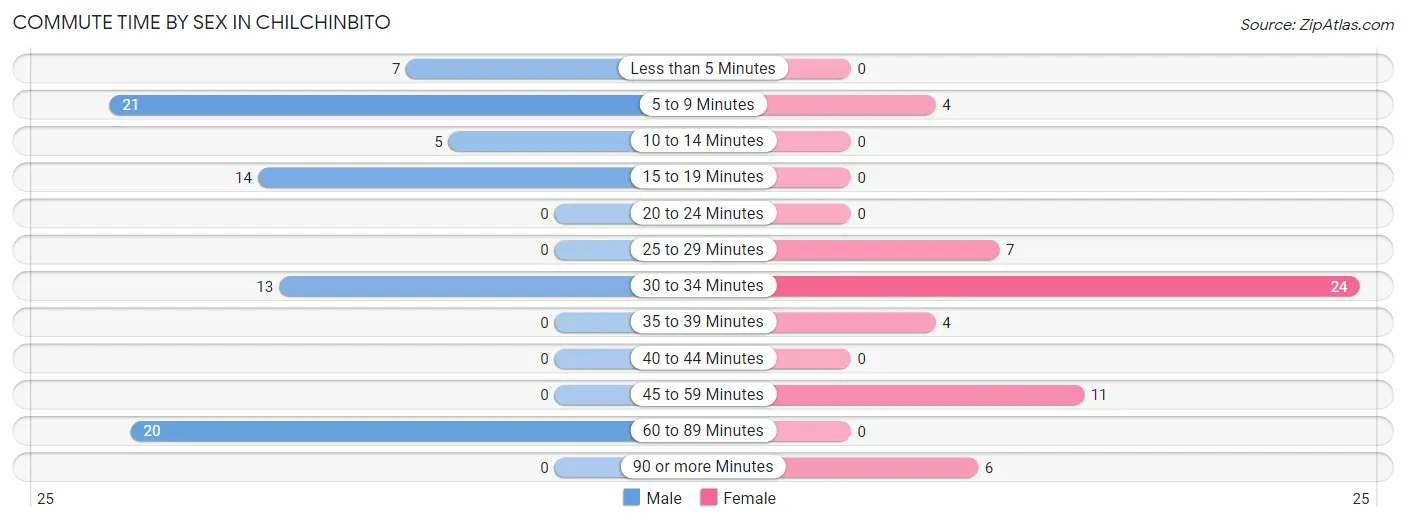
| Commute Time | Male | Female |
| Less than 5 Minutes | 7 (8.7%) | 0 (0.0%) |
| 5 to 9 Minutes | 21 (26.3%) | 4 (7.1%) |
| 10 to 14 Minutes | 5 (6.2%) | 0 (0.0%) |
| 15 to 19 Minutes | 14 (17.5%) | 0 (0.0%) |
| 20 to 24 Minutes | 0 (0.0%) | 0 (0.0%) |
| 25 to 29 Minutes | 0 (0.0%) | 7 (12.5%) |
| 30 to 34 Minutes | 13 (16.3%) | 24 (42.9%) |
| 35 to 39 Minutes | 0 (0.0%) | 4 (7.1%) |
| 40 to 44 Minutes | 0 (0.0%) | 0 (0.0%) |
| 45 to 59 Minutes | 0 (0.0%) | 11 (19.6%) |
| 60 to 89 Minutes | 20 (25.0%) | 0 (0.0%) |
| 90 or more Minutes | 0 (0.0%) | 6 (10.7%) |
Time of Departure to Work by Sex in Chilchinbito
The most frequent times of departure to work in Chilchinbito are 7:30 AM to 7:59 AM (28, 35.0%) for males and 7:00 AM to 7:29 AM (46, 82.1%) for females.
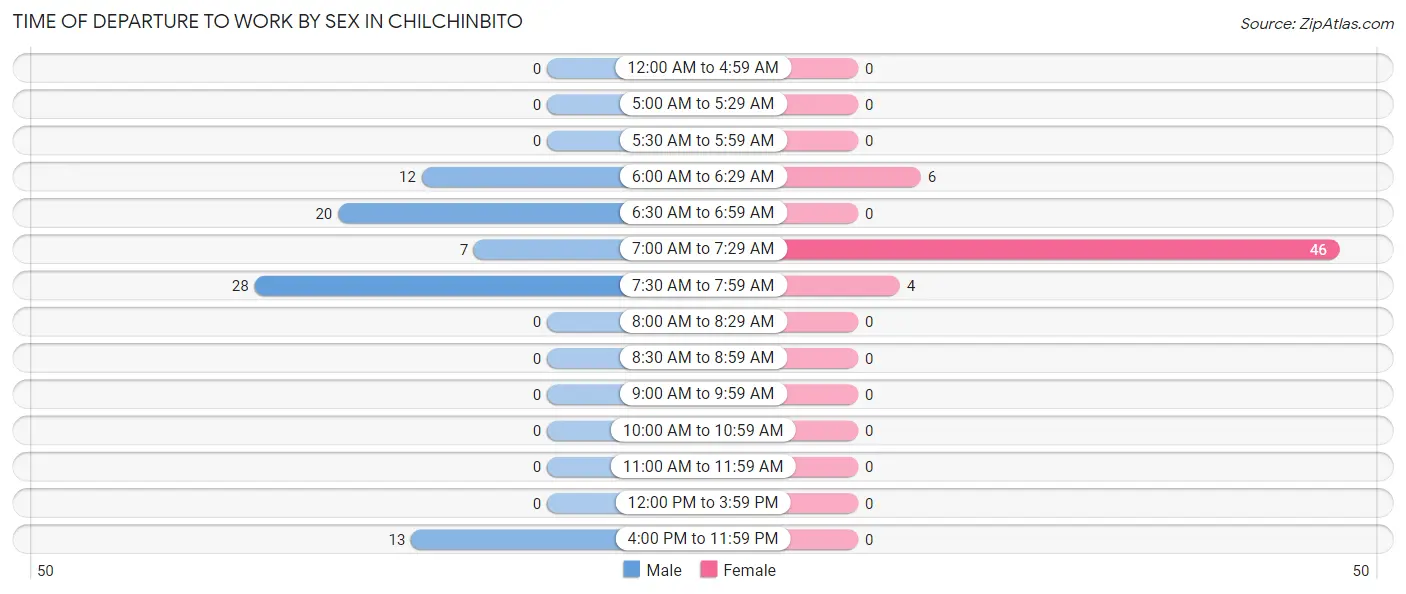
| Time of Departure | Male | Female |
| 12:00 AM to 4:59 AM | 0 (0.0%) | 0 (0.0%) |
| 5:00 AM to 5:29 AM | 0 (0.0%) | 0 (0.0%) |
| 5:30 AM to 5:59 AM | 0 (0.0%) | 0 (0.0%) |
| 6:00 AM to 6:29 AM | 12 (15.0%) | 6 (10.7%) |
| 6:30 AM to 6:59 AM | 20 (25.0%) | 0 (0.0%) |
| 7:00 AM to 7:29 AM | 7 (8.7%) | 46 (82.1%) |
| 7:30 AM to 7:59 AM | 28 (35.0%) | 4 (7.1%) |
| 8:00 AM to 8:29 AM | 0 (0.0%) | 0 (0.0%) |
| 8:30 AM to 8:59 AM | 0 (0.0%) | 0 (0.0%) |
| 9:00 AM to 9:59 AM | 0 (0.0%) | 0 (0.0%) |
| 10:00 AM to 10:59 AM | 0 (0.0%) | 0 (0.0%) |
| 11:00 AM to 11:59 AM | 0 (0.0%) | 0 (0.0%) |
| 12:00 PM to 3:59 PM | 0 (0.0%) | 0 (0.0%) |
| 4:00 PM to 11:59 PM | 13 (16.3%) | 0 (0.0%) |
| Total | 80 (100.0%) | 56 (100.0%) |
Housing Occupancy in Chilchinbito
Occupancy by Ownership in Chilchinbito
Of the total 380 dwellings in Chilchinbito, owner-occupied units account for 226 (59.5%), while renter-occupied units make up 154 (40.5%).
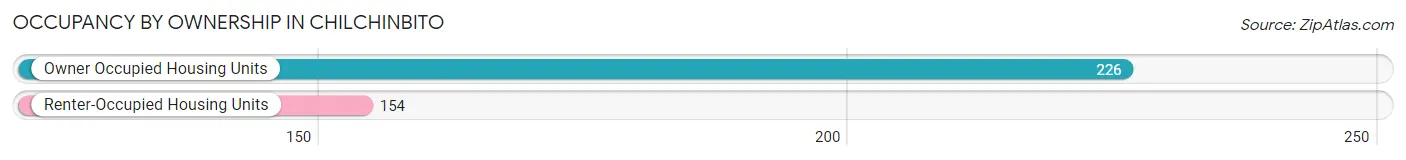
| Occupancy | # Housing Units | % Housing Units |
| Owner Occupied Housing Units | 226 | 59.5% |
| Renter-Occupied Housing Units | 154 | 40.5% |
| Total Occupied Housing Units | 380 | 100.0% |
Occupancy by Household Size in Chilchinbito
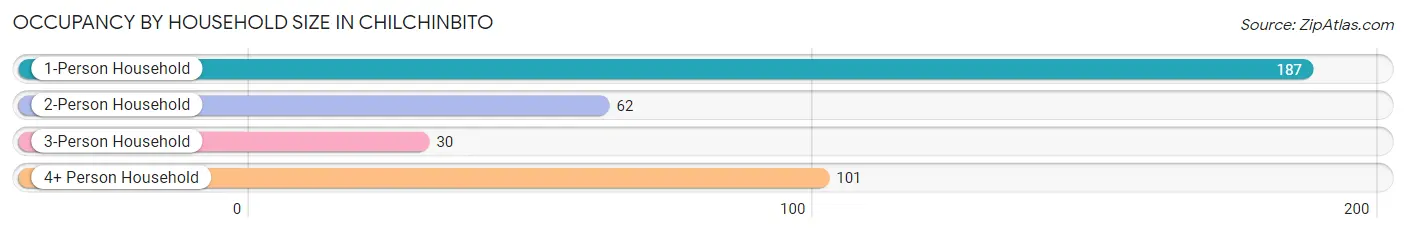
| Household Size | # Housing Units | % Housing Units |
| 1-Person Household | 187 | 49.2% |
| 2-Person Household | 62 | 16.3% |
| 3-Person Household | 30 | 7.9% |
| 4+ Person Household | 101 | 26.6% |
| Total Housing Units | 380 | 100.0% |
Occupancy by Ownership by Household Size in Chilchinbito
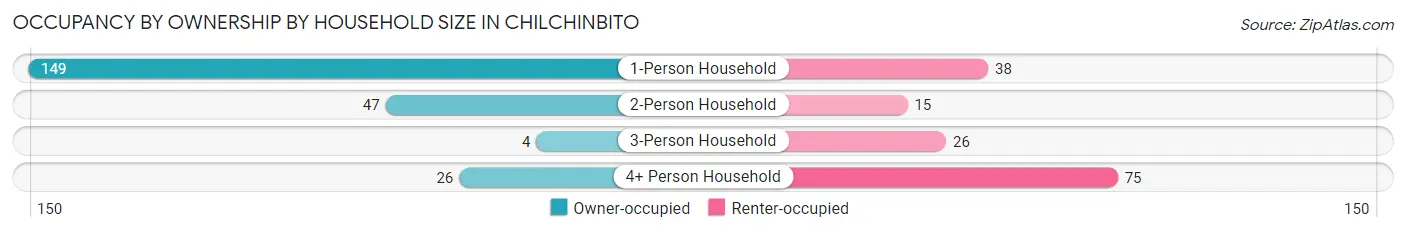
| Household Size | Owner-occupied | Renter-occupied |
| 1-Person Household | 149 (79.7%) | 38 (20.3%) |
| 2-Person Household | 47 (75.8%) | 15 (24.2%) |
| 3-Person Household | 4 (13.3%) | 26 (86.7%) |
| 4+ Person Household | 26 (25.7%) | 75 (74.3%) |
| Total Housing Units | 226 (59.5%) | 154 (40.5%) |
Occupancy by Educational Attainment in Chilchinbito
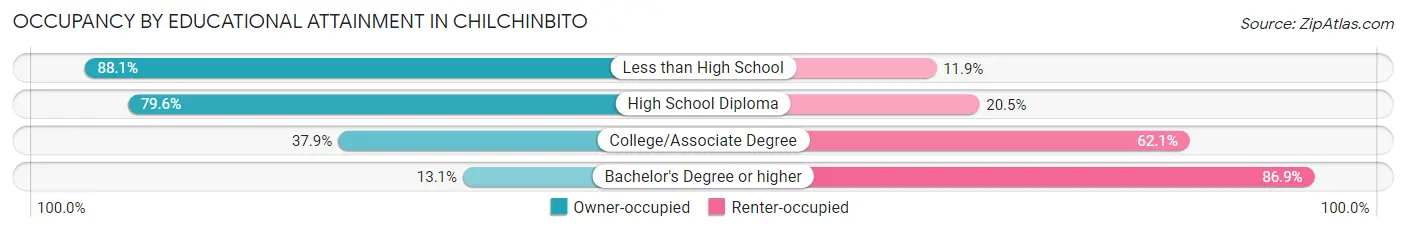
| Household Size | Owner-occupied | Renter-occupied |
| Less than High School | 74 (88.1%) | 10 (11.9%) |
| High School Diploma | 105 (79.5%) | 27 (20.4%) |
| College/Associate Degree | 39 (37.9%) | 64 (62.1%) |
| Bachelor's Degree or higher | 8 (13.1%) | 53 (86.9%) |
Occupancy by Age of Householder in Chilchinbito
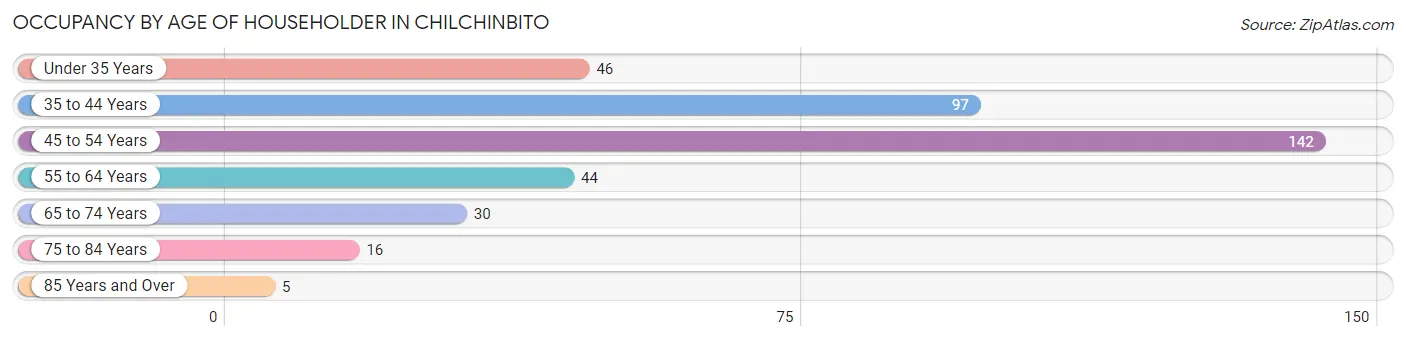
| Age Bracket | # Households | % Households |
| Under 35 Years | 46 | 12.1% |
| 35 to 44 Years | 97 | 25.5% |
| 45 to 54 Years | 142 | 37.4% |
| 55 to 64 Years | 44 | 11.6% |
| 65 to 74 Years | 30 | 7.9% |
| 75 to 84 Years | 16 | 4.2% |
| 85 Years and Over | 5 | 1.3% |
| Total | 380 | 100.0% |
Housing Finances in Chilchinbito
Median Income by Occupancy in Chilchinbito
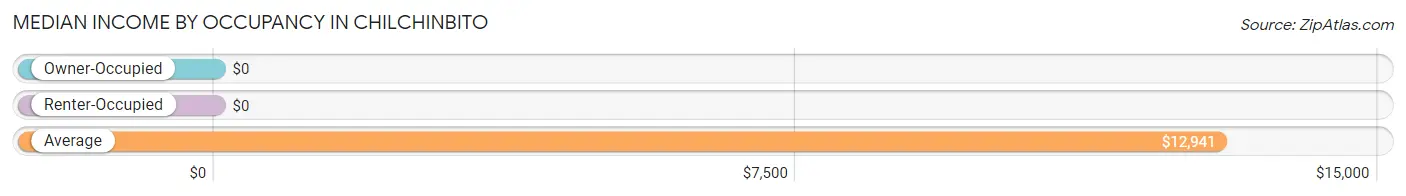
| Occupancy Type | # Households | Median Income |
| Owner-Occupied | 226 (59.5%) | $0 |
| Renter-Occupied | 154 (40.5%) | $0 |
| Average | 380 (100.0%) | $12,941 |
Occupancy by Householder Income Bracket in Chilchinbito
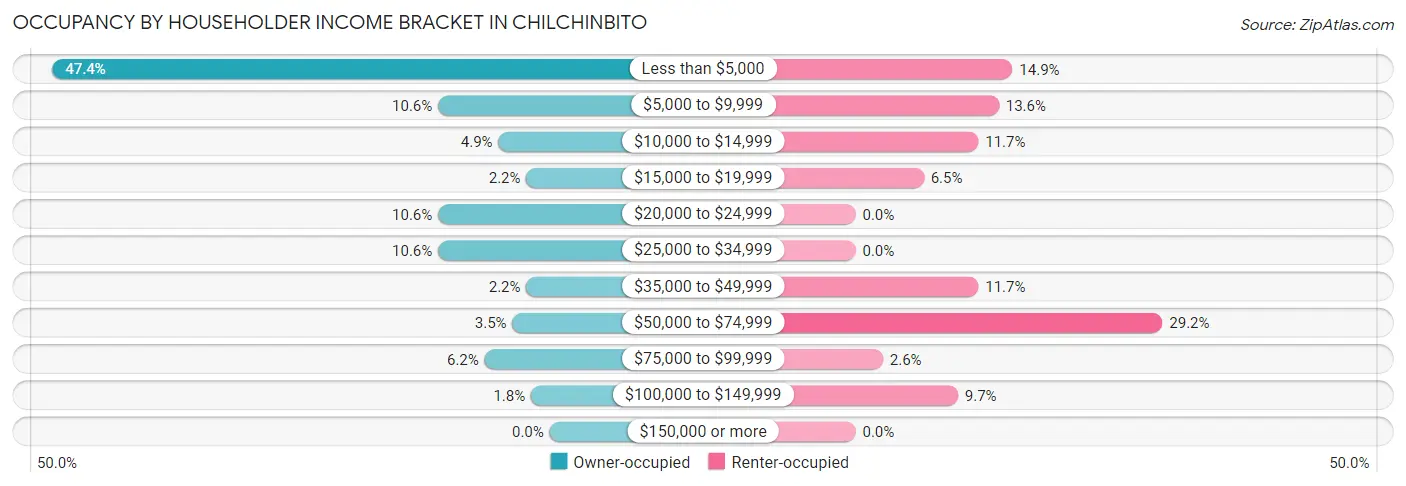
| Income Bracket | Owner-occupied | Renter-occupied |
| Less than $5,000 | 107 (47.3%) | 23 (14.9%) |
| $5,000 to $9,999 | 24 (10.6%) | 21 (13.6%) |
| $10,000 to $14,999 | 11 (4.9%) | 18 (11.7%) |
| $15,000 to $19,999 | 5 (2.2%) | 10 (6.5%) |
| $20,000 to $24,999 | 24 (10.6%) | 0 (0.0%) |
| $25,000 to $34,999 | 24 (10.6%) | 0 (0.0%) |
| $35,000 to $49,999 | 5 (2.2%) | 18 (11.7%) |
| $50,000 to $74,999 | 8 (3.5%) | 45 (29.2%) |
| $75,000 to $99,999 | 14 (6.2%) | 4 (2.6%) |
| $100,000 to $149,999 | 4 (1.8%) | 15 (9.7%) |
| $150,000 or more | 0 (0.0%) | 0 (0.0%) |
| Total | 226 (100.0%) | 154 (100.0%) |
Monthly Housing Cost Tiers in Chilchinbito
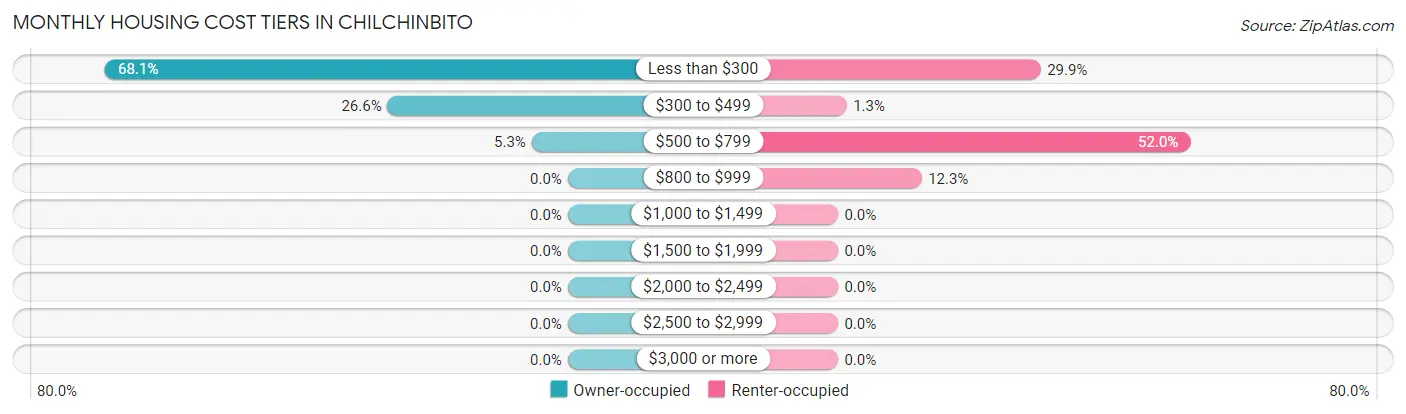
| Monthly Cost | Owner-occupied | Renter-occupied |
| Less than $300 | 154 (68.1%) | 46 (29.9%) |
| $300 to $499 | 60 (26.6%) | 2 (1.3%) |
| $500 to $799 | 12 (5.3%) | 80 (51.9%) |
| $800 to $999 | 0 (0.0%) | 19 (12.3%) |
| $1,000 to $1,499 | 0 (0.0%) | 0 (0.0%) |
| $1,500 to $1,999 | 0 (0.0%) | 0 (0.0%) |
| $2,000 to $2,499 | 0 (0.0%) | 0 (0.0%) |
| $2,500 to $2,999 | 0 (0.0%) | 0 (0.0%) |
| $3,000 or more | 0 (0.0%) | 0 (0.0%) |
| Total | 226 (100.0%) | 154 (100.0%) |
Physical Housing Characteristics in Chilchinbito
Housing Structures in Chilchinbito
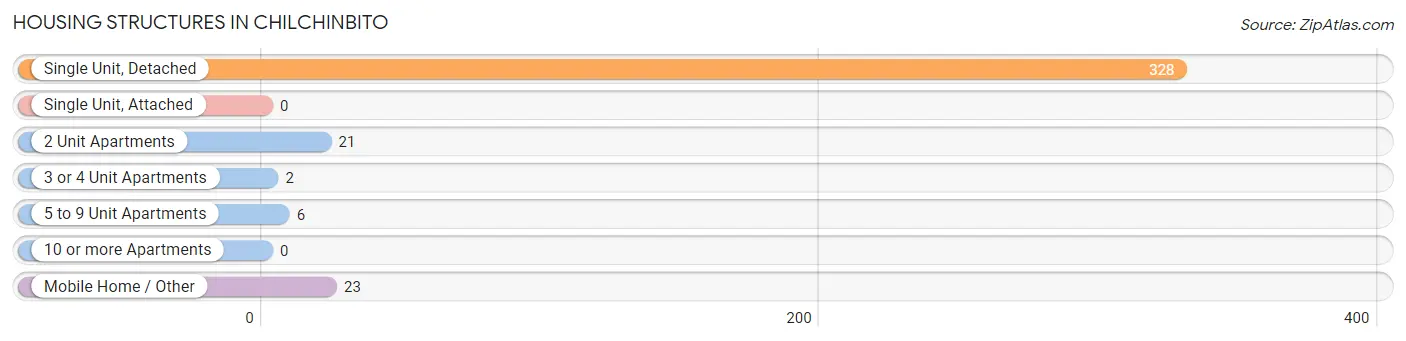
| Structure Type | # Housing Units | % Housing Units |
| Single Unit, Detached | 328 | 86.3% |
| Single Unit, Attached | 0 | 0.0% |
| 2 Unit Apartments | 21 | 5.5% |
| 3 or 4 Unit Apartments | 2 | 0.5% |
| 5 to 9 Unit Apartments | 6 | 1.6% |
| 10 or more Apartments | 0 | 0.0% |
| Mobile Home / Other | 23 | 6.0% |
| Total | 380 | 100.0% |
Housing Structures by Occupancy in Chilchinbito
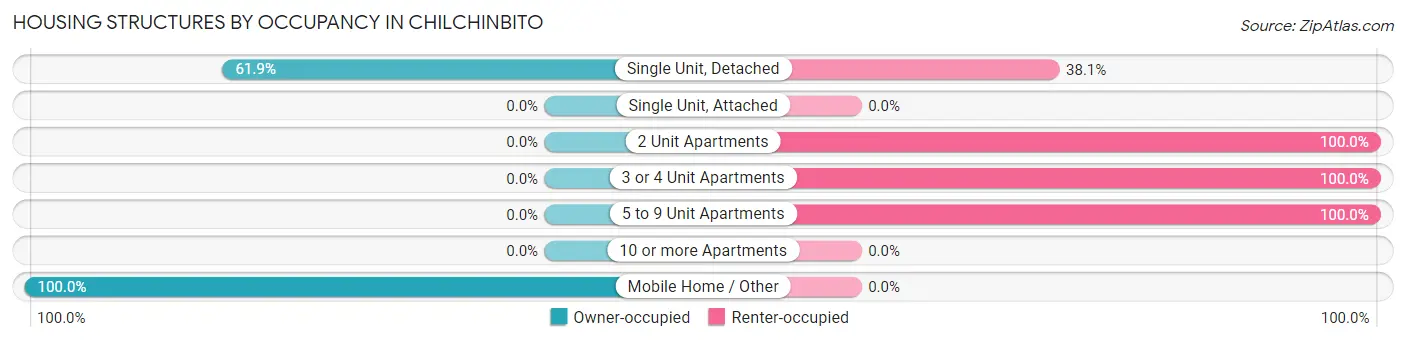
| Structure Type | Owner-occupied | Renter-occupied |
| Single Unit, Detached | 203 (61.9%) | 125 (38.1%) |
| Single Unit, Attached | 0 (0.0%) | 0 (0.0%) |
| 2 Unit Apartments | 0 (0.0%) | 21 (100.0%) |
| 3 or 4 Unit Apartments | 0 (0.0%) | 2 (100.0%) |
| 5 to 9 Unit Apartments | 0 (0.0%) | 6 (100.0%) |
| 10 or more Apartments | 0 (0.0%) | 0 (0.0%) |
| Mobile Home / Other | 23 (100.0%) | 0 (0.0%) |
| Total | 226 (59.5%) | 154 (40.5%) |
Housing Structures by Number of Rooms in Chilchinbito
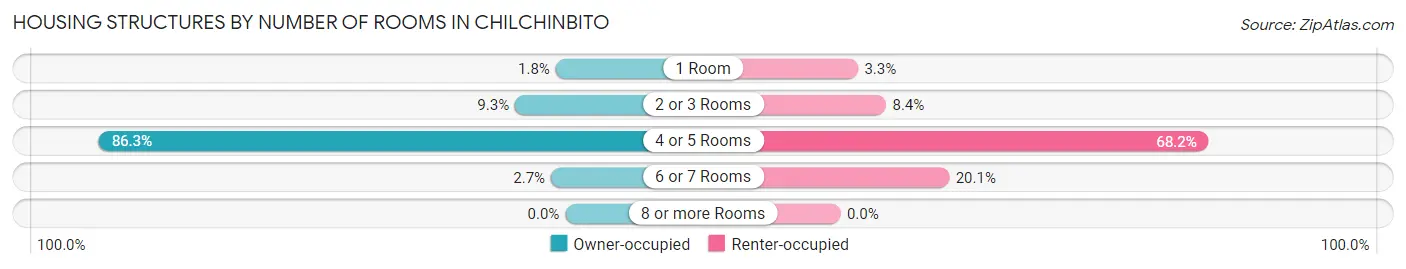
| Number of Rooms | Owner-occupied | Renter-occupied |
| 1 Room | 4 (1.8%) | 5 (3.3%) |
| 2 or 3 Rooms | 21 (9.3%) | 13 (8.4%) |
| 4 or 5 Rooms | 195 (86.3%) | 105 (68.2%) |
| 6 or 7 Rooms | 6 (2.6%) | 31 (20.1%) |
| 8 or more Rooms | 0 (0.0%) | 0 (0.0%) |
| Total | 226 (100.0%) | 154 (100.0%) |
Housing Structure by Heating Type in Chilchinbito
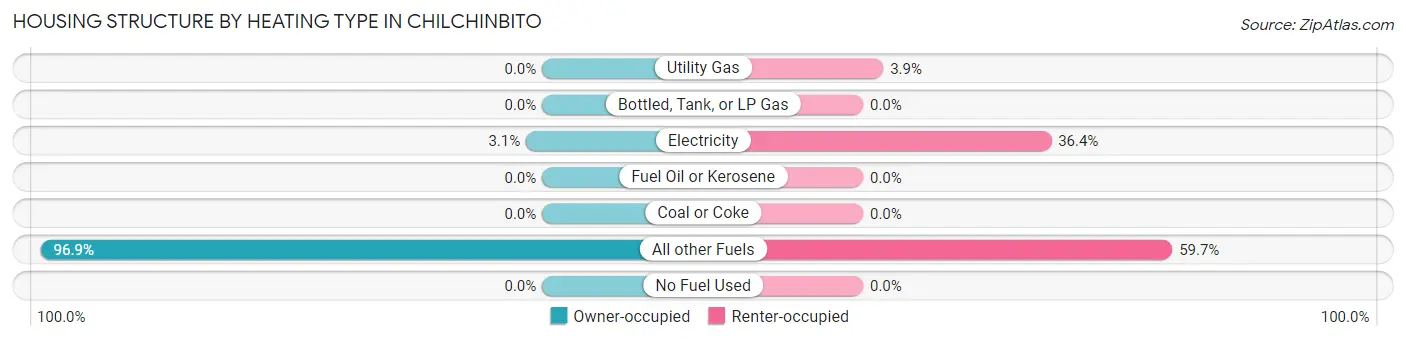
| Heating Type | Owner-occupied | Renter-occupied |
| Utility Gas | 0 (0.0%) | 6 (3.9%) |
| Bottled, Tank, or LP Gas | 0 (0.0%) | 0 (0.0%) |
| Electricity | 7 (3.1%) | 56 (36.4%) |
| Fuel Oil or Kerosene | 0 (0.0%) | 0 (0.0%) |
| Coal or Coke | 0 (0.0%) | 0 (0.0%) |
| All other Fuels | 219 (96.9%) | 92 (59.7%) |
| No Fuel Used | 0 (0.0%) | 0 (0.0%) |
| Total | 226 (100.0%) | 154 (100.0%) |
Household Vehicle Usage in Chilchinbito
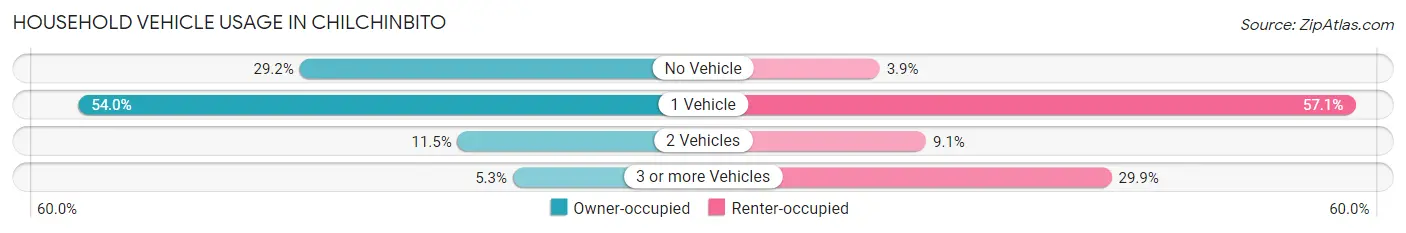
| Vehicles per Household | Owner-occupied | Renter-occupied |
| No Vehicle | 66 (29.2%) | 6 (3.9%) |
| 1 Vehicle | 122 (54.0%) | 88 (57.1%) |
| 2 Vehicles | 26 (11.5%) | 14 (9.1%) |
| 3 or more Vehicles | 12 (5.3%) | 46 (29.9%) |
| Total | 226 (100.0%) | 154 (100.0%) |
Real Estate & Mortgages in Chilchinbito
Real Estate and Mortgage Overview in Chilchinbito
| Characteristic | Without Mortgage | With Mortgage |
| Housing Units | 214 | 12 |
| Median Property Value | $51,500 | $0 |
| Median Household Income | - | - |
| Monthly Housing Costs | $193 | $0 |
| Real Estate Taxes | - | - |
Property Value by Mortgage Status in Chilchinbito
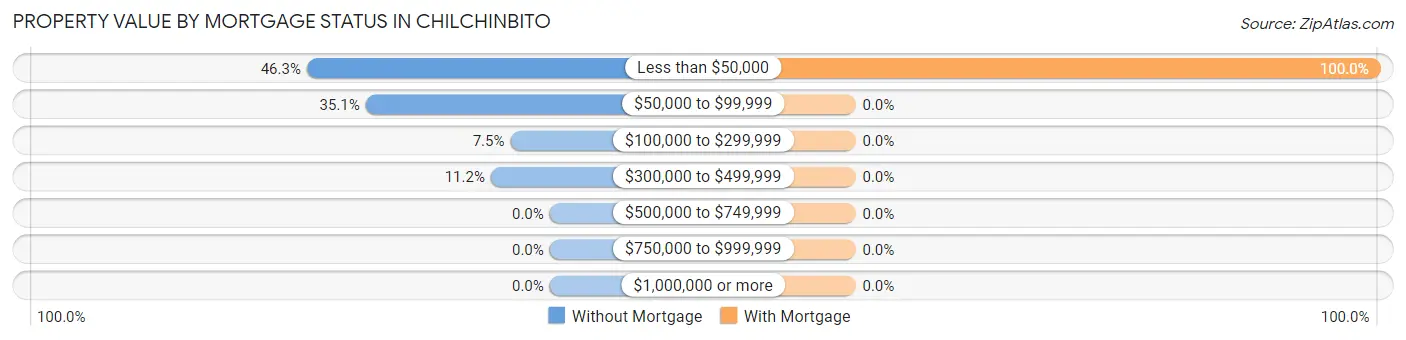
| Property Value | Without Mortgage | With Mortgage |
| Less than $50,000 | 99 (46.3%) | 12 (100.0%) |
| $50,000 to $99,999 | 75 (35.0%) | 0 (0.0%) |
| $100,000 to $299,999 | 16 (7.5%) | 0 (0.0%) |
| $300,000 to $499,999 | 24 (11.2%) | 0 (0.0%) |
| $500,000 to $749,999 | 0 (0.0%) | 0 (0.0%) |
| $750,000 to $999,999 | 0 (0.0%) | 0 (0.0%) |
| $1,000,000 or more | 0 (0.0%) | 0 (0.0%) |
| Total | 214 (100.0%) | 12 (100.0%) |
Household Income by Mortgage Status in Chilchinbito
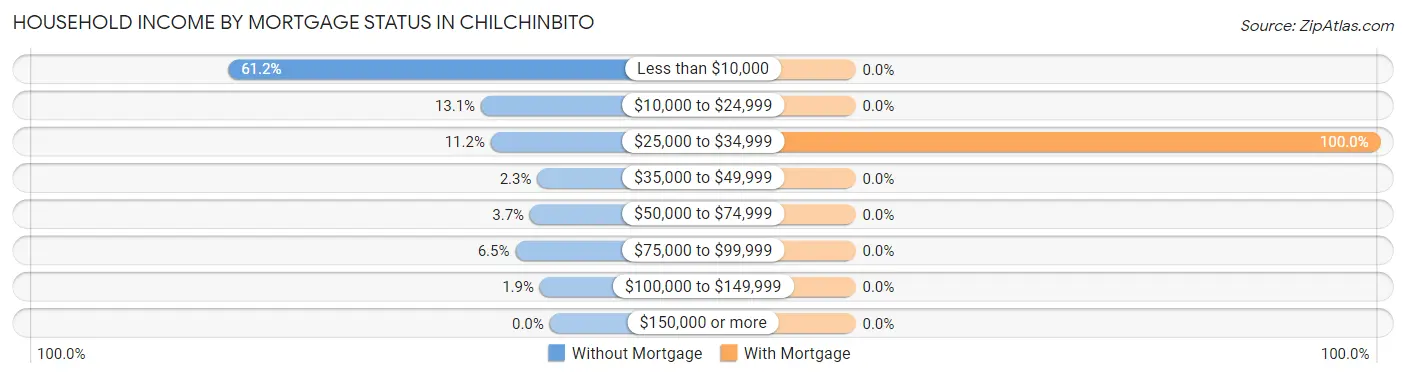
| Household Income | Without Mortgage | With Mortgage |
| Less than $10,000 | 131 (61.2%) | 0 (0.0%) |
| $10,000 to $24,999 | 28 (13.1%) | 0 (0.0%) |
| $25,000 to $34,999 | 24 (11.2%) | 12 (100.0%) |
| $35,000 to $49,999 | 5 (2.3%) | 0 (0.0%) |
| $50,000 to $74,999 | 8 (3.7%) | 0 (0.0%) |
| $75,000 to $99,999 | 14 (6.5%) | 0 (0.0%) |
| $100,000 to $149,999 | 4 (1.9%) | 0 (0.0%) |
| $150,000 or more | 0 (0.0%) | 0 (0.0%) |
| Total | 214 (100.0%) | 12 (100.0%) |
Property Value to Household Income Ratio in Chilchinbito
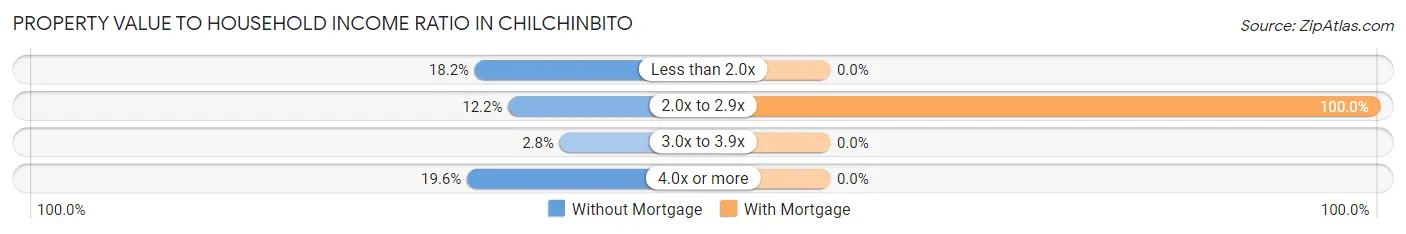
| Value-to-Income Ratio | Without Mortgage | With Mortgage |
| Less than 2.0x | 39 (18.2%) | 0 (0.0%) |
| 2.0x to 2.9x | 26 (12.1%) | 12 (100.0%) |
| 3.0x to 3.9x | 6 (2.8%) | 0 (0.0%) |
| 4.0x or more | 42 (19.6%) | 0 (0.0%) |
| Total | 214 (100.0%) | 12 (100.0%) |
Real Estate Taxes by Mortgage Status in Chilchinbito
| Property Taxes | Without Mortgage | With Mortgage |
| Less than $800 | 0 (0.0%) | 0 (0.0%) |
| $800 to $1,499 | 0 (0.0%) | 0 (0.0%) |
| $800 to $1,499 | 0 (0.0%) | 0 (0.0%) |
| Total | 214 (100.0%) | 12 (100.0%) |
Health & Disability in Chilchinbito
Health Insurance Coverage by Age in Chilchinbito
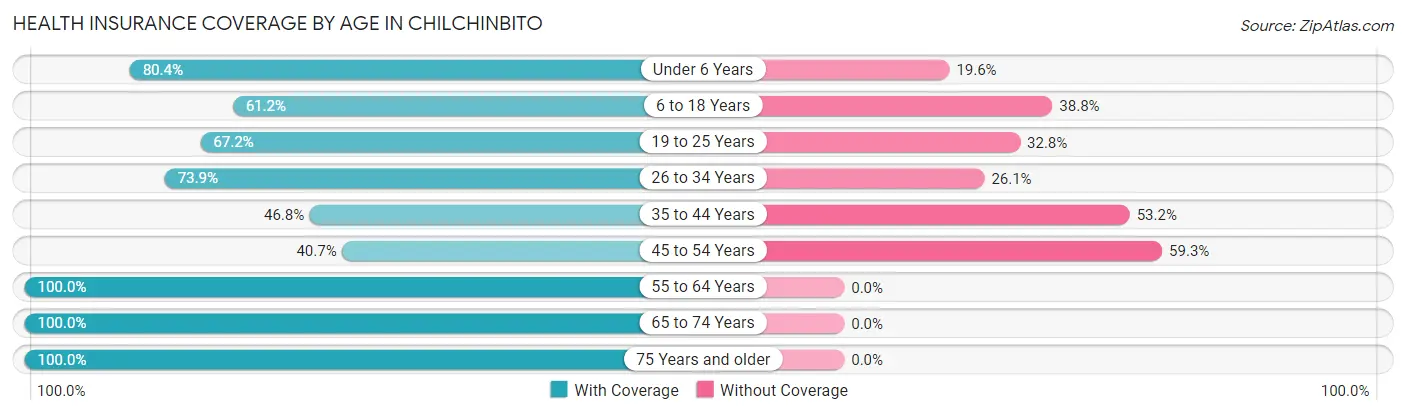
| Age Bracket | With Coverage | Without Coverage |
| Under 6 Years | 41 (80.4%) | 10 (19.6%) |
| 6 to 18 Years | 134 (61.2%) | 85 (38.8%) |
| 19 to 25 Years | 41 (67.2%) | 20 (32.8%) |
| 26 to 34 Years | 65 (73.9%) | 23 (26.1%) |
| 35 to 44 Years | 58 (46.8%) | 66 (53.2%) |
| 45 to 54 Years | 68 (40.7%) | 99 (59.3%) |
| 55 to 64 Years | 65 (100.0%) | 0 (0.0%) |
| 65 to 74 Years | 43 (100.0%) | 0 (0.0%) |
| 75 Years and older | 31 (100.0%) | 0 (0.0%) |
| Total | 546 (64.3%) | 303 (35.7%) |
Health Insurance Coverage by Citizenship Status in Chilchinbito
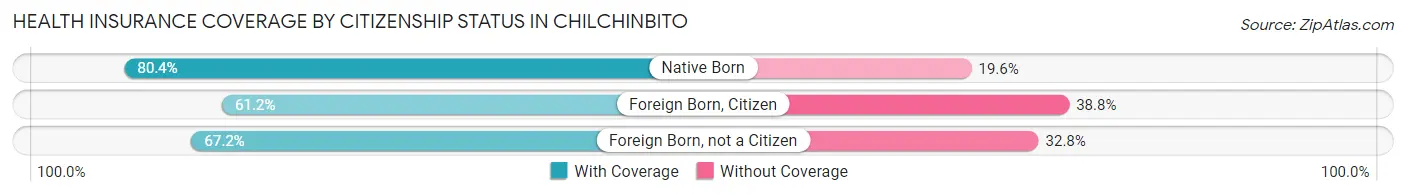
| Citizenship Status | With Coverage | Without Coverage |
| Native Born | 41 (80.4%) | 10 (19.6%) |
| Foreign Born, Citizen | 134 (61.2%) | 85 (38.8%) |
| Foreign Born, not a Citizen | 41 (67.2%) | 20 (32.8%) |
Health Insurance Coverage by Household Income in Chilchinbito
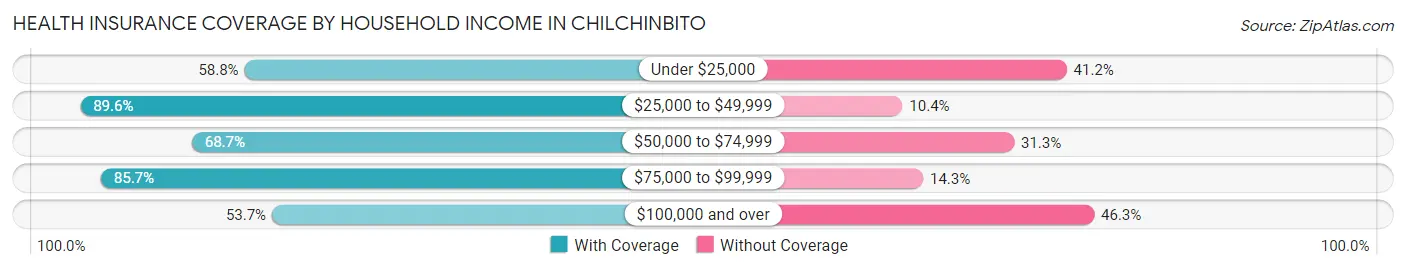
| Household Income | With Coverage | Without Coverage |
| Under $25,000 | 317 (58.8%) | 222 (41.2%) |
| $25,000 to $49,999 | 86 (89.6%) | 10 (10.4%) |
| $50,000 to $74,999 | 57 (68.7%) | 26 (31.3%) |
| $75,000 to $99,999 | 42 (85.7%) | 7 (14.3%) |
| $100,000 and over | 44 (53.7%) | 38 (46.3%) |
Public vs Private Health Insurance Coverage by Age in Chilchinbito
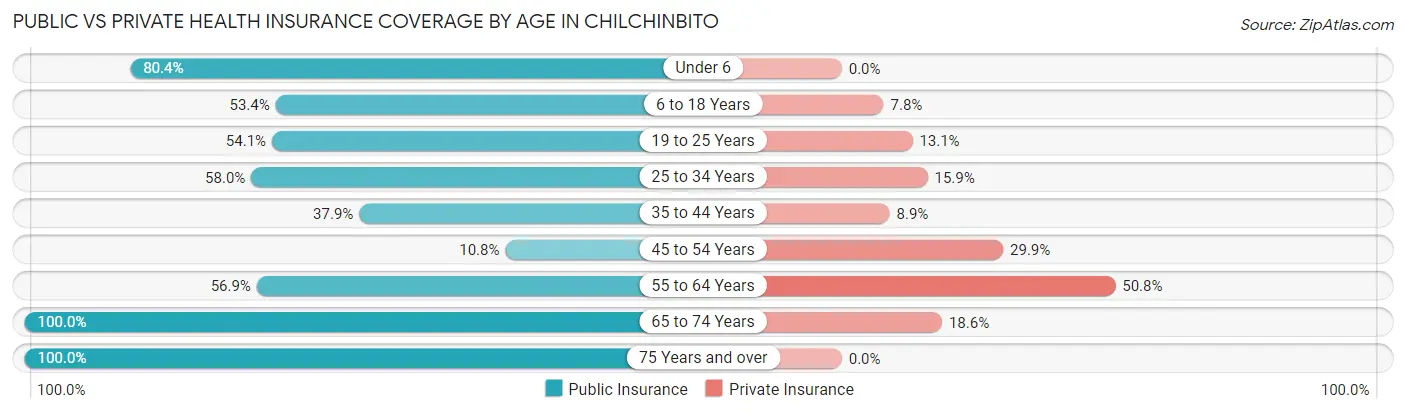
| Age Bracket | Public Insurance | Private Insurance |
| Under 6 | 41 (80.4%) | 0 (0.0%) |
| 6 to 18 Years | 117 (53.4%) | 17 (7.8%) |
| 19 to 25 Years | 33 (54.1%) | 8 (13.1%) |
| 25 to 34 Years | 51 (58.0%) | 14 (15.9%) |
| 35 to 44 Years | 47 (37.9%) | 11 (8.9%) |
| 45 to 54 Years | 18 (10.8%) | 50 (29.9%) |
| 55 to 64 Years | 37 (56.9%) | 33 (50.8%) |
| 65 to 74 Years | 43 (100.0%) | 8 (18.6%) |
| 75 Years and over | 31 (100.0%) | 0 (0.0%) |
| Total | 418 (49.2%) | 141 (16.6%) |
Disability Status by Sex by Age in Chilchinbito
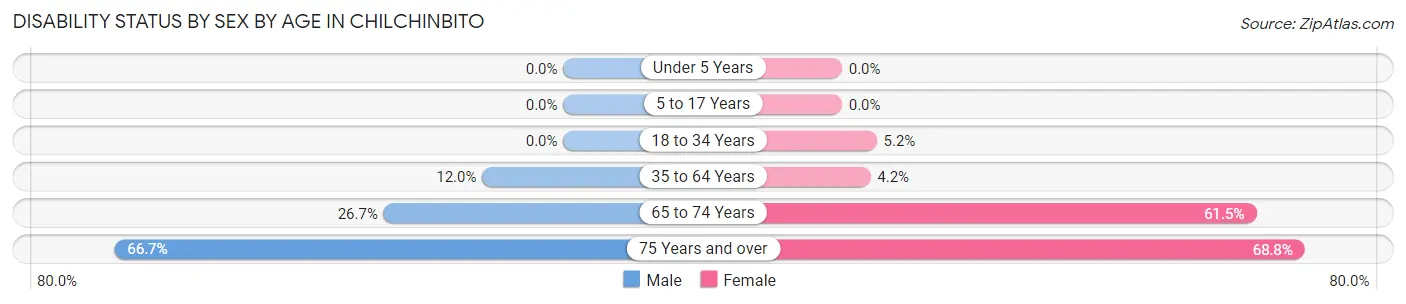
| Age Bracket | Male | Female |
| Under 5 Years | 0 (0.0%) | 0 (0.0%) |
| 5 to 17 Years | 0 (0.0%) | 0 (0.0%) |
| 18 to 34 Years | 0 (0.0%) | 6 (5.2%) |
| 35 to 64 Years | 23 (12.0%) | 7 (4.2%) |
| 65 to 74 Years | 8 (26.7%) | 8 (61.5%) |
| 75 Years and over | 10 (66.7%) | 11 (68.8%) |
Disability Class by Sex by Age in Chilchinbito
Disability Class: Hearing Difficulty
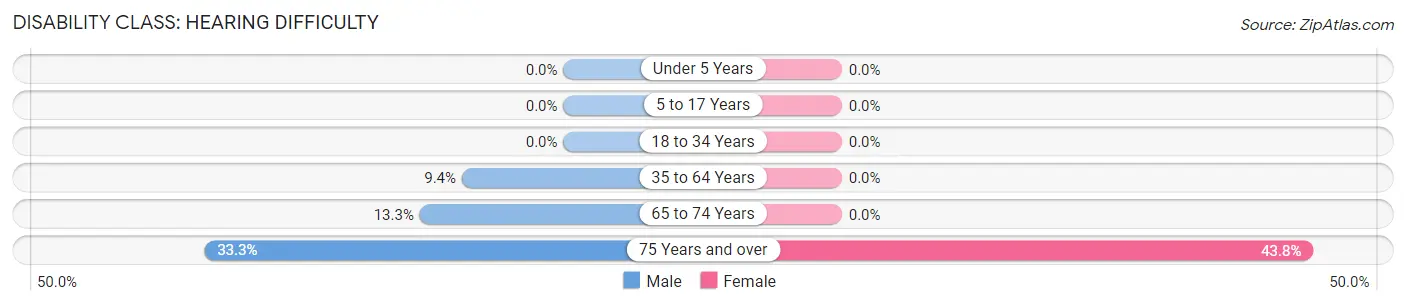
| Age Bracket | Male | Female |
| Under 5 Years | 0 (0.0%) | 0 (0.0%) |
| 5 to 17 Years | 0 (0.0%) | 0 (0.0%) |
| 18 to 34 Years | 0 (0.0%) | 0 (0.0%) |
| 35 to 64 Years | 18 (9.4%) | 0 (0.0%) |
| 65 to 74 Years | 4 (13.3%) | 0 (0.0%) |
| 75 Years and over | 5 (33.3%) | 7 (43.8%) |
Disability Class: Vision Difficulty
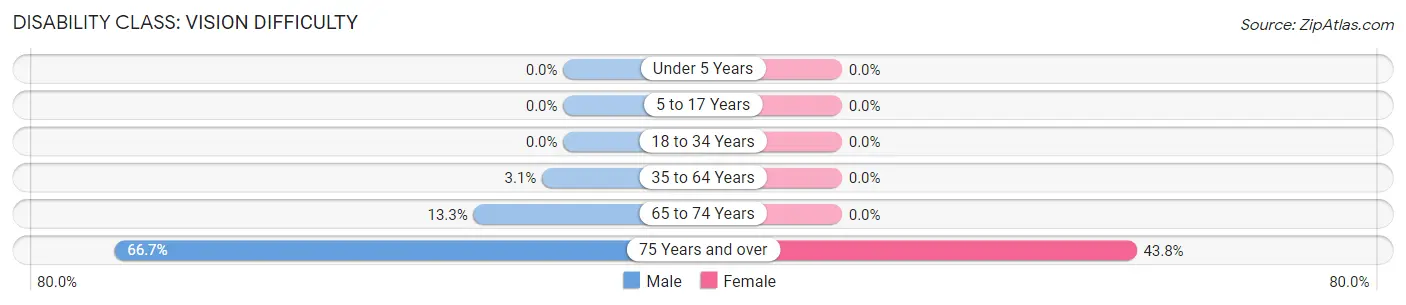
| Age Bracket | Male | Female |
| Under 5 Years | 0 (0.0%) | 0 (0.0%) |
| 5 to 17 Years | 0 (0.0%) | 0 (0.0%) |
| 18 to 34 Years | 0 (0.0%) | 0 (0.0%) |
| 35 to 64 Years | 6 (3.1%) | 0 (0.0%) |
| 65 to 74 Years | 4 (13.3%) | 0 (0.0%) |
| 75 Years and over | 10 (66.7%) | 7 (43.8%) |
Disability Class: Cognitive Difficulty
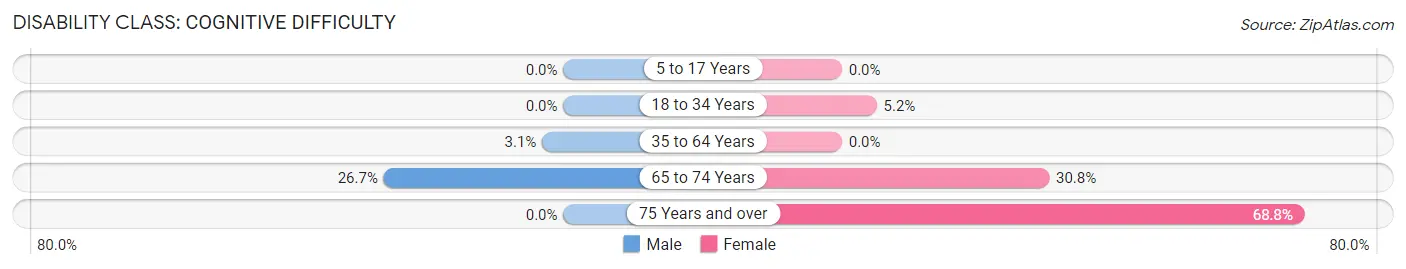
| Age Bracket | Male | Female |
| 5 to 17 Years | 0 (0.0%) | 0 (0.0%) |
| 18 to 34 Years | 0 (0.0%) | 6 (5.2%) |
| 35 to 64 Years | 6 (3.1%) | 0 (0.0%) |
| 65 to 74 Years | 8 (26.7%) | 4 (30.8%) |
| 75 Years and over | 0 (0.0%) | 11 (68.8%) |
Disability Class: Ambulatory Difficulty
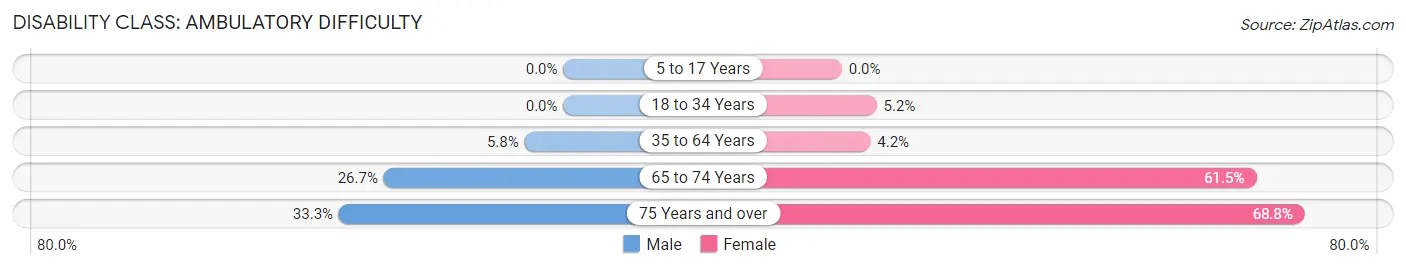
| Age Bracket | Male | Female |
| 5 to 17 Years | 0 (0.0%) | 0 (0.0%) |
| 18 to 34 Years | 0 (0.0%) | 6 (5.2%) |
| 35 to 64 Years | 11 (5.8%) | 7 (4.2%) |
| 65 to 74 Years | 8 (26.7%) | 8 (61.5%) |
| 75 Years and over | 5 (33.3%) | 11 (68.8%) |
Disability Class: Self-Care Difficulty
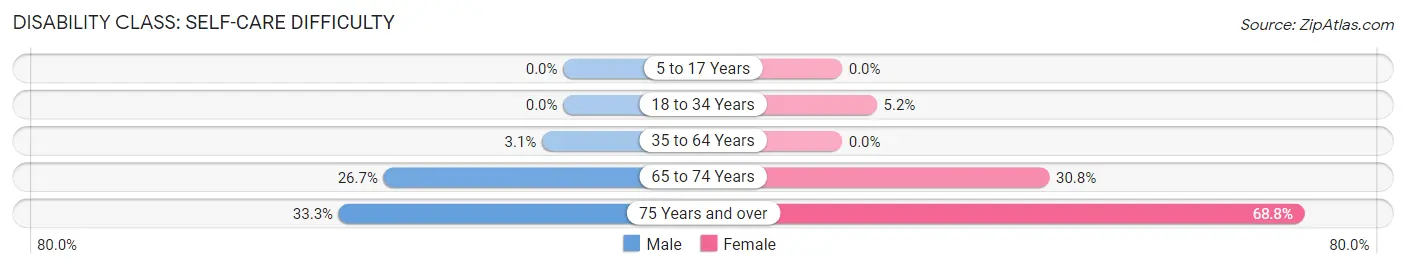
| Age Bracket | Male | Female |
| 5 to 17 Years | 0 (0.0%) | 0 (0.0%) |
| 18 to 34 Years | 0 (0.0%) | 6 (5.2%) |
| 35 to 64 Years | 6 (3.1%) | 0 (0.0%) |
| 65 to 74 Years | 8 (26.7%) | 4 (30.8%) |
| 75 Years and over | 5 (33.3%) | 11 (68.8%) |
Technology Access in Chilchinbito
Computing Device Access in Chilchinbito
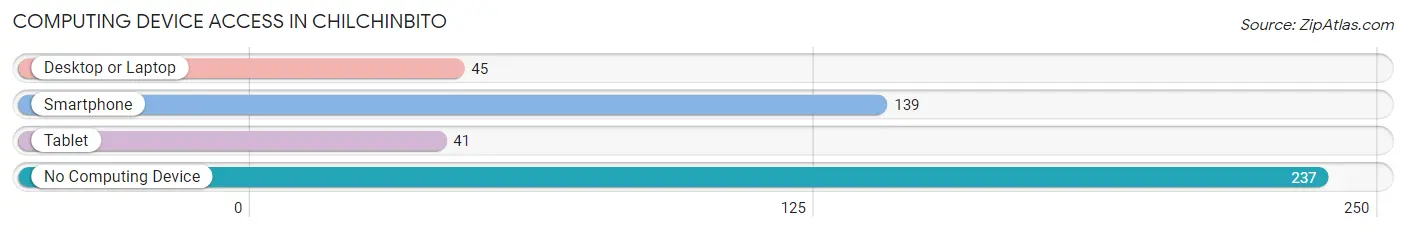
| Device Type | # Households | % Households |
| Desktop or Laptop | 45 | 11.8% |
| Smartphone | 139 | 36.6% |
| Tablet | 41 | 10.8% |
| No Computing Device | 237 | 62.4% |
| Total | 380 | 100.0% |
Internet Access in Chilchinbito
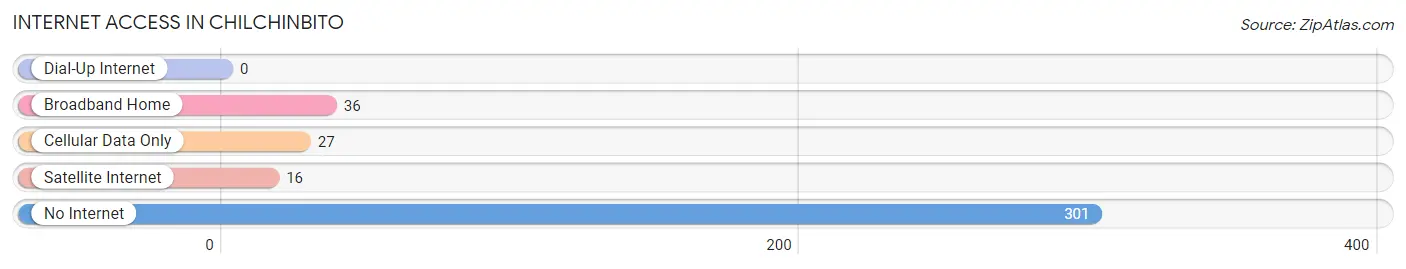
| Internet Type | # Households | % Households |
| Dial-Up Internet | 0 | 0.0% |
| Broadband Home | 36 | 9.5% |
| Cellular Data Only | 27 | 7.1% |
| Satellite Internet | 16 | 4.2% |
| No Internet | 301 | 79.2% |
| Total | 380 | 100.0% |
Chilchinbito Summary
Chilchinbito is a small unincorporated community located in the Navajo Nation in northeastern Arizona. It is situated in the western part of the Navajo Nation, approximately 40 miles east of Flagstaff and 30 miles west of Window Rock. The community is located in the Chilchinbito Valley, which is part of the larger Little Colorado River Valley. The population of Chilchinbito was estimated to be around 500 in 2000.
History
The Chilchinbito Valley has been inhabited by the Navajo people for centuries. The area was first settled by the Navajo in the late 1800s, when they were forced to relocate from their traditional homelands in the Four Corners region. The Navajo people established a number of small settlements in the Chilchinbito Valley, including Chilchinbito. The name Chilchinbito is derived from the Navajo word for “place of the red willows”.
The Chilchinbito Valley was part of the Navajo Reservation until the 1930s, when the federal government began to divide the reservation into smaller parcels of land. The Chilchinbito Valley was divided into two parcels, one of which was given to the Navajo people and the other to non-Native settlers. The Navajo people were able to retain their traditional way of life in the Chilchinbito Valley, while the non-Native settlers established a number of small ranches and farms in the area.
Geography
Chilchinbito is located in the western part of the Navajo Nation, in the Chilchinbito Valley. The valley is part of the larger Little Colorado River Valley, which is located in the Colorado Plateau region of the southwestern United States. The valley is characterized by its rugged terrain, with elevations ranging from 4,000 to 6,000 feet. The climate in the Chilchinbito Valley is semi-arid, with hot summers and cold winters.
The Chilchinbito Valley is home to a variety of wildlife, including mule deer, elk, coyotes, bobcats, and mountain lions. The area is also home to a variety of plant life, including sagebrush, juniper, and pinyon pine.
Economy
The economy of Chilchinbito is largely based on agriculture and ranching. The area is home to a number of small ranches and farms, which produce a variety of crops, including corn, wheat, and hay. The area is also home to a number of small businesses, including convenience stores, gas stations, and restaurants.
The Navajo Nation also operates a number of businesses in the Chilchinbito Valley, including a casino, a hotel, and a golf course. The Navajo Nation also operates a number of educational and cultural programs in the area, including a museum and a cultural center.
Demographics
The population of Chilchinbito was estimated to be around 500 in 2000. The majority of the population is Native American, with the majority of the population being Navajo. The population is also diverse, with a small number of non-Native Americans, including Hispanic and Anglo-Americans.
The median household income in Chilchinbito is approximately $25,000, which is lower than the national average. The poverty rate in Chilchinbito is also higher than the national average, with approximately 40% of the population living below the poverty line. The unemployment rate in Chilchinbito is also higher than the national average, with approximately 20% of the population unemployed.
Common Questions
What is Per Capita Income in Chilchinbito?
Per Capita income in Chilchinbito is $12,605.
What is the Median Family Income in Chilchinbito?
Median Family Income in Chilchinbito is $22,875.
What is the Median Household income in Chilchinbito?
Median Household Income in Chilchinbito is $12,941.
What is Income or Wage Gap in Chilchinbito?
Income or Wage Gap in Chilchinbito is 62.8%.
Women in Chilchinbito earn 37.2 cents for every dollar earned by a man.
What is Inequality or Gini Index in Chilchinbito?
Inequality or Gini Index in Chilchinbito is 0.62.
What is the Total Population of Chilchinbito?
Total Population of Chilchinbito is 849.
What is the Total Male Population of Chilchinbito?
Total Male Population of Chilchinbito is 418.
What is the Total Female Population of Chilchinbito?
Total Female Population of Chilchinbito is 431.
What is the Ratio of Males per 100 Females in Chilchinbito?
There are 96.98 Males per 100 Females in Chilchinbito.
What is the Ratio of Females per 100 Males in Chilchinbito?
There are 103.11 Females per 100 Males in Chilchinbito.
What is the Median Population Age in Chilchinbito?
Median Population Age in Chilchinbito is 35.4 Years.
What is the Average Family Size in Chilchinbito
Average Family Size in Chilchinbito is 3.3 People.
What is the Average Household Size in Chilchinbito
Average Household Size in Chilchinbito is 2.2 People.
How Large is the Labor Force in Chilchinbito?
There are 230 People in the Labor Forcein in Chilchinbito.
What is the Percentage of People in the Labor Force in Chilchinbito?
36.1% of People are in the Labor Force in Chilchinbito.
What is the Unemployment Rate in Chilchinbito?
Unemployment Rate in Chilchinbito is 23.9%.