Low Mountain, AZ Map & Demographics
Low Mountain Map
Low Mountain Overview
$11,803
PER CAPITA INCOME
$37,656
AVG FAMILY INCOME
$25,313
AVG HOUSEHOLD INCOME
0.55
INEQUALITY / GINI INDEX
644
TOTAL POPULATION
337
MALE POPULATION
307
FEMALE POPULATION
109.77
MALES / 100 FEMALES
91.10
FEMALES / 100 MALES
32.1
MEDIAN AGE
4.3
AVG FAMILY SIZE
3.4
AVG HOUSEHOLD SIZE
180
LABOR FORCE [ PEOPLE ]
35.3%
PERCENT IN LABOR FORCE
36.7%
UNEMPLOYMENT RATE
Income in Low Mountain
Income Overview in Low Mountain
Per Capita Income in Low Mountain is $11,803, while median incomes of families and households are $37,656 and $25,313 respectively.
| Characteristic | Number | Measure |
| Per Capita Income | 644 | $11,803 |
| Median Family Income | 130 | $37,656 |
| Mean Family Income | 130 | $45,722 |
| Median Household Income | 189 | $25,313 |
| Mean Household Income | 189 | $40,361 |
| Income Deficit | 130 | $0 |
| Wage / Income Gap (%) | 644 | 0.00% |
| Wage / Income Gap ($) | 644 | 100.00¢ per $1 |
| Gini / Inequality Index | 644 | 0.55 |
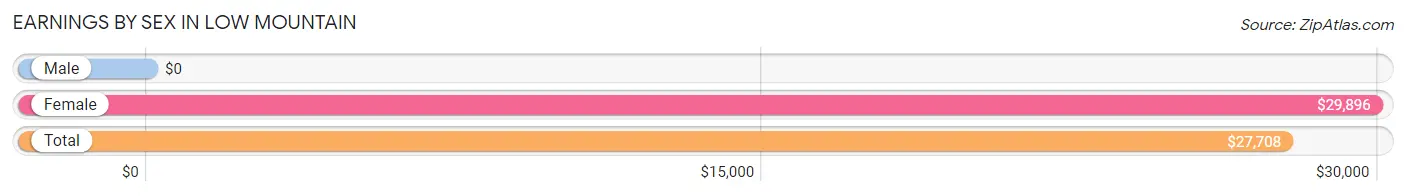
Earnings by Sex in Low Mountain
| Sex | Number | Average Earnings |
| Male | 81 (48.2%) | $0 |
| Female | 87 (51.8%) | $29,896 |
| Total | 168 (100.0%) | $27,708 |
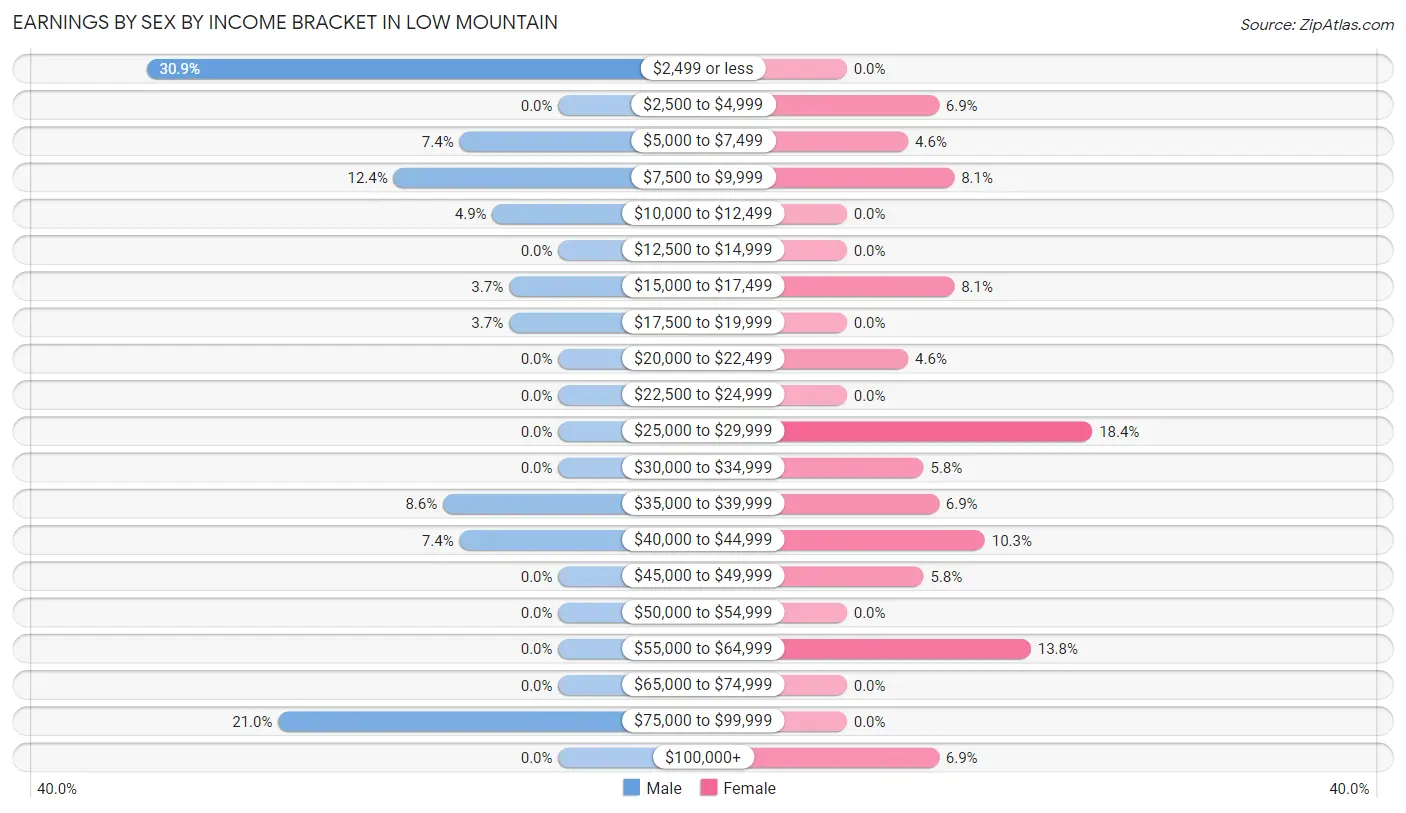
Earnings by Sex by Income Bracket in Low Mountain
The most common earnings brackets in Low Mountain are $2,499 or less for men (25 | 30.9%) and $25,000 to $29,999 for women (16 | 18.4%).
| Income | Male | Female |
| $2,499 or less | 25 (30.9%) | 0 (0.0%) |
| $2,500 to $4,999 | 0 (0.0%) | 6 (6.9%) |
| $5,000 to $7,499 | 6 (7.4%) | 4 (4.6%) |
| $7,500 to $9,999 | 10 (12.3%) | 7 (8.1%) |
| $10,000 to $12,499 | 4 (4.9%) | 0 (0.0%) |
| $12,500 to $14,999 | 0 (0.0%) | 0 (0.0%) |
| $15,000 to $17,499 | 3 (3.7%) | 7 (8.1%) |
| $17,500 to $19,999 | 3 (3.7%) | 0 (0.0%) |
| $20,000 to $22,499 | 0 (0.0%) | 4 (4.6%) |
| $22,500 to $24,999 | 0 (0.0%) | 0 (0.0%) |
| $25,000 to $29,999 | 0 (0.0%) | 16 (18.4%) |
| $30,000 to $34,999 | 0 (0.0%) | 5 (5.8%) |
| $35,000 to $39,999 | 7 (8.6%) | 6 (6.9%) |
| $40,000 to $44,999 | 6 (7.4%) | 9 (10.3%) |
| $45,000 to $49,999 | 0 (0.0%) | 5 (5.8%) |
| $50,000 to $54,999 | 0 (0.0%) | 0 (0.0%) |
| $55,000 to $64,999 | 0 (0.0%) | 12 (13.8%) |
| $65,000 to $74,999 | 0 (0.0%) | 0 (0.0%) |
| $75,000 to $99,999 | 17 (21.0%) | 0 (0.0%) |
| $100,000+ | 0 (0.0%) | 6 (6.9%) |
| Total | 81 (100.0%) | 87 (100.0%) |
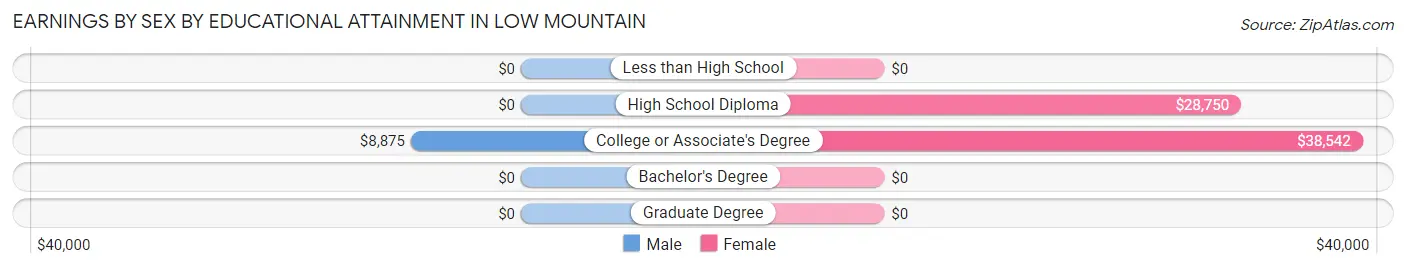
Earnings by Sex by Educational Attainment in Low Mountain
| Educational Attainment | Male Income | Female Income |
| Less than High School | - | - |
| High School Diploma | - | - |
| College or Associate's Degree | $8,875 | $38,542 |
| Bachelor's Degree | - | - |
| Graduate Degree | - | - |
| Total | - | - |
Family Income in Low Mountain
Family Income Brackets in Low Mountain
According to the Low Mountain family income data, there are 31 families falling into the $15,000 to $24,999 income range, which is the most common income bracket and makes up 23.8% of all families.
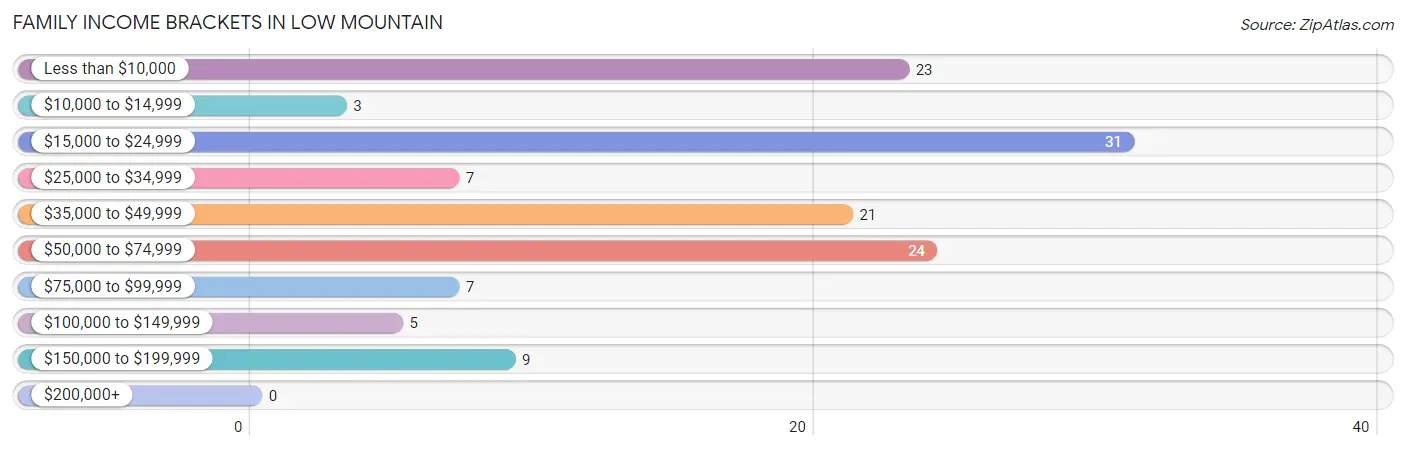
| Income Bracket | # Families | % Families |
| Less than $10,000 | 23 | 17.7% |
| $10,000 to $14,999 | 3 | 2.3% |
| $15,000 to $24,999 | 31 | 23.8% |
| $25,000 to $34,999 | 7 | 5.4% |
| $35,000 to $49,999 | 21 | 16.2% |
| $50,000 to $74,999 | 24 | 18.5% |
| $75,000 to $99,999 | 7 | 5.4% |
| $100,000 to $149,999 | 5 | 3.8% |
| $150,000 to $199,999 | 9 | 6.9% |
| $200,000+ | 0 | 0.0% |
Family Income by Famaliy Size in Low Mountain
4-person families (38 | 29.2%) account for the highest median family income in Low Mountain with $39,583 per family, while 4-person families (38 | 29.2%) have the highest median income of $9,896 per family member.
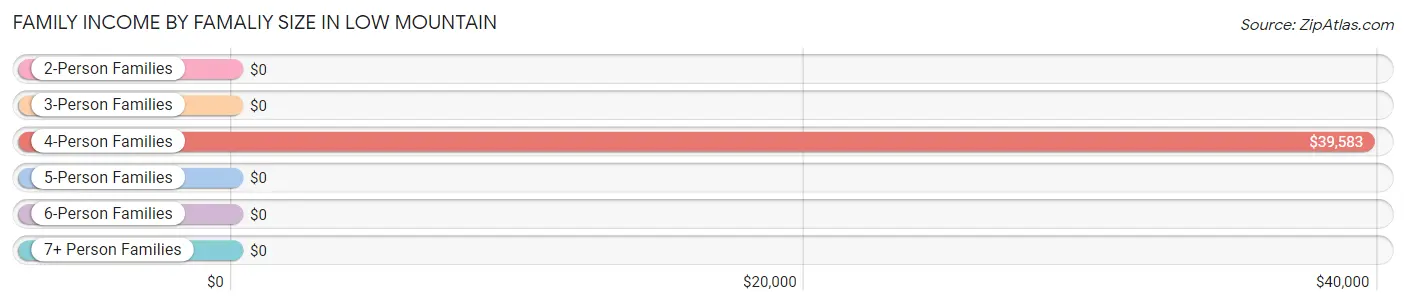
| Income Bracket | # Families | Median Income |
| 2-Person Families | 32 (24.6%) | $0 |
| 3-Person Families | 21 (16.2%) | $0 |
| 4-Person Families | 38 (29.2%) | $39,583 |
| 5-Person Families | 7 (5.4%) | $0 |
| 6-Person Families | 13 (10.0%) | $0 |
| 7+ Person Families | 19 (14.6%) | $0 |
| Total | 130 (100.0%) | $37,656 |
Family Income by Number of Earners in Low Mountain
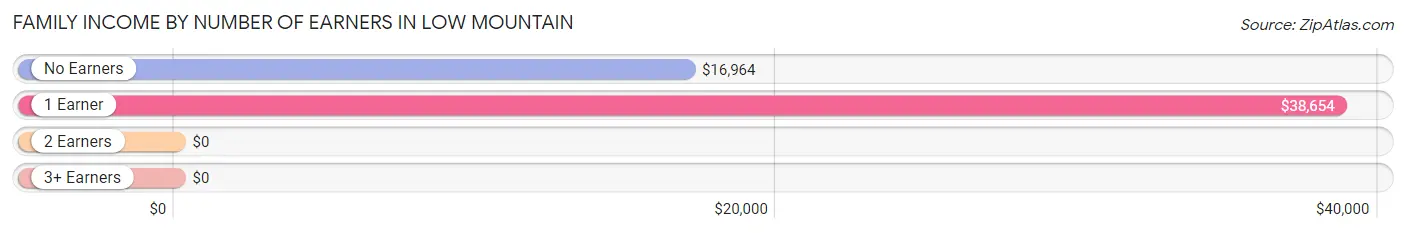
| Number of Earners | # Families | Median Income |
| No Earners | 41 (31.5%) | $16,964 |
| 1 Earner | 52 (40.0%) | $38,654 |
| 2 Earners | 31 (23.8%) | $0 |
| 3+ Earners | 6 (4.6%) | $0 |
| Total | 130 (100.0%) | $37,656 |
Household Income in Low Mountain
Household Income Brackets in Low Mountain
With 45 households falling in the category, the less than $10,000 income range is the most frequent in Low Mountain, accounting for 23.8% of all households.
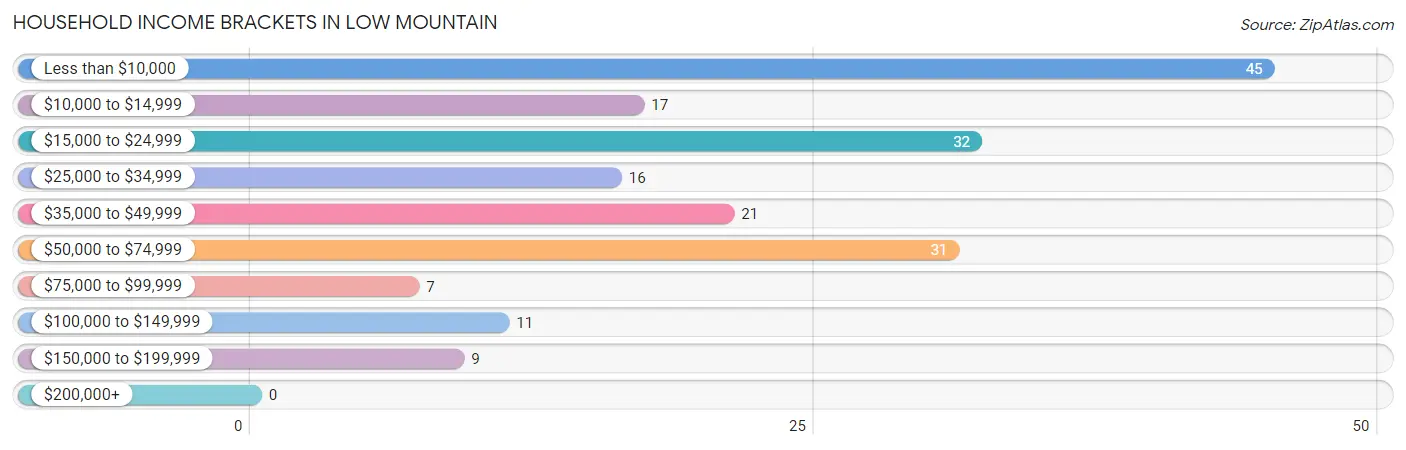
| Income Bracket | # Households | % Households |
| Less than $10,000 | 45 | 23.8% |
| $10,000 to $14,999 | 17 | 9.0% |
| $15,000 to $24,999 | 32 | 16.9% |
| $25,000 to $34,999 | 16 | 8.5% |
| $35,000 to $49,999 | 21 | 11.1% |
| $50,000 to $74,999 | 31 | 16.4% |
| $75,000 to $99,999 | 7 | 3.7% |
| $100,000 to $149,999 | 11 | 5.8% |
| $150,000 to $199,999 | 9 | 4.8% |
| $200,000+ | 0 | 0.0% |
Household Income by Householder Age in Low Mountain
The median household income in Low Mountain is $25,313, with the highest median household income of $51,250 found in the 65+ years age bracket for the primary householder. A total of 80 households (42.3%) fall into this category. Meanwhile, the 25 to 44 years age bracket for the primary householder has the lowest median household income of $0, with 25 households (13.2%) in this group.
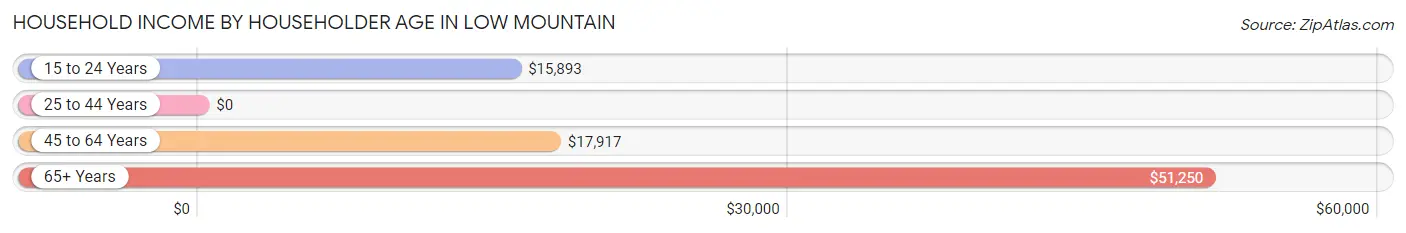
| Income Bracket | # Households | Median Income |
| 15 to 24 Years | 19 (10.1%) | $15,893 |
| 25 to 44 Years | 25 (13.2%) | $0 |
| 45 to 64 Years | 65 (34.4%) | $17,917 |
| 65+ Years | 80 (42.3%) | $51,250 |
| Total | 189 (100.0%) | $25,313 |
Poverty in Low Mountain
Income Below Poverty by Sex and Age in Low Mountain
With 53.7% poverty level for males and 40.1% for females among the residents of Low Mountain, 5 year old males and under 5 year old females are the most vulnerable to poverty, with 5 males (100.0%) and 15 females (78.9%) in their respective age groups living below the poverty level.
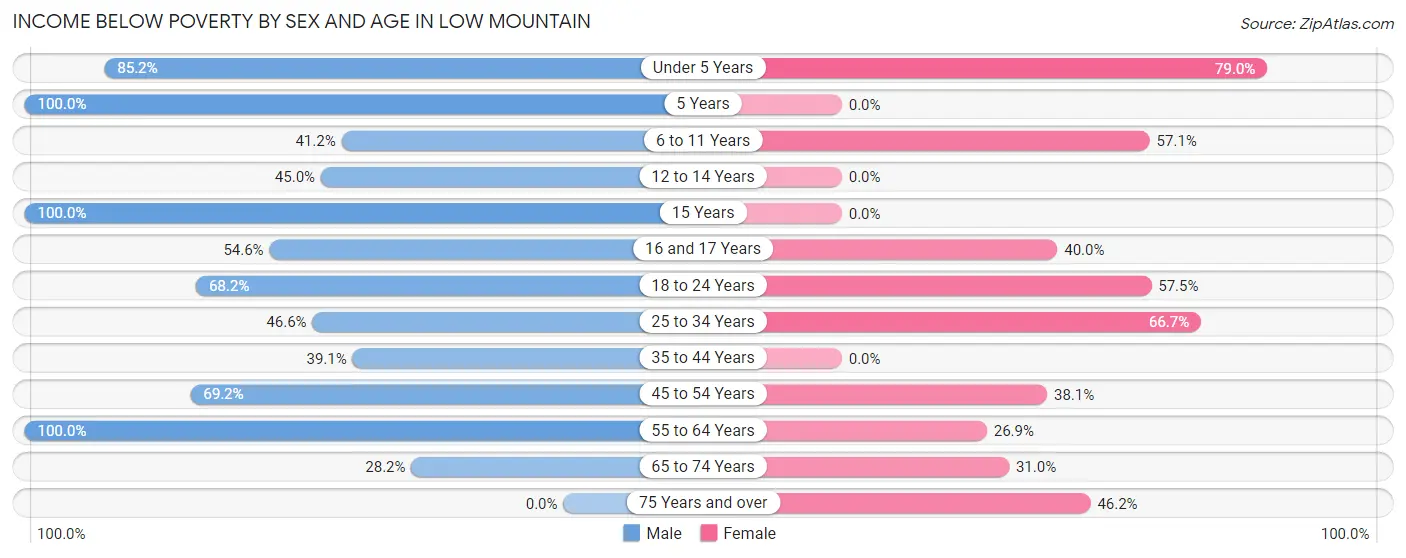
| Age Bracket | Male | Female |
| Under 5 Years | 23 (85.2%) | 15 (78.9%) |
| 5 Years | 5 (100.0%) | 0 (0.0%) |
| 6 to 11 Years | 14 (41.2%) | 8 (57.1%) |
| 12 to 14 Years | 9 (45.0%) | 0 (0.0%) |
| 15 Years | 3 (100.0%) | 0 (0.0%) |
| 16 and 17 Years | 6 (54.5%) | 10 (40.0%) |
| 18 to 24 Years | 30 (68.2%) | 27 (57.5%) |
| 25 to 34 Years | 34 (46.6%) | 16 (66.7%) |
| 35 to 44 Years | 9 (39.1%) | 0 (0.0%) |
| 45 to 54 Years | 18 (69.2%) | 16 (38.1%) |
| 55 to 64 Years | 19 (100.0%) | 7 (26.9%) |
| 65 to 74 Years | 11 (28.2%) | 18 (31.0%) |
| 75 Years and over | 0 (0.0%) | 6 (46.2%) |
| Total | 181 (53.7%) | 123 (40.1%) |
Income Above Poverty by Sex and Age in Low Mountain
According to the poverty statistics in Low Mountain, males aged 75 years and over and females aged 5 years are the age groups that are most secure financially, with 100.0% of males and 100.0% of females in these age groups living above the poverty line.
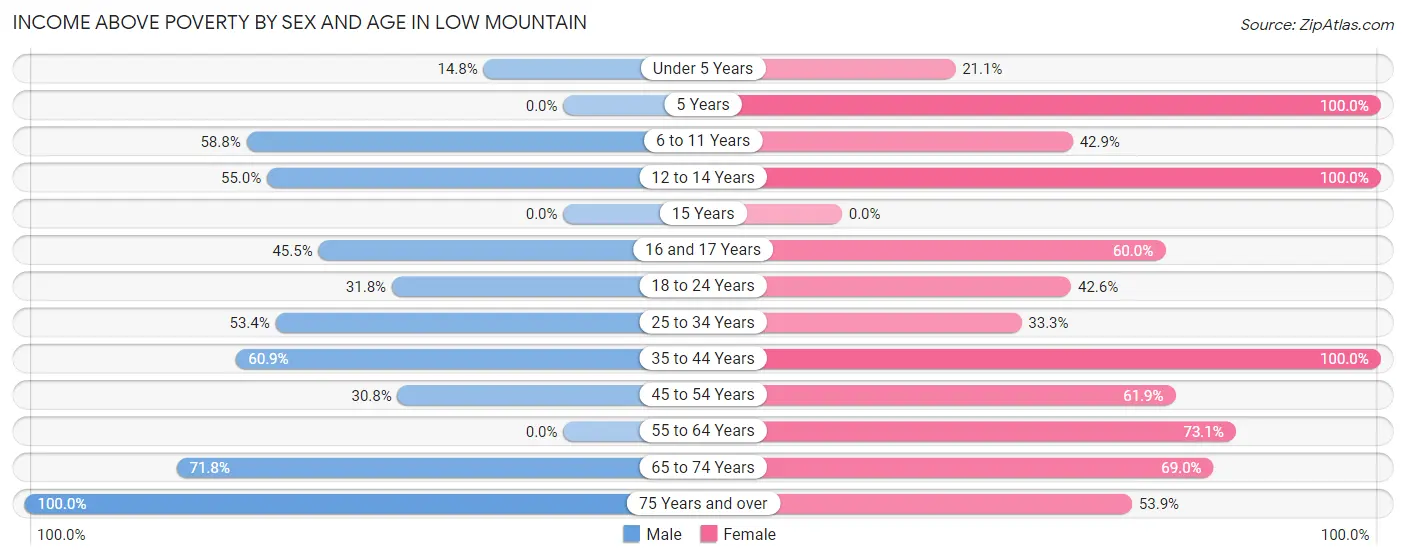
| Age Bracket | Male | Female |
| Under 5 Years | 4 (14.8%) | 4 (21.0%) |
| 5 Years | 0 (0.0%) | 6 (100.0%) |
| 6 to 11 Years | 20 (58.8%) | 6 (42.9%) |
| 12 to 14 Years | 11 (55.0%) | 6 (100.0%) |
| 15 Years | 0 (0.0%) | 0 (0.0%) |
| 16 and 17 Years | 5 (45.5%) | 15 (60.0%) |
| 18 to 24 Years | 14 (31.8%) | 20 (42.5%) |
| 25 to 34 Years | 39 (53.4%) | 8 (33.3%) |
| 35 to 44 Years | 14 (60.9%) | 27 (100.0%) |
| 45 to 54 Years | 8 (30.8%) | 26 (61.9%) |
| 55 to 64 Years | 0 (0.0%) | 19 (73.1%) |
| 65 to 74 Years | 28 (71.8%) | 40 (69.0%) |
| 75 Years and over | 13 (100.0%) | 7 (53.8%) |
| Total | 156 (46.3%) | 184 (59.9%) |
Income Below Poverty Among Married-Couple Families in Low Mountain
The poverty statistics for married-couple families in Low Mountain show that 19.1% or 8 of the total 42 families live below the poverty line. Families with 1 or 2 children have the highest poverty rate of 35.7%, comprising of 5 families. On the other hand, families with 3 or 4 children have the lowest poverty rate of 0.0%, which includes 0 families.
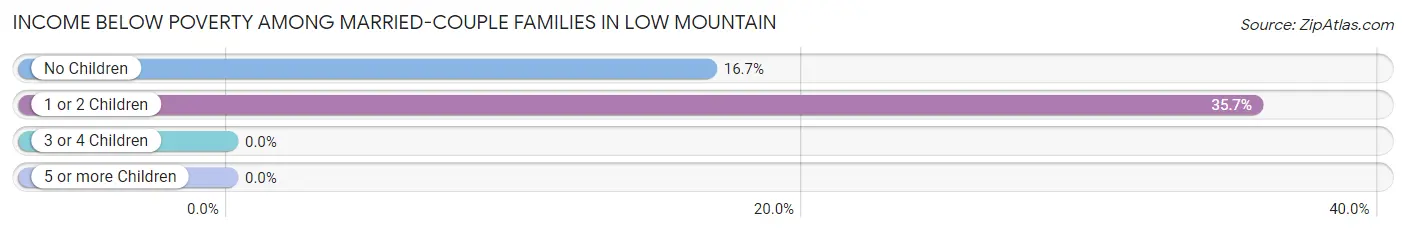
| Children | Above Poverty | Below Poverty |
| No Children | 15 (83.3%) | 3 (16.7%) |
| 1 or 2 Children | 9 (64.3%) | 5 (35.7%) |
| 3 or 4 Children | 10 (100.0%) | 0 (0.0%) |
| 5 or more Children | 0 (0.0%) | 0 (0.0%) |
| Total | 34 (80.9%) | 8 (19.1%) |
Income Below Poverty Among Single-Parent Households in Low Mountain
According to the poverty data in Low Mountain, 37.5% or 6 single-father households and 55.6% or 40 single-mother households are living below the poverty line. Among single-father households, those with 1 or 2 children have the highest poverty rate, with 6 households (60.0%) experiencing poverty. Likewise, among single-mother households, those with 5 or more children have the highest poverty rate, with 7 households (100.0%) falling below the poverty line.
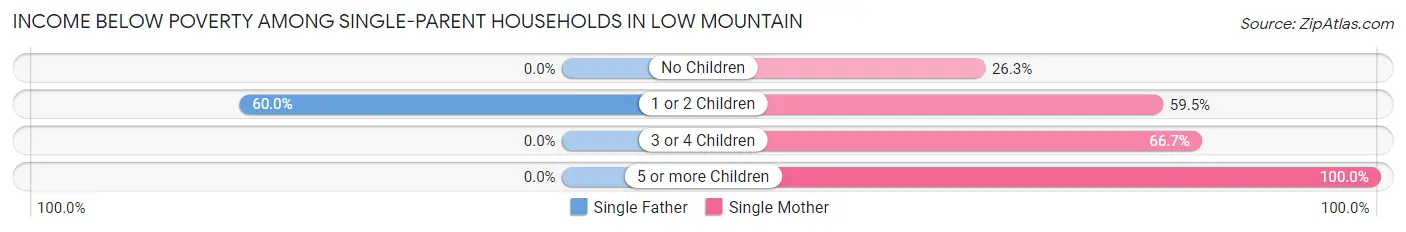
| Children | Single Father | Single Mother |
| No Children | 0 (0.0%) | 5 (26.3%) |
| 1 or 2 Children | 6 (60.0%) | 22 (59.5%) |
| 3 or 4 Children | 0 (0.0%) | 6 (66.7%) |
| 5 or more Children | 0 (0.0%) | 7 (100.0%) |
| Total | 6 (37.5%) | 40 (55.6%) |
Income Below Poverty Among Married-Couple vs Single-Parent Households in Low Mountain
The poverty data for Low Mountain shows that 8 of the married-couple family households (19.1%) and 46 of the single-parent households (52.3%) are living below the poverty level. Within the married-couple family households, those with 1 or 2 children have the highest poverty rate, with 5 households (35.7%) falling below the poverty line. Among the single-parent households, those with 5 or more children have the highest poverty rate, with 7 household (100.0%) living below poverty.
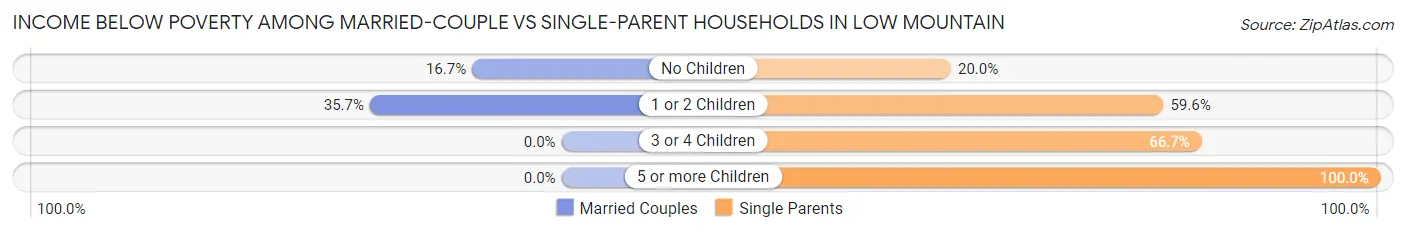
| Children | Married-Couple Families | Single-Parent Households |
| No Children | 3 (16.7%) | 5 (20.0%) |
| 1 or 2 Children | 5 (35.7%) | 28 (59.6%) |
| 3 or 4 Children | 0 (0.0%) | 6 (66.7%) |
| 5 or more Children | 0 (0.0%) | 7 (100.0%) |
| Total | 8 (19.1%) | 46 (52.3%) |
Race in Low Mountain
The most populous races in Low Mountain are Native / Alaskan (635 | 98.6%), Two or more Races (9 | 1.4%), and Hispanic or Latino (8 | 1.2%).
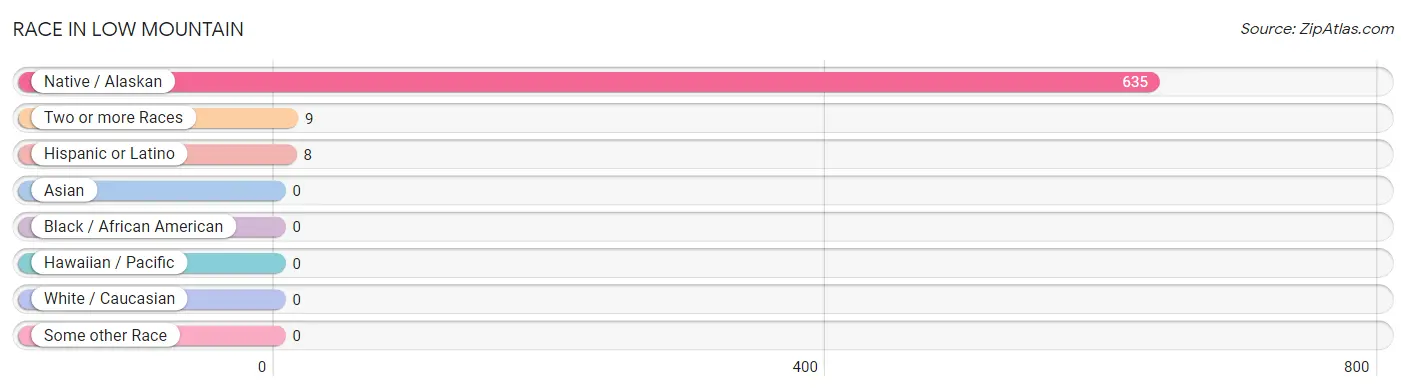
| Race | # Population | % Population |
| Asian | 0 | 0.0% |
| Black / African American | 0 | 0.0% |
| Hawaiian / Pacific | 0 | 0.0% |
| Hispanic or Latino | 8 | 1.2% |
| Native / Alaskan | 635 | 98.6% |
| White / Caucasian | 0 | 0.0% |
| Two or more Races | 9 | 1.4% |
| Some other Race | 0 | 0.0% |
| Total | 644 | 100.0% |
Ancestry in Low Mountain
The most populous ancestries reported in Low Mountain are Navajo (613 | 95.2%), Hopi (15 | 2.3%), Yuman (12 | 1.9%), Blackfeet (9 | 1.4%), and German (9 | 1.4%), together accounting for 102.2% of all Low Mountain residents.
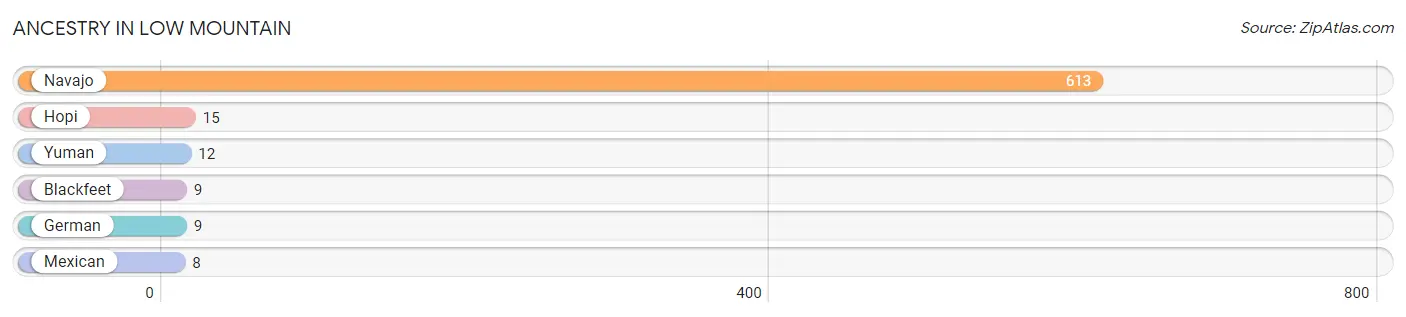
| Ancestry | # Population | % Population |
| Blackfeet | 9 | 1.4% |
| German | 9 | 1.4% |
| Hopi | 15 | 2.3% |
| Mexican | 8 | 1.2% |
| Navajo | 613 | 95.2% |
| Yuman | 12 | 1.9% | View All 6 Rows |
Immigrants in Low Mountain

| Immigration Origin | # Population | % Population | View All 0 Rows |
Sex and Age in Low Mountain
Sex and Age in Low Mountain
The most populous age groups in Low Mountain are 30 to 34 Years (50 | 14.8%) for men and 20 to 24 Years (41 | 13.4%) for women.
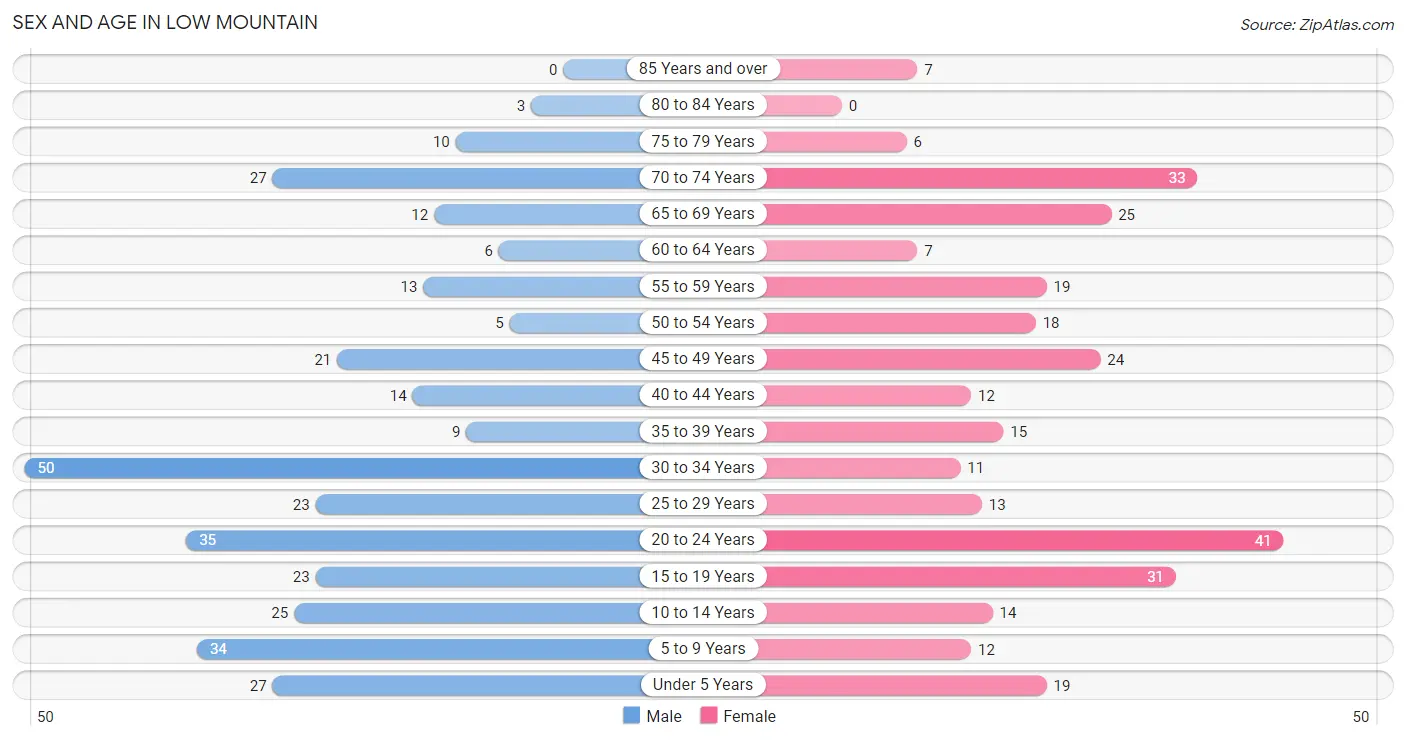
| Age Bracket | Male | Female |
| Under 5 Years | 27 (8.0%) | 19 (6.2%) |
| 5 to 9 Years | 34 (10.1%) | 12 (3.9%) |
| 10 to 14 Years | 25 (7.4%) | 14 (4.6%) |
| 15 to 19 Years | 23 (6.8%) | 31 (10.1%) |
| 20 to 24 Years | 35 (10.4%) | 41 (13.4%) |
| 25 to 29 Years | 23 (6.8%) | 13 (4.2%) |
| 30 to 34 Years | 50 (14.8%) | 11 (3.6%) |
| 35 to 39 Years | 9 (2.7%) | 15 (4.9%) |
| 40 to 44 Years | 14 (4.2%) | 12 (3.9%) |
| 45 to 49 Years | 21 (6.2%) | 24 (7.8%) |
| 50 to 54 Years | 5 (1.5%) | 18 (5.9%) |
| 55 to 59 Years | 13 (3.9%) | 19 (6.2%) |
| 60 to 64 Years | 6 (1.8%) | 7 (2.3%) |
| 65 to 69 Years | 12 (3.6%) | 25 (8.1%) |
| 70 to 74 Years | 27 (8.0%) | 33 (10.7%) |
| 75 to 79 Years | 10 (3.0%) | 6 (1.9%) |
| 80 to 84 Years | 3 (0.9%) | 0 (0.0%) |
| 85 Years and over | 0 (0.0%) | 7 (2.3%) |
| Total | 337 (100.0%) | 307 (100.0%) |
Families and Households in Low Mountain
Median Family Size in Low Mountain
The median family size in Low Mountain is 4.27 persons per family, with married-couple families (42 | 32.3%) accounting for the largest median family size of 4.48 persons per family. On the other hand, single male/father families (16 | 12.3%) represent the smallest median family size with 4.00 persons per family.
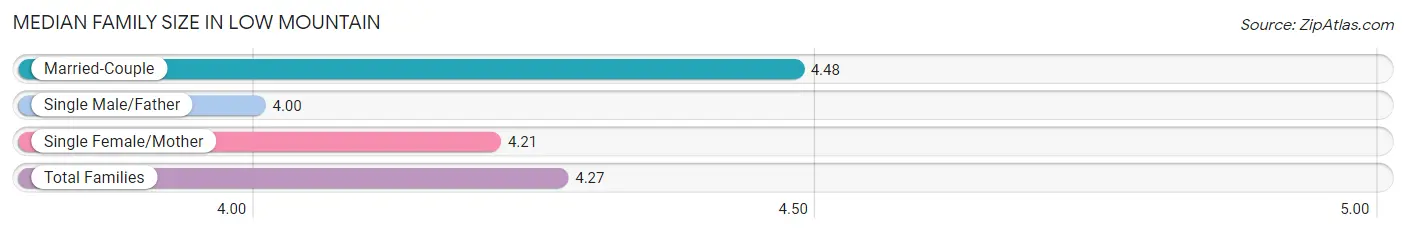
| Family Type | # Families | Family Size |
| Married-Couple | 42 (32.3%) | 4.48 |
| Single Male/Father | 16 (12.3%) | 4.00 |
| Single Female/Mother | 72 (55.4%) | 4.21 |
| Total Families | 130 (100.0%) | 4.27 |
Median Household Size in Low Mountain
The median household size in Low Mountain is 3.41 persons per household, with married-couple households (42 | 22.2%) accounting for the largest median household size of 4.48 persons per household. non-family households (59 | 31.2%) represent the smallest median household size with 1.17 persons per household.
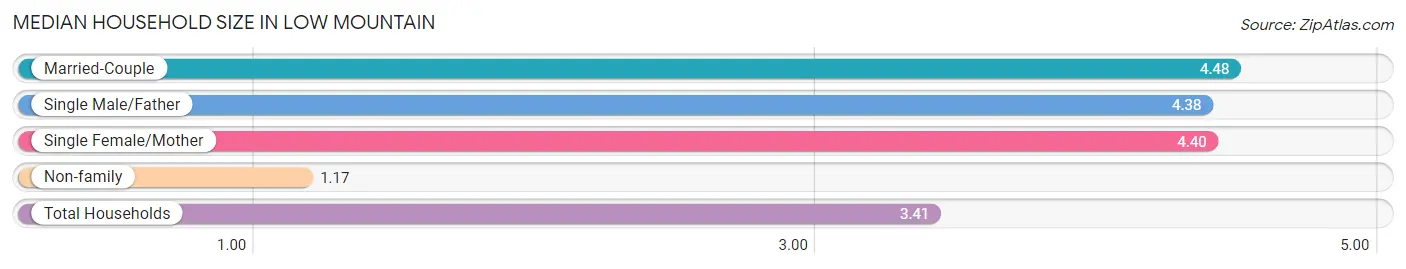
| Household Type | # Households | Household Size |
| Married-Couple | 42 (22.2%) | 4.48 |
| Single Male/Father | 16 (8.5%) | 4.38 |
| Single Female/Mother | 72 (38.1%) | 4.40 |
| Non-family | 59 (31.2%) | 1.17 |
| Total Households | 189 (100.0%) | 3.41 |
Household Size by Marriage Status in Low Mountain
Out of a total of 189 households in Low Mountain, 130 (68.8%) are family households, while 59 (31.2%) are nonfamily households. The most numerous type of family households are 4-person households, comprising 32, and the most common type of nonfamily households are 1-person households, comprising 46.
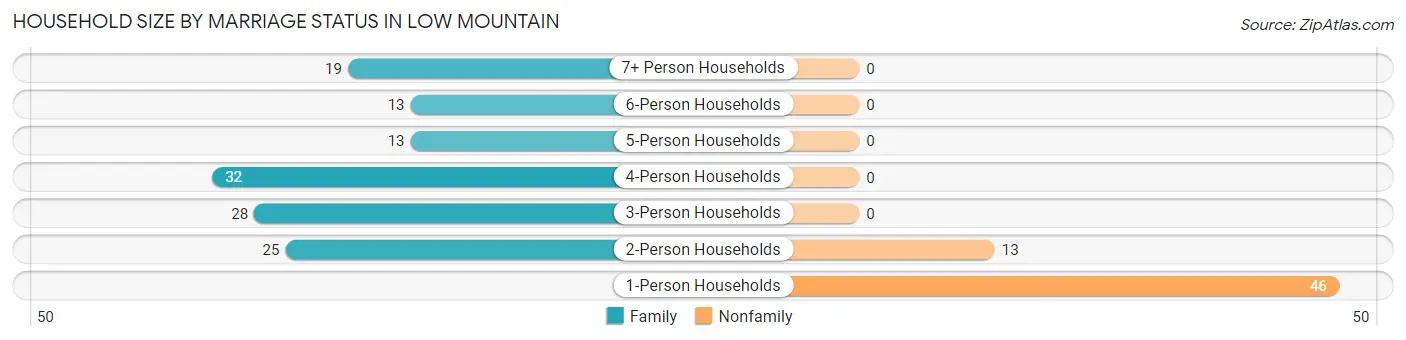
| Household Size | Family Households | Nonfamily Households |
| 1-Person Households | - | 46 (24.3%) |
| 2-Person Households | 25 (13.2%) | 13 (6.9%) |
| 3-Person Households | 28 (14.8%) | 0 (0.0%) |
| 4-Person Households | 32 (16.9%) | 0 (0.0%) |
| 5-Person Households | 13 (6.9%) | 0 (0.0%) |
| 6-Person Households | 13 (6.9%) | 0 (0.0%) |
| 7+ Person Households | 19 (10.1%) | 0 (0.0%) |
| Total | 130 (68.8%) | 59 (31.2%) |
Female Fertility in Low Mountain
Fertility by Age in Low Mountain
Average fertility rate in Low Mountain is 139.0 births per 1,000 women. Women in the age bracket of 20 to 34 years have the highest fertility rate with 323.0 births per 1,000 women. Women in the age bracket of 20 to 34 years acount for 100.0% of all women with births.
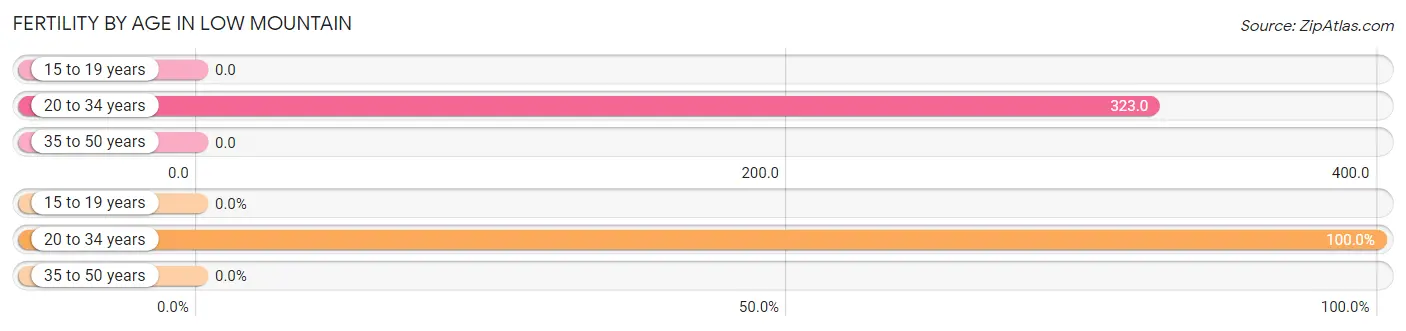
| Age Bracket | Women with Births | Births / 1,000 Women |
| 15 to 19 years | 0 (0.0%) | 0.0 |
| 20 to 34 years | 21 (100.0%) | 323.0 |
| 35 to 50 years | 0 (0.0%) | 0.0 |
| Total | 21 (100.0%) | 139.0 |
Fertility by Age by Marriage Status in Low Mountain
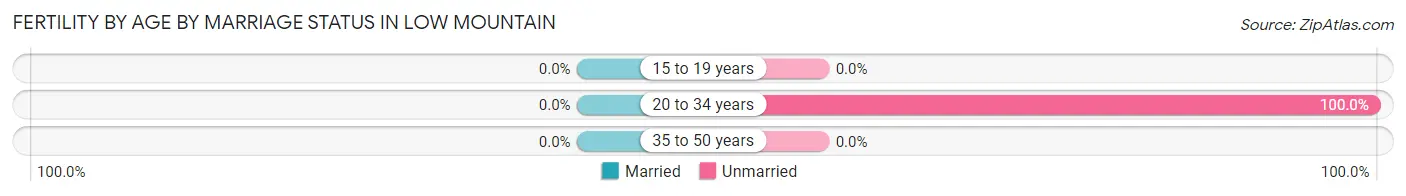
| Age Bracket | Married | Unmarried |
| 15 to 19 years | 0 (0.0%) | 0 (0.0%) |
| 20 to 34 years | 0 (0.0%) | 21 (100.0%) |
| 35 to 50 years | 0 (0.0%) | 0 (0.0%) |
| Total | 0 (0.0%) | 21 (100.0%) |
Fertility by Education in Low Mountain
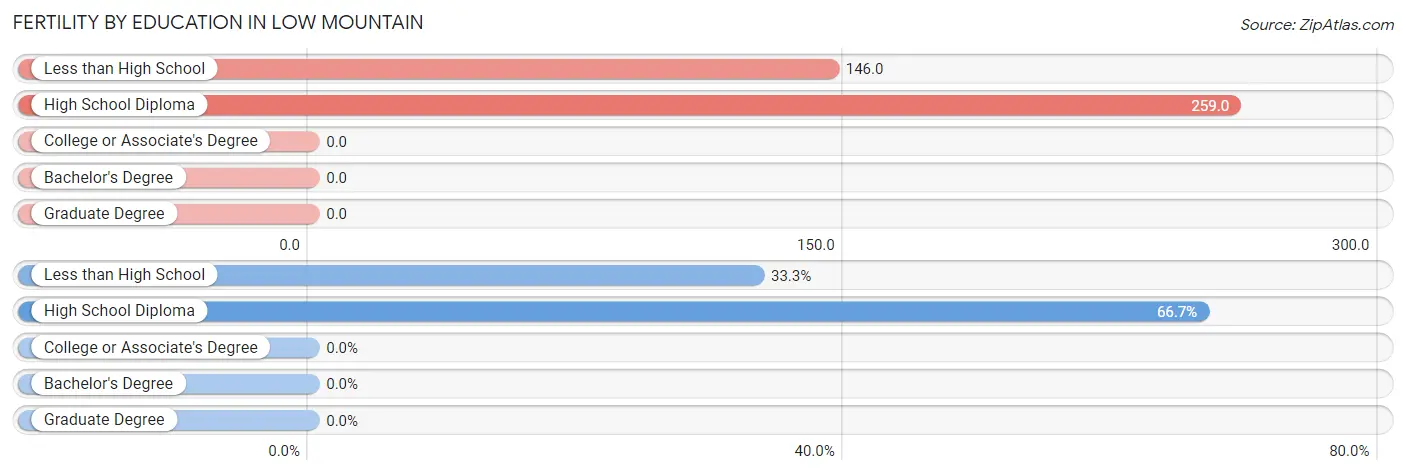
| Educational Attainment | Women with Births | Births / 1,000 Women |
| Less than High School | 7 (33.3%) | 146.0 |
| High School Diploma | 14 (66.7%) | 259.0 |
| College or Associate's Degree | 0 (0.0%) | 0.0 |
| Bachelor's Degree | 0 (0.0%) | 0.0 |
| Graduate Degree | 0 (0.0%) | 0.0 |
| Total | 21 (100.0%) | 139.0 |
Fertility by Education by Marriage Status in Low Mountain
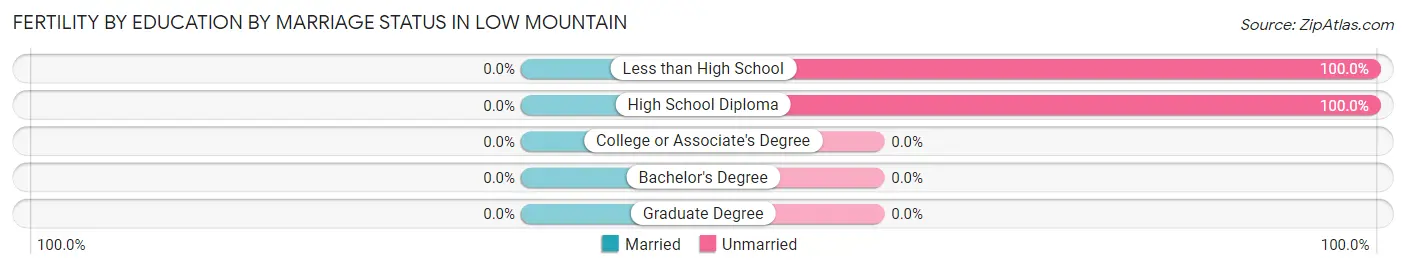
| Educational Attainment | Married | Unmarried |
| Less than High School | 0 (0.0%) | 7 (100.0%) |
| High School Diploma | 0 (0.0%) | 14 (100.0%) |
| College or Associate's Degree | 0 (0.0%) | 0 (0.0%) |
| Bachelor's Degree | 0 (0.0%) | 0 (0.0%) |
| Graduate Degree | 0 (0.0%) | 0 (0.0%) |
| Total | 0 (0.0%) | 21 (100.0%) |
Employment Characteristics in Low Mountain
Employment by Class of Employer in Low Mountain
Among the 108 employed individuals in Low Mountain, private company employees (51 | 47.2%), local government employees (36 | 33.3%), and not-for-profit organizations (10 | 9.3%) make up the most common classes of employment.
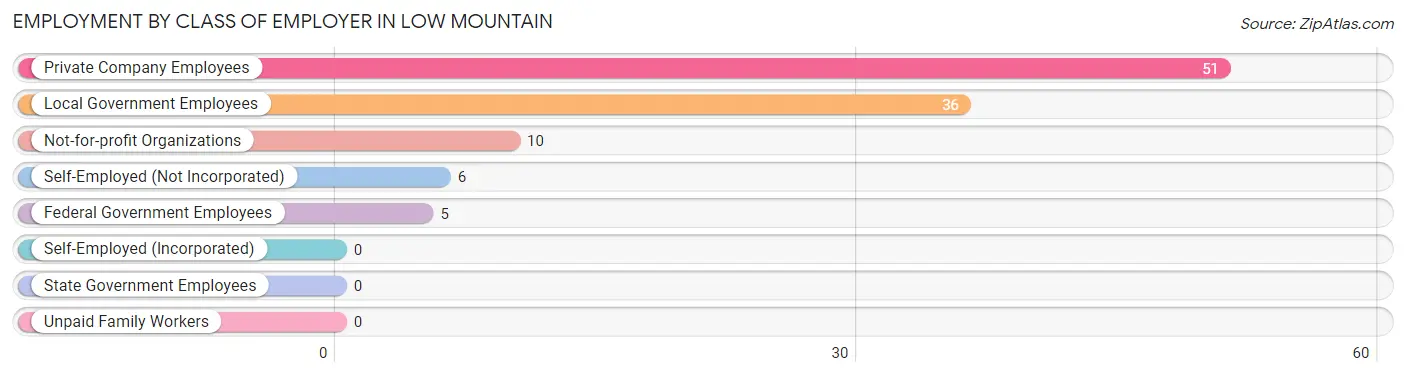
| Employer Class | # Employees | % Employees |
| Private Company Employees | 51 | 47.2% |
| Self-Employed (Incorporated) | 0 | 0.0% |
| Self-Employed (Not Incorporated) | 6 | 5.6% |
| Not-for-profit Organizations | 10 | 9.3% |
| Local Government Employees | 36 | 33.3% |
| State Government Employees | 0 | 0.0% |
| Federal Government Employees | 5 | 4.6% |
| Unpaid Family Workers | 0 | 0.0% |
| Total | 108 | 100.0% |
Employment Status by Age in Low Mountain
According to the labor force statistics for Low Mountain, out of the total population over 16 years of age (510), 35.3% or 180 individuals are in the labor force, with 36.7% or 66 of them unemployed. The age group with the highest labor force participation rate is 45 to 54 years, with 63.2% or 43 individuals in the labor force. Within the labor force, the 16 to 19 years age range has the highest percentage of unemployed individuals, with 100.0% or 11 of them being unemployed.
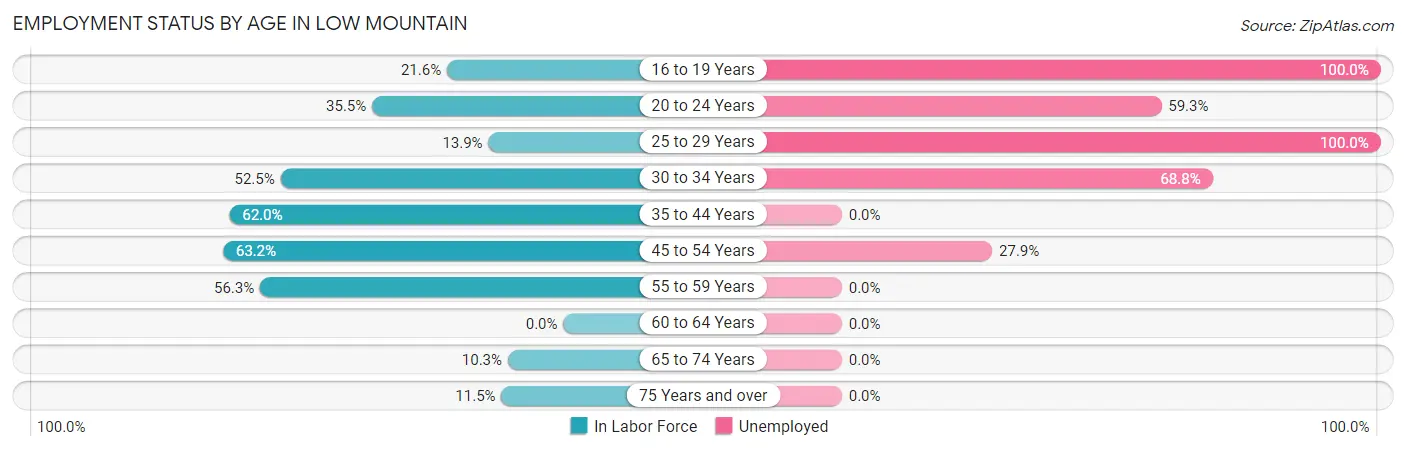
| Age Bracket | In Labor Force | Unemployed |
| 16 to 19 Years | 11 (21.6%) | 11 (100.0%) |
| 20 to 24 Years | 27 (35.5%) | 16 (59.3%) |
| 25 to 29 Years | 5 (13.9%) | 5 (100.0%) |
| 30 to 34 Years | 32 (52.5%) | 22 (68.8%) |
| 35 to 44 Years | 31 (62.0%) | 0 (0.0%) |
| 45 to 54 Years | 43 (63.2%) | 12 (27.9%) |
| 55 to 59 Years | 18 (56.3%) | 0 (0.0%) |
| 60 to 64 Years | 0 (0.0%) | 0 (0.0%) |
| 65 to 74 Years | 10 (10.3%) | 0 (0.0%) |
| 75 Years and over | 3 (11.5%) | 0 (0.0%) |
| Total | 180 (35.3%) | 66 (36.7%) |
Employment Status by Educational Attainment in Low Mountain
According to labor force statistics for Low Mountain, 49.6% of individuals (129) out of the total population between 25 and 64 years of age (260) are in the labor force, with 30.2% or 39 of them being unemployed. The group with the highest labor force participation rate are those with the educational attainment of college / associate degree, with 55.9% or 66 individuals in the labor force. Within the labor force, individuals with less than high school education have the highest percentage of unemployment, with 42.9% or 9 of them being unemployed.
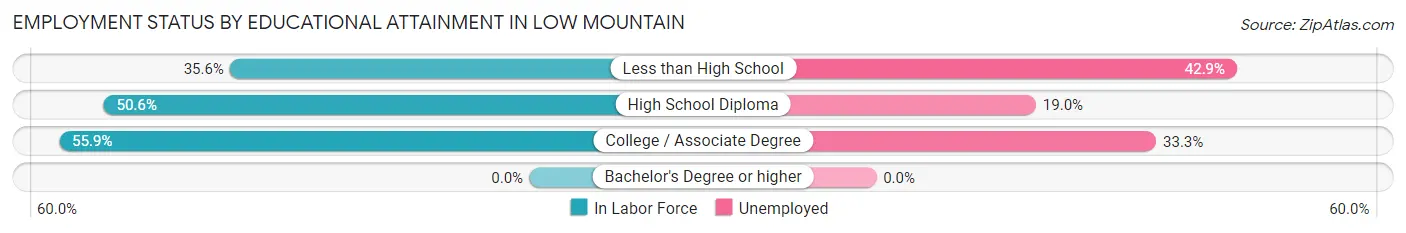
| Educational Attainment | In Labor Force | Unemployed |
| Less than High School | 21 (35.6%) | 25 (42.9%) |
| High School Diploma | 42 (50.6%) | 16 (19.0%) |
| College / Associate Degree | 66 (55.9%) | 39 (33.3%) |
| Bachelor's Degree or higher | 0 (0.0%) | 0 (0.0%) |
| Total | 129 (49.6%) | 79 (30.2%) |
Employment Occupations by Sex in Low Mountain
Management, Business, Science and Arts Occupations
The most common Management, Business, Science and Arts occupations in Low Mountain are Management (12 | 10.5%), Business & Financial (5 | 4.4%), Health Diagnosing & Treating (5 | 4.4%), Health Technologists (5 | 4.4%), and Community & Social Service (3 | 2.6%).
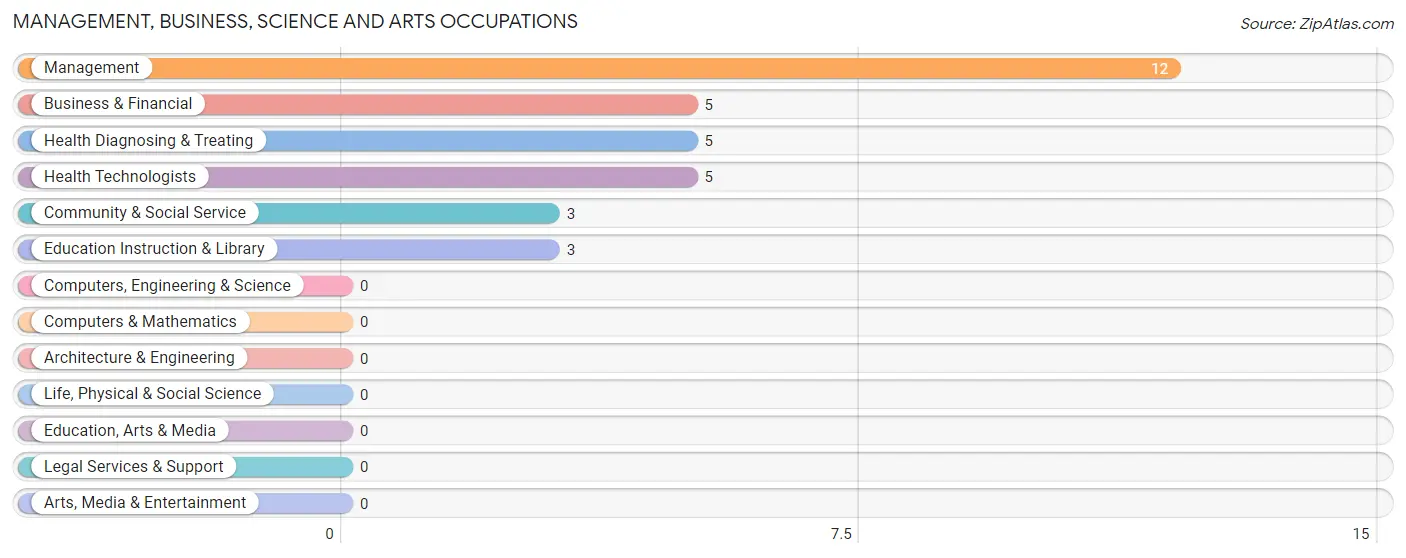
Management, Business, Science and Arts Occupations by Sex
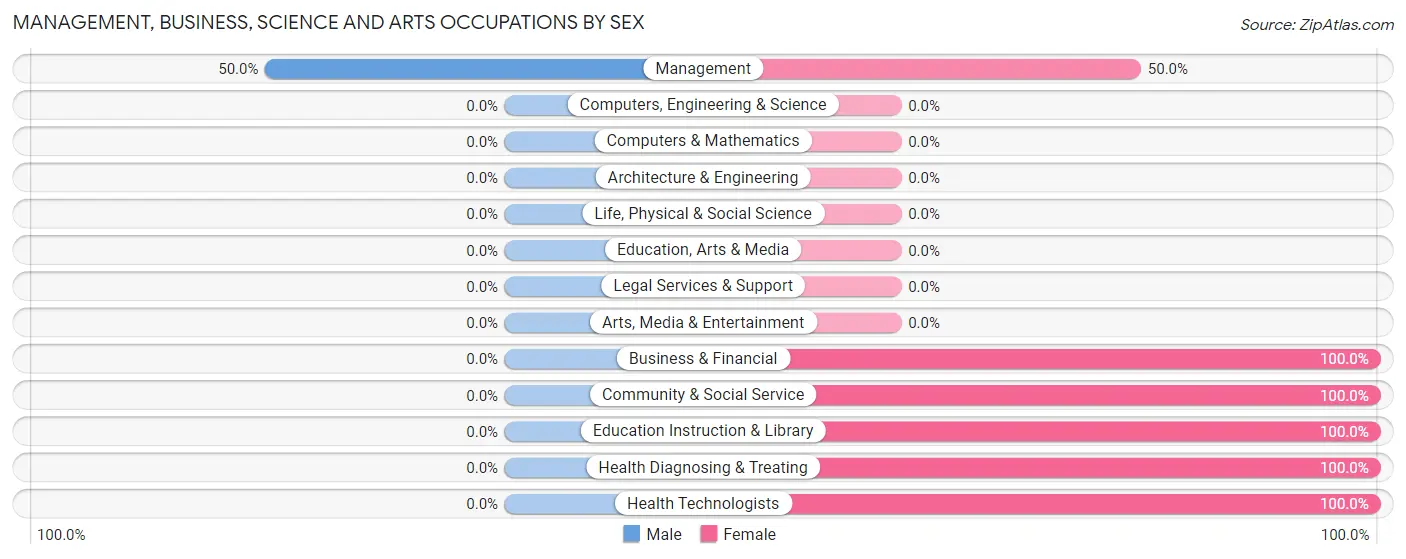
| Occupation | Male | Female |
| Management | 6 (50.0%) | 6 (50.0%) |
| Business & Financial | 0 (0.0%) | 5 (100.0%) |
| Computers, Engineering & Science | 0 (0.0%) | 0 (0.0%) |
| Computers & Mathematics | 0 (0.0%) | 0 (0.0%) |
| Architecture & Engineering | 0 (0.0%) | 0 (0.0%) |
| Life, Physical & Social Science | 0 (0.0%) | 0 (0.0%) |
| Community & Social Service | 0 (0.0%) | 3 (100.0%) |
| Education, Arts & Media | 0 (0.0%) | 0 (0.0%) |
| Legal Services & Support | 0 (0.0%) | 0 (0.0%) |
| Education Instruction & Library | 0 (0.0%) | 3 (100.0%) |
| Arts, Media & Entertainment | 0 (0.0%) | 0 (0.0%) |
| Health Diagnosing & Treating | 0 (0.0%) | 5 (100.0%) |
| Health Technologists | 0 (0.0%) | 5 (100.0%) |
| Total (Category) | 6 (24.0%) | 19 (76.0%) |
| Total (Overall) | 48 (42.1%) | 66 (57.9%) |
Services Occupations
The most common Services occupations in Low Mountain are Healthcare Support (14 | 12.3%), Personal Care & Service (10 | 8.8%), and Cleaning & Maintenance (6 | 5.3%).
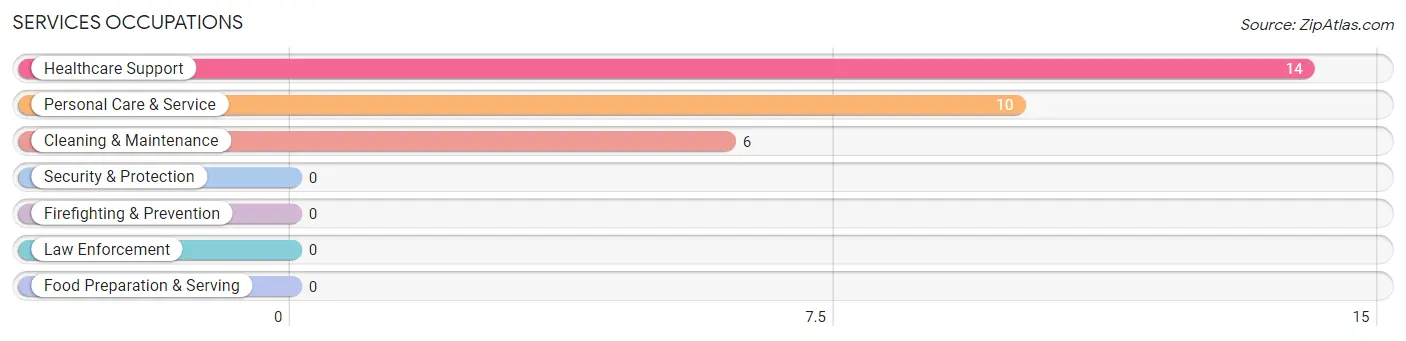
Services Occupations by Sex
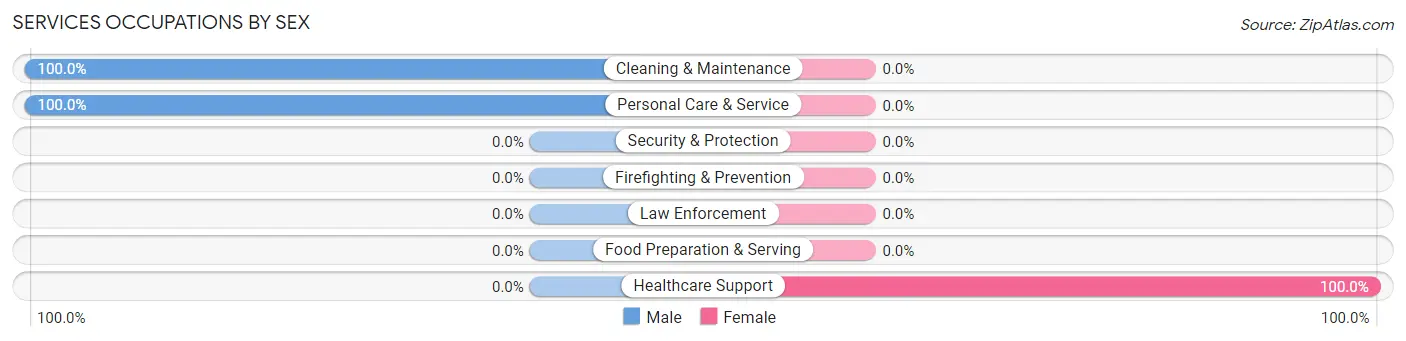
| Occupation | Male | Female |
| Healthcare Support | 0 (0.0%) | 14 (100.0%) |
| Security & Protection | 0 (0.0%) | 0 (0.0%) |
| Firefighting & Prevention | 0 (0.0%) | 0 (0.0%) |
| Law Enforcement | 0 (0.0%) | 0 (0.0%) |
| Food Preparation & Serving | 0 (0.0%) | 0 (0.0%) |
| Cleaning & Maintenance | 6 (100.0%) | 0 (0.0%) |
| Personal Care & Service | 10 (100.0%) | 0 (0.0%) |
| Total (Category) | 16 (53.3%) | 14 (46.7%) |
| Total (Overall) | 48 (42.1%) | 66 (57.9%) |
Sales and Office Occupations
The most common Sales and Office occupations in Low Mountain are , and Office & Administration (4 | 3.5%).
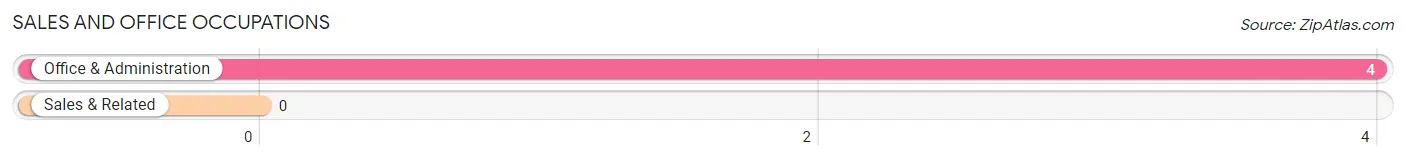
Sales and Office Occupations by Sex
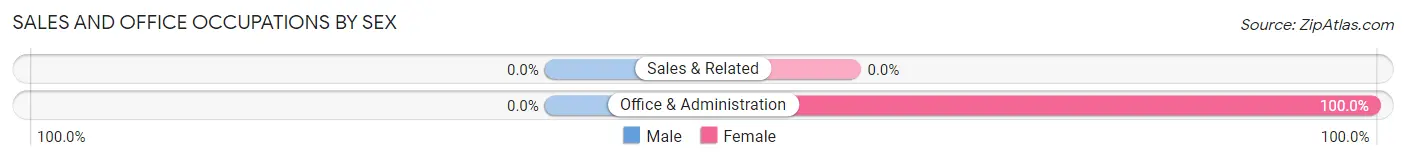
| Occupation | Male | Female |
| Sales & Related | 0 (0.0%) | 0 (0.0%) |
| Office & Administration | 0 (0.0%) | 4 (100.0%) |
| Total (Category) | 0 (0.0%) | 4 (100.0%) |
| Total (Overall) | 48 (42.1%) | 66 (57.9%) |
Natural Resources, Construction and Maintenance Occupations
The most common Natural Resources, Construction and Maintenance occupations in Low Mountain are , and Construction & Extraction (9 | 7.9%).
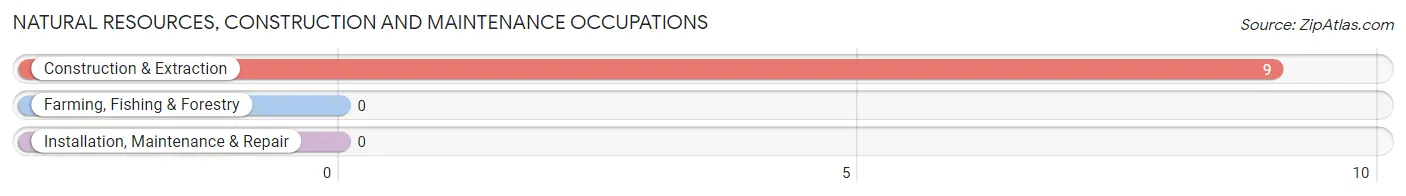
Natural Resources, Construction and Maintenance Occupations by Sex
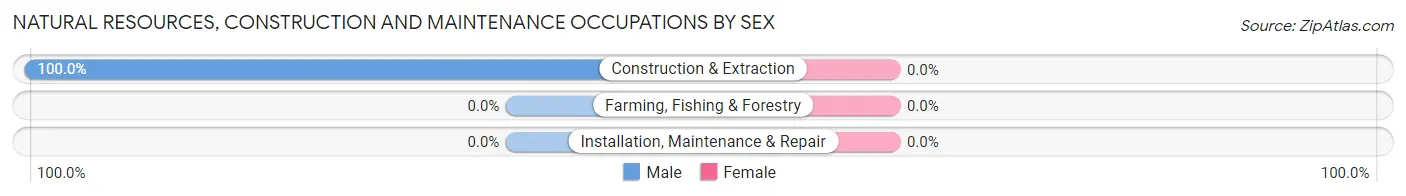
| Occupation | Male | Female |
| Farming, Fishing & Forestry | 0 (0.0%) | 0 (0.0%) |
| Construction & Extraction | 9 (100.0%) | 0 (0.0%) |
| Installation, Maintenance & Repair | 0 (0.0%) | 0 (0.0%) |
| Total (Category) | 9 (100.0%) | 0 (0.0%) |
| Total (Overall) | 48 (42.1%) | 66 (57.9%) |
Production, Transportation and Moving Occupations
The most common Production, Transportation and Moving occupations in Low Mountain are Transportation (39 | 34.2%), Production (4 | 3.5%), and Material Moving (3 | 2.6%).
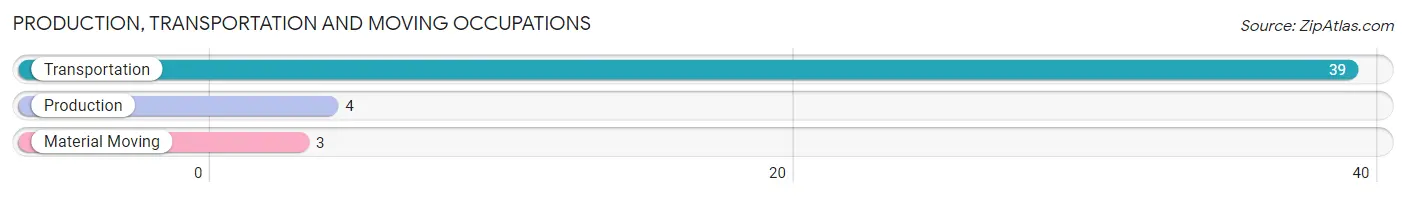
Production, Transportation and Moving Occupations by Sex
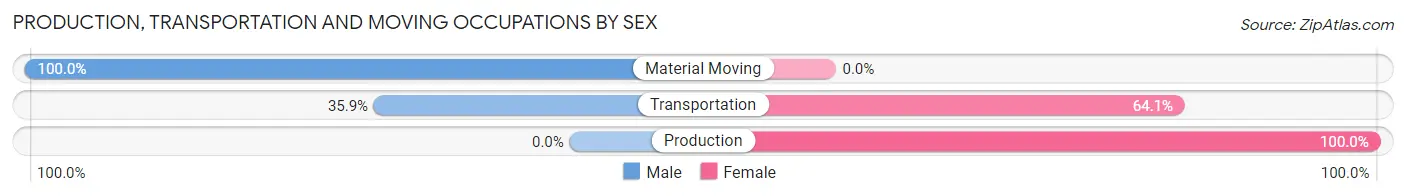
| Occupation | Male | Female |
| Production | 0 (0.0%) | 4 (100.0%) |
| Transportation | 14 (35.9%) | 25 (64.1%) |
| Material Moving | 3 (100.0%) | 0 (0.0%) |
| Total (Category) | 17 (37.0%) | 29 (63.0%) |
| Total (Overall) | 48 (42.1%) | 66 (57.9%) |
Employment Industries by Sex in Low Mountain
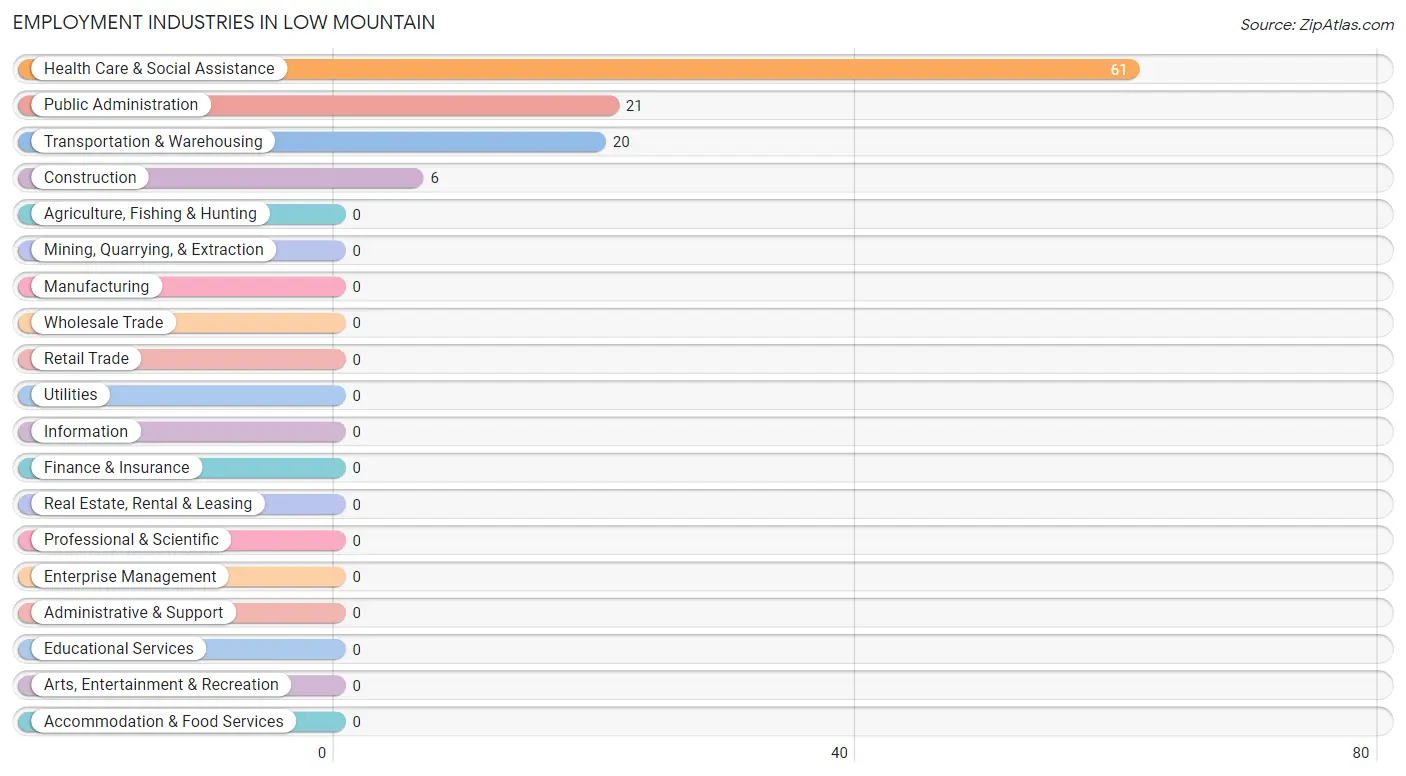
Employment Industries in Low Mountain
The major employment industries in Low Mountain include Health Care & Social Assistance (61 | 53.5%), Public Administration (21 | 18.4%), Transportation & Warehousing (20 | 17.5%), and Construction (6 | 5.3%).
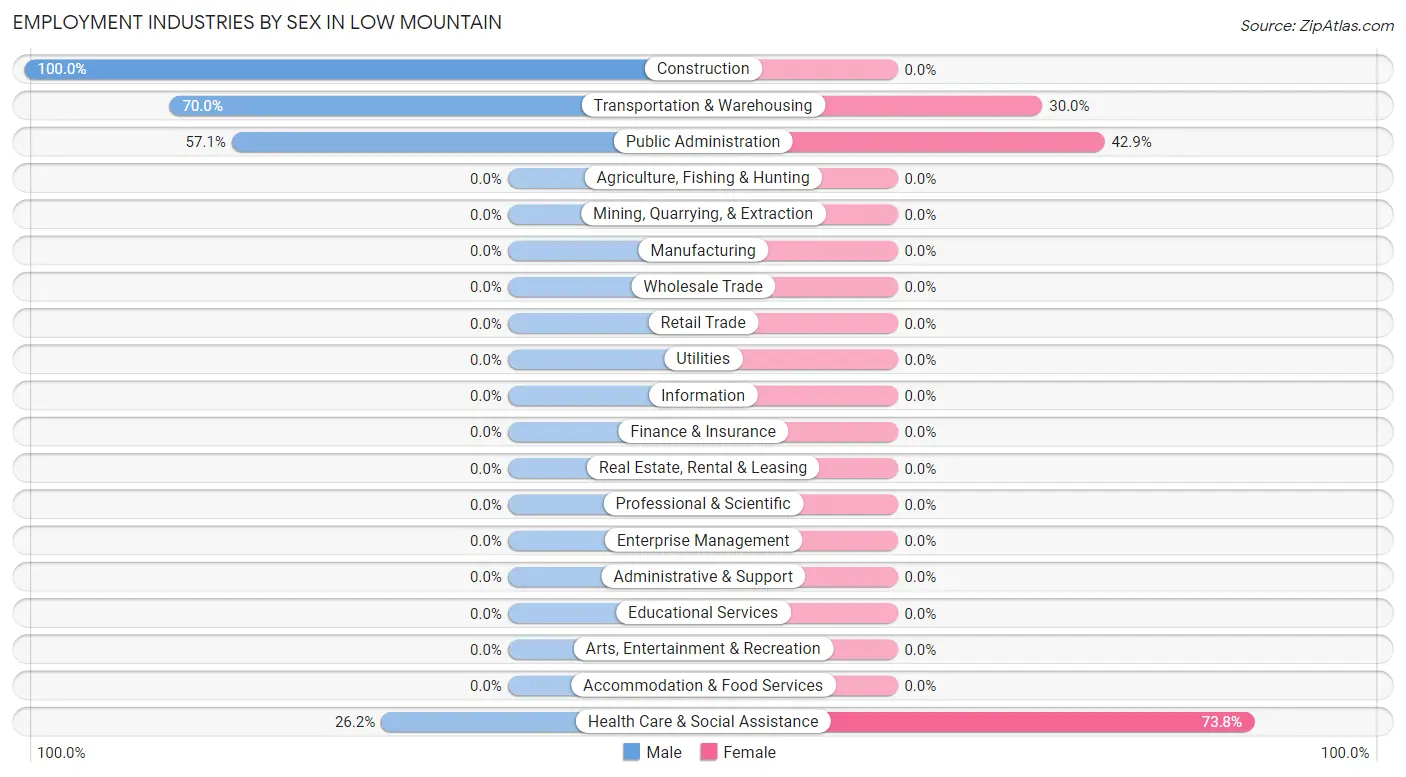
Employment Industries by Sex in Low Mountain
The Low Mountain industries that see more men than women are Construction (100.0%), Transportation & Warehousing (70.0%), and Public Administration (57.1%), whereas the industries that tend to have a higher number of women are Health Care & Social Assistance (73.8%), Public Administration (42.9%), and Transportation & Warehousing (30.0%).
| Industry | Male | Female |
| Agriculture, Fishing & Hunting | 0 (0.0%) | 0 (0.0%) |
| Mining, Quarrying, & Extraction | 0 (0.0%) | 0 (0.0%) |
| Construction | 6 (100.0%) | 0 (0.0%) |
| Manufacturing | 0 (0.0%) | 0 (0.0%) |
| Wholesale Trade | 0 (0.0%) | 0 (0.0%) |
| Retail Trade | 0 (0.0%) | 0 (0.0%) |
| Transportation & Warehousing | 14 (70.0%) | 6 (30.0%) |
| Utilities | 0 (0.0%) | 0 (0.0%) |
| Information | 0 (0.0%) | 0 (0.0%) |
| Finance & Insurance | 0 (0.0%) | 0 (0.0%) |
| Real Estate, Rental & Leasing | 0 (0.0%) | 0 (0.0%) |
| Professional & Scientific | 0 (0.0%) | 0 (0.0%) |
| Enterprise Management | 0 (0.0%) | 0 (0.0%) |
| Administrative & Support | 0 (0.0%) | 0 (0.0%) |
| Educational Services | 0 (0.0%) | 0 (0.0%) |
| Health Care & Social Assistance | 16 (26.2%) | 45 (73.8%) |
| Arts, Entertainment & Recreation | 0 (0.0%) | 0 (0.0%) |
| Accommodation & Food Services | 0 (0.0%) | 0 (0.0%) |
| Public Administration | 12 (57.1%) | 9 (42.9%) |
| Total | 48 (42.1%) | 66 (57.9%) |
Education in Low Mountain
School Enrollment in Low Mountain
The most common levels of schooling among the 146 students in Low Mountain are high school (41 | 28.1%), elementary school (36 | 24.7%), and middle school (35 | 24.0%).
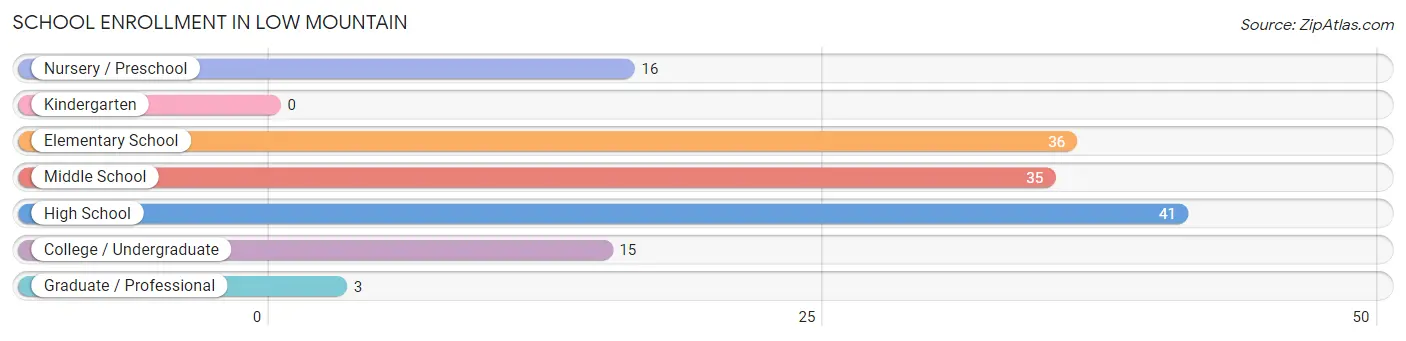
| School Level | # Students | % Students |
| Nursery / Preschool | 16 | 11.0% |
| Kindergarten | 0 | 0.0% |
| Elementary School | 36 | 24.7% |
| Middle School | 35 | 24.0% |
| High School | 41 | 28.1% |
| College / Undergraduate | 15 | 10.3% |
| Graduate / Professional | 3 | 2.1% |
| Total | 146 | 100.0% |
School Enrollment by Age by Funding Source in Low Mountain
Out of a total of 146 students who are enrolled in schools in Low Mountain, 5 (3.4%) attend a private institution, while the remaining 141 (96.6%) are enrolled in public schools. The age group of 15 to 17 year olds has the highest likelihood of being enrolled in private schools, with 5 (15.1% in the age bracket) enrolled. Conversely, the age group of 3 to 4 year olds has the lowest likelihood of being enrolled in a private school, with 10 (100.0% in the age bracket) attending a public institution.
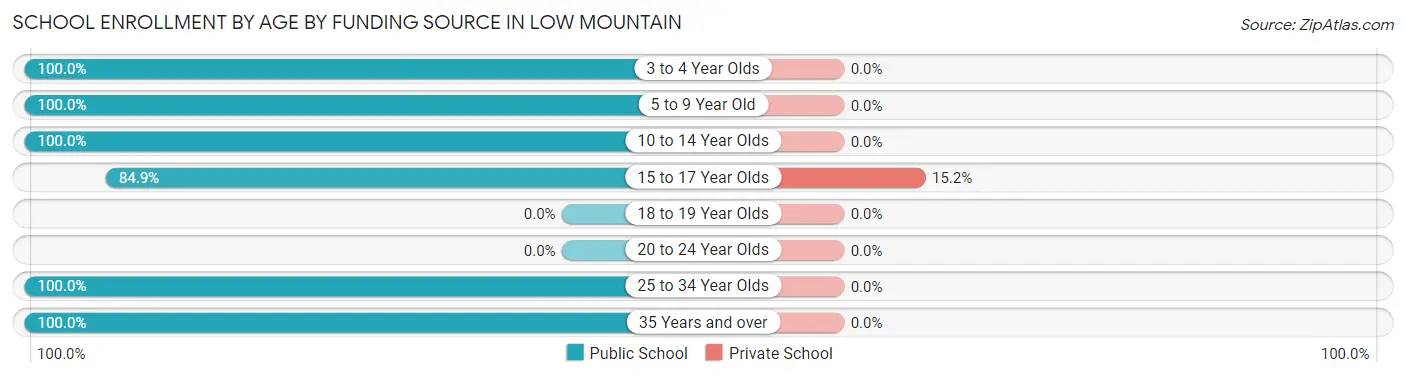
| Age Bracket | Public School | Private School |
| 3 to 4 Year Olds | 10 (100.0%) | 0 (0.0%) |
| 5 to 9 Year Old | 46 (100.0%) | 0 (0.0%) |
| 10 to 14 Year Olds | 39 (100.0%) | 0 (0.0%) |
| 15 to 17 Year Olds | 28 (84.9%) | 5 (15.1%) |
| 18 to 19 Year Olds | 0 (0.0%) | 0 (0.0%) |
| 20 to 24 Year Olds | 0 (0.0%) | 0 (0.0%) |
| 25 to 34 Year Olds | 15 (100.0%) | 0 (0.0%) |
| 35 Years and over | 3 (100.0%) | 0 (0.0%) |
| Total | 141 (96.6%) | 5 (3.4%) |
Educational Attainment by Field of Study in Low Mountain
, and physical & health sciences (3 | 100.0%) are the most common fields of study among 3 individuals in Low Mountain who have obtained a bachelor's degree or higher.
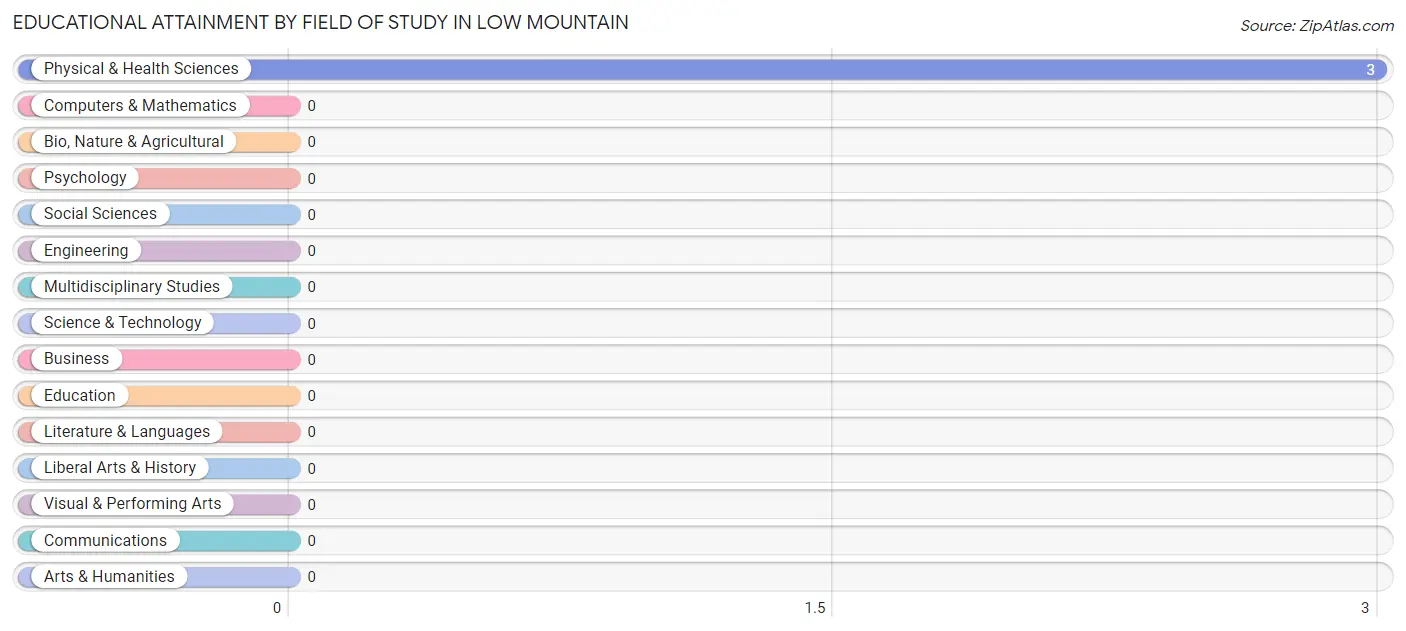
| Field of Study | # Graduates | % Graduates |
| Computers & Mathematics | 0 | 0.0% |
| Bio, Nature & Agricultural | 0 | 0.0% |
| Physical & Health Sciences | 3 | 100.0% |
| Psychology | 0 | 0.0% |
| Social Sciences | 0 | 0.0% |
| Engineering | 0 | 0.0% |
| Multidisciplinary Studies | 0 | 0.0% |
| Science & Technology | 0 | 0.0% |
| Business | 0 | 0.0% |
| Education | 0 | 0.0% |
| Literature & Languages | 0 | 0.0% |
| Liberal Arts & History | 0 | 0.0% |
| Visual & Performing Arts | 0 | 0.0% |
| Communications | 0 | 0.0% |
| Arts & Humanities | 0 | 0.0% |
| Total | 3 | 100.0% |
Transportation & Commute in Low Mountain
Vehicle Availability by Sex in Low Mountain
The most prevalent vehicle ownership categories in Low Mountain are males with 3 vehicles (16, accounting for 35.6%) and females with 3 vehicles (14, making up 25.4%).
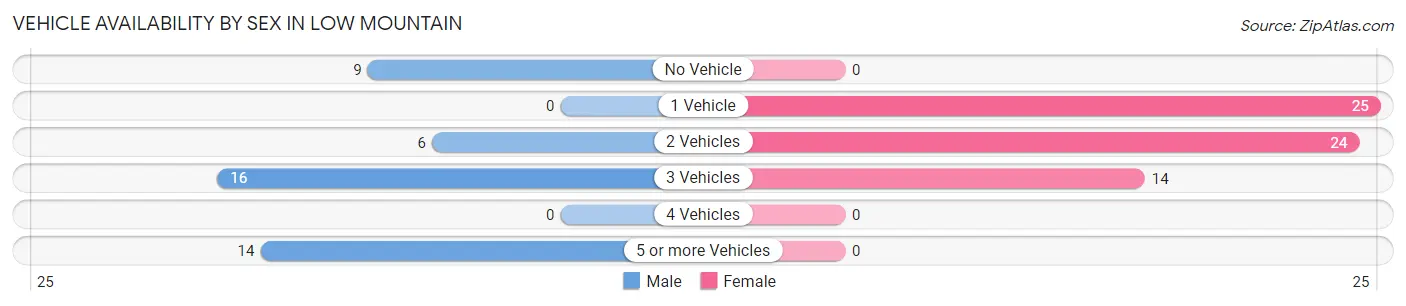
| Vehicles Available | Male | Female |
| No Vehicle | 9 (20.0%) | 0 (0.0%) |
| 1 Vehicle | 0 (0.0%) | 25 (39.7%) |
| 2 Vehicles | 6 (13.3%) | 24 (38.1%) |
| 3 Vehicles | 16 (35.6%) | 14 (22.2%) |
| 4 Vehicles | 0 (0.0%) | 0 (0.0%) |
| 5 or more Vehicles | 14 (31.1%) | 0 (0.0%) |
| Total | 45 (100.0%) | 63 (100.0%) |
Commute Time in Low Mountain
The most frequently occuring commute durations in Low Mountain are 30 to 34 minutes (39 commuters, 47.0%), 25 to 29 minutes (10 commuters, 12.0%), and 5 to 9 minutes (7 commuters, 8.4%).
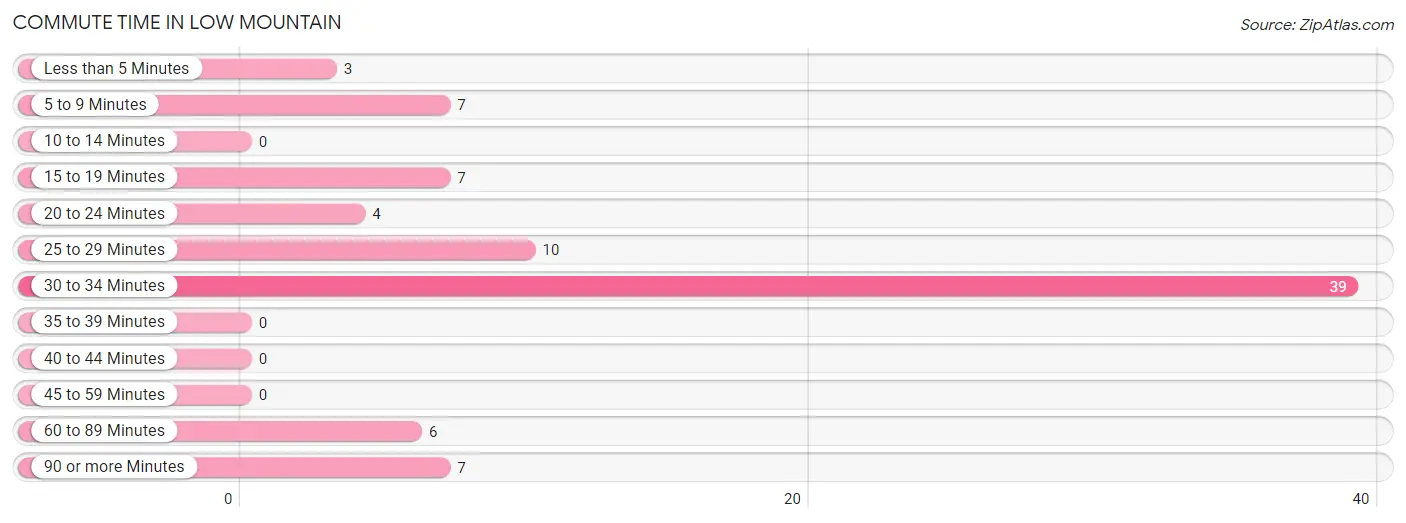
| Commute Time | # Commuters | % Commuters |
| Less than 5 Minutes | 3 | 3.6% |
| 5 to 9 Minutes | 7 | 8.4% |
| 10 to 14 Minutes | 0 | 0.0% |
| 15 to 19 Minutes | 7 | 8.4% |
| 20 to 24 Minutes | 4 | 4.8% |
| 25 to 29 Minutes | 10 | 12.0% |
| 30 to 34 Minutes | 39 | 47.0% |
| 35 to 39 Minutes | 0 | 0.0% |
| 40 to 44 Minutes | 0 | 0.0% |
| 45 to 59 Minutes | 0 | 0.0% |
| 60 to 89 Minutes | 6 | 7.2% |
| 90 or more Minutes | 7 | 8.4% |
Commute Time by Sex in Low Mountain
The most common commute times in Low Mountain are 30 to 34 minutes (16 commuters, 51.6%) for males and 30 to 34 minutes (23 commuters, 44.2%) for females.
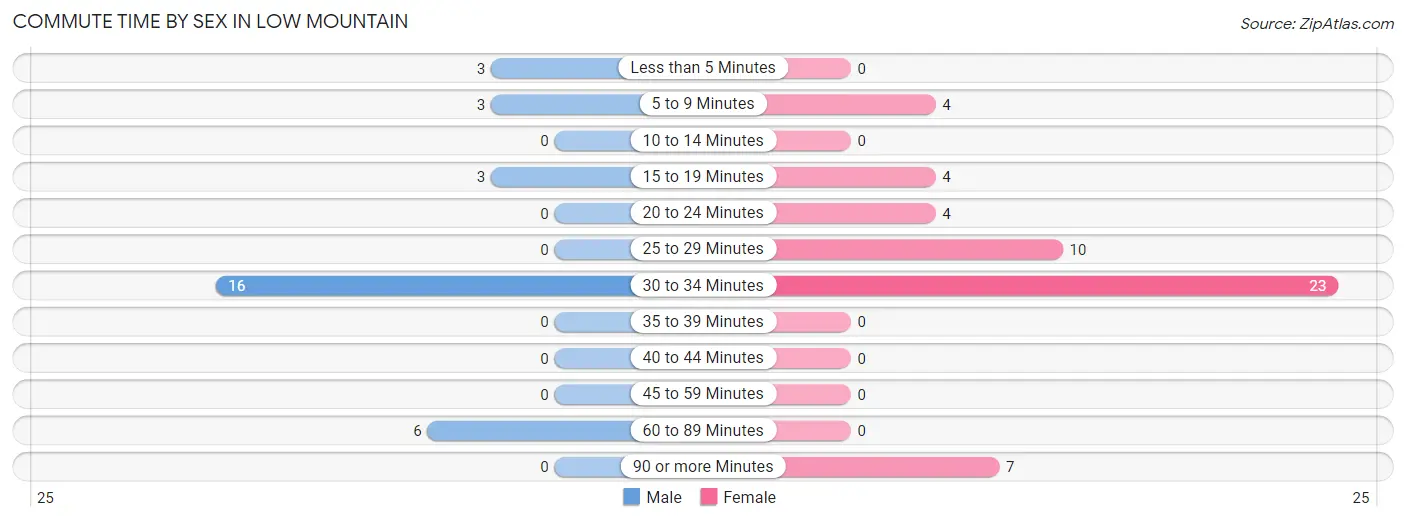
| Commute Time | Male | Female |
| Less than 5 Minutes | 3 (9.7%) | 0 (0.0%) |
| 5 to 9 Minutes | 3 (9.7%) | 4 (7.7%) |
| 10 to 14 Minutes | 0 (0.0%) | 0 (0.0%) |
| 15 to 19 Minutes | 3 (9.7%) | 4 (7.7%) |
| 20 to 24 Minutes | 0 (0.0%) | 4 (7.7%) |
| 25 to 29 Minutes | 0 (0.0%) | 10 (19.2%) |
| 30 to 34 Minutes | 16 (51.6%) | 23 (44.2%) |
| 35 to 39 Minutes | 0 (0.0%) | 0 (0.0%) |
| 40 to 44 Minutes | 0 (0.0%) | 0 (0.0%) |
| 45 to 59 Minutes | 0 (0.0%) | 0 (0.0%) |
| 60 to 89 Minutes | 6 (19.4%) | 0 (0.0%) |
| 90 or more Minutes | 0 (0.0%) | 7 (13.5%) |
Time of Departure to Work by Sex in Low Mountain
The most frequent times of departure to work in Low Mountain are 7:00 AM to 7:29 AM (10, 32.3%) for males and 7:30 AM to 7:59 AM (31, 59.6%) for females.
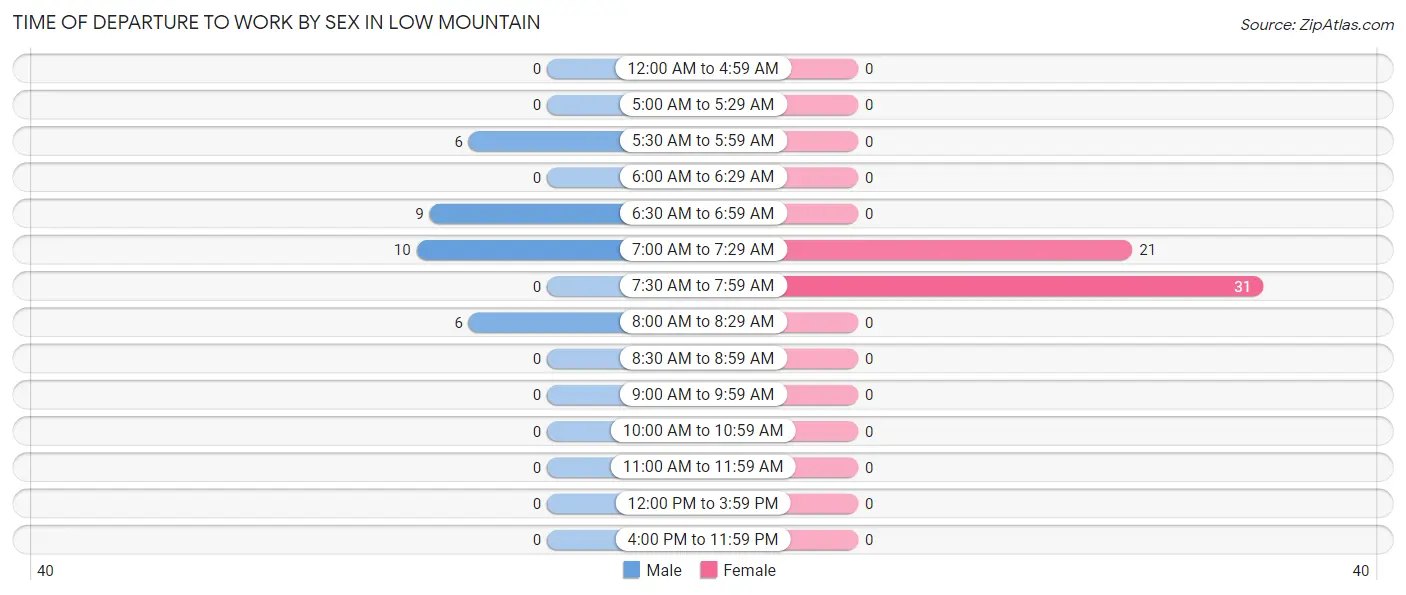
| Time of Departure | Male | Female |
| 12:00 AM to 4:59 AM | 0 (0.0%) | 0 (0.0%) |
| 5:00 AM to 5:29 AM | 0 (0.0%) | 0 (0.0%) |
| 5:30 AM to 5:59 AM | 6 (19.4%) | 0 (0.0%) |
| 6:00 AM to 6:29 AM | 0 (0.0%) | 0 (0.0%) |
| 6:30 AM to 6:59 AM | 9 (29.0%) | 0 (0.0%) |
| 7:00 AM to 7:29 AM | 10 (32.3%) | 21 (40.4%) |
| 7:30 AM to 7:59 AM | 0 (0.0%) | 31 (59.6%) |
| 8:00 AM to 8:29 AM | 6 (19.4%) | 0 (0.0%) |
| 8:30 AM to 8:59 AM | 0 (0.0%) | 0 (0.0%) |
| 9:00 AM to 9:59 AM | 0 (0.0%) | 0 (0.0%) |
| 10:00 AM to 10:59 AM | 0 (0.0%) | 0 (0.0%) |
| 11:00 AM to 11:59 AM | 0 (0.0%) | 0 (0.0%) |
| 12:00 PM to 3:59 PM | 0 (0.0%) | 0 (0.0%) |
| 4:00 PM to 11:59 PM | 0 (0.0%) | 0 (0.0%) |
| Total | 31 (100.0%) | 52 (100.0%) |
Housing Occupancy in Low Mountain
Occupancy by Ownership in Low Mountain
Of the total 189 dwellings in Low Mountain, owner-occupied units account for 172 (91.0%), while renter-occupied units make up 17 (9.0%).
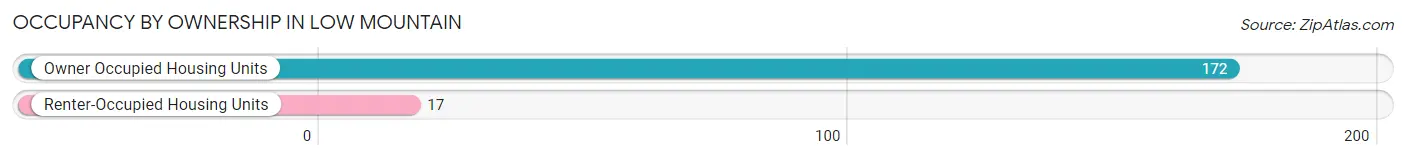
| Occupancy | # Housing Units | % Housing Units |
| Owner Occupied Housing Units | 172 | 91.0% |
| Renter-Occupied Housing Units | 17 | 9.0% |
| Total Occupied Housing Units | 189 | 100.0% |
Occupancy by Household Size in Low Mountain
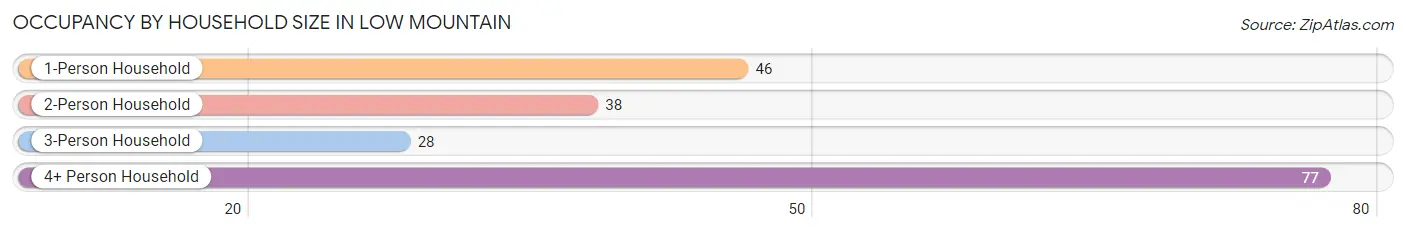
| Household Size | # Housing Units | % Housing Units |
| 1-Person Household | 46 | 24.3% |
| 2-Person Household | 38 | 20.1% |
| 3-Person Household | 28 | 14.8% |
| 4+ Person Household | 77 | 40.7% |
| Total Housing Units | 189 | 100.0% |
Occupancy by Ownership by Household Size in Low Mountain
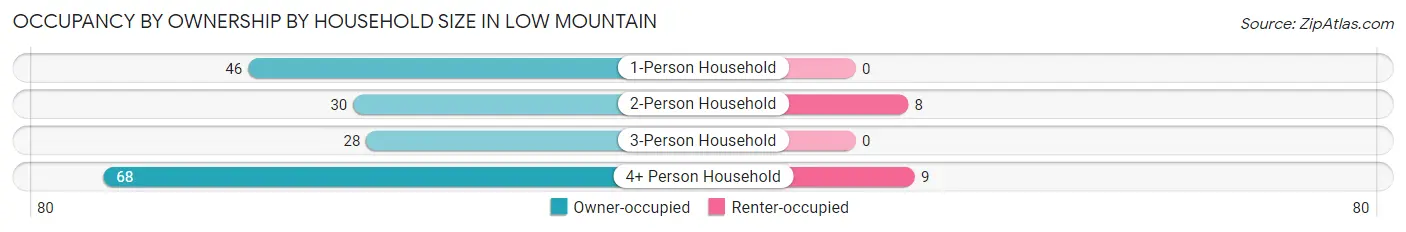
| Household Size | Owner-occupied | Renter-occupied |
| 1-Person Household | 46 (100.0%) | 0 (0.0%) |
| 2-Person Household | 30 (78.9%) | 8 (21.0%) |
| 3-Person Household | 28 (100.0%) | 0 (0.0%) |
| 4+ Person Household | 68 (88.3%) | 9 (11.7%) |
| Total Housing Units | 172 (91.0%) | 17 (9.0%) |
Occupancy by Educational Attainment in Low Mountain
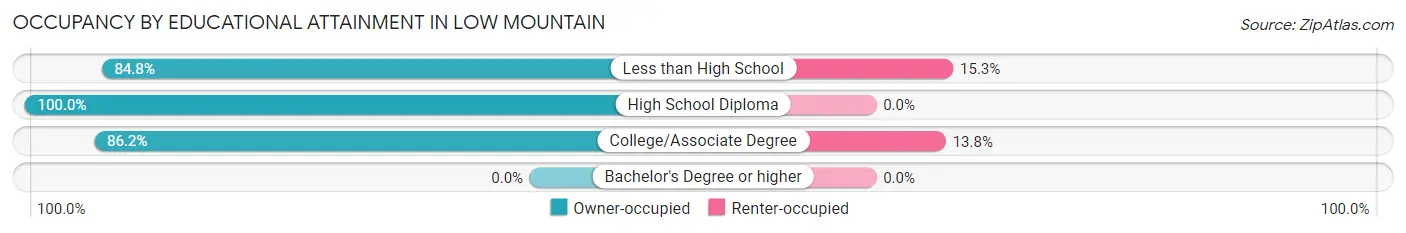
| Household Size | Owner-occupied | Renter-occupied |
| Less than High School | 50 (84.8%) | 9 (15.2%) |
| High School Diploma | 72 (100.0%) | 0 (0.0%) |
| College/Associate Degree | 50 (86.2%) | 8 (13.8%) |
| Bachelor's Degree or higher | 0 (0.0%) | 0 (0.0%) |
Occupancy by Age of Householder in Low Mountain
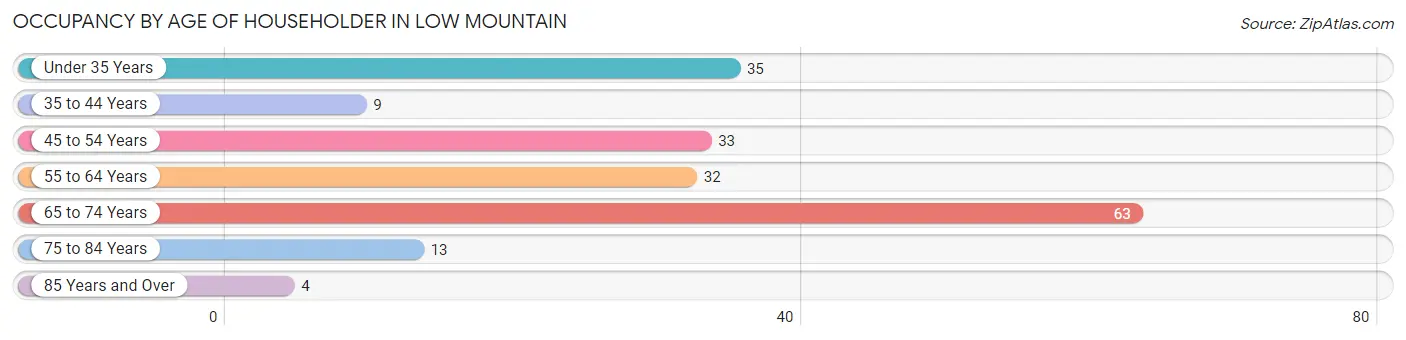
| Age Bracket | # Households | % Households |
| Under 35 Years | 35 | 18.5% |
| 35 to 44 Years | 9 | 4.8% |
| 45 to 54 Years | 33 | 17.5% |
| 55 to 64 Years | 32 | 16.9% |
| 65 to 74 Years | 63 | 33.3% |
| 75 to 84 Years | 13 | 6.9% |
| 85 Years and Over | 4 | 2.1% |
| Total | 189 | 100.0% |
Housing Finances in Low Mountain
Median Income by Occupancy in Low Mountain
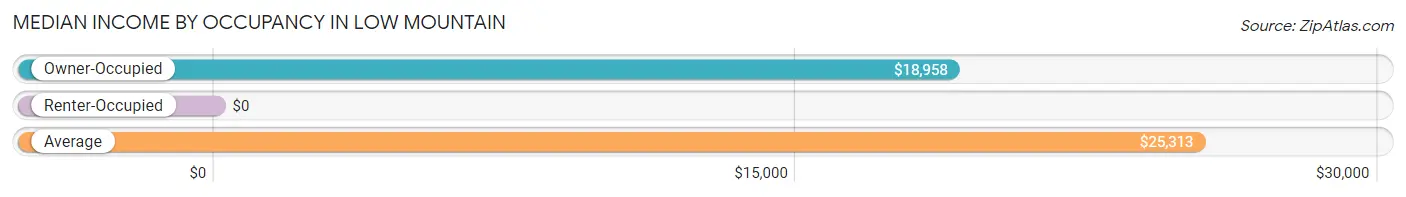
| Occupancy Type | # Households | Median Income |
| Owner-Occupied | 172 (91.0%) | $18,958 |
| Renter-Occupied | 17 (9.0%) | $0 |
| Average | 189 (100.0%) | $25,313 |
Occupancy by Householder Income Bracket in Low Mountain
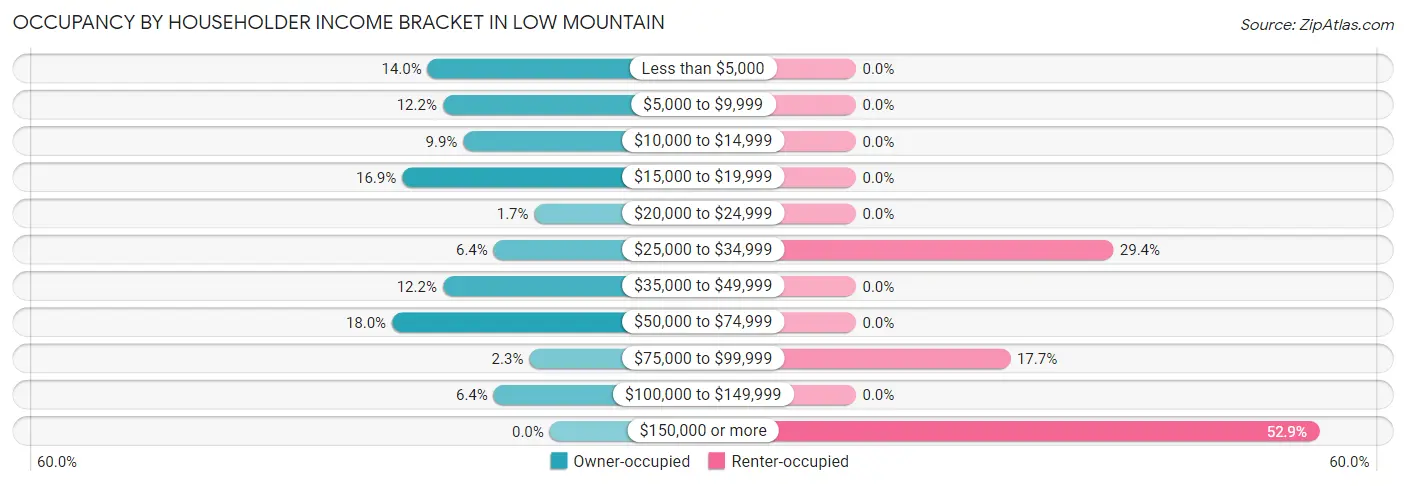
| Income Bracket | Owner-occupied | Renter-occupied |
| Less than $5,000 | 24 (14.0%) | 0 (0.0%) |
| $5,000 to $9,999 | 21 (12.2%) | 0 (0.0%) |
| $10,000 to $14,999 | 17 (9.9%) | 0 (0.0%) |
| $15,000 to $19,999 | 29 (16.9%) | 0 (0.0%) |
| $20,000 to $24,999 | 3 (1.7%) | 0 (0.0%) |
| $25,000 to $34,999 | 11 (6.4%) | 5 (29.4%) |
| $35,000 to $49,999 | 21 (12.2%) | 0 (0.0%) |
| $50,000 to $74,999 | 31 (18.0%) | 0 (0.0%) |
| $75,000 to $99,999 | 4 (2.3%) | 3 (17.6%) |
| $100,000 to $149,999 | 11 (6.4%) | 0 (0.0%) |
| $150,000 or more | 0 (0.0%) | 9 (52.9%) |
| Total | 172 (100.0%) | 17 (100.0%) |
Monthly Housing Cost Tiers in Low Mountain
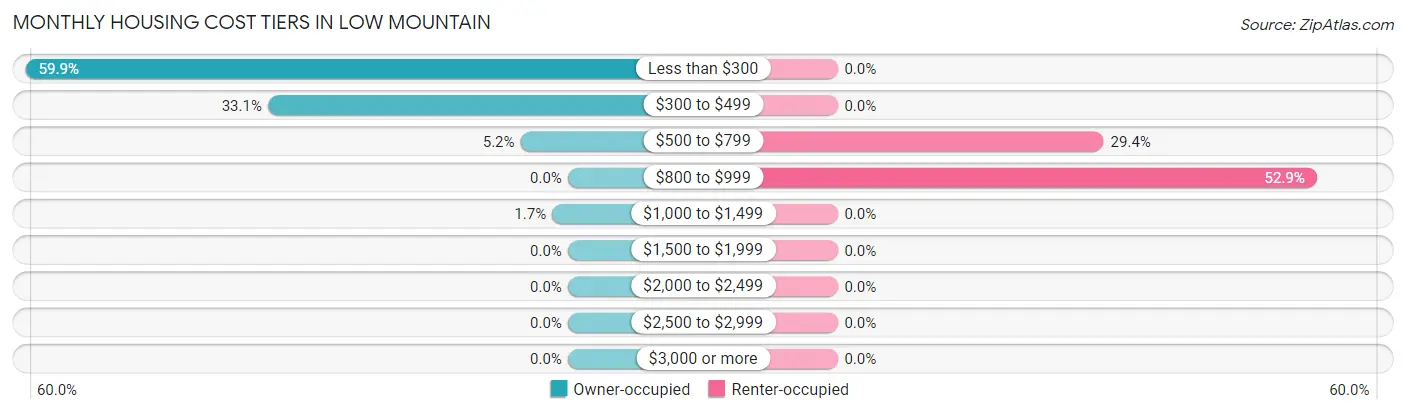
| Monthly Cost | Owner-occupied | Renter-occupied |
| Less than $300 | 103 (59.9%) | 0 (0.0%) |
| $300 to $499 | 57 (33.1%) | 0 (0.0%) |
| $500 to $799 | 9 (5.2%) | 5 (29.4%) |
| $800 to $999 | 0 (0.0%) | 9 (52.9%) |
| $1,000 to $1,499 | 3 (1.7%) | 0 (0.0%) |
| $1,500 to $1,999 | 0 (0.0%) | 0 (0.0%) |
| $2,000 to $2,499 | 0 (0.0%) | 0 (0.0%) |
| $2,500 to $2,999 | 0 (0.0%) | 0 (0.0%) |
| $3,000 or more | 0 (0.0%) | 0 (0.0%) |
| Total | 172 (100.0%) | 17 (100.0%) |
Physical Housing Characteristics in Low Mountain
Housing Structures in Low Mountain
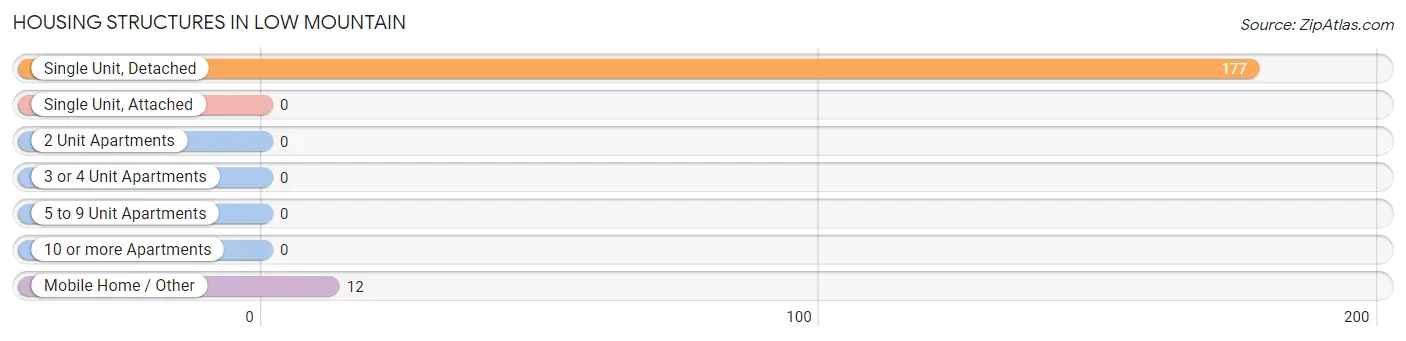
| Structure Type | # Housing Units | % Housing Units |
| Single Unit, Detached | 177 | 93.6% |
| Single Unit, Attached | 0 | 0.0% |
| 2 Unit Apartments | 0 | 0.0% |
| 3 or 4 Unit Apartments | 0 | 0.0% |
| 5 to 9 Unit Apartments | 0 | 0.0% |
| 10 or more Apartments | 0 | 0.0% |
| Mobile Home / Other | 12 | 6.4% |
| Total | 189 | 100.0% |
Housing Structures by Occupancy in Low Mountain
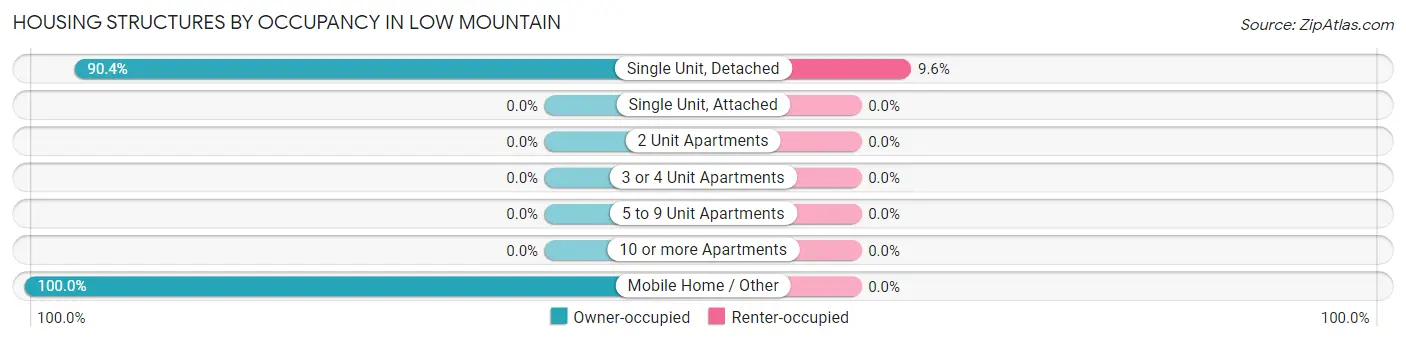
| Structure Type | Owner-occupied | Renter-occupied |
| Single Unit, Detached | 160 (90.4%) | 17 (9.6%) |
| Single Unit, Attached | 0 (0.0%) | 0 (0.0%) |
| 2 Unit Apartments | 0 (0.0%) | 0 (0.0%) |
| 3 or 4 Unit Apartments | 0 (0.0%) | 0 (0.0%) |
| 5 to 9 Unit Apartments | 0 (0.0%) | 0 (0.0%) |
| 10 or more Apartments | 0 (0.0%) | 0 (0.0%) |
| Mobile Home / Other | 12 (100.0%) | 0 (0.0%) |
| Total | 172 (91.0%) | 17 (9.0%) |
Housing Structures by Number of Rooms in Low Mountain
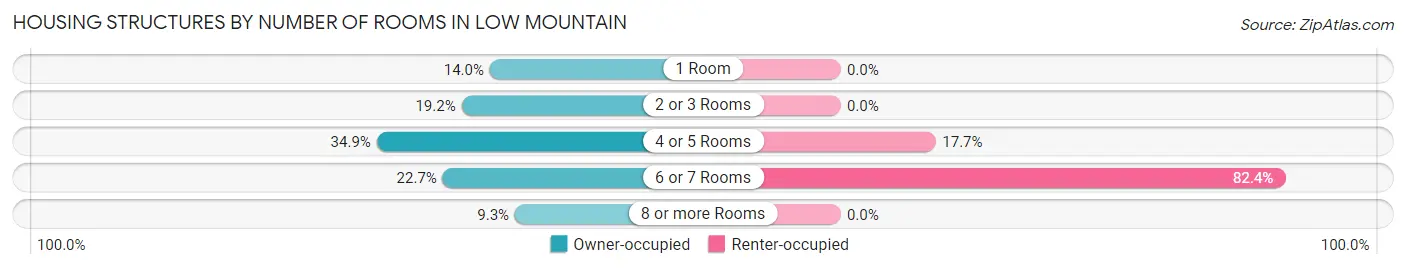
| Number of Rooms | Owner-occupied | Renter-occupied |
| 1 Room | 24 (14.0%) | 0 (0.0%) |
| 2 or 3 Rooms | 33 (19.2%) | 0 (0.0%) |
| 4 or 5 Rooms | 60 (34.9%) | 3 (17.6%) |
| 6 or 7 Rooms | 39 (22.7%) | 14 (82.4%) |
| 8 or more Rooms | 16 (9.3%) | 0 (0.0%) |
| Total | 172 (100.0%) | 17 (100.0%) |
Housing Structure by Heating Type in Low Mountain
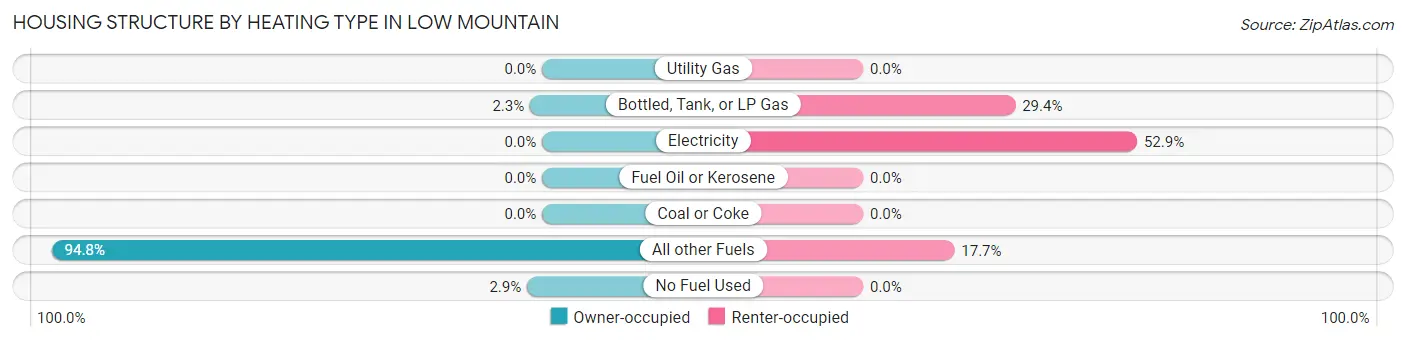
| Heating Type | Owner-occupied | Renter-occupied |
| Utility Gas | 0 (0.0%) | 0 (0.0%) |
| Bottled, Tank, or LP Gas | 4 (2.3%) | 5 (29.4%) |
| Electricity | 0 (0.0%) | 9 (52.9%) |
| Fuel Oil or Kerosene | 0 (0.0%) | 0 (0.0%) |
| Coal or Coke | 0 (0.0%) | 0 (0.0%) |
| All other Fuels | 163 (94.8%) | 3 (17.6%) |
| No Fuel Used | 5 (2.9%) | 0 (0.0%) |
| Total | 172 (100.0%) | 17 (100.0%) |
Household Vehicle Usage in Low Mountain
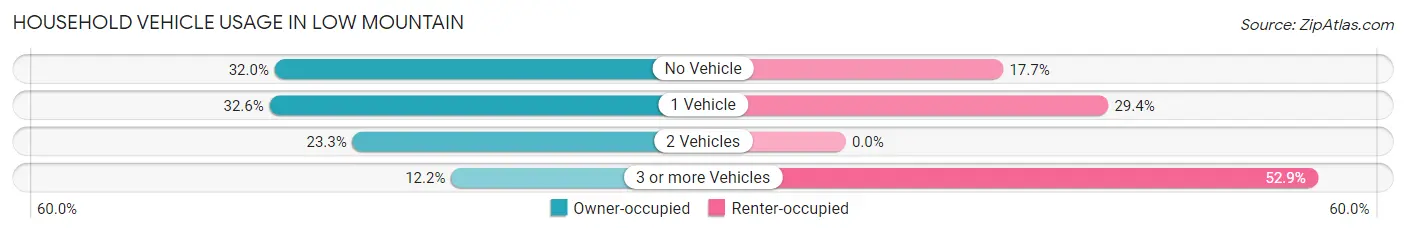
| Vehicles per Household | Owner-occupied | Renter-occupied |
| No Vehicle | 55 (32.0%) | 3 (17.6%) |
| 1 Vehicle | 56 (32.6%) | 5 (29.4%) |
| 2 Vehicles | 40 (23.3%) | 0 (0.0%) |
| 3 or more Vehicles | 21 (12.2%) | 9 (52.9%) |
| Total | 172 (100.0%) | 17 (100.0%) |
Real Estate & Mortgages in Low Mountain
Real Estate and Mortgage Overview in Low Mountain
| Characteristic | Without Mortgage | With Mortgage |
| Housing Units | 167 | 5 |
| Median Property Value | $115,100 | $0 |
| Median Household Income | $19,107 | $0 |
| Monthly Housing Costs | $239 | $0 |
| Real Estate Taxes | - | - |
Property Value by Mortgage Status in Low Mountain
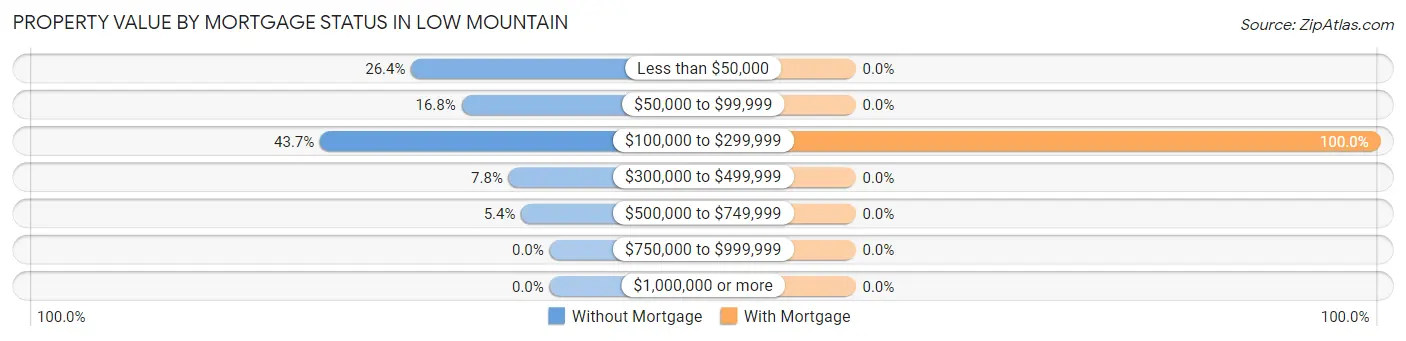
| Property Value | Without Mortgage | With Mortgage |
| Less than $50,000 | 44 (26.4%) | 0 (0.0%) |
| $50,000 to $99,999 | 28 (16.8%) | 0 (0.0%) |
| $100,000 to $299,999 | 73 (43.7%) | 5 (100.0%) |
| $300,000 to $499,999 | 13 (7.8%) | 0 (0.0%) |
| $500,000 to $749,999 | 9 (5.4%) | 0 (0.0%) |
| $750,000 to $999,999 | 0 (0.0%) | 0 (0.0%) |
| $1,000,000 or more | 0 (0.0%) | 0 (0.0%) |
| Total | 167 (100.0%) | 5 (100.0%) |
Household Income by Mortgage Status in Low Mountain
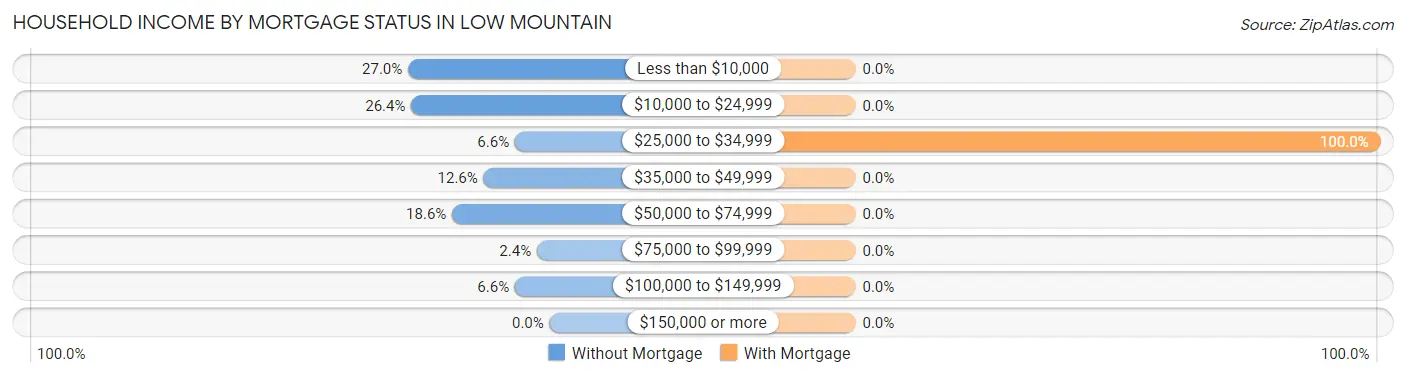
| Household Income | Without Mortgage | With Mortgage |
| Less than $10,000 | 45 (27.0%) | 0 (0.0%) |
| $10,000 to $24,999 | 44 (26.4%) | 0 (0.0%) |
| $25,000 to $34,999 | 11 (6.6%) | 5 (100.0%) |
| $35,000 to $49,999 | 21 (12.6%) | 0 (0.0%) |
| $50,000 to $74,999 | 31 (18.6%) | 0 (0.0%) |
| $75,000 to $99,999 | 4 (2.4%) | 0 (0.0%) |
| $100,000 to $149,999 | 11 (6.6%) | 0 (0.0%) |
| $150,000 or more | 0 (0.0%) | 0 (0.0%) |
| Total | 167 (100.0%) | 5 (100.0%) |
Property Value to Household Income Ratio in Low Mountain
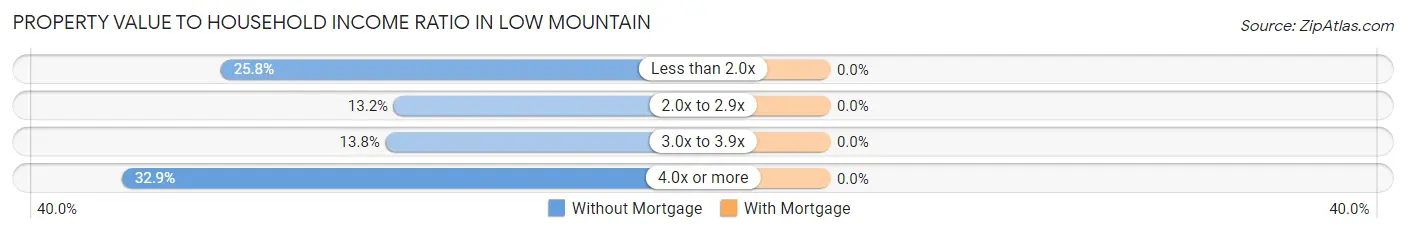
| Value-to-Income Ratio | Without Mortgage | With Mortgage |
| Less than 2.0x | 43 (25.8%) | 0 (0.0%) |
| 2.0x to 2.9x | 22 (13.2%) | 0 (0.0%) |
| 3.0x to 3.9x | 23 (13.8%) | 0 (0.0%) |
| 4.0x or more | 55 (32.9%) | 0 (0.0%) |
| Total | 167 (100.0%) | 5 (100.0%) |
Real Estate Taxes by Mortgage Status in Low Mountain
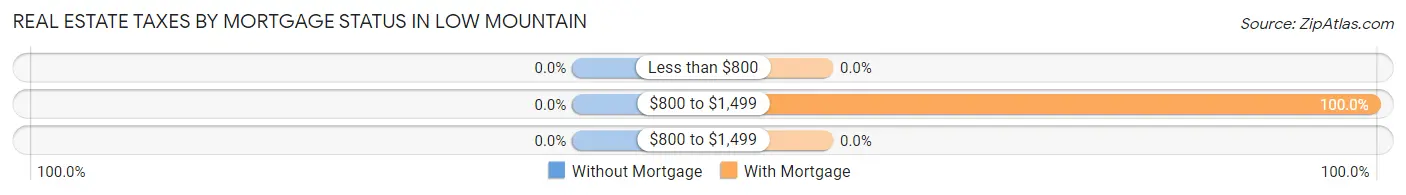
| Property Taxes | Without Mortgage | With Mortgage |
| Less than $800 | 0 (0.0%) | 0 (0.0%) |
| $800 to $1,499 | 0 (0.0%) | 5 (100.0%) |
| $800 to $1,499 | 0 (0.0%) | 0 (0.0%) |
| Total | 167 (100.0%) | 5 (100.0%) |
Health & Disability in Low Mountain
Health Insurance Coverage by Age in Low Mountain
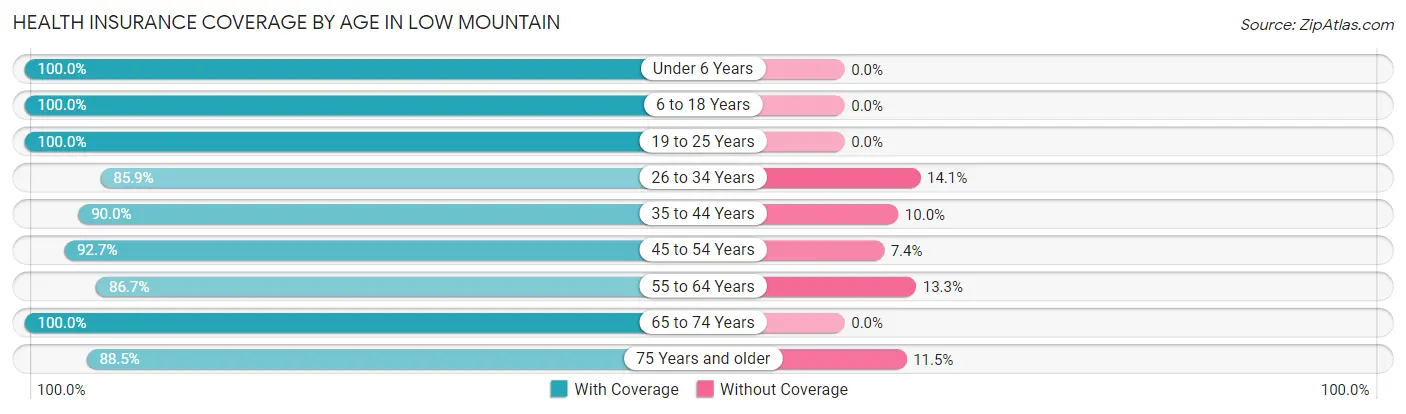
| Age Bracket | With Coverage | Without Coverage |
| Under 6 Years | 57 (100.0%) | 0 (0.0%) |
| 6 to 18 Years | 123 (100.0%) | 0 (0.0%) |
| 19 to 25 Years | 86 (100.0%) | 0 (0.0%) |
| 26 to 34 Years | 79 (85.9%) | 13 (14.1%) |
| 35 to 44 Years | 45 (90.0%) | 5 (10.0%) |
| 45 to 54 Years | 63 (92.6%) | 5 (7.3%) |
| 55 to 64 Years | 39 (86.7%) | 6 (13.3%) |
| 65 to 74 Years | 97 (100.0%) | 0 (0.0%) |
| 75 Years and older | 23 (88.5%) | 3 (11.5%) |
| Total | 612 (95.0%) | 32 (5.0%) |
Health Insurance Coverage by Citizenship Status in Low Mountain
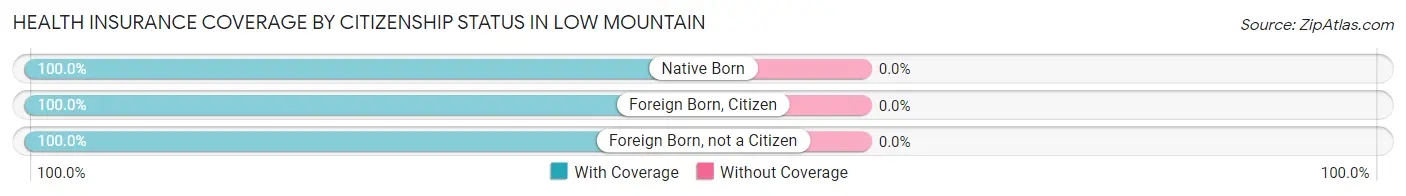
| Citizenship Status | With Coverage | Without Coverage |
| Native Born | 57 (100.0%) | 0 (0.0%) |
| Foreign Born, Citizen | 123 (100.0%) | 0 (0.0%) |
| Foreign Born, not a Citizen | 86 (100.0%) | 0 (0.0%) |
Health Insurance Coverage by Household Income in Low Mountain
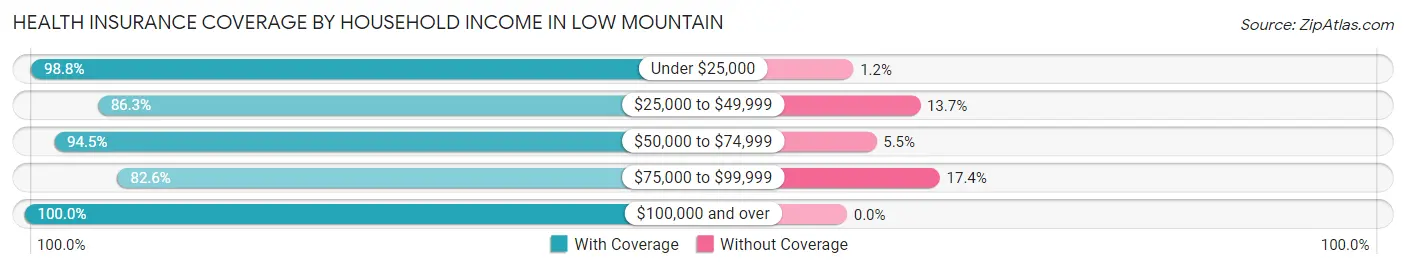
| Household Income | With Coverage | Without Coverage |
| Under $25,000 | 245 (98.8%) | 3 (1.2%) |
| $25,000 to $49,999 | 107 (86.3%) | 17 (13.7%) |
| $50,000 to $74,999 | 137 (94.5%) | 8 (5.5%) |
| $75,000 to $99,999 | 19 (82.6%) | 4 (17.4%) |
| $100,000 and over | 104 (100.0%) | 0 (0.0%) |
Public vs Private Health Insurance Coverage by Age in Low Mountain
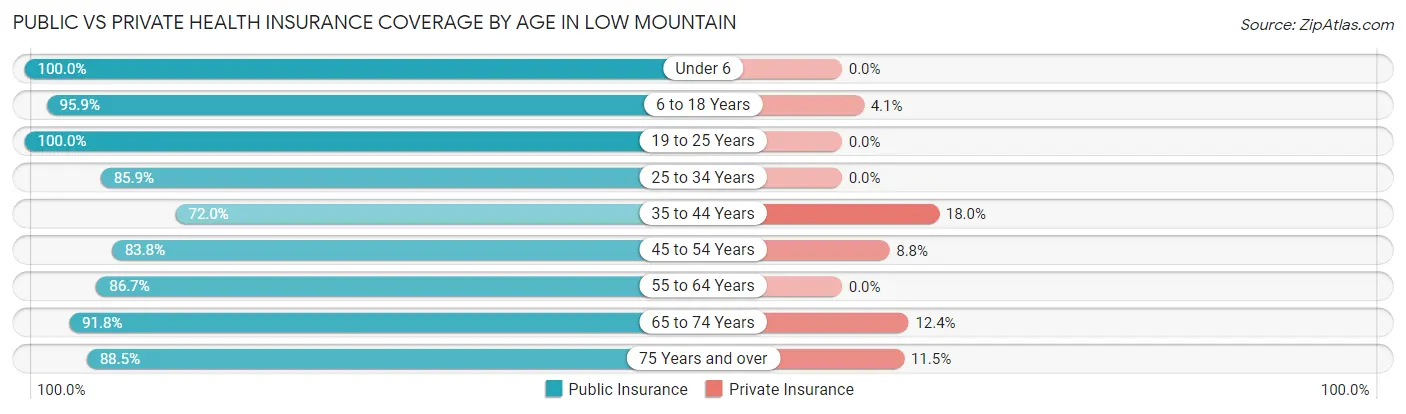
| Age Bracket | Public Insurance | Private Insurance |
| Under 6 | 57 (100.0%) | 0 (0.0%) |
| 6 to 18 Years | 118 (95.9%) | 5 (4.1%) |
| 19 to 25 Years | 86 (100.0%) | 0 (0.0%) |
| 25 to 34 Years | 79 (85.9%) | 0 (0.0%) |
| 35 to 44 Years | 36 (72.0%) | 9 (18.0%) |
| 45 to 54 Years | 57 (83.8%) | 6 (8.8%) |
| 55 to 64 Years | 39 (86.7%) | 0 (0.0%) |
| 65 to 74 Years | 89 (91.7%) | 12 (12.4%) |
| 75 Years and over | 23 (88.5%) | 3 (11.5%) |
| Total | 584 (90.7%) | 35 (5.4%) |
Disability Status by Sex by Age in Low Mountain
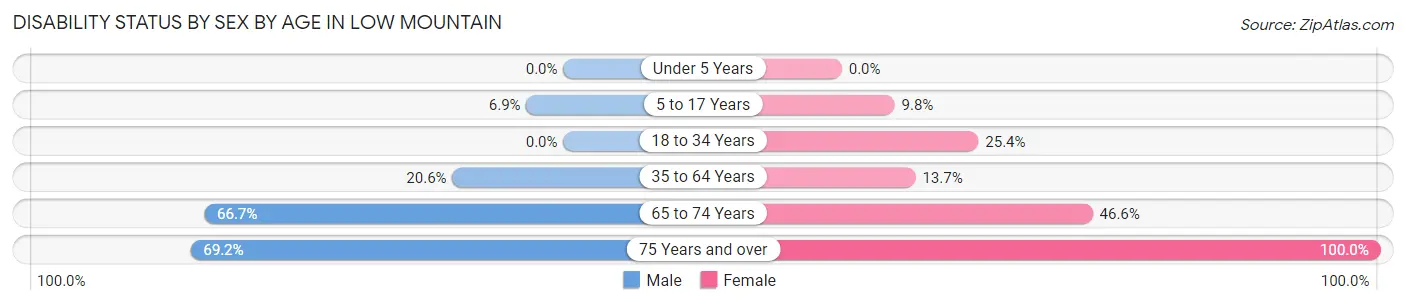
| Age Bracket | Male | Female |
| Under 5 Years | 0 (0.0%) | 0 (0.0%) |
| 5 to 17 Years | 5 (6.9%) | 5 (9.8%) |
| 18 to 34 Years | 0 (0.0%) | 18 (25.4%) |
| 35 to 64 Years | 14 (20.6%) | 13 (13.7%) |
| 65 to 74 Years | 26 (66.7%) | 27 (46.6%) |
| 75 Years and over | 9 (69.2%) | 13 (100.0%) |
Disability Class by Sex by Age in Low Mountain
Disability Class: Hearing Difficulty
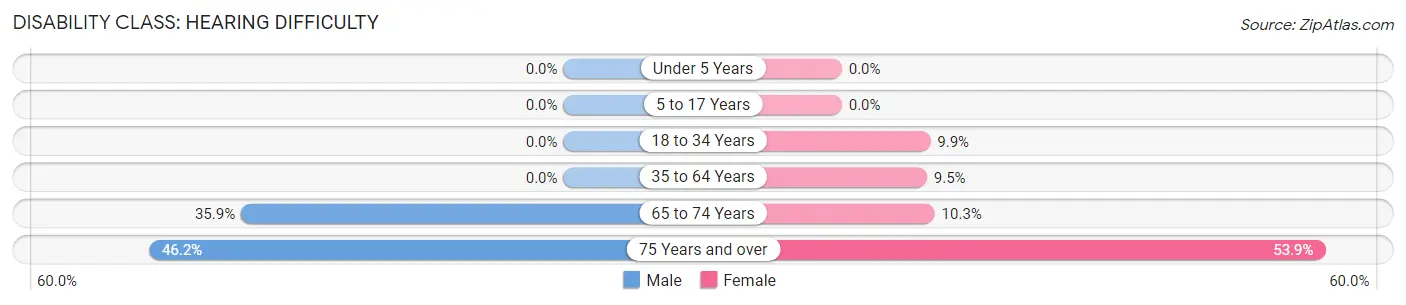
| Age Bracket | Male | Female |
| Under 5 Years | 0 (0.0%) | 0 (0.0%) |
| 5 to 17 Years | 0 (0.0%) | 0 (0.0%) |
| 18 to 34 Years | 0 (0.0%) | 7 (9.9%) |
| 35 to 64 Years | 0 (0.0%) | 9 (9.5%) |
| 65 to 74 Years | 14 (35.9%) | 6 (10.3%) |
| 75 Years and over | 6 (46.2%) | 7 (53.8%) |
Disability Class: Vision Difficulty
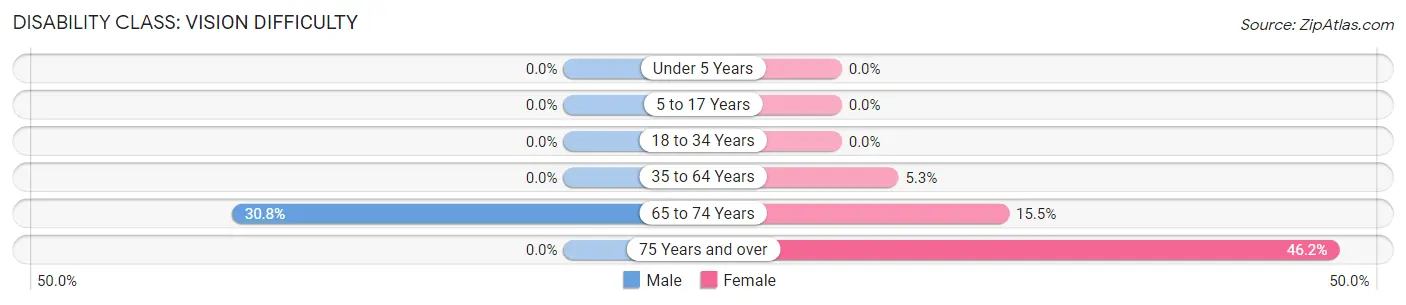
| Age Bracket | Male | Female |
| Under 5 Years | 0 (0.0%) | 0 (0.0%) |
| 5 to 17 Years | 0 (0.0%) | 0 (0.0%) |
| 18 to 34 Years | 0 (0.0%) | 0 (0.0%) |
| 35 to 64 Years | 0 (0.0%) | 5 (5.3%) |
| 65 to 74 Years | 12 (30.8%) | 9 (15.5%) |
| 75 Years and over | 0 (0.0%) | 6 (46.2%) |
Disability Class: Cognitive Difficulty
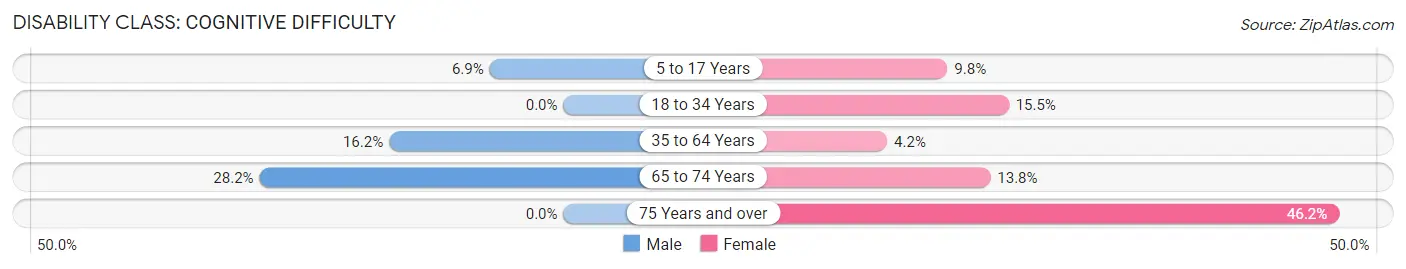
| Age Bracket | Male | Female |
| 5 to 17 Years | 5 (6.9%) | 5 (9.8%) |
| 18 to 34 Years | 0 (0.0%) | 11 (15.5%) |
| 35 to 64 Years | 11 (16.2%) | 4 (4.2%) |
| 65 to 74 Years | 11 (28.2%) | 8 (13.8%) |
| 75 Years and over | 0 (0.0%) | 6 (46.2%) |
Disability Class: Ambulatory Difficulty
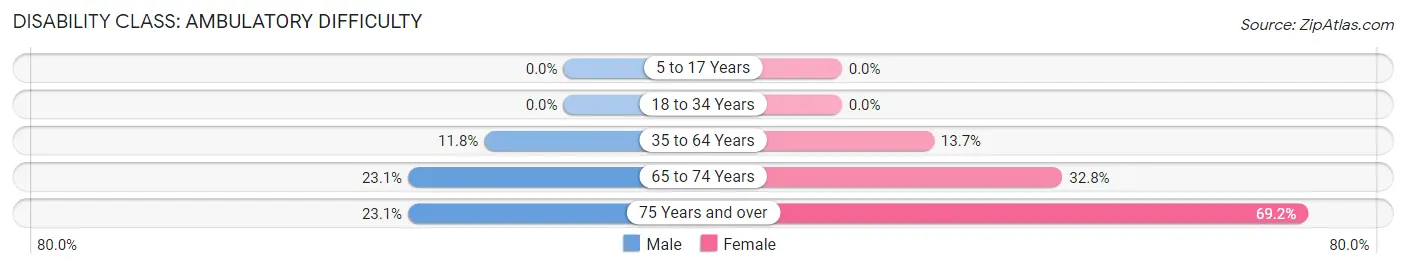
| Age Bracket | Male | Female |
| 5 to 17 Years | 0 (0.0%) | 0 (0.0%) |
| 18 to 34 Years | 0 (0.0%) | 0 (0.0%) |
| 35 to 64 Years | 8 (11.8%) | 13 (13.7%) |
| 65 to 74 Years | 9 (23.1%) | 19 (32.8%) |
| 75 Years and over | 3 (23.1%) | 9 (69.2%) |
Disability Class: Self-Care Difficulty
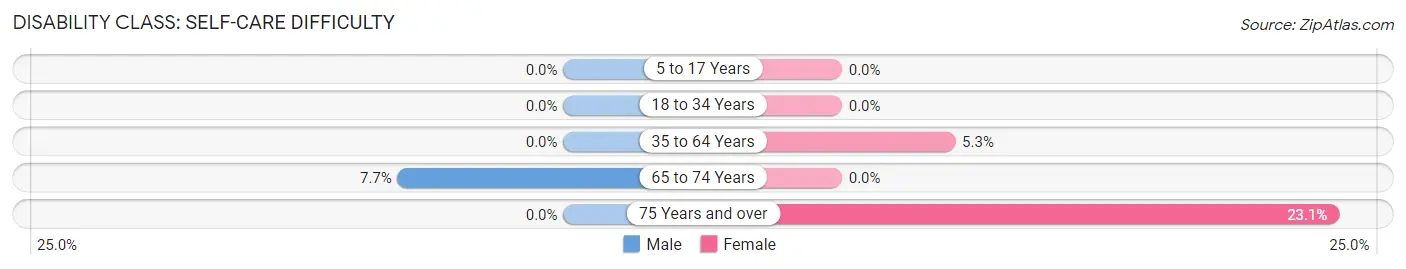
| Age Bracket | Male | Female |
| 5 to 17 Years | 0 (0.0%) | 0 (0.0%) |
| 18 to 34 Years | 0 (0.0%) | 0 (0.0%) |
| 35 to 64 Years | 0 (0.0%) | 5 (5.3%) |
| 65 to 74 Years | 3 (7.7%) | 0 (0.0%) |
| 75 Years and over | 0 (0.0%) | 3 (23.1%) |
Technology Access in Low Mountain
Computing Device Access in Low Mountain
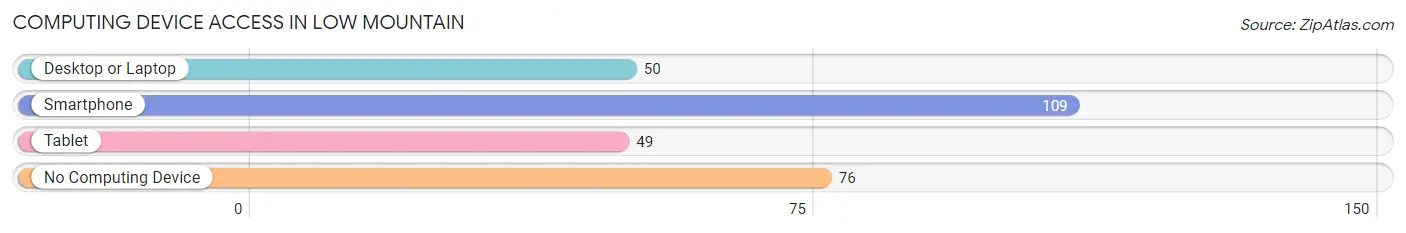
| Device Type | # Households | % Households |
| Desktop or Laptop | 50 | 26.5% |
| Smartphone | 109 | 57.7% |
| Tablet | 49 | 25.9% |
| No Computing Device | 76 | 40.2% |
| Total | 189 | 100.0% |
Internet Access in Low Mountain
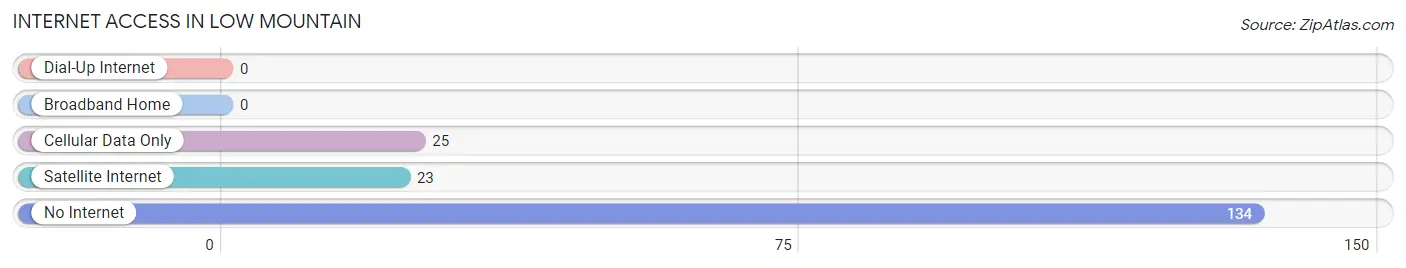
| Internet Type | # Households | % Households |
| Dial-Up Internet | 0 | 0.0% |
| Broadband Home | 0 | 0.0% |
| Cellular Data Only | 25 | 13.2% |
| Satellite Internet | 23 | 12.2% |
| No Internet | 134 | 70.9% |
| Total | 189 | 100.0% |
Low Mountain Summary
Mountain, Arizona is a small town located in the White Mountains of Arizona. It is situated in Navajo County, approximately 30 miles east of Show Low. The town is located at an elevation of 6,400 feet and has a population of approximately 1,000 people.
History
The area around Low Mountain has been inhabited for thousands of years by the Navajo people. The town was established in the late 1800s as a trading post for the Navajo people. The town was named after a nearby mountain, which was named after a local Navajo chief.
In the early 1900s, the town began to grow as more settlers moved into the area. The town was incorporated in 1912 and the first post office was established in 1913.
In the 1920s, the town began to experience a boom in population as the timber industry began to expand in the area. The town was also home to a number of sawmills and lumber companies.
In the 1950s, the town began to experience a decline in population as the timber industry began to decline. The town was also affected by the construction of the Show Low Dam, which flooded much of the surrounding area.
Geography
Low Mountain is located in the White Mountains of Arizona. The town is situated at an elevation of 6,400 feet and is surrounded by the Apache-Sitgreaves National Forest. The town is located approximately 30 miles east of Show Low and is accessible via State Route 260.
The town is located in a semi-arid climate, with hot summers and cold winters. The average annual temperature is approximately 50 degrees Fahrenheit. The town receives an average of 12 inches of precipitation per year.
Economy
The economy of Low Mountain is largely based on tourism and the timber industry. The town is home to a number of tourist attractions, including the White Mountain Apache Cultural Center and the Apache-Sitgreaves National Forest. The town is also home to a number of sawmills and lumber companies.
Demographics
As of the 2010 census, the population of Low Mountain was 1,000 people. The racial makeup of the town was 95.2% White, 0.7% Native American, 0.3% Asian, 0.1% Pacific Islander, 0.1% from other races, and 3.7% from two or more races. The median household income was $35,000 and the median family income was $41,000. The per capita income was $17,000.
Conclusion
Low Mountain, Arizona is a small town located in the White Mountains of Arizona. It is situated in Navajo County, approximately 30 miles east of Show Low. The town is located at an elevation of 6,400 feet and has a population of approximately 1,000 people. The economy of Low Mountain is largely based on tourism and the timber industry. The town is home to a number of tourist attractions, including the White Mountain Apache Cultural Center and the Apache-Sitgreaves National Forest. The town is also home to a number of sawmills and lumber companies. As of the 2010 census, the population of Low Mountain was 1,000 people. The racial makeup of the town was 95.2% White, 0.7% Native American, 0.3% Asian, 0.1% Pacific Islander, 0.1% from other races, and 3.7% from two or more races. The median household income was $35,000 and the median family income was $41,000. The per capita income was $17,000.
Common Questions
What is Per Capita Income in Low Mountain?
Per Capita income in Low Mountain is $11,803.
What is the Median Family Income in Low Mountain?
Median Family Income in Low Mountain is $37,656.
What is the Median Household income in Low Mountain?
Median Household Income in Low Mountain is $25,313.
What is Inequality or Gini Index in Low Mountain?
Inequality or Gini Index in Low Mountain is 0.55.
What is the Total Population of Low Mountain?
Total Population of Low Mountain is 644.
What is the Total Male Population of Low Mountain?
Total Male Population of Low Mountain is 337.
What is the Total Female Population of Low Mountain?
Total Female Population of Low Mountain is 307.
What is the Ratio of Males per 100 Females in Low Mountain?
There are 109.77 Males per 100 Females in Low Mountain.
What is the Ratio of Females per 100 Males in Low Mountain?
There are 91.10 Females per 100 Males in Low Mountain.
What is the Median Population Age in Low Mountain?
Median Population Age in Low Mountain is 32.1 Years.
What is the Average Family Size in Low Mountain
Average Family Size in Low Mountain is 4.3 People.
What is the Average Household Size in Low Mountain
Average Household Size in Low Mountain is 3.4 People.
How Large is the Labor Force in Low Mountain?
There are 180 People in the Labor Forcein in Low Mountain.
What is the Percentage of People in the Labor Force in Low Mountain?
35.3% of People are in the Labor Force in Low Mountain.
What is the Unemployment Rate in Low Mountain?
Unemployment Rate in Low Mountain is 36.7%.