Whitecone, AZ Map & Demographics
Whitecone Map
Whitecone Overview
$9,827
PER CAPITA INCOME
$25,536
AVG FAMILY INCOME
$25,795
AVG HOUSEHOLD INCOME
35.2%
WAGE / INCOME GAP [ % ]
64.8¢/ $1
WAGE / INCOME GAP [ $ ]
$14,117
FAMILY INCOME DEFICIT
0.52
INEQUALITY / GINI INDEX
892
TOTAL POPULATION
383
MALE POPULATION
509
FEMALE POPULATION
75.25
MALES / 100 FEMALES
132.90
FEMALES / 100 MALES
31.6
MEDIAN AGE
3.7
AVG FAMILY SIZE
3.2
AVG HOUSEHOLD SIZE
203
LABOR FORCE [ PEOPLE ]
32.1%
PERCENT IN LABOR FORCE
20.2%
UNEMPLOYMENT RATE
Income in Whitecone
Income Overview in Whitecone
Per Capita Income in Whitecone is $9,827, while median incomes of families and households are $25,536 and $25,795 respectively.
| Characteristic | Number | Measure |
| Per Capita Income | 892 | $9,827 |
| Median Family Income | 217 | $25,536 |
| Mean Family Income | 217 | $31,365 |
| Median Household Income | 277 | $25,795 |
| Mean Household Income | 277 | $32,018 |
| Income Deficit | 217 | $14,117 |
| Wage / Income Gap (%) | 892 | 35.19% |
| Wage / Income Gap ($) | 892 | 64.81¢ per $1 |
| Gini / Inequality Index | 892 | 0.52 |
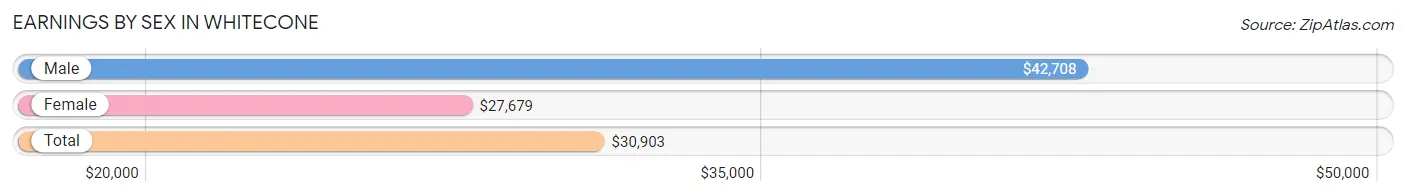
Earnings by Sex in Whitecone
Average Earnings in Whitecone are $30,903, $42,708 for men and $27,679 for women, a difference of 35.2%.
| Sex | Number | Average Earnings |
| Male | 72 (39.8%) | $42,708 |
| Female | 109 (60.2%) | $27,679 |
| Total | 181 (100.0%) | $30,903 |
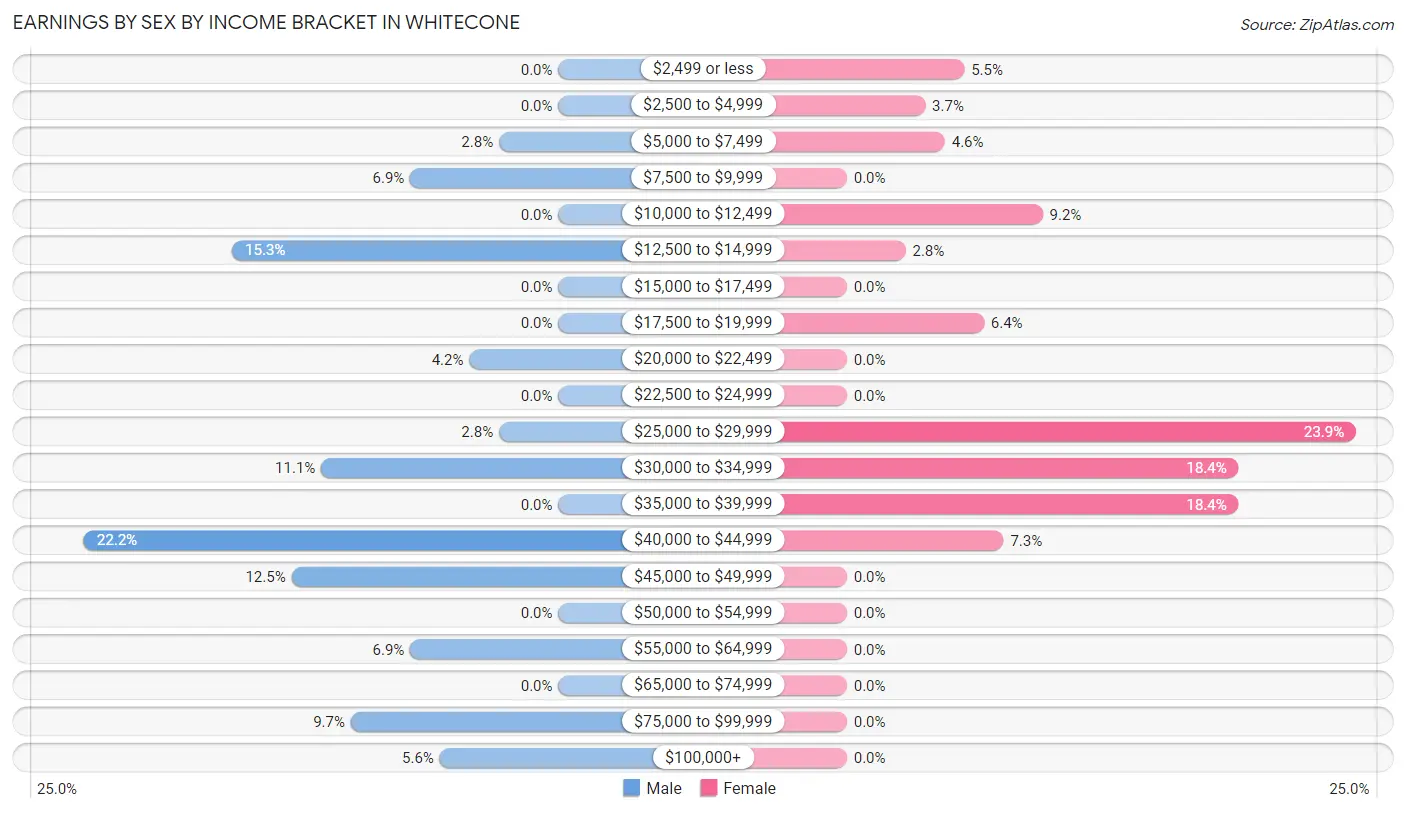
Earnings by Sex by Income Bracket in Whitecone
The most common earnings brackets in Whitecone are $40,000 to $44,999 for men (16 | 22.2%) and $25,000 to $29,999 for women (26 | 23.8%).
| Income | Male | Female |
| $2,499 or less | 0 (0.0%) | 6 (5.5%) |
| $2,500 to $4,999 | 0 (0.0%) | 4 (3.7%) |
| $5,000 to $7,499 | 2 (2.8%) | 5 (4.6%) |
| $7,500 to $9,999 | 5 (6.9%) | 0 (0.0%) |
| $10,000 to $12,499 | 0 (0.0%) | 10 (9.2%) |
| $12,500 to $14,999 | 11 (15.3%) | 3 (2.8%) |
| $15,000 to $17,499 | 0 (0.0%) | 0 (0.0%) |
| $17,500 to $19,999 | 0 (0.0%) | 7 (6.4%) |
| $20,000 to $22,499 | 3 (4.2%) | 0 (0.0%) |
| $22,500 to $24,999 | 0 (0.0%) | 0 (0.0%) |
| $25,000 to $29,999 | 2 (2.8%) | 26 (23.8%) |
| $30,000 to $34,999 | 8 (11.1%) | 20 (18.3%) |
| $35,000 to $39,999 | 0 (0.0%) | 20 (18.3%) |
| $40,000 to $44,999 | 16 (22.2%) | 8 (7.3%) |
| $45,000 to $49,999 | 9 (12.5%) | 0 (0.0%) |
| $50,000 to $54,999 | 0 (0.0%) | 0 (0.0%) |
| $55,000 to $64,999 | 5 (6.9%) | 0 (0.0%) |
| $65,000 to $74,999 | 0 (0.0%) | 0 (0.0%) |
| $75,000 to $99,999 | 7 (9.7%) | 0 (0.0%) |
| $100,000+ | 4 (5.6%) | 0 (0.0%) |
| Total | 72 (100.0%) | 109 (100.0%) |
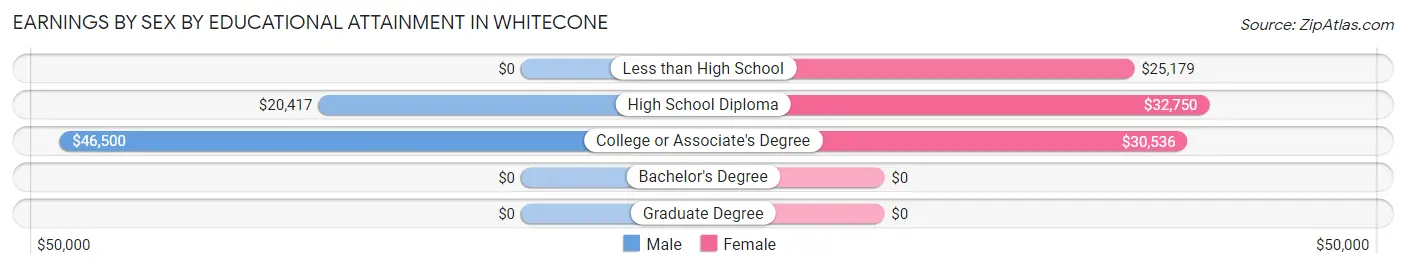
Earnings by Sex by Educational Attainment in Whitecone
Average earnings in Whitecone are $42,188 for men and $28,571 for women, a difference of 32.3%. Men with an educational attainment of college or associate's degree enjoy the highest average annual earnings of $46,500, while those with high school diploma education earn the least with $20,417. Women with an educational attainment of high school diploma earn the most with the average annual earnings of $32,750, while those with less than high school education have the smallest earnings of $25,179.
| Educational Attainment | Male Income | Female Income |
| Less than High School | - | - |
| High School Diploma | $20,417 | $32,750 |
| College or Associate's Degree | $46,500 | $30,536 |
| Bachelor's Degree | - | - |
| Graduate Degree | - | - |
| Total | $42,188 | $28,571 |
Family Income in Whitecone
Family Income Brackets in Whitecone
According to the Whitecone family income data, there are 54 families falling into the less than $10,000 income range, which is the most common income bracket and makes up 24.9% of all families.
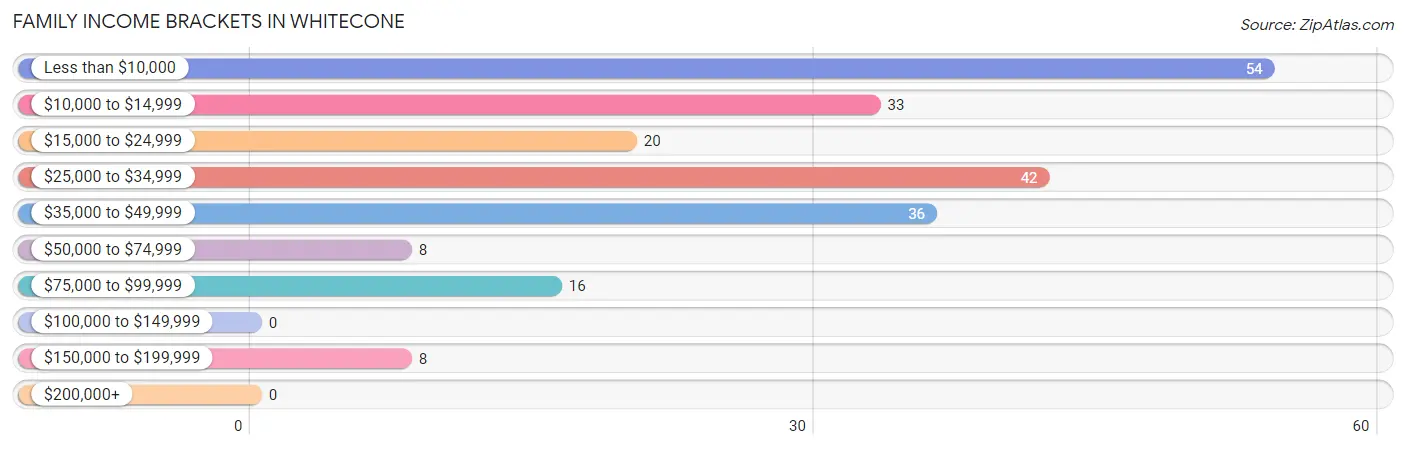
| Income Bracket | # Families | % Families |
| Less than $10,000 | 54 | 24.9% |
| $10,000 to $14,999 | 33 | 15.2% |
| $15,000 to $24,999 | 20 | 9.2% |
| $25,000 to $34,999 | 42 | 19.4% |
| $35,000 to $49,999 | 36 | 16.6% |
| $50,000 to $74,999 | 8 | 3.7% |
| $75,000 to $99,999 | 16 | 7.4% |
| $100,000 to $149,999 | 0 | 0.0% |
| $150,000 to $199,999 | 8 | 3.7% |
| $200,000+ | 0 | 0.0% |
Family Income by Famaliy Size in Whitecone
5-person families (32 | 14.7%) account for the highest median family income in Whitecone with $28,289 per family, while 2-person families (69 | 31.8%) have the highest median income of $13,906 per family member.
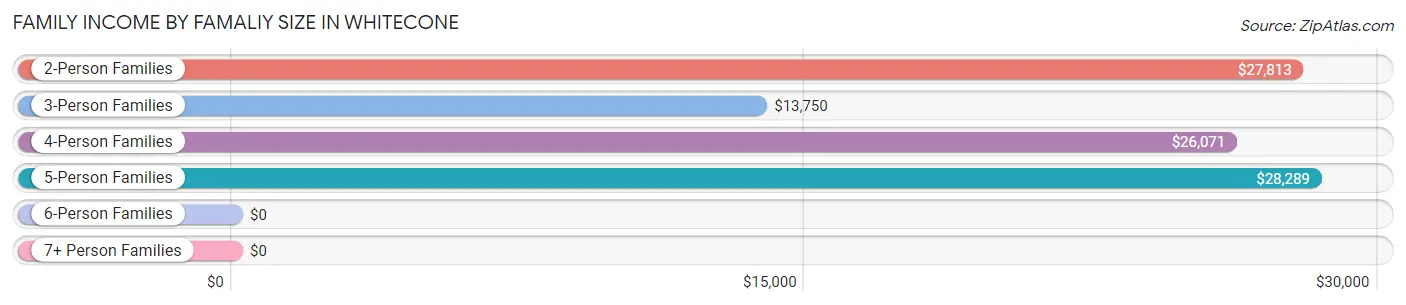
| Income Bracket | # Families | Median Income |
| 2-Person Families | 69 (31.8%) | $27,813 |
| 3-Person Families | 49 (22.6%) | $13,750 |
| 4-Person Families | 28 (12.9%) | $26,071 |
| 5-Person Families | 32 (14.7%) | $28,289 |
| 6-Person Families | 26 (12.0%) | $0 |
| 7+ Person Families | 13 (6.0%) | $0 |
| Total | 217 (100.0%) | $25,536 |
Family Income by Number of Earners in Whitecone
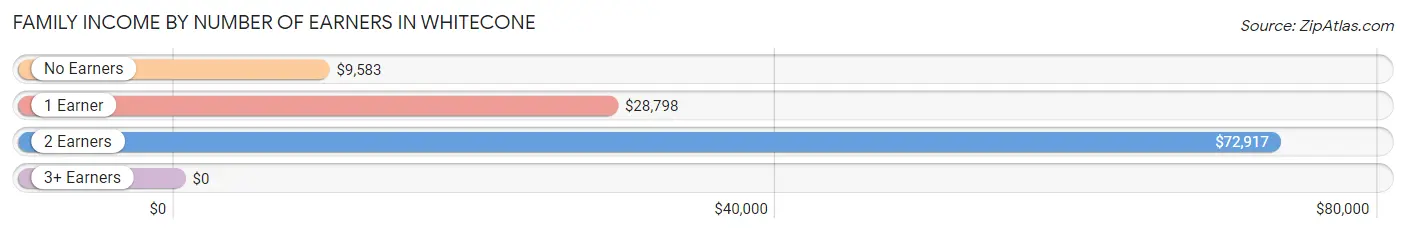
| Number of Earners | # Families | Median Income |
| No Earners | 101 (46.5%) | $9,583 |
| 1 Earner | 89 (41.0%) | $28,798 |
| 2 Earners | 27 (12.4%) | $72,917 |
| 3+ Earners | 0 (0.0%) | $0 |
| Total | 217 (100.0%) | $25,536 |
Household Income in Whitecone
Household Income Brackets in Whitecone
With 61 households falling in the category, the less than $10,000 income range is the most frequent in Whitecone, accounting for 22.0% of all households.
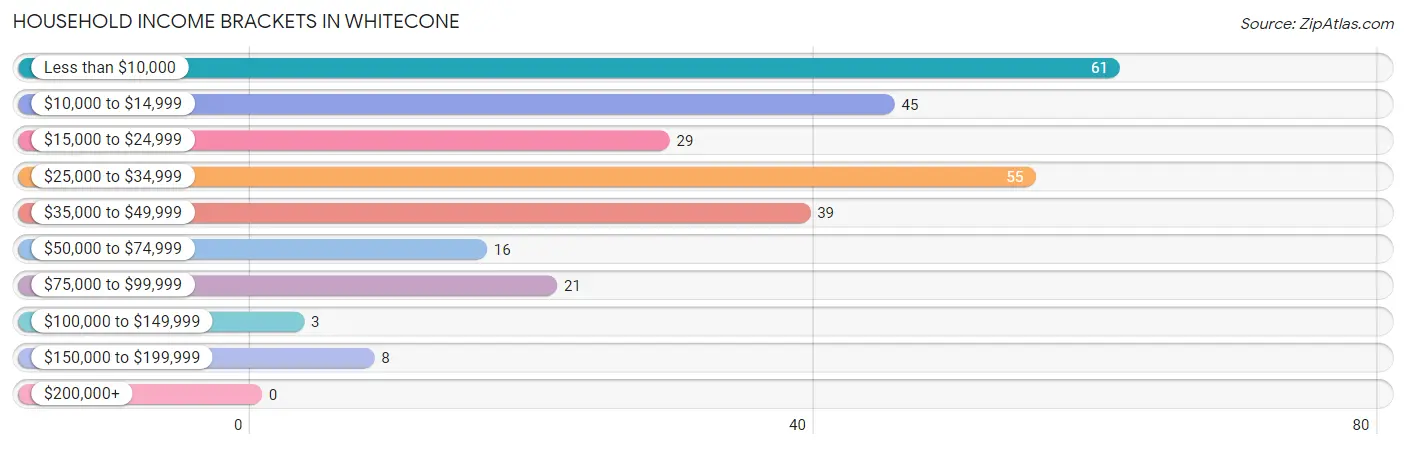
| Income Bracket | # Households | % Households |
| Less than $10,000 | 61 | 22.0% |
| $10,000 to $14,999 | 45 | 16.2% |
| $15,000 to $24,999 | 29 | 10.5% |
| $25,000 to $34,999 | 55 | 19.9% |
| $35,000 to $49,999 | 39 | 14.1% |
| $50,000 to $74,999 | 16 | 5.8% |
| $75,000 to $99,999 | 21 | 7.6% |
| $100,000 to $149,999 | 3 | 1.1% |
| $150,000 to $199,999 | 8 | 2.9% |
| $200,000+ | 0 | 0.0% |
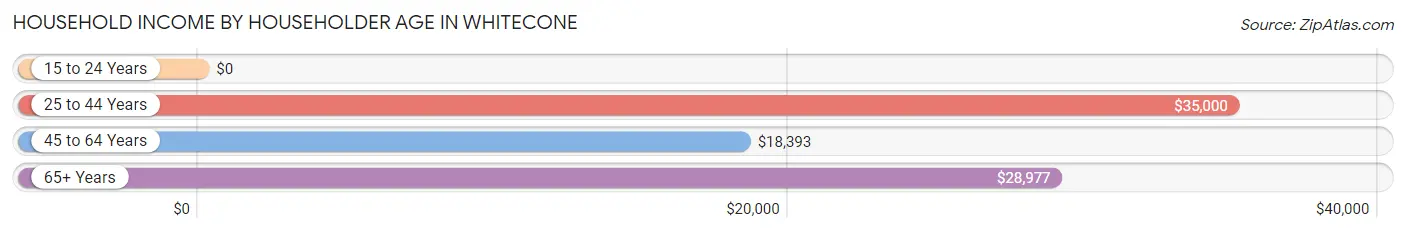
Household Income by Householder Age in Whitecone
The median household income in Whitecone is $25,795, with the highest median household income of $35,000 found in the 25 to 44 years age bracket for the primary householder. A total of 74 households (26.7%) fall into this category. Meanwhile, the 15 to 24 years age bracket for the primary householder has the lowest median household income of $0, with 5 households (1.8%) in this group.
| Income Bracket | # Households | Median Income |
| 15 to 24 Years | 5 (1.8%) | $0 |
| 25 to 44 Years | 74 (26.7%) | $35,000 |
| 45 to 64 Years | 115 (41.5%) | $18,393 |
| 65+ Years | 83 (30.0%) | $28,977 |
| Total | 277 (100.0%) | $25,795 |
Poverty in Whitecone
Income Below Poverty by Sex and Age in Whitecone
With 64.5% poverty level for males and 65.4% for females among the residents of Whitecone, 6 to 11 year old males and under 5 year old females are the most vulnerable to poverty, with 59 males (100.0%) and 30 females (100.0%) in their respective age groups living below the poverty level.
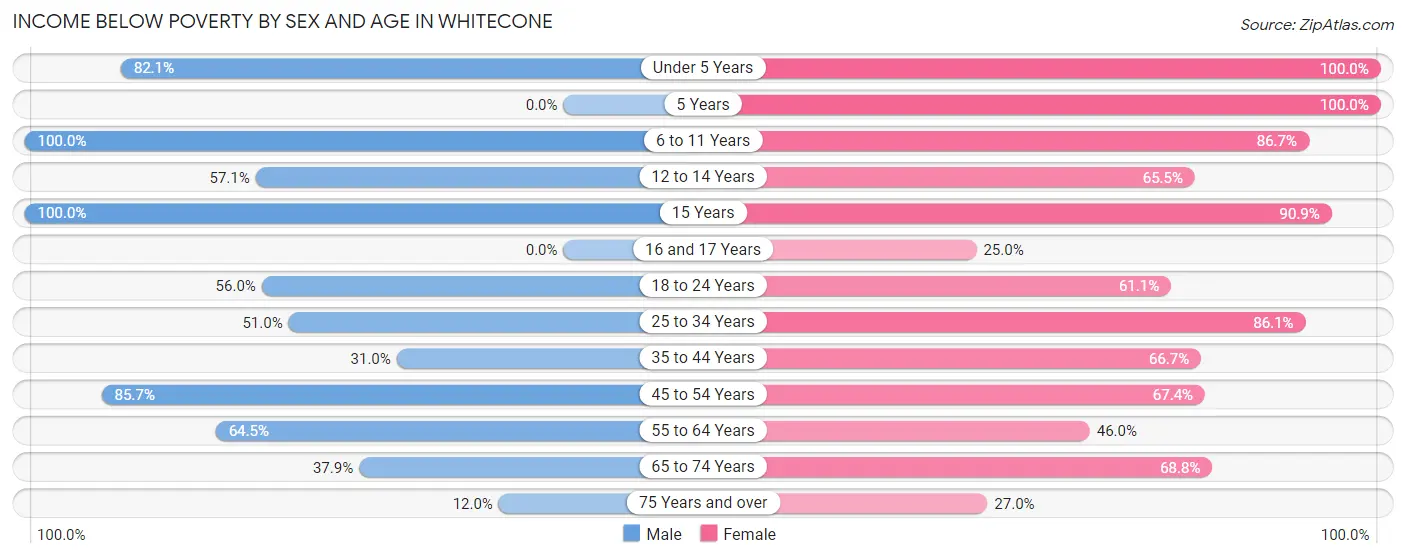
| Age Bracket | Male | Female |
| Under 5 Years | 46 (82.1%) | 30 (100.0%) |
| 5 Years | 0 (0.0%) | 12 (100.0%) |
| 6 to 11 Years | 59 (100.0%) | 26 (86.7%) |
| 12 to 14 Years | 4 (57.1%) | 19 (65.5%) |
| 15 Years | 4 (100.0%) | 30 (90.9%) |
| 16 and 17 Years | 0 (0.0%) | 7 (25.0%) |
| 18 to 24 Years | 14 (56.0%) | 44 (61.1%) |
| 25 to 34 Years | 25 (51.0%) | 37 (86.1%) |
| 35 to 44 Years | 13 (30.9%) | 36 (66.7%) |
| 45 to 54 Years | 48 (85.7%) | 31 (67.4%) |
| 55 to 64 Years | 20 (64.5%) | 29 (46.0%) |
| 65 to 74 Years | 11 (37.9%) | 22 (68.8%) |
| 75 Years and over | 3 (12.0%) | 10 (27.0%) |
| Total | 247 (64.5%) | 333 (65.4%) |
Income Above Poverty by Sex and Age in Whitecone
According to the poverty statistics in Whitecone, males aged 75 years and over and females aged 16 and 17 years are the age groups that are most secure financially, with 88.0% of males and 75.0% of females in these age groups living above the poverty line.
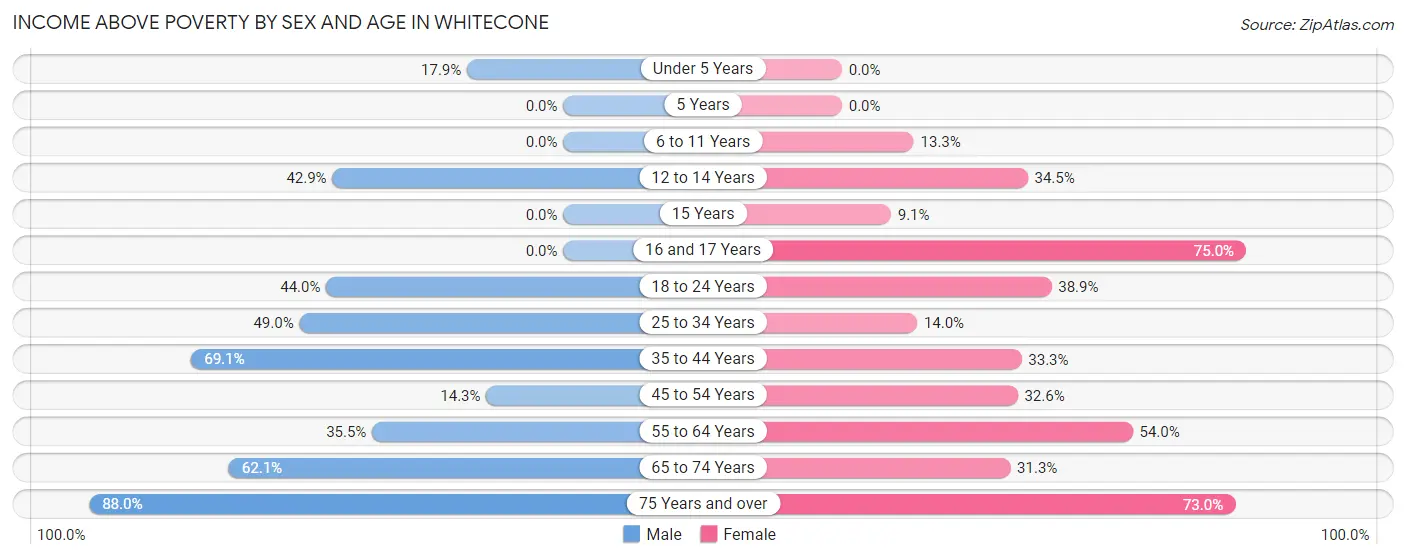
| Age Bracket | Male | Female |
| Under 5 Years | 10 (17.9%) | 0 (0.0%) |
| 5 Years | 0 (0.0%) | 0 (0.0%) |
| 6 to 11 Years | 0 (0.0%) | 4 (13.3%) |
| 12 to 14 Years | 3 (42.9%) | 10 (34.5%) |
| 15 Years | 0 (0.0%) | 3 (9.1%) |
| 16 and 17 Years | 0 (0.0%) | 21 (75.0%) |
| 18 to 24 Years | 11 (44.0%) | 28 (38.9%) |
| 25 to 34 Years | 24 (49.0%) | 6 (14.0%) |
| 35 to 44 Years | 29 (69.1%) | 18 (33.3%) |
| 45 to 54 Years | 8 (14.3%) | 15 (32.6%) |
| 55 to 64 Years | 11 (35.5%) | 34 (54.0%) |
| 65 to 74 Years | 18 (62.1%) | 10 (31.2%) |
| 75 Years and over | 22 (88.0%) | 27 (73.0%) |
| Total | 136 (35.5%) | 176 (34.6%) |
Income Below Poverty Among Married-Couple Families in Whitecone
The poverty statistics for married-couple families in Whitecone show that 52.2% or 47 of the total 90 families live below the poverty line. Families with 5 or more children have the highest poverty rate of 100.0%, comprising of 5 families. On the other hand, families with no children have the lowest poverty rate of 41.3%, which includes 19 families.
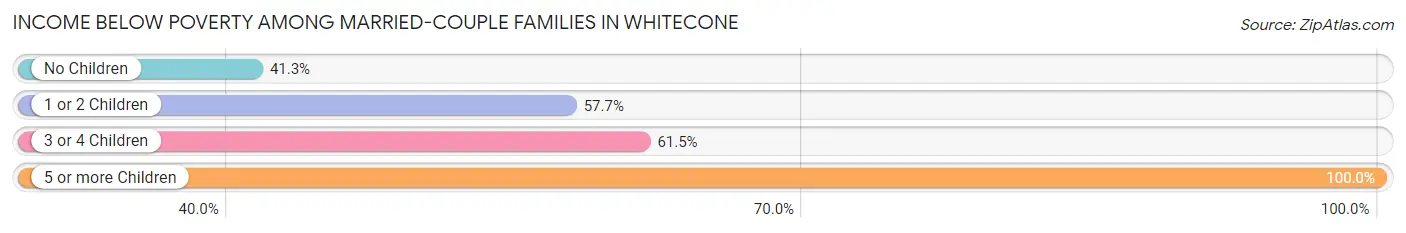
| Children | Above Poverty | Below Poverty |
| No Children | 27 (58.7%) | 19 (41.3%) |
| 1 or 2 Children | 11 (42.3%) | 15 (57.7%) |
| 3 or 4 Children | 5 (38.5%) | 8 (61.5%) |
| 5 or more Children | 0 (0.0%) | 5 (100.0%) |
| Total | 43 (47.8%) | 47 (52.2%) |
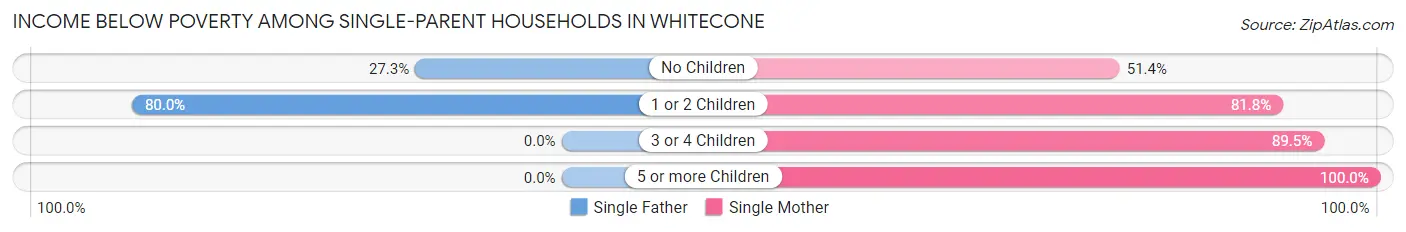
Income Below Poverty Among Single-Parent Households in Whitecone
According to the poverty data in Whitecone, 52.4% or 11 single-father households and 76.4% or 81 single-mother households are living below the poverty line. Among single-father households, those with 1 or 2 children have the highest poverty rate, with 8 households (80.0%) experiencing poverty. Likewise, among single-mother households, those with 5 or more children have the highest poverty rate, with 11 households (100.0%) falling below the poverty line.
| Children | Single Father | Single Mother |
| No Children | 3 (27.3%) | 18 (51.4%) |
| 1 or 2 Children | 8 (80.0%) | 18 (81.8%) |
| 3 or 4 Children | 0 (0.0%) | 34 (89.5%) |
| 5 or more Children | 0 (0.0%) | 11 (100.0%) |
| Total | 11 (52.4%) | 81 (76.4%) |
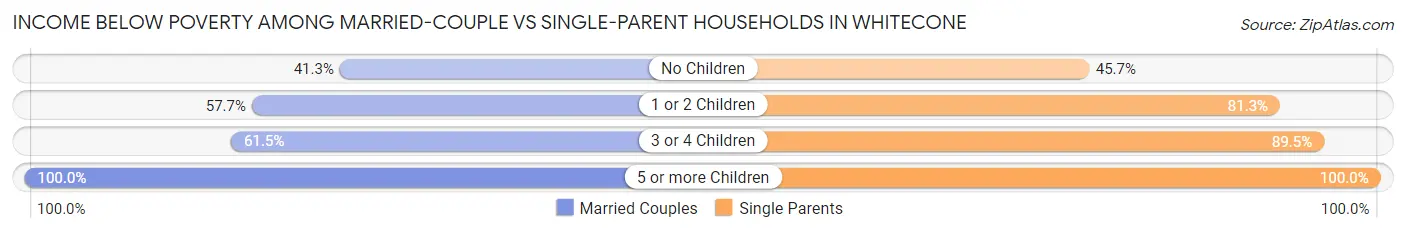
Income Below Poverty Among Married-Couple vs Single-Parent Households in Whitecone
The poverty data for Whitecone shows that 47 of the married-couple family households (52.2%) and 92 of the single-parent households (72.4%) are living below the poverty level. Within the married-couple family households, those with 5 or more children have the highest poverty rate, with 5 households (100.0%) falling below the poverty line. Among the single-parent households, those with 5 or more children have the highest poverty rate, with 11 household (100.0%) living below poverty.
| Children | Married-Couple Families | Single-Parent Households |
| No Children | 19 (41.3%) | 21 (45.7%) |
| 1 or 2 Children | 15 (57.7%) | 26 (81.2%) |
| 3 or 4 Children | 8 (61.5%) | 34 (89.5%) |
| 5 or more Children | 5 (100.0%) | 11 (100.0%) |
| Total | 47 (52.2%) | 92 (72.4%) |
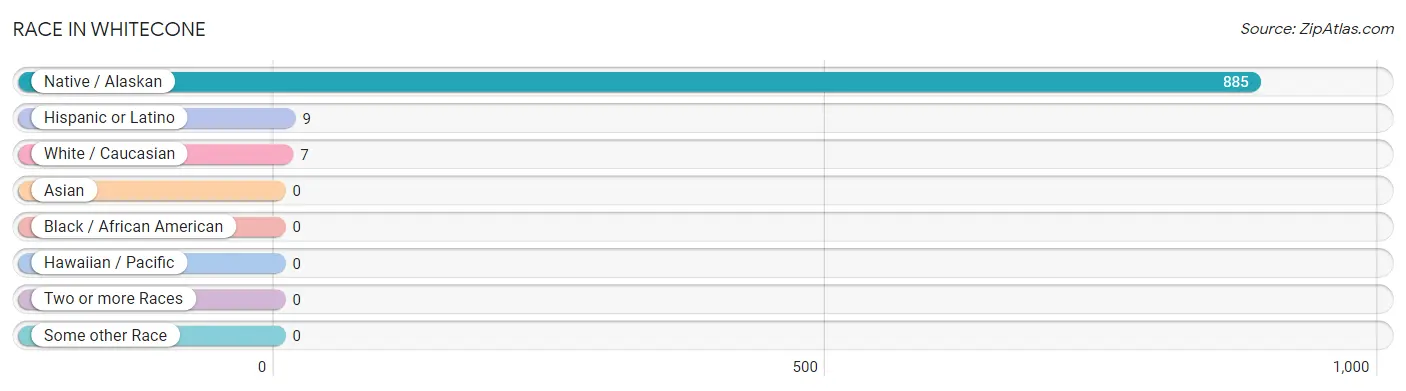
Race in Whitecone
The most populous races in Whitecone are Native / Alaskan (885 | 99.2%), Hispanic or Latino (9 | 1.0%), and White / Caucasian (7 | 0.8%).
| Race | # Population | % Population |
| Asian | 0 | 0.0% |
| Black / African American | 0 | 0.0% |
| Hawaiian / Pacific | 0 | 0.0% |
| Hispanic or Latino | 9 | 1.0% |
| Native / Alaskan | 885 | 99.2% |
| White / Caucasian | 7 | 0.8% |
| Two or more Races | 0 | 0.0% |
| Some other Race | 0 | 0.0% |
| Total | 892 | 100.0% |
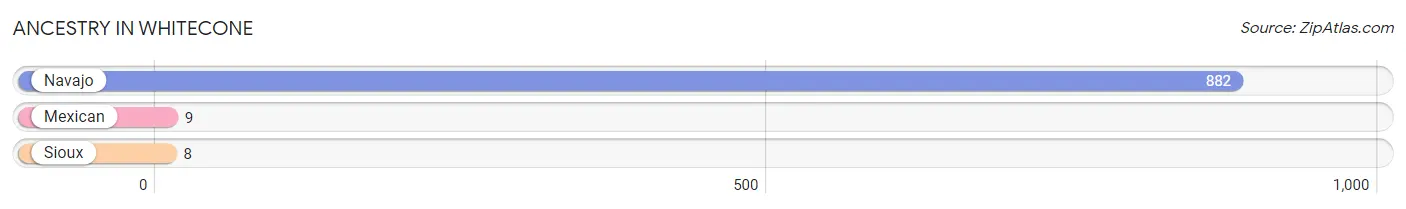
Ancestry in Whitecone
The most populous ancestries reported in Whitecone are Navajo (882 | 98.9%), Mexican (9 | 1.0%), and Sioux (8 | 0.9%), together accounting for 100.8% of all Whitecone residents.
| Ancestry | # Population | % Population |
| Mexican | 9 | 1.0% |
| Navajo | 882 | 98.9% |
| Sioux | 8 | 0.9% | View All 3 Rows |
Immigrants in Whitecone

| Immigration Origin | # Population | % Population | View All 0 Rows |
Sex and Age in Whitecone
Sex and Age in Whitecone
The most populous age groups in Whitecone are Under 5 Years (56 | 14.6%) for men and 15 to 19 Years (108 | 21.2%) for women.
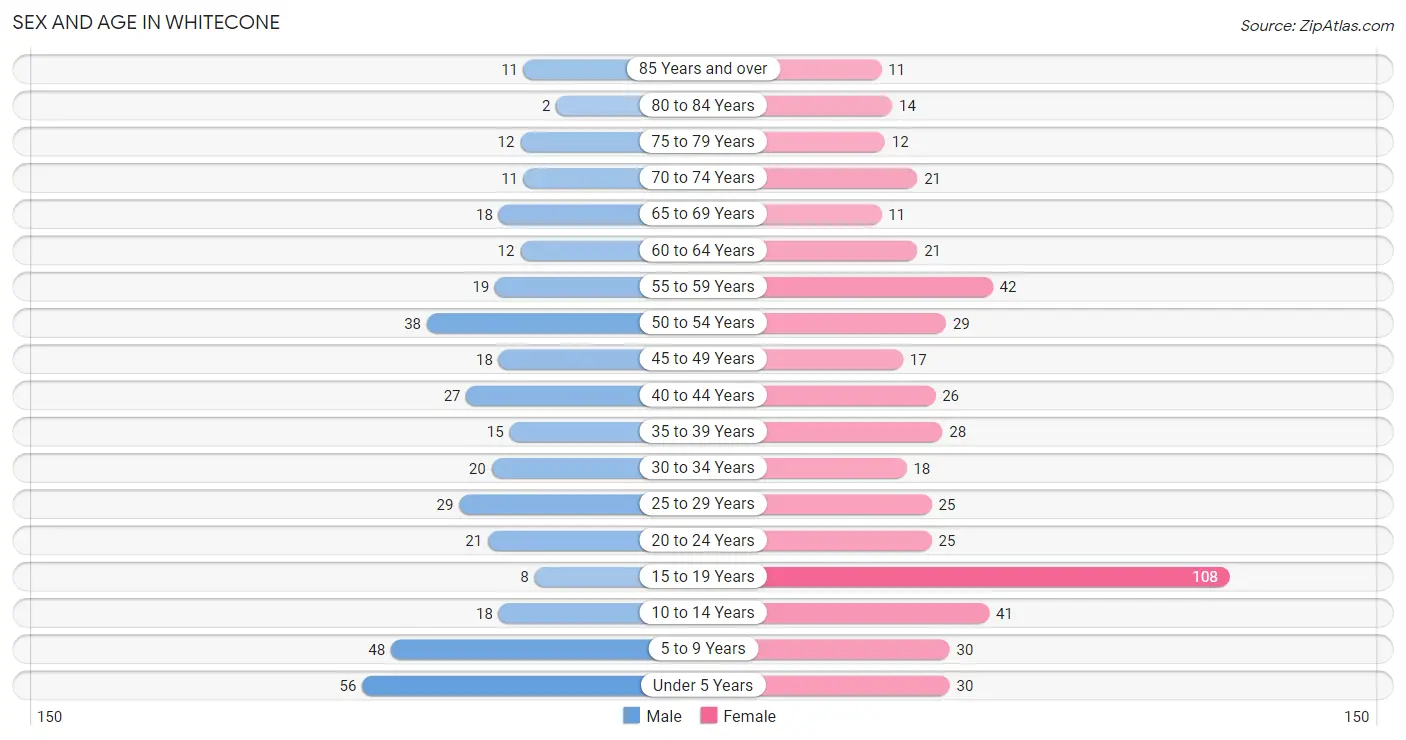
| Age Bracket | Male | Female |
| Under 5 Years | 56 (14.6%) | 30 (5.9%) |
| 5 to 9 Years | 48 (12.5%) | 30 (5.9%) |
| 10 to 14 Years | 18 (4.7%) | 41 (8.1%) |
| 15 to 19 Years | 8 (2.1%) | 108 (21.2%) |
| 20 to 24 Years | 21 (5.5%) | 25 (4.9%) |
| 25 to 29 Years | 29 (7.6%) | 25 (4.9%) |
| 30 to 34 Years | 20 (5.2%) | 18 (3.5%) |
| 35 to 39 Years | 15 (3.9%) | 28 (5.5%) |
| 40 to 44 Years | 27 (7.0%) | 26 (5.1%) |
| 45 to 49 Years | 18 (4.7%) | 17 (3.3%) |
| 50 to 54 Years | 38 (9.9%) | 29 (5.7%) |
| 55 to 59 Years | 19 (5.0%) | 42 (8.3%) |
| 60 to 64 Years | 12 (3.1%) | 21 (4.1%) |
| 65 to 69 Years | 18 (4.7%) | 11 (2.2%) |
| 70 to 74 Years | 11 (2.9%) | 21 (4.1%) |
| 75 to 79 Years | 12 (3.1%) | 12 (2.4%) |
| 80 to 84 Years | 2 (0.5%) | 14 (2.8%) |
| 85 Years and over | 11 (2.9%) | 11 (2.2%) |
| Total | 383 (100.0%) | 509 (100.0%) |
Families and Households in Whitecone
Median Family Size in Whitecone
The median family size in Whitecone is 3.66 persons per family, with single female/mother families (106 | 48.8%) accounting for the largest median family size of 3.75 persons per family. On the other hand, single male/father families (21 | 9.7%) represent the smallest median family size with 3.14 persons per family.
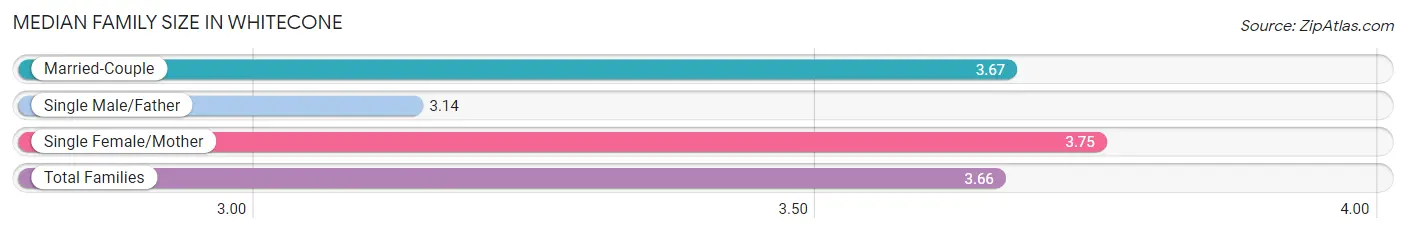
| Family Type | # Families | Family Size |
| Married-Couple | 90 (41.5%) | 3.67 |
| Single Male/Father | 21 (9.7%) | 3.14 |
| Single Female/Mother | 106 (48.8%) | 3.75 |
| Total Families | 217 (100.0%) | 3.66 |
Median Household Size in Whitecone
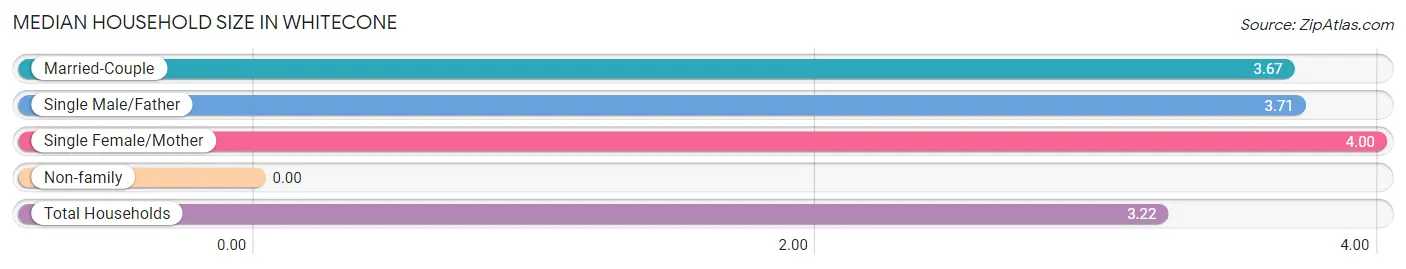
| Household Type | # Households | Household Size |
| Married-Couple | 90 (32.5%) | 3.67 |
| Single Male/Father | 21 (7.6%) | 3.71 |
| Single Female/Mother | 106 (38.3%) | 4.00 |
| Non-family | 60 (21.7%) | - |
| Total Households | 277 (100.0%) | 3.22 |
Household Size by Marriage Status in Whitecone
Out of a total of 277 households in Whitecone, 217 (78.3%) are family households, while 60 (21.7%) are nonfamily households. The most numerous type of family households are 2-person households, comprising 64, and the most common type of nonfamily households are 1-person households, comprising 60.
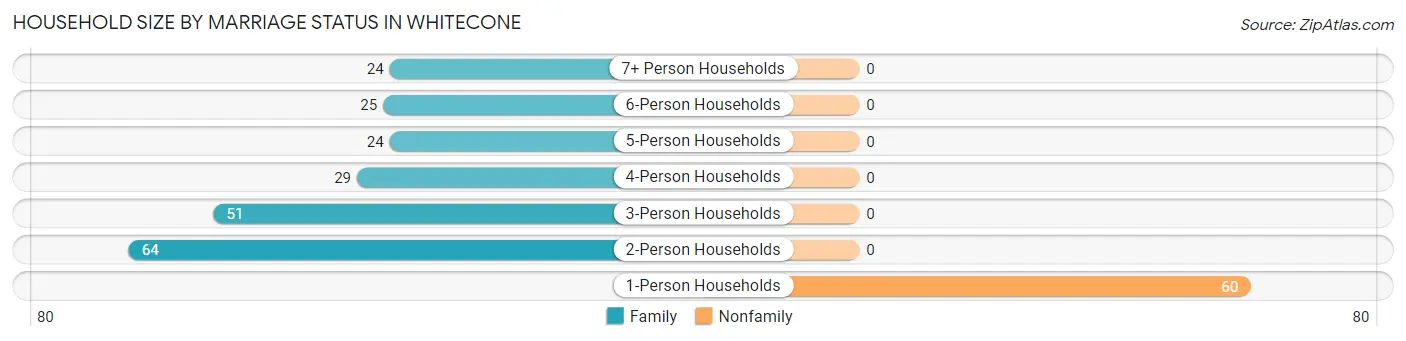
| Household Size | Family Households | Nonfamily Households |
| 1-Person Households | - | 60 (21.7%) |
| 2-Person Households | 64 (23.1%) | 0 (0.0%) |
| 3-Person Households | 51 (18.4%) | 0 (0.0%) |
| 4-Person Households | 29 (10.5%) | 0 (0.0%) |
| 5-Person Households | 24 (8.7%) | 0 (0.0%) |
| 6-Person Households | 25 (9.0%) | 0 (0.0%) |
| 7+ Person Households | 24 (8.7%) | 0 (0.0%) |
| Total | 217 (78.3%) | 60 (21.7%) |
Female Fertility in Whitecone
Fertility by Age in Whitecone
Average fertility rate in Whitecone is 112.0 births per 1,000 women. Women in the age bracket of 20 to 34 years have the highest fertility rate with 250.0 births per 1,000 women. Women in the age bracket of 20 to 34 years acount for 60.7% of all women with births.
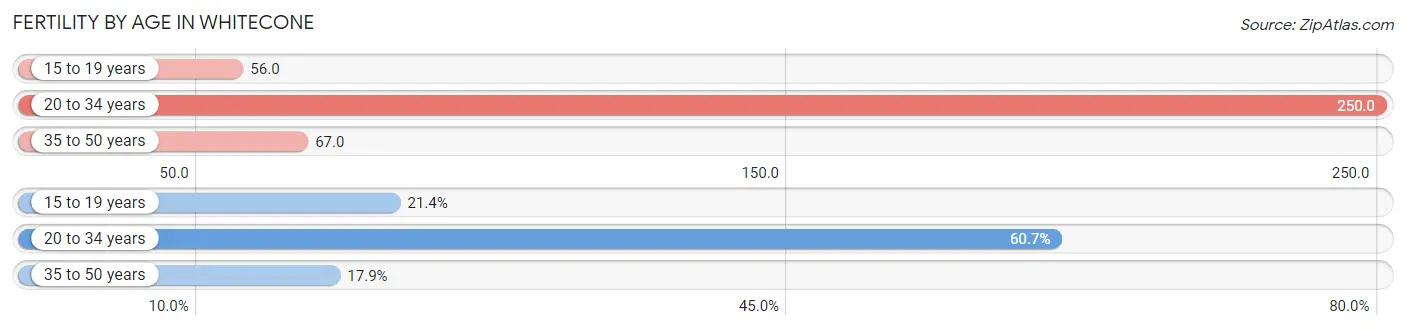
| Age Bracket | Women with Births | Births / 1,000 Women |
| 15 to 19 years | 6 (21.4%) | 56.0 |
| 20 to 34 years | 17 (60.7%) | 250.0 |
| 35 to 50 years | 5 (17.9%) | 67.0 |
| Total | 28 (100.0%) | 112.0 |
Fertility by Age by Marriage Status in Whitecone
21.4% of women with births (28) in Whitecone are married. The highest percentage of unmarried women with births falls into 20 to 34 years age bracket with 100.0% of them unmarried at the time of birth, while the lowest percentage of unmarried women with births belong to 15 to 19 years age bracket with 0.0% of them unmarried.
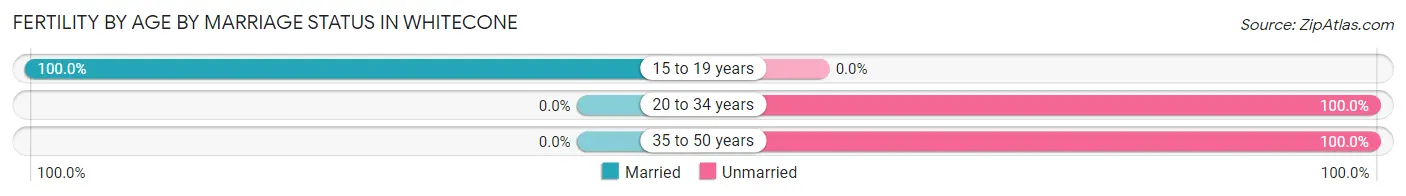
| Age Bracket | Married | Unmarried |
| 15 to 19 years | 6 (100.0%) | 0 (0.0%) |
| 20 to 34 years | 0 (0.0%) | 17 (100.0%) |
| 35 to 50 years | 0 (0.0%) | 5 (100.0%) |
| Total | 6 (21.4%) | 22 (78.6%) |
Fertility by Education in Whitecone
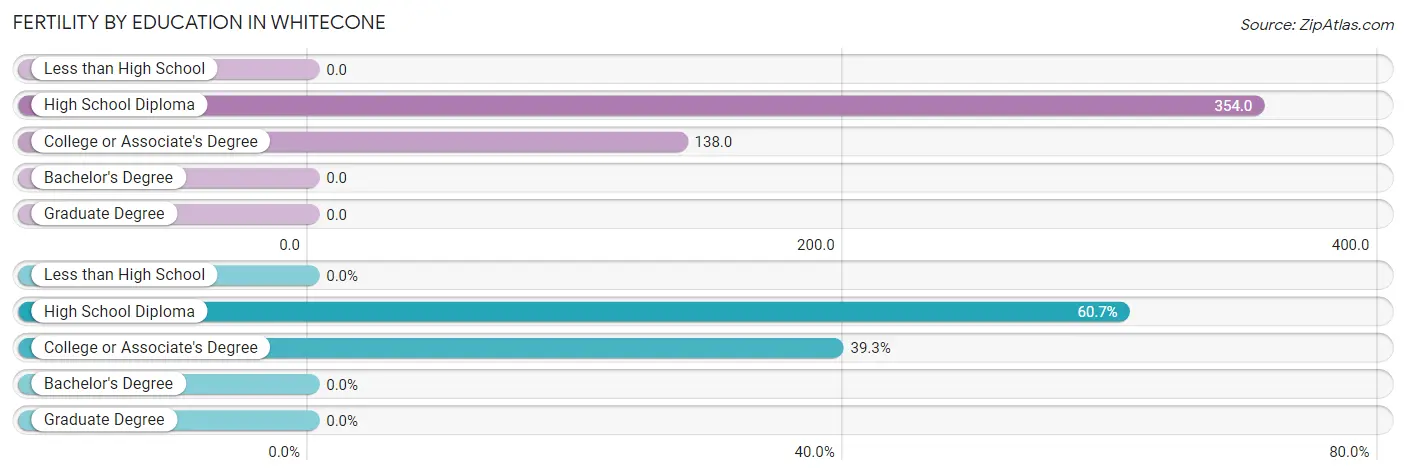
| Educational Attainment | Women with Births | Births / 1,000 Women |
| Less than High School | 0 (0.0%) | 0.0 |
| High School Diploma | 17 (60.7%) | 354.0 |
| College or Associate's Degree | 11 (39.3%) | 138.0 |
| Bachelor's Degree | 0 (0.0%) | 0.0 |
| Graduate Degree | 0 (0.0%) | 0.0 |
| Total | 28 (100.0%) | 112.0 |
Fertility by Education by Marriage Status in Whitecone
78.6% of women with births in Whitecone are unmarried. Women with the educational attainment of high school diploma are most likely to be married with 35.3% of them married at childbirth, while women with the educational attainment of college or associate's degree are least likely to be married with 100.0% of them unmarried at childbirth.
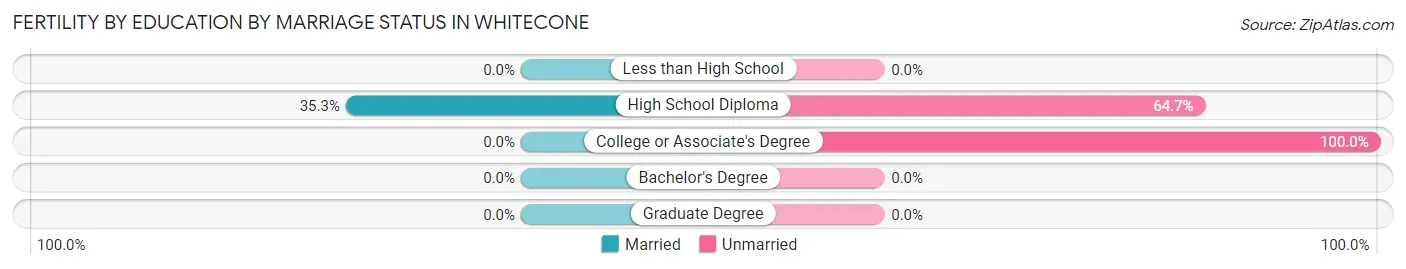
| Educational Attainment | Married | Unmarried |
| Less than High School | 0 (0.0%) | 0 (0.0%) |
| High School Diploma | 6 (35.3%) | 11 (64.7%) |
| College or Associate's Degree | 0 (0.0%) | 11 (100.0%) |
| Bachelor's Degree | 0 (0.0%) | 0 (0.0%) |
| Graduate Degree | 0 (0.0%) | 0 (0.0%) |
| Total | 6 (21.4%) | 22 (78.6%) |
Employment Characteristics in Whitecone
Employment by Class of Employer in Whitecone
Among the 162 employed individuals in Whitecone, private company employees (92 | 56.8%), state government employees (34 | 21.0%), and local government employees (22 | 13.6%) make up the most common classes of employment.
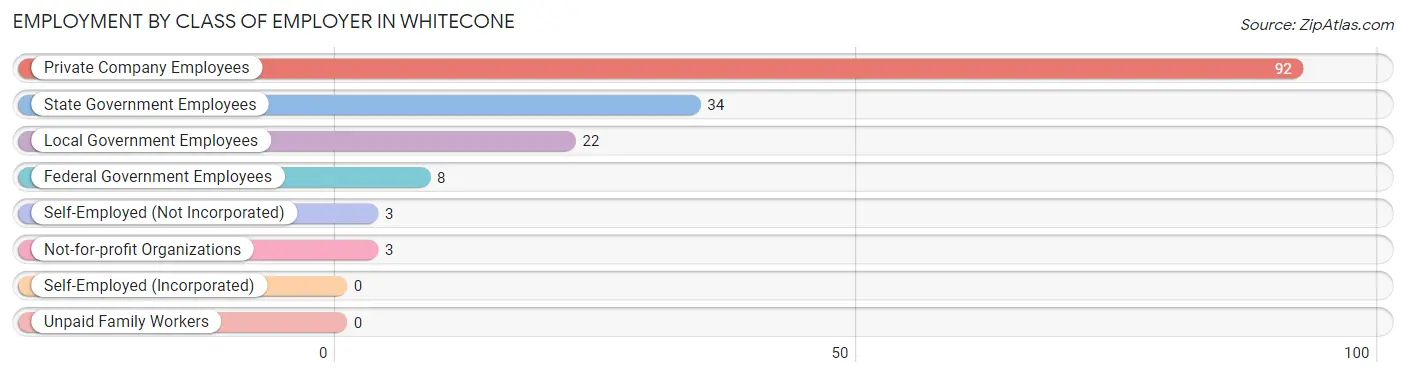
| Employer Class | # Employees | % Employees |
| Private Company Employees | 92 | 56.8% |
| Self-Employed (Incorporated) | 0 | 0.0% |
| Self-Employed (Not Incorporated) | 3 | 1.8% |
| Not-for-profit Organizations | 3 | 1.8% |
| Local Government Employees | 22 | 13.6% |
| State Government Employees | 34 | 21.0% |
| Federal Government Employees | 8 | 4.9% |
| Unpaid Family Workers | 0 | 0.0% |
| Total | 162 | 100.0% |
Employment Status by Age in Whitecone
According to the labor force statistics for Whitecone, out of the total population over 16 years of age (632), 32.1% or 203 individuals are in the labor force, with 20.2% or 41 of them unemployed. The age group with the highest labor force participation rate is 30 to 34 years, with 68.4% or 26 individuals in the labor force. Within the labor force, the 20 to 24 years age range has the highest percentage of unemployed individuals, with 55.6% or 10 of them being unemployed.
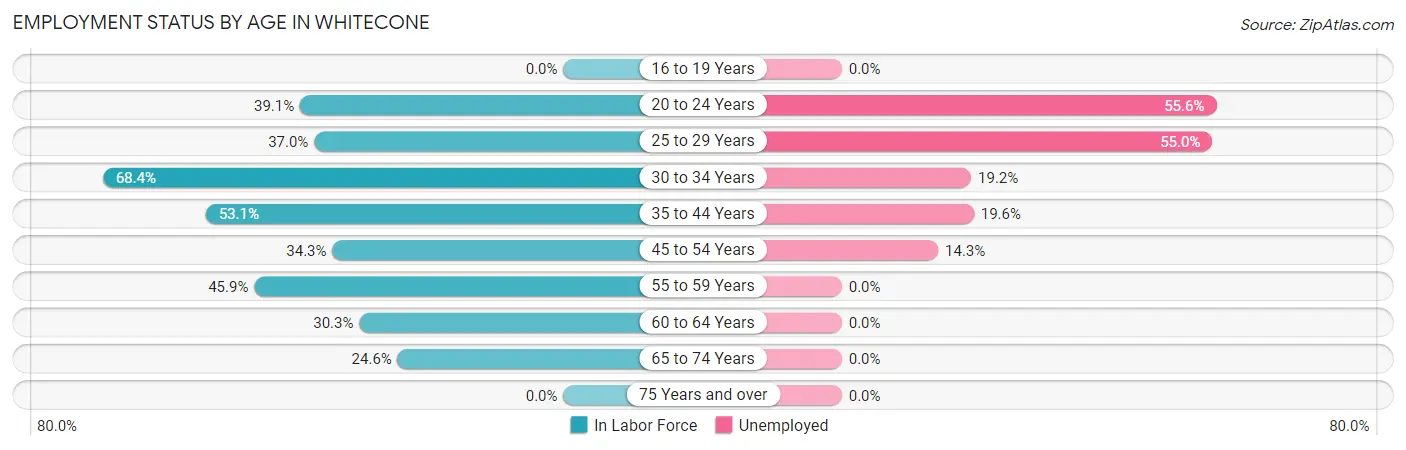
| Age Bracket | In Labor Force | Unemployed |
| 16 to 19 Years | 0 (0.0%) | 0 (0.0%) |
| 20 to 24 Years | 18 (39.1%) | 10 (55.6%) |
| 25 to 29 Years | 20 (37.0%) | 11 (55.0%) |
| 30 to 34 Years | 26 (68.4%) | 5 (19.2%) |
| 35 to 44 Years | 51 (53.1%) | 10 (19.6%) |
| 45 to 54 Years | 35 (34.3%) | 5 (14.3%) |
| 55 to 59 Years | 28 (45.9%) | 0 (0.0%) |
| 60 to 64 Years | 10 (30.3%) | 0 (0.0%) |
| 65 to 74 Years | 15 (24.6%) | 0 (0.0%) |
| 75 Years and over | 0 (0.0%) | 0 (0.0%) |
| Total | 203 (32.1%) | 41 (20.2%) |
Employment Status by Educational Attainment in Whitecone
According to labor force statistics for Whitecone, 44.3% of individuals (170) out of the total population between 25 and 64 years of age (384) are in the labor force, with 18.2% or 31 of them being unemployed. The group with the highest labor force participation rate are those with the educational attainment of bachelor's degree or higher, with 100.0% or 3 individuals in the labor force. Within the labor force, individuals with high school diploma education have the highest percentage of unemployment, with 31.4% or 16 of them being unemployed.
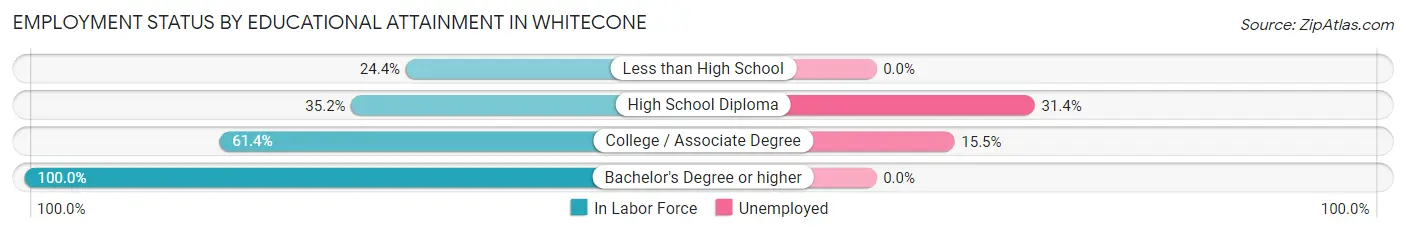
| Educational Attainment | In Labor Force | Unemployed |
| Less than High School | 19 (24.4%) | 0 (0.0%) |
| High School Diploma | 51 (35.2%) | 46 (31.4%) |
| College / Associate Degree | 97 (61.4%) | 24 (15.5%) |
| Bachelor's Degree or higher | 3 (100.0%) | 0 (0.0%) |
| Total | 170 (44.3%) | 70 (18.2%) |
Employment Occupations by Sex in Whitecone
Management, Business, Science and Arts Occupations
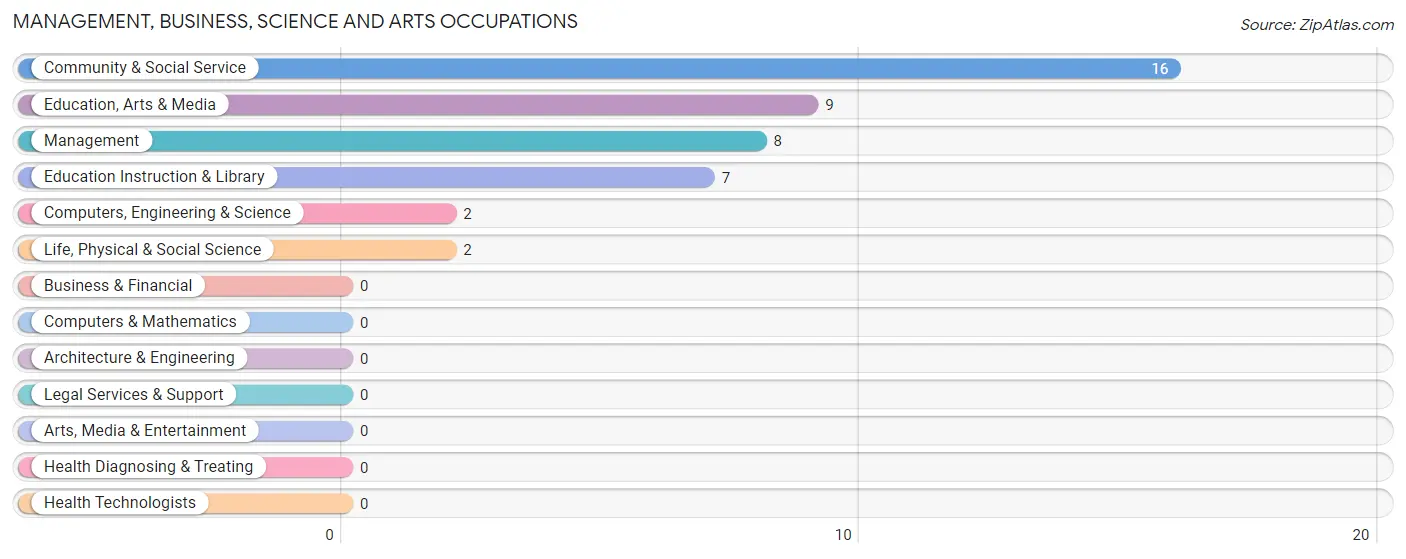
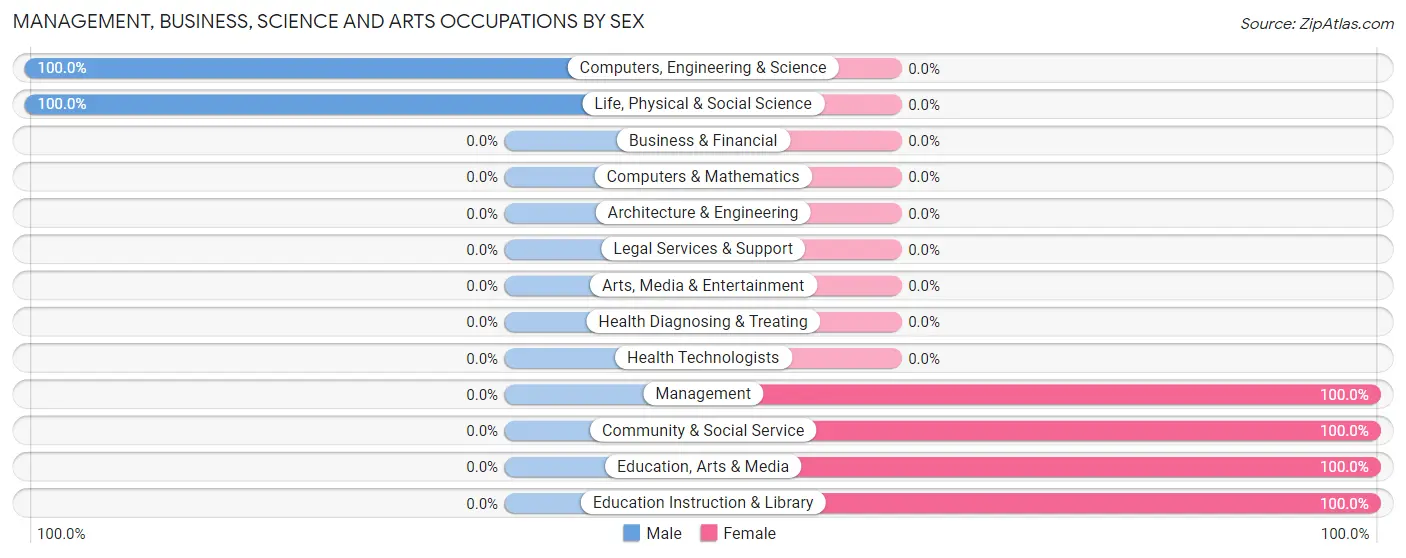
The most common Management, Business, Science and Arts occupations in Whitecone are Community & Social Service (16 | 9.9%), Education, Arts & Media (9 | 5.6%), Management (8 | 4.9%), Education Instruction & Library (7 | 4.3%), and Computers, Engineering & Science (2 | 1.2%).
Management, Business, Science and Arts Occupations by Sex
Within the Management, Business, Science and Arts occupations in Whitecone, the most male-oriented occupations are Computers, Engineering & Science (100.0%), and Life, Physical & Social Science (100.0%), while the most female-oriented occupations are Management (100.0%), Community & Social Service (100.0%), and Education, Arts & Media (100.0%).
| Occupation | Male | Female |
| Management | 0 (0.0%) | 8 (100.0%) |
| Business & Financial | 0 (0.0%) | 0 (0.0%) |
| Computers, Engineering & Science | 2 (100.0%) | 0 (0.0%) |
| Computers & Mathematics | 0 (0.0%) | 0 (0.0%) |
| Architecture & Engineering | 0 (0.0%) | 0 (0.0%) |
| Life, Physical & Social Science | 2 (100.0%) | 0 (0.0%) |
| Community & Social Service | 0 (0.0%) | 16 (100.0%) |
| Education, Arts & Media | 0 (0.0%) | 9 (100.0%) |
| Legal Services & Support | 0 (0.0%) | 0 (0.0%) |
| Education Instruction & Library | 0 (0.0%) | 7 (100.0%) |
| Arts, Media & Entertainment | 0 (0.0%) | 0 (0.0%) |
| Health Diagnosing & Treating | 0 (0.0%) | 0 (0.0%) |
| Health Technologists | 0 (0.0%) | 0 (0.0%) |
| Total (Category) | 2 (7.7%) | 24 (92.3%) |
| Total (Overall) | 61 (37.7%) | 101 (62.4%) |
Services Occupations
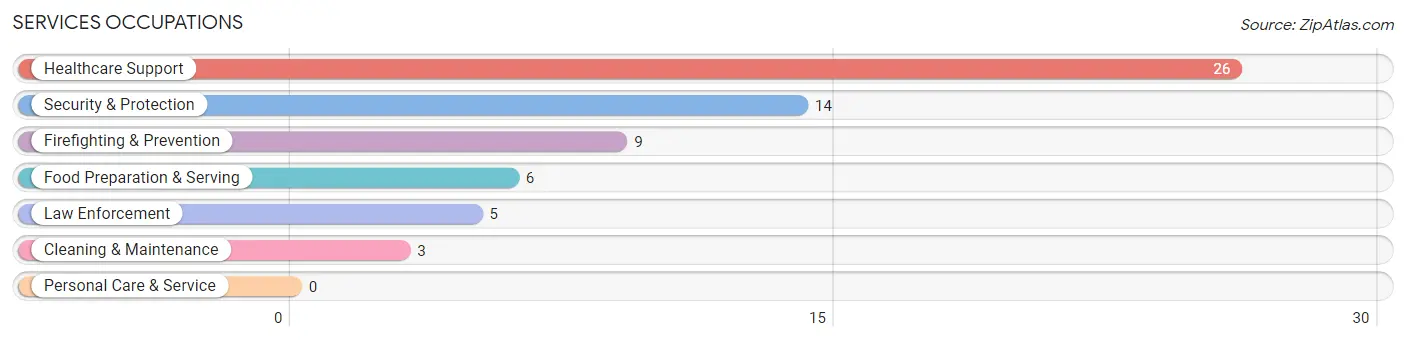
The most common Services occupations in Whitecone are Healthcare Support (26 | 16.1%), Security & Protection (14 | 8.6%), Firefighting & Prevention (9 | 5.6%), Food Preparation & Serving (6 | 3.7%), and Law Enforcement (5 | 3.1%).
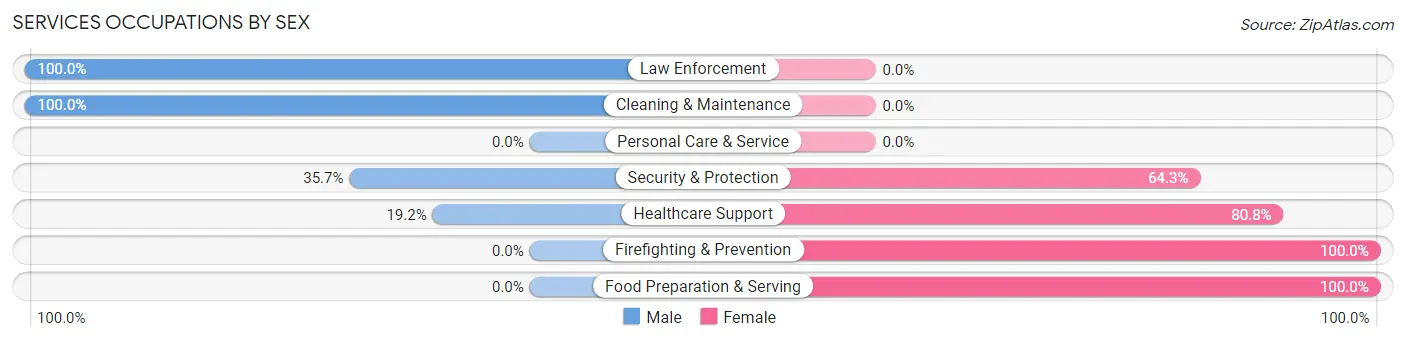
Services Occupations by Sex
Within the Services occupations in Whitecone, the most male-oriented occupations are Law Enforcement (100.0%), Cleaning & Maintenance (100.0%), and Security & Protection (35.7%), while the most female-oriented occupations are Firefighting & Prevention (100.0%), Food Preparation & Serving (100.0%), and Healthcare Support (80.8%).
| Occupation | Male | Female |
| Healthcare Support | 5 (19.2%) | 21 (80.8%) |
| Security & Protection | 5 (35.7%) | 9 (64.3%) |
| Firefighting & Prevention | 0 (0.0%) | 9 (100.0%) |
| Law Enforcement | 5 (100.0%) | 0 (0.0%) |
| Food Preparation & Serving | 0 (0.0%) | 6 (100.0%) |
| Cleaning & Maintenance | 3 (100.0%) | 0 (0.0%) |
| Personal Care & Service | 0 (0.0%) | 0 (0.0%) |
| Total (Category) | 13 (26.5%) | 36 (73.5%) |
| Total (Overall) | 61 (37.7%) | 101 (62.4%) |
Sales and Office Occupations
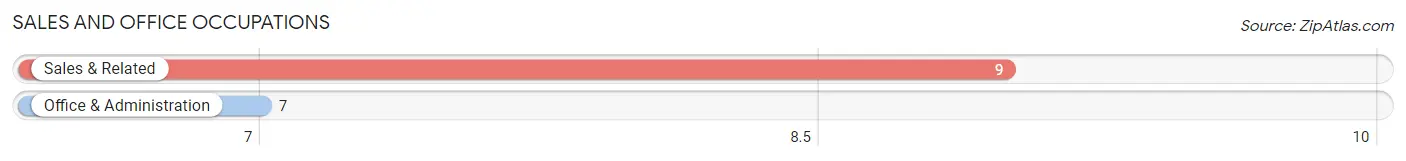
The most common Sales and Office occupations in Whitecone are Sales & Related (9 | 5.6%), and Office & Administration (7 | 4.3%).
Sales and Office Occupations by Sex
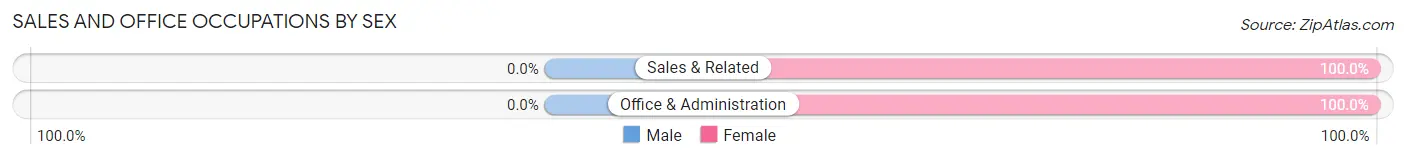
| Occupation | Male | Female |
| Sales & Related | 0 (0.0%) | 9 (100.0%) |
| Office & Administration | 0 (0.0%) | 7 (100.0%) |
| Total (Category) | 0 (0.0%) | 16 (100.0%) |
| Total (Overall) | 61 (37.7%) | 101 (62.4%) |
Natural Resources, Construction and Maintenance Occupations
The most common Natural Resources, Construction and Maintenance occupations in Whitecone are Construction & Extraction (29 | 17.9%), and Installation, Maintenance & Repair (7 | 4.3%).
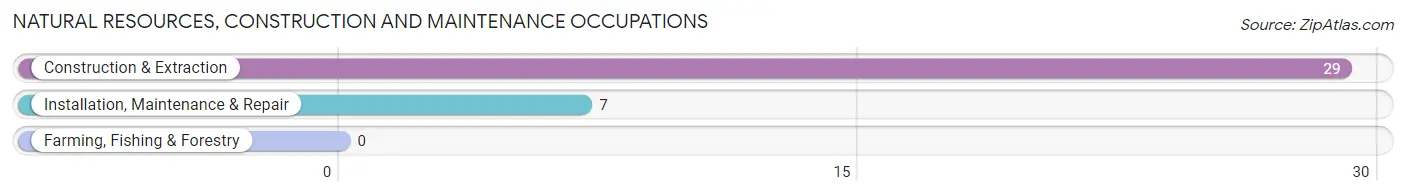
Natural Resources, Construction and Maintenance Occupations by Sex
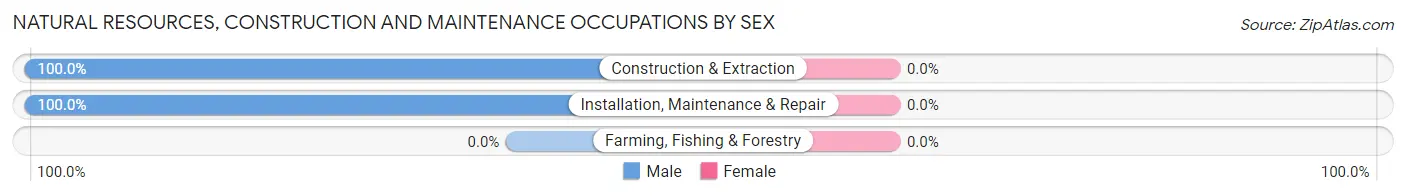
| Occupation | Male | Female |
| Farming, Fishing & Forestry | 0 (0.0%) | 0 (0.0%) |
| Construction & Extraction | 29 (100.0%) | 0 (0.0%) |
| Installation, Maintenance & Repair | 7 (100.0%) | 0 (0.0%) |
| Total (Category) | 36 (100.0%) | 0 (0.0%) |
| Total (Overall) | 61 (37.7%) | 101 (62.4%) |
Production, Transportation and Moving Occupations
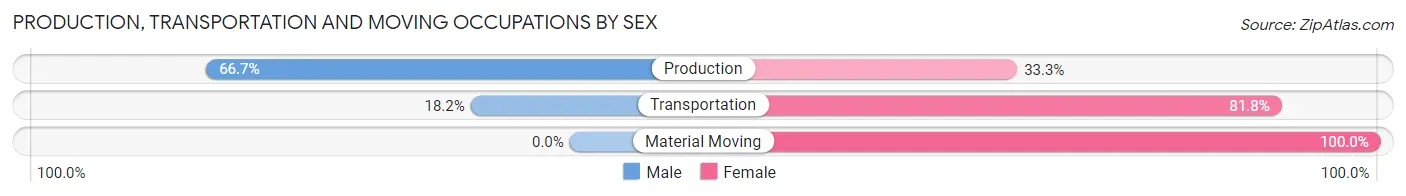
The most common Production, Transportation and Moving occupations in Whitecone are Transportation (22 | 13.6%), Production (9 | 5.6%), and Material Moving (4 | 2.5%).
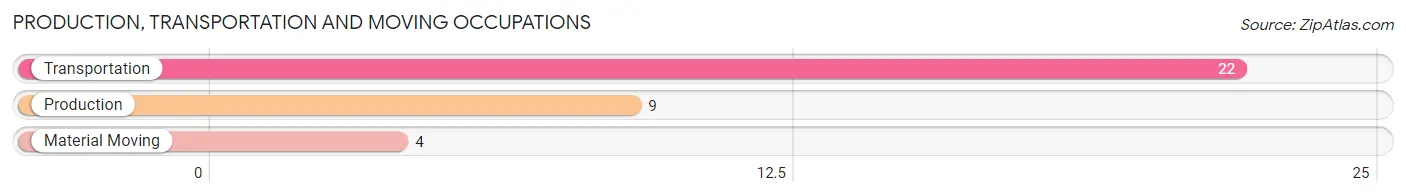
Production, Transportation and Moving Occupations by Sex
| Occupation | Male | Female |
| Production | 6 (66.7%) | 3 (33.3%) |
| Transportation | 4 (18.2%) | 18 (81.8%) |
| Material Moving | 0 (0.0%) | 4 (100.0%) |
| Total (Category) | 10 (28.6%) | 25 (71.4%) |
| Total (Overall) | 61 (37.7%) | 101 (62.4%) |
Employment Industries by Sex in Whitecone
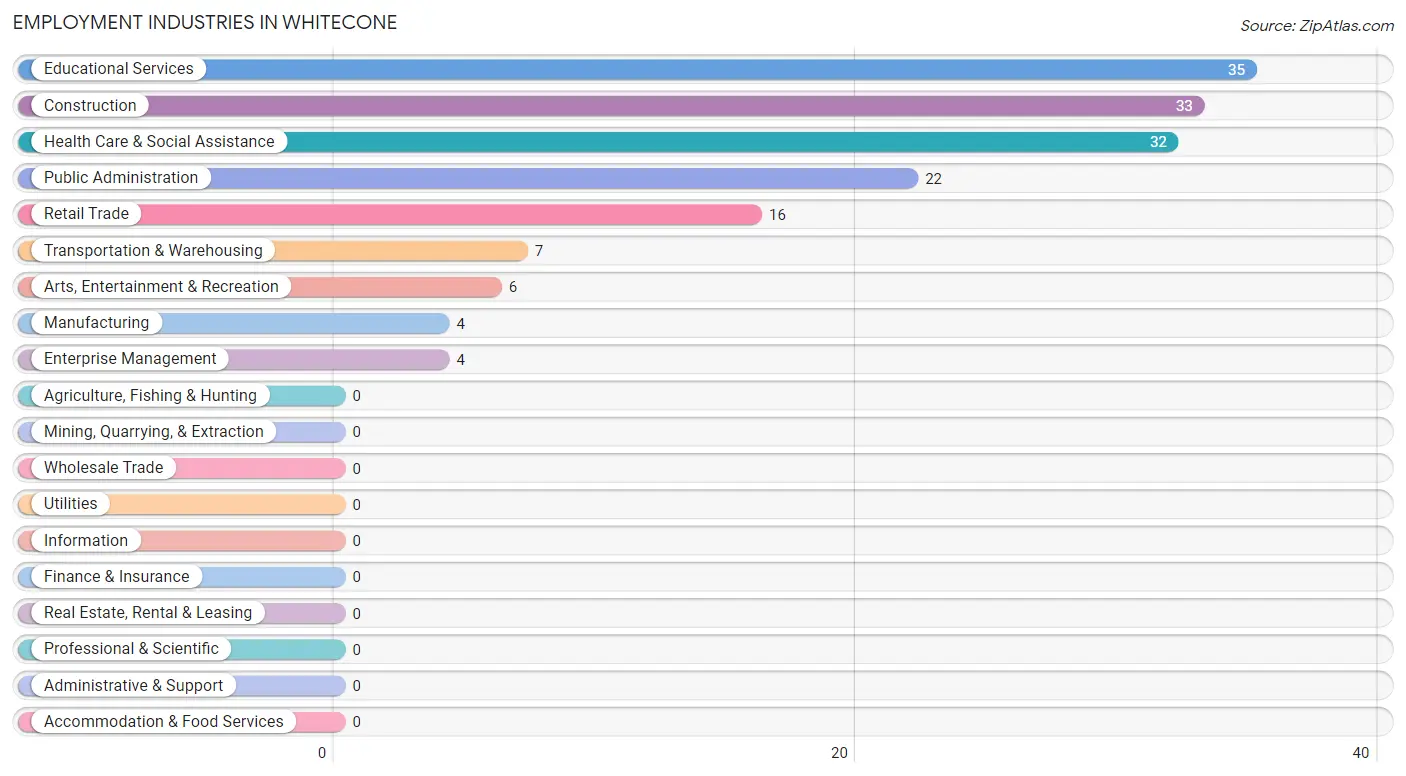
Employment Industries in Whitecone
The major employment industries in Whitecone include Educational Services (35 | 21.6%), Construction (33 | 20.4%), Health Care & Social Assistance (32 | 19.8%), Public Administration (22 | 13.6%), and Retail Trade (16 | 9.9%).
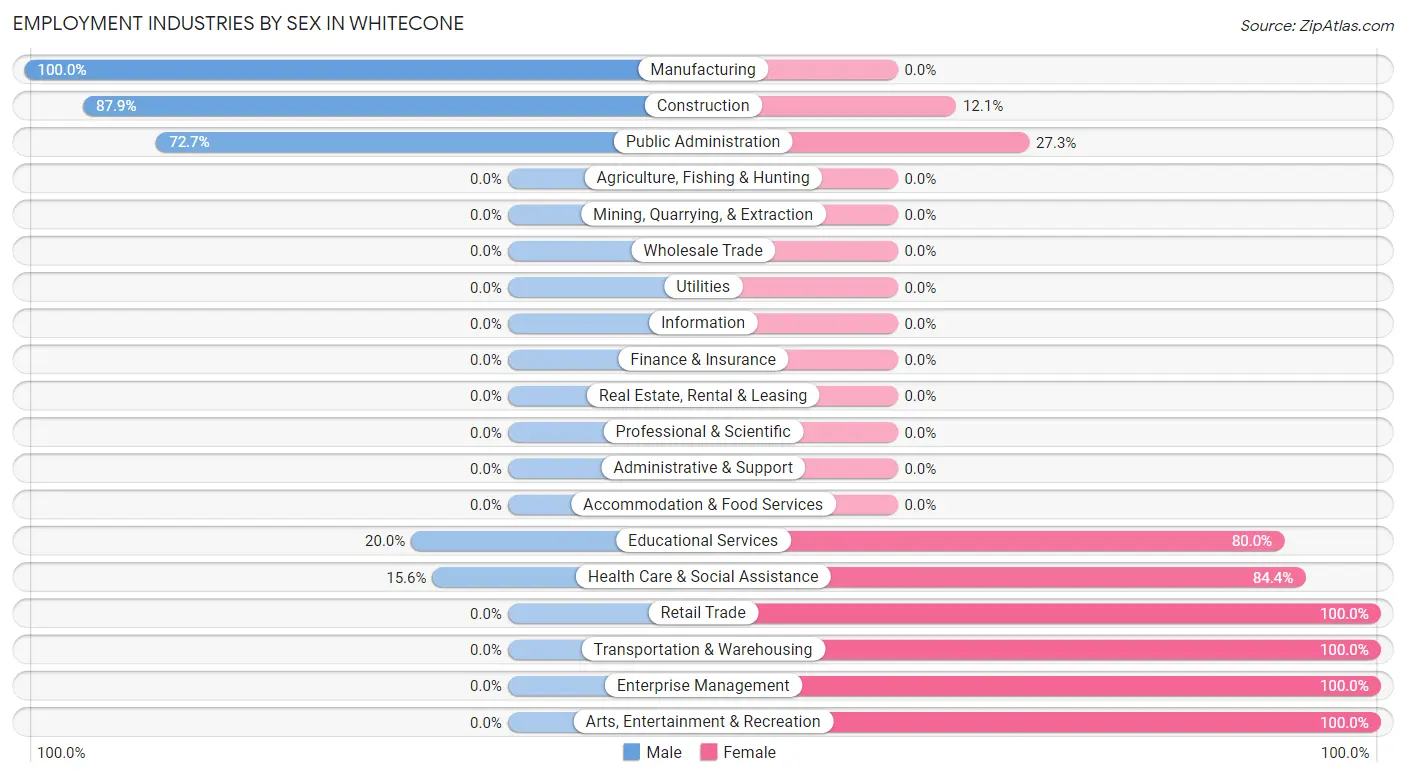
Employment Industries by Sex in Whitecone
The Whitecone industries that see more men than women are Manufacturing (100.0%), Construction (87.9%), and Public Administration (72.7%), whereas the industries that tend to have a higher number of women are Retail Trade (100.0%), Transportation & Warehousing (100.0%), and Enterprise Management (100.0%).
| Industry | Male | Female |
| Agriculture, Fishing & Hunting | 0 (0.0%) | 0 (0.0%) |
| Mining, Quarrying, & Extraction | 0 (0.0%) | 0 (0.0%) |
| Construction | 29 (87.9%) | 4 (12.1%) |
| Manufacturing | 4 (100.0%) | 0 (0.0%) |
| Wholesale Trade | 0 (0.0%) | 0 (0.0%) |
| Retail Trade | 0 (0.0%) | 16 (100.0%) |
| Transportation & Warehousing | 0 (0.0%) | 7 (100.0%) |
| Utilities | 0 (0.0%) | 0 (0.0%) |
| Information | 0 (0.0%) | 0 (0.0%) |
| Finance & Insurance | 0 (0.0%) | 0 (0.0%) |
| Real Estate, Rental & Leasing | 0 (0.0%) | 0 (0.0%) |
| Professional & Scientific | 0 (0.0%) | 0 (0.0%) |
| Enterprise Management | 0 (0.0%) | 4 (100.0%) |
| Administrative & Support | 0 (0.0%) | 0 (0.0%) |
| Educational Services | 7 (20.0%) | 28 (80.0%) |
| Health Care & Social Assistance | 5 (15.6%) | 27 (84.4%) |
| Arts, Entertainment & Recreation | 0 (0.0%) | 6 (100.0%) |
| Accommodation & Food Services | 0 (0.0%) | 0 (0.0%) |
| Public Administration | 16 (72.7%) | 6 (27.3%) |
| Total | 61 (37.7%) | 101 (62.4%) |
Education in Whitecone
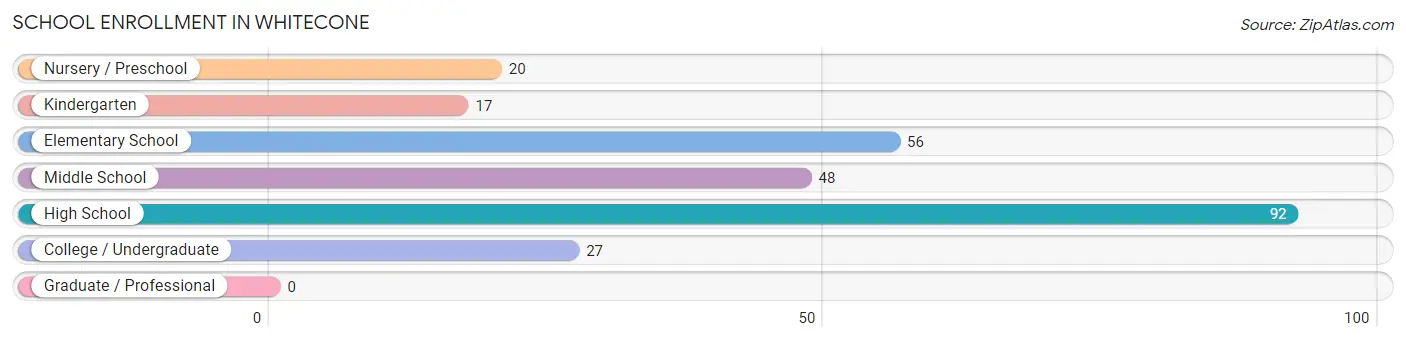
School Enrollment in Whitecone
The most common levels of schooling among the 260 students in Whitecone are high school (92 | 35.4%), elementary school (56 | 21.5%), and middle school (48 | 18.5%).
| School Level | # Students | % Students |
| Nursery / Preschool | 20 | 7.7% |
| Kindergarten | 17 | 6.5% |
| Elementary School | 56 | 21.5% |
| Middle School | 48 | 18.5% |
| High School | 92 | 35.4% |
| College / Undergraduate | 27 | 10.4% |
| Graduate / Professional | 0 | 0.0% |
| Total | 260 | 100.0% |
School Enrollment by Age by Funding Source in Whitecone
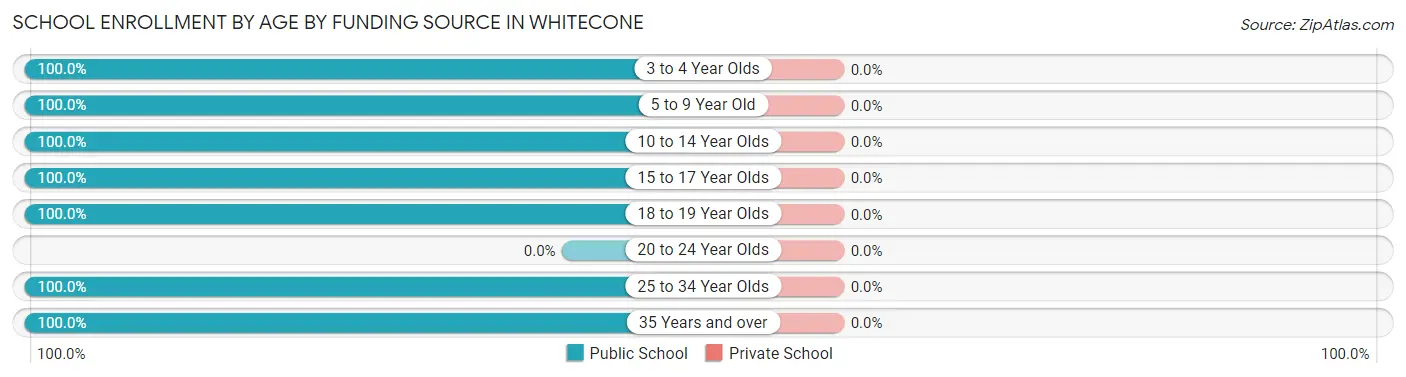
| Age Bracket | Public School | Private School |
| 3 to 4 Year Olds | 16 (100.0%) | 0 (0.0%) |
| 5 to 9 Year Old | 70 (100.0%) | 0 (0.0%) |
| 10 to 14 Year Olds | 59 (100.0%) | 0 (0.0%) |
| 15 to 17 Year Olds | 65 (100.0%) | 0 (0.0%) |
| 18 to 19 Year Olds | 35 (100.0%) | 0 (0.0%) |
| 20 to 24 Year Olds | 0 (0.0%) | 0 (0.0%) |
| 25 to 34 Year Olds | 5 (100.0%) | 0 (0.0%) |
| 35 Years and over | 10 (100.0%) | 0 (0.0%) |
| Total | 260 (100.0%) | 0 (0.0%) |
Educational Attainment by Field of Study in Whitecone
Psychology (3 | 37.5%), education (3 | 37.5%), and bio, nature & agricultural (2 | 25.0%) are the most common fields of study among 8 individuals in Whitecone who have obtained a bachelor's degree or higher.
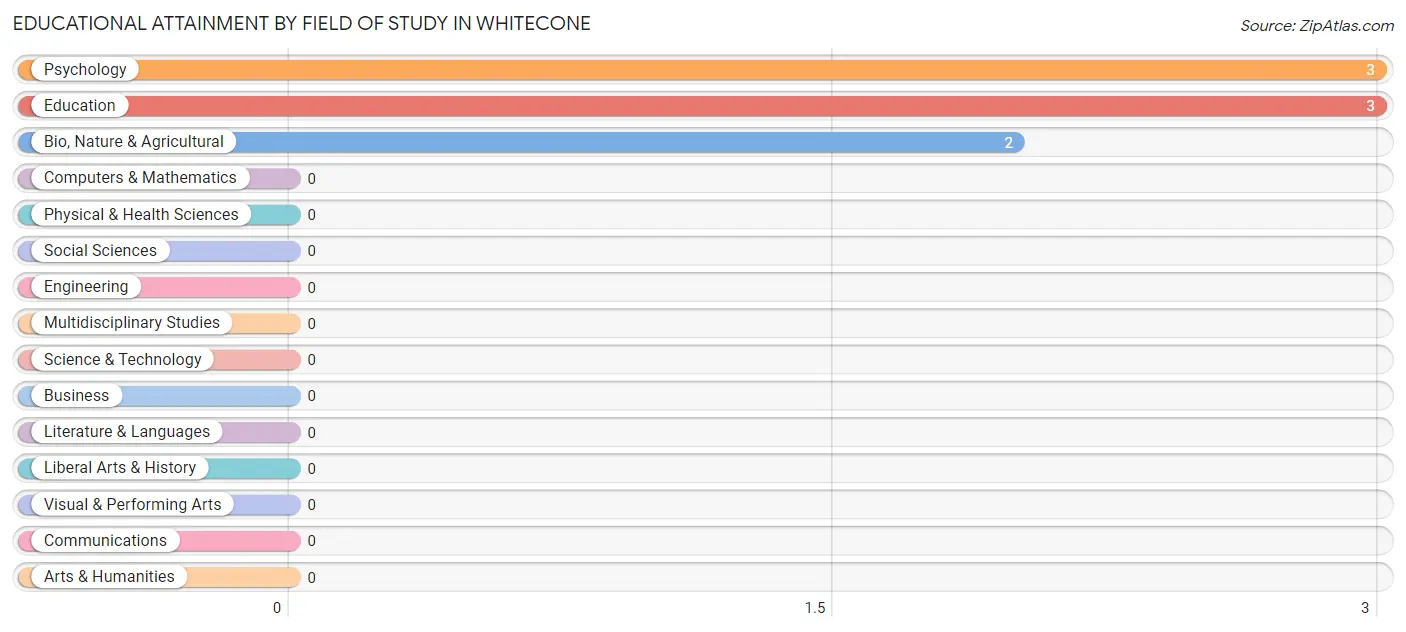
| Field of Study | # Graduates | % Graduates |
| Computers & Mathematics | 0 | 0.0% |
| Bio, Nature & Agricultural | 2 | 25.0% |
| Physical & Health Sciences | 0 | 0.0% |
| Psychology | 3 | 37.5% |
| Social Sciences | 0 | 0.0% |
| Engineering | 0 | 0.0% |
| Multidisciplinary Studies | 0 | 0.0% |
| Science & Technology | 0 | 0.0% |
| Business | 0 | 0.0% |
| Education | 3 | 37.5% |
| Literature & Languages | 0 | 0.0% |
| Liberal Arts & History | 0 | 0.0% |
| Visual & Performing Arts | 0 | 0.0% |
| Communications | 0 | 0.0% |
| Arts & Humanities | 0 | 0.0% |
| Total | 8 | 100.0% |
Transportation & Commute in Whitecone
Vehicle Availability by Sex in Whitecone
The most prevalent vehicle ownership categories in Whitecone are males with 2 vehicles (35, accounting for 57.4%) and females with 2 vehicles (48, making up 34.6%).
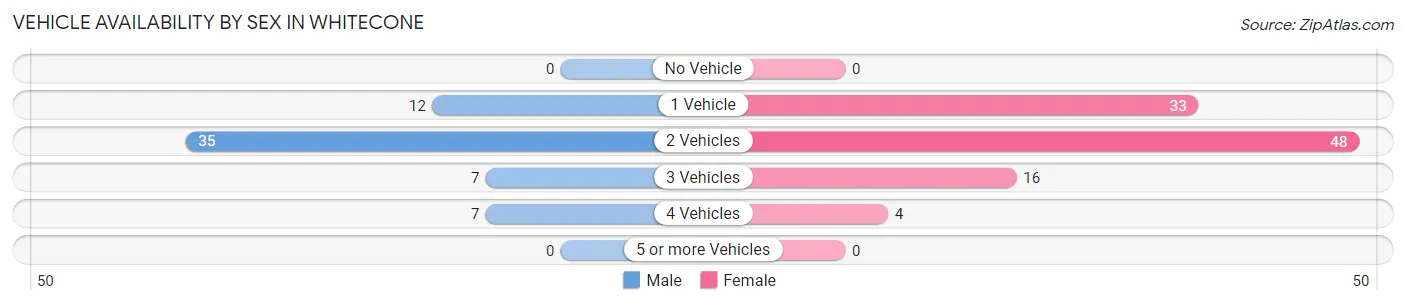
| Vehicles Available | Male | Female |
| No Vehicle | 0 (0.0%) | 0 (0.0%) |
| 1 Vehicle | 12 (19.7%) | 33 (32.7%) |
| 2 Vehicles | 35 (57.4%) | 48 (47.5%) |
| 3 Vehicles | 7 (11.5%) | 16 (15.8%) |
| 4 Vehicles | 7 (11.5%) | 4 (4.0%) |
| 5 or more Vehicles | 0 (0.0%) | 0 (0.0%) |
| Total | 61 (100.0%) | 101 (100.0%) |
Commute Time in Whitecone
The most frequently occuring commute durations in Whitecone are 60 to 89 minutes (50 commuters, 34.5%), 30 to 34 minutes (23 commuters, 15.9%), and 90 or more minutes (23 commuters, 15.9%).
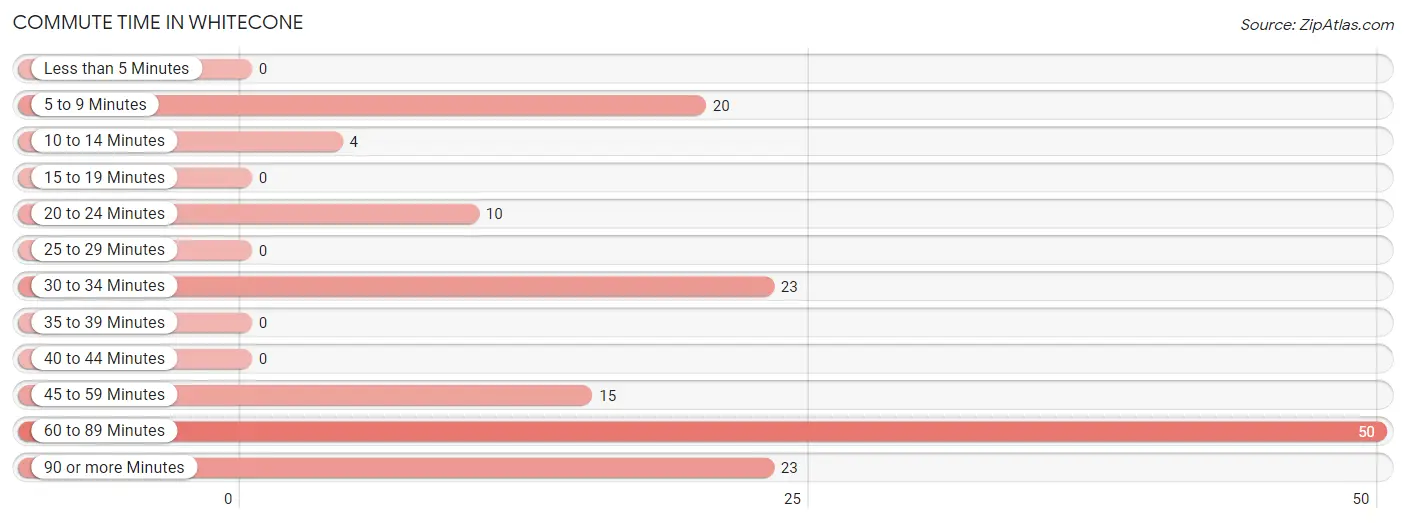
| Commute Time | # Commuters | % Commuters |
| Less than 5 Minutes | 0 | 0.0% |
| 5 to 9 Minutes | 20 | 13.8% |
| 10 to 14 Minutes | 4 | 2.8% |
| 15 to 19 Minutes | 0 | 0.0% |
| 20 to 24 Minutes | 10 | 6.9% |
| 25 to 29 Minutes | 0 | 0.0% |
| 30 to 34 Minutes | 23 | 15.9% |
| 35 to 39 Minutes | 0 | 0.0% |
| 40 to 44 Minutes | 0 | 0.0% |
| 45 to 59 Minutes | 15 | 10.3% |
| 60 to 89 Minutes | 50 | 34.5% |
| 90 or more Minutes | 23 | 15.9% |
Commute Time by Sex in Whitecone
The most common commute times in Whitecone are 90 or more minutes (20 commuters, 35.7%) for males and 60 to 89 minutes (33 commuters, 37.1%) for females.
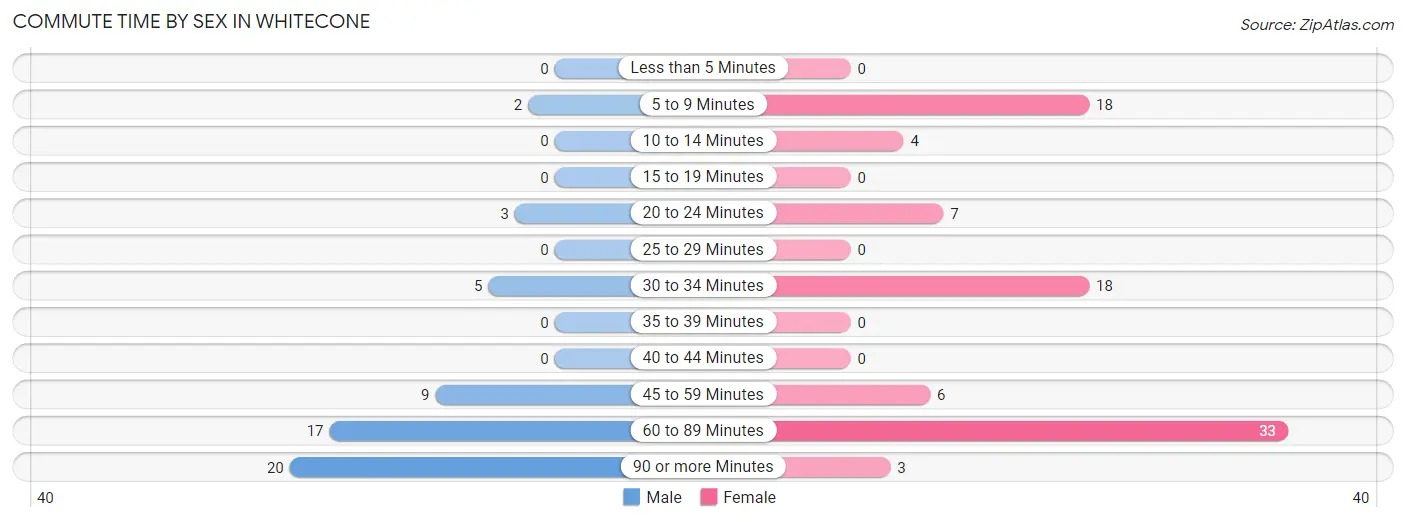
| Commute Time | Male | Female |
| Less than 5 Minutes | 0 (0.0%) | 0 (0.0%) |
| 5 to 9 Minutes | 2 (3.6%) | 18 (20.2%) |
| 10 to 14 Minutes | 0 (0.0%) | 4 (4.5%) |
| 15 to 19 Minutes | 0 (0.0%) | 0 (0.0%) |
| 20 to 24 Minutes | 3 (5.4%) | 7 (7.9%) |
| 25 to 29 Minutes | 0 (0.0%) | 0 (0.0%) |
| 30 to 34 Minutes | 5 (8.9%) | 18 (20.2%) |
| 35 to 39 Minutes | 0 (0.0%) | 0 (0.0%) |
| 40 to 44 Minutes | 0 (0.0%) | 0 (0.0%) |
| 45 to 59 Minutes | 9 (16.1%) | 6 (6.7%) |
| 60 to 89 Minutes | 17 (30.4%) | 33 (37.1%) |
| 90 or more Minutes | 20 (35.7%) | 3 (3.4%) |
Time of Departure to Work by Sex in Whitecone
The most frequent times of departure to work in Whitecone are 6:00 AM to 6:29 AM (27, 48.2%) for males and 7:00 AM to 7:29 AM (20, 22.5%) for females.
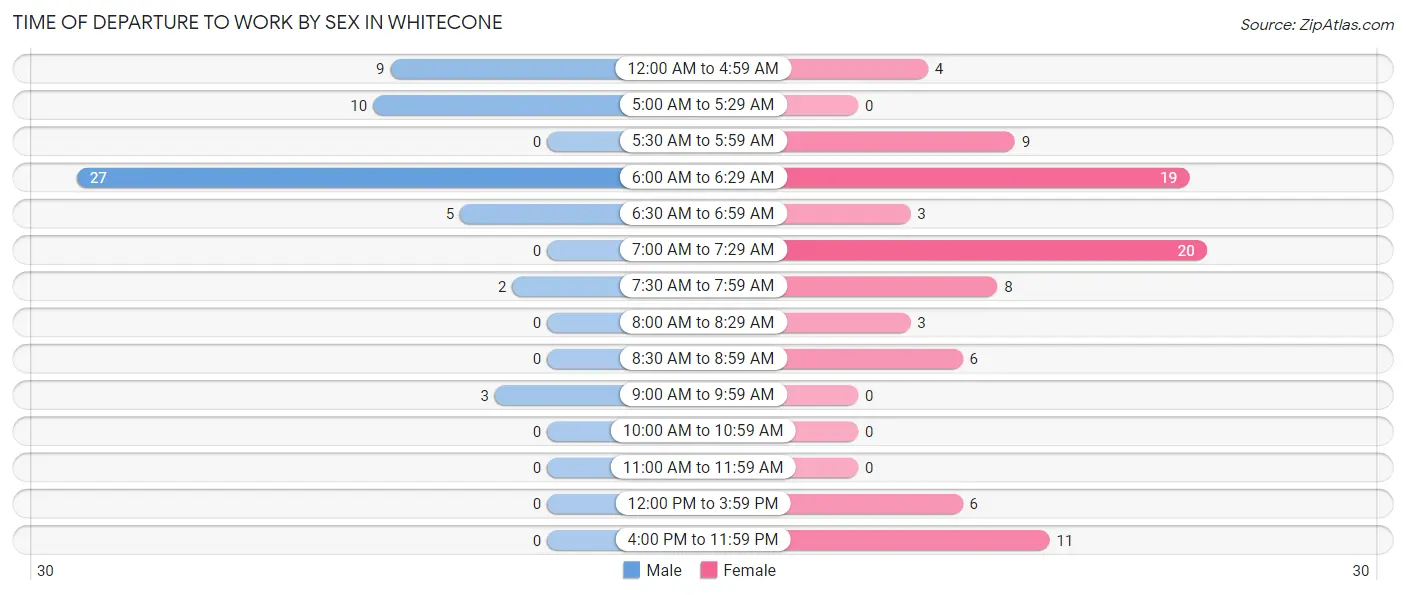
| Time of Departure | Male | Female |
| 12:00 AM to 4:59 AM | 9 (16.1%) | 4 (4.5%) |
| 5:00 AM to 5:29 AM | 10 (17.9%) | 0 (0.0%) |
| 5:30 AM to 5:59 AM | 0 (0.0%) | 9 (10.1%) |
| 6:00 AM to 6:29 AM | 27 (48.2%) | 19 (21.3%) |
| 6:30 AM to 6:59 AM | 5 (8.9%) | 3 (3.4%) |
| 7:00 AM to 7:29 AM | 0 (0.0%) | 20 (22.5%) |
| 7:30 AM to 7:59 AM | 2 (3.6%) | 8 (9.0%) |
| 8:00 AM to 8:29 AM | 0 (0.0%) | 3 (3.4%) |
| 8:30 AM to 8:59 AM | 0 (0.0%) | 6 (6.7%) |
| 9:00 AM to 9:59 AM | 3 (5.4%) | 0 (0.0%) |
| 10:00 AM to 10:59 AM | 0 (0.0%) | 0 (0.0%) |
| 11:00 AM to 11:59 AM | 0 (0.0%) | 0 (0.0%) |
| 12:00 PM to 3:59 PM | 0 (0.0%) | 6 (6.7%) |
| 4:00 PM to 11:59 PM | 0 (0.0%) | 11 (12.4%) |
| Total | 56 (100.0%) | 89 (100.0%) |
Housing Occupancy in Whitecone
Occupancy by Ownership in Whitecone
Of the total 277 dwellings in Whitecone, owner-occupied units account for 169 (61.0%), while renter-occupied units make up 108 (39.0%).
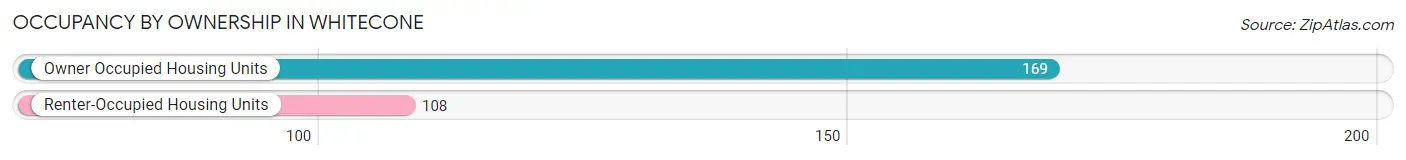
| Occupancy | # Housing Units | % Housing Units |
| Owner Occupied Housing Units | 169 | 61.0% |
| Renter-Occupied Housing Units | 108 | 39.0% |
| Total Occupied Housing Units | 277 | 100.0% |
Occupancy by Household Size in Whitecone
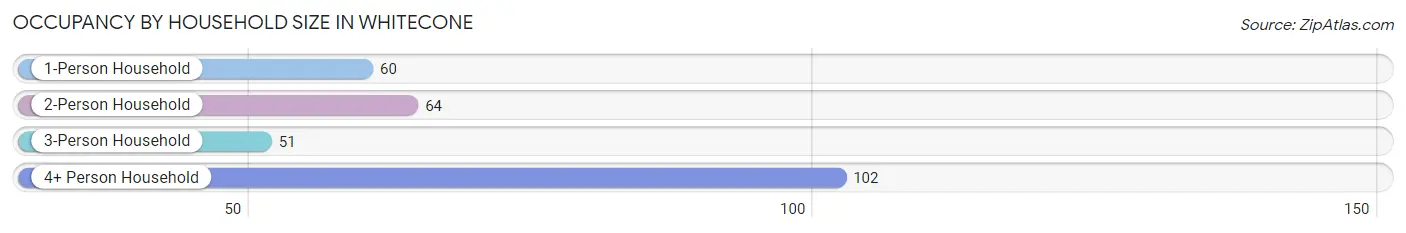
| Household Size | # Housing Units | % Housing Units |
| 1-Person Household | 60 | 21.7% |
| 2-Person Household | 64 | 23.1% |
| 3-Person Household | 51 | 18.4% |
| 4+ Person Household | 102 | 36.8% |
| Total Housing Units | 277 | 100.0% |
Occupancy by Ownership by Household Size in Whitecone
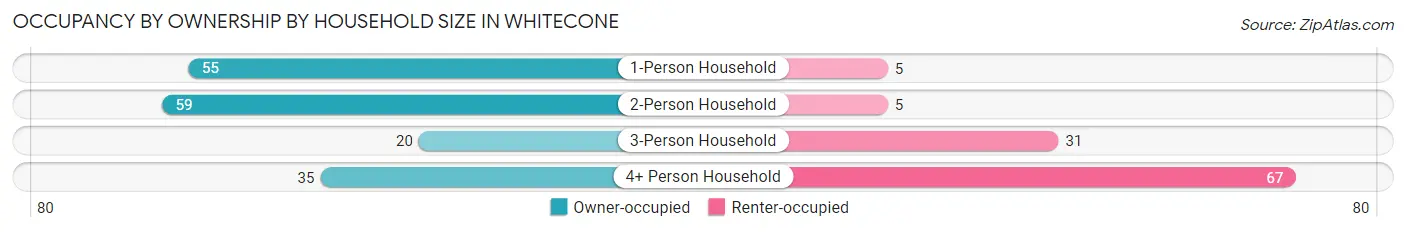
| Household Size | Owner-occupied | Renter-occupied |
| 1-Person Household | 55 (91.7%) | 5 (8.3%) |
| 2-Person Household | 59 (92.2%) | 5 (7.8%) |
| 3-Person Household | 20 (39.2%) | 31 (60.8%) |
| 4+ Person Household | 35 (34.3%) | 67 (65.7%) |
| Total Housing Units | 169 (61.0%) | 108 (39.0%) |
Occupancy by Educational Attainment in Whitecone
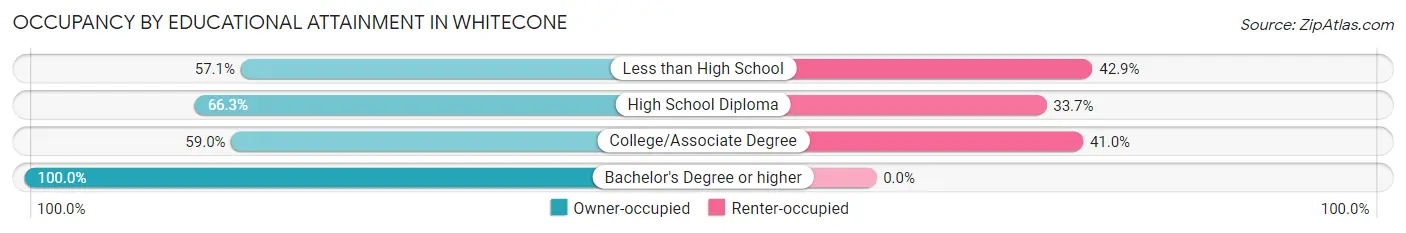
| Household Size | Owner-occupied | Renter-occupied |
| Less than High School | 52 (57.1%) | 39 (42.9%) |
| High School Diploma | 55 (66.3%) | 28 (33.7%) |
| College/Associate Degree | 59 (59.0%) | 41 (41.0%) |
| Bachelor's Degree or higher | 3 (100.0%) | 0 (0.0%) |
Occupancy by Age of Householder in Whitecone
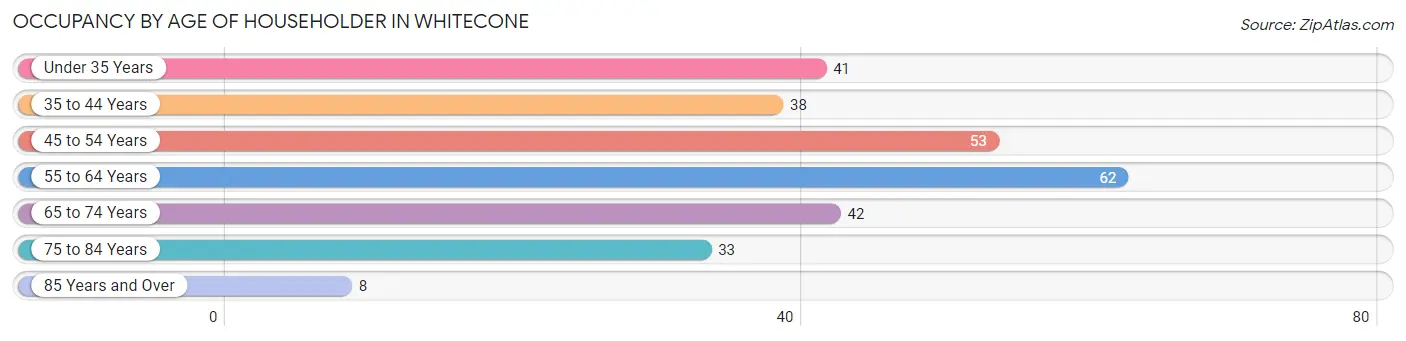
| Age Bracket | # Households | % Households |
| Under 35 Years | 41 | 14.8% |
| 35 to 44 Years | 38 | 13.7% |
| 45 to 54 Years | 53 | 19.1% |
| 55 to 64 Years | 62 | 22.4% |
| 65 to 74 Years | 42 | 15.2% |
| 75 to 84 Years | 33 | 11.9% |
| 85 Years and Over | 8 | 2.9% |
| Total | 277 | 100.0% |
Housing Finances in Whitecone
Median Income by Occupancy in Whitecone
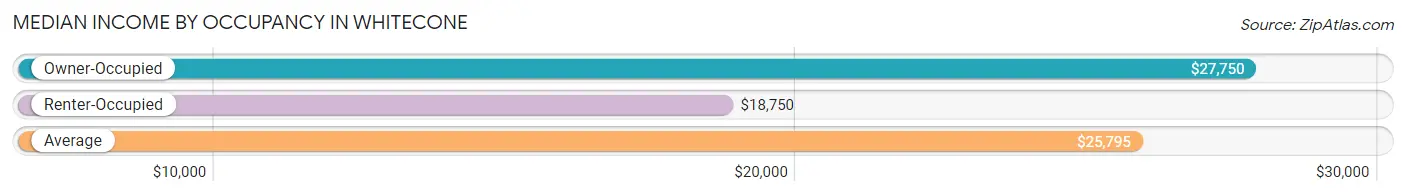
| Occupancy Type | # Households | Median Income |
| Owner-Occupied | 169 (61.0%) | $27,750 |
| Renter-Occupied | 108 (39.0%) | $18,750 |
| Average | 277 (100.0%) | $25,795 |
Occupancy by Householder Income Bracket in Whitecone
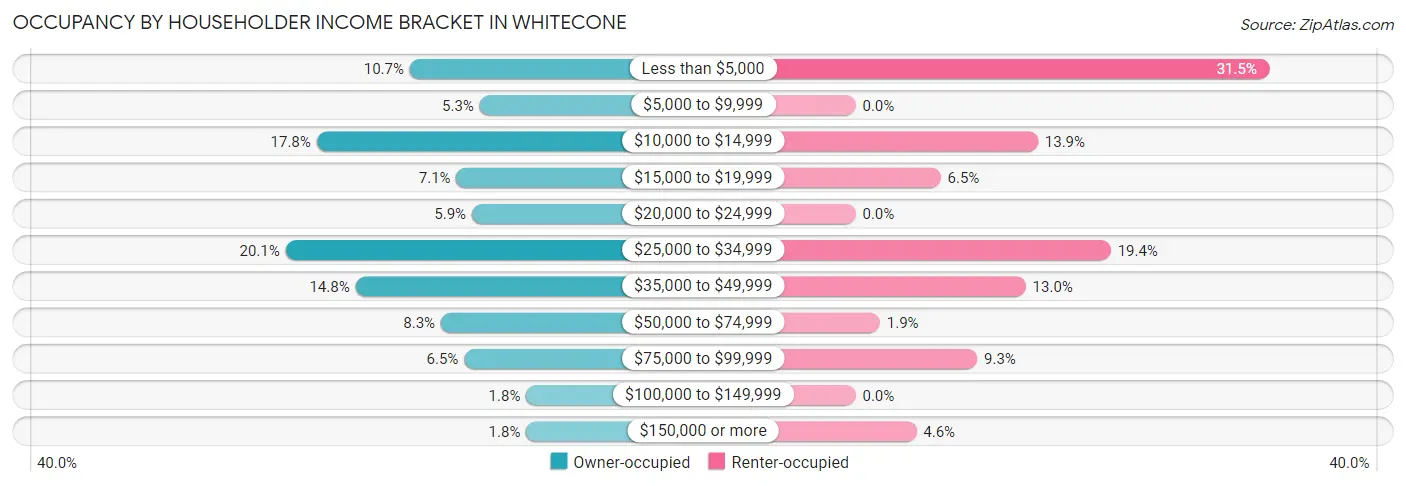
| Income Bracket | Owner-occupied | Renter-occupied |
| Less than $5,000 | 18 (10.6%) | 34 (31.5%) |
| $5,000 to $9,999 | 9 (5.3%) | 0 (0.0%) |
| $10,000 to $14,999 | 30 (17.7%) | 15 (13.9%) |
| $15,000 to $19,999 | 12 (7.1%) | 7 (6.5%) |
| $20,000 to $24,999 | 10 (5.9%) | 0 (0.0%) |
| $25,000 to $34,999 | 34 (20.1%) | 21 (19.4%) |
| $35,000 to $49,999 | 25 (14.8%) | 14 (13.0%) |
| $50,000 to $74,999 | 14 (8.3%) | 2 (1.8%) |
| $75,000 to $99,999 | 11 (6.5%) | 10 (9.3%) |
| $100,000 to $149,999 | 3 (1.8%) | 0 (0.0%) |
| $150,000 or more | 3 (1.8%) | 5 (4.6%) |
| Total | 169 (100.0%) | 108 (100.0%) |
Monthly Housing Cost Tiers in Whitecone
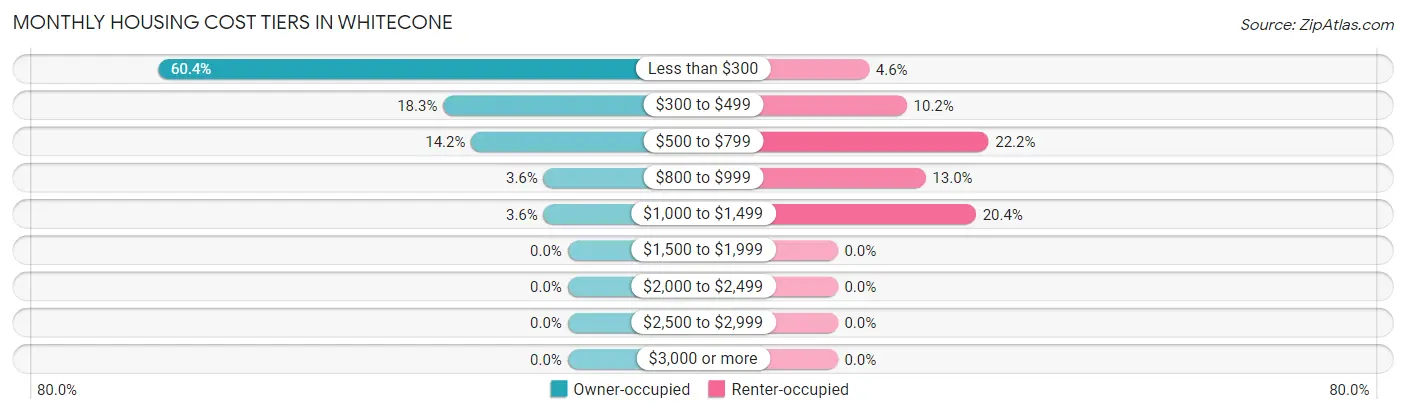
| Monthly Cost | Owner-occupied | Renter-occupied |
| Less than $300 | 102 (60.4%) | 5 (4.6%) |
| $300 to $499 | 31 (18.3%) | 11 (10.2%) |
| $500 to $799 | 24 (14.2%) | 24 (22.2%) |
| $800 to $999 | 6 (3.5%) | 14 (13.0%) |
| $1,000 to $1,499 | 6 (3.5%) | 22 (20.4%) |
| $1,500 to $1,999 | 0 (0.0%) | 0 (0.0%) |
| $2,000 to $2,499 | 0 (0.0%) | 0 (0.0%) |
| $2,500 to $2,999 | 0 (0.0%) | 0 (0.0%) |
| $3,000 or more | 0 (0.0%) | 0 (0.0%) |
| Total | 169 (100.0%) | 108 (100.0%) |
Physical Housing Characteristics in Whitecone
Housing Structures in Whitecone
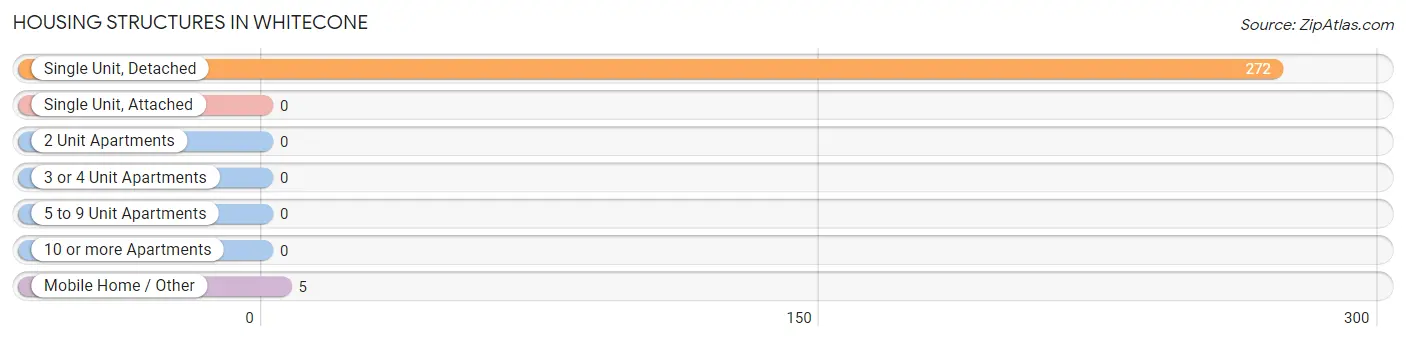
| Structure Type | # Housing Units | % Housing Units |
| Single Unit, Detached | 272 | 98.2% |
| Single Unit, Attached | 0 | 0.0% |
| 2 Unit Apartments | 0 | 0.0% |
| 3 or 4 Unit Apartments | 0 | 0.0% |
| 5 to 9 Unit Apartments | 0 | 0.0% |
| 10 or more Apartments | 0 | 0.0% |
| Mobile Home / Other | 5 | 1.8% |
| Total | 277 | 100.0% |
Housing Structures by Occupancy in Whitecone
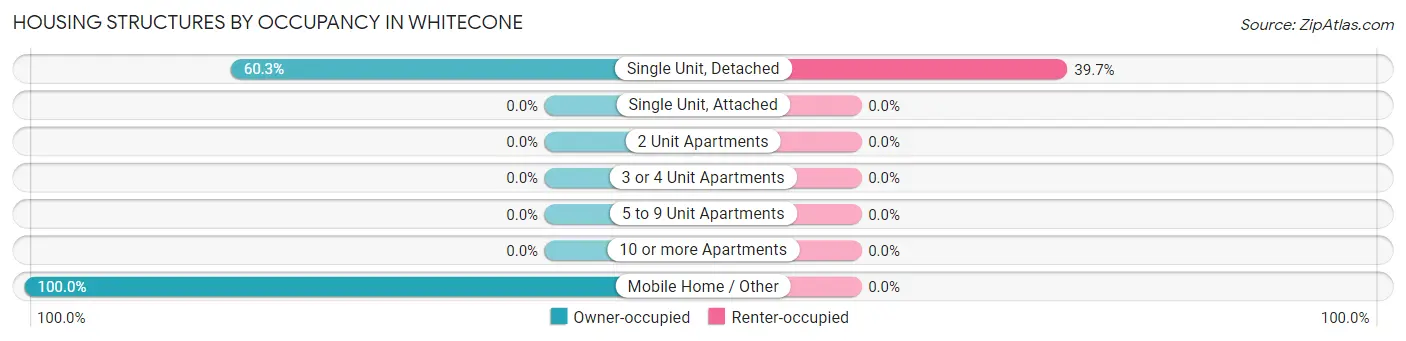
| Structure Type | Owner-occupied | Renter-occupied |
| Single Unit, Detached | 164 (60.3%) | 108 (39.7%) |
| Single Unit, Attached | 0 (0.0%) | 0 (0.0%) |
| 2 Unit Apartments | 0 (0.0%) | 0 (0.0%) |
| 3 or 4 Unit Apartments | 0 (0.0%) | 0 (0.0%) |
| 5 to 9 Unit Apartments | 0 (0.0%) | 0 (0.0%) |
| 10 or more Apartments | 0 (0.0%) | 0 (0.0%) |
| Mobile Home / Other | 5 (100.0%) | 0 (0.0%) |
| Total | 169 (61.0%) | 108 (39.0%) |
Housing Structures by Number of Rooms in Whitecone
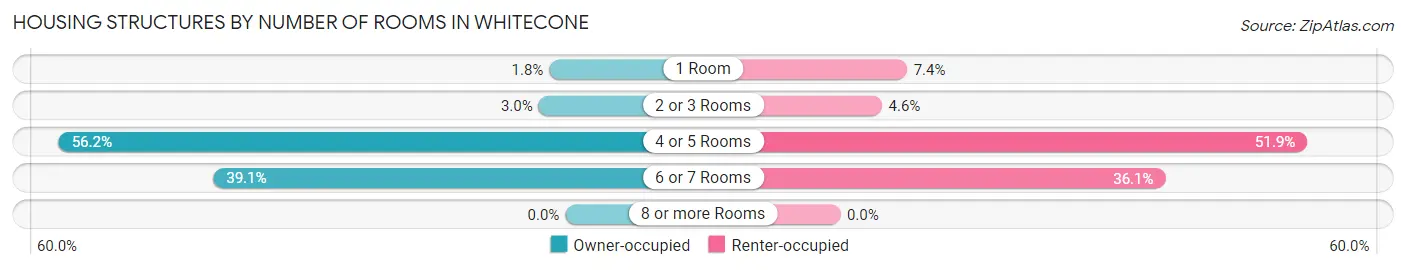
| Number of Rooms | Owner-occupied | Renter-occupied |
| 1 Room | 3 (1.8%) | 8 (7.4%) |
| 2 or 3 Rooms | 5 (3.0%) | 5 (4.6%) |
| 4 or 5 Rooms | 95 (56.2%) | 56 (51.8%) |
| 6 or 7 Rooms | 66 (39.1%) | 39 (36.1%) |
| 8 or more Rooms | 0 (0.0%) | 0 (0.0%) |
| Total | 169 (100.0%) | 108 (100.0%) |
Housing Structure by Heating Type in Whitecone
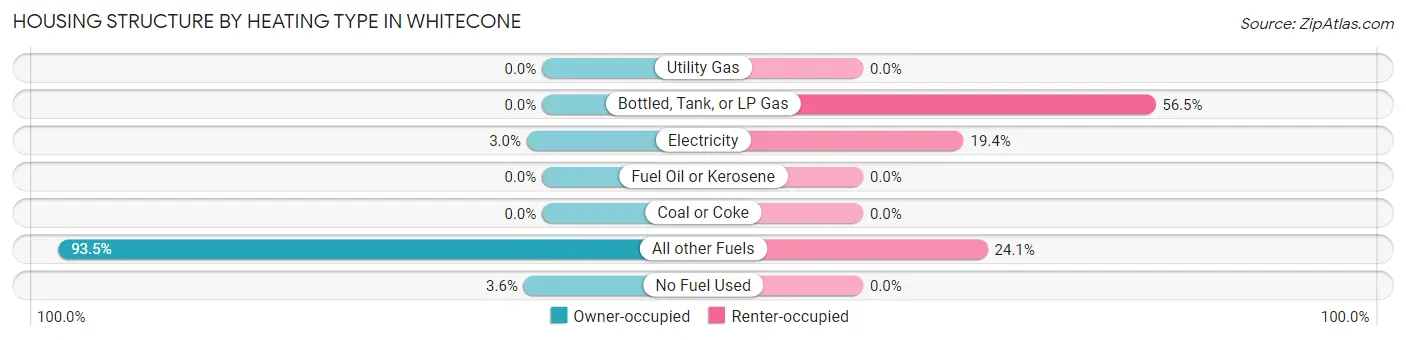
| Heating Type | Owner-occupied | Renter-occupied |
| Utility Gas | 0 (0.0%) | 0 (0.0%) |
| Bottled, Tank, or LP Gas | 0 (0.0%) | 61 (56.5%) |
| Electricity | 5 (3.0%) | 21 (19.4%) |
| Fuel Oil or Kerosene | 0 (0.0%) | 0 (0.0%) |
| Coal or Coke | 0 (0.0%) | 0 (0.0%) |
| All other Fuels | 158 (93.5%) | 26 (24.1%) |
| No Fuel Used | 6 (3.5%) | 0 (0.0%) |
| Total | 169 (100.0%) | 108 (100.0%) |
Household Vehicle Usage in Whitecone
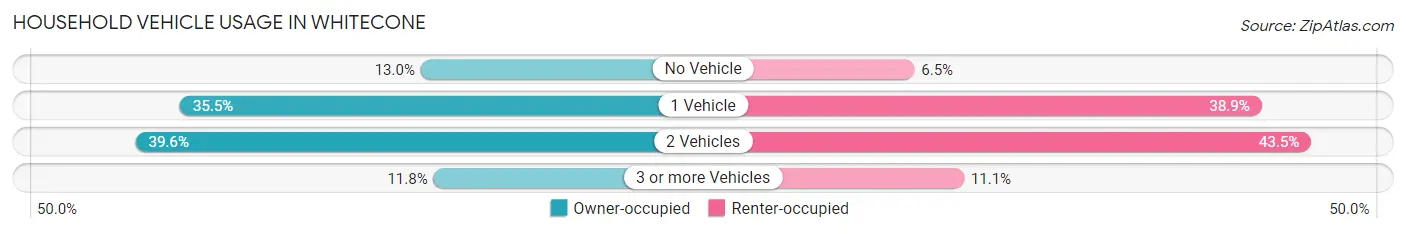
| Vehicles per Household | Owner-occupied | Renter-occupied |
| No Vehicle | 22 (13.0%) | 7 (6.5%) |
| 1 Vehicle | 60 (35.5%) | 42 (38.9%) |
| 2 Vehicles | 67 (39.6%) | 47 (43.5%) |
| 3 or more Vehicles | 20 (11.8%) | 12 (11.1%) |
| Total | 169 (100.0%) | 108 (100.0%) |
Real Estate & Mortgages in Whitecone
Real Estate and Mortgage Overview in Whitecone
| Characteristic | Without Mortgage | With Mortgage |
| Housing Units | 156 | 13 |
| Median Property Value | $115,300 | $137,500 |
| Median Household Income | $27,667 | $0 |
| Monthly Housing Costs | $233 | $0 |
| Real Estate Taxes | - | - |
Property Value by Mortgage Status in Whitecone
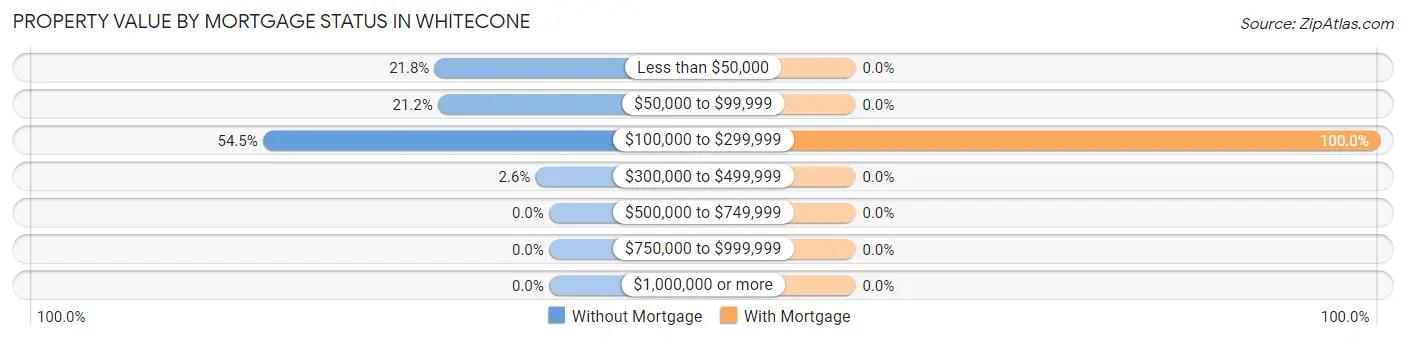
| Property Value | Without Mortgage | With Mortgage |
| Less than $50,000 | 34 (21.8%) | 0 (0.0%) |
| $50,000 to $99,999 | 33 (21.1%) | 0 (0.0%) |
| $100,000 to $299,999 | 85 (54.5%) | 13 (100.0%) |
| $300,000 to $499,999 | 4 (2.6%) | 0 (0.0%) |
| $500,000 to $749,999 | 0 (0.0%) | 0 (0.0%) |
| $750,000 to $999,999 | 0 (0.0%) | 0 (0.0%) |
| $1,000,000 or more | 0 (0.0%) | 0 (0.0%) |
| Total | 156 (100.0%) | 13 (100.0%) |
Household Income by Mortgage Status in Whitecone
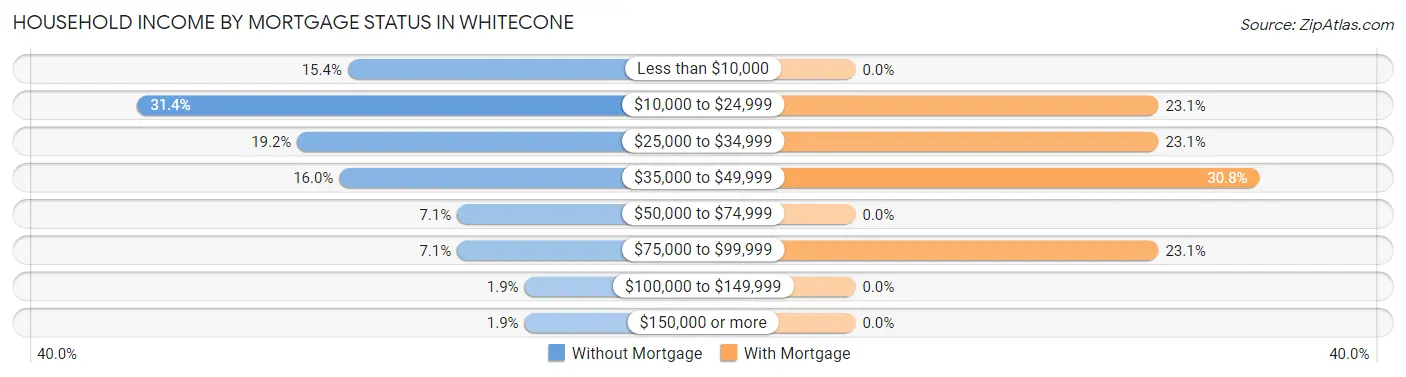
| Household Income | Without Mortgage | With Mortgage |
| Less than $10,000 | 24 (15.4%) | 0 (0.0%) |
| $10,000 to $24,999 | 49 (31.4%) | 3 (23.1%) |
| $25,000 to $34,999 | 30 (19.2%) | 3 (23.1%) |
| $35,000 to $49,999 | 25 (16.0%) | 4 (30.8%) |
| $50,000 to $74,999 | 11 (7.0%) | 0 (0.0%) |
| $75,000 to $99,999 | 11 (7.0%) | 3 (23.1%) |
| $100,000 to $149,999 | 3 (1.9%) | 0 (0.0%) |
| $150,000 or more | 3 (1.9%) | 0 (0.0%) |
| Total | 156 (100.0%) | 13 (100.0%) |
Property Value to Household Income Ratio in Whitecone
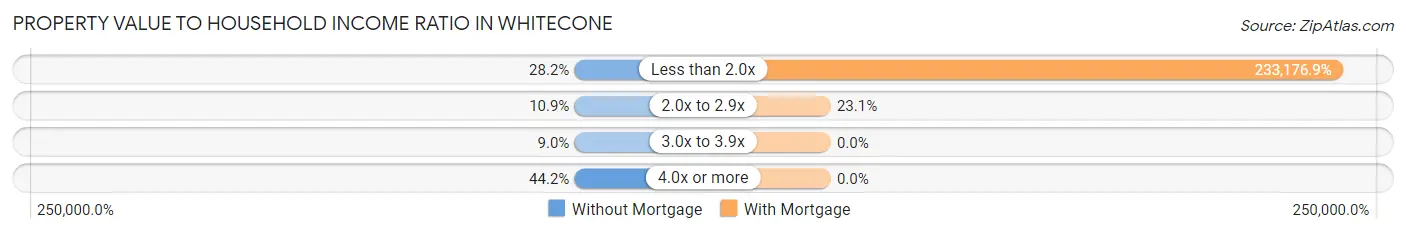
| Value-to-Income Ratio | Without Mortgage | With Mortgage |
| Less than 2.0x | 44 (28.2%) | 30,313 (233,176.9%) |
| 2.0x to 2.9x | 17 (10.9%) | 3 (23.1%) |
| 3.0x to 3.9x | 14 (9.0%) | 0 (0.0%) |
| 4.0x or more | 69 (44.2%) | 0 (0.0%) |
| Total | 156 (100.0%) | 13 (100.0%) |
Real Estate Taxes by Mortgage Status in Whitecone
| Property Taxes | Without Mortgage | With Mortgage |
| Less than $800 | 0 (0.0%) | 0 (0.0%) |
| $800 to $1,499 | 0 (0.0%) | 0 (0.0%) |
| $800 to $1,499 | 0 (0.0%) | 0 (0.0%) |
| Total | 156 (100.0%) | 13 (100.0%) |
Health & Disability in Whitecone
Health Insurance Coverage by Age in Whitecone
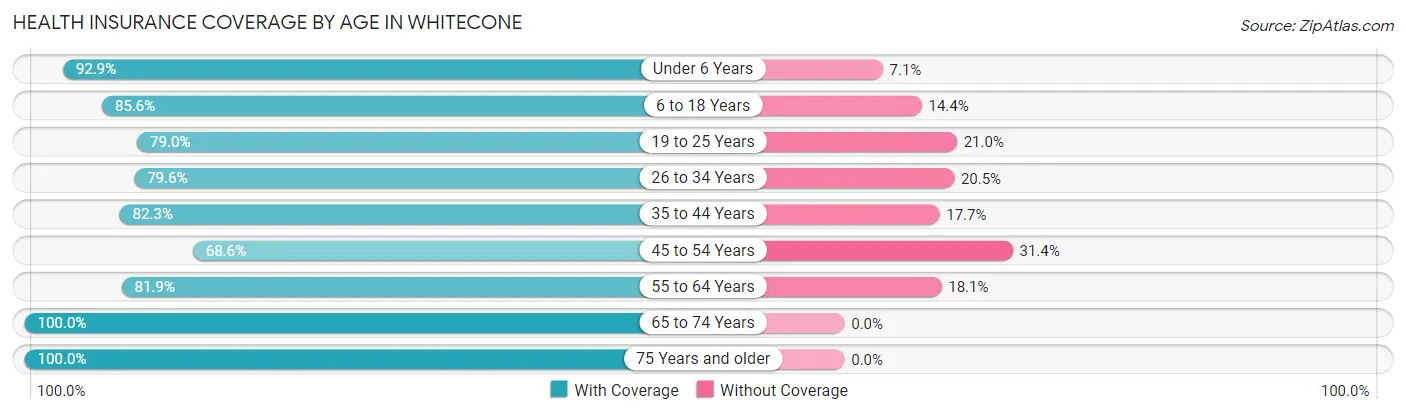
| Age Bracket | With Coverage | Without Coverage |
| Under 6 Years | 91 (92.9%) | 7 (7.1%) |
| 6 to 18 Years | 196 (85.6%) | 33 (14.4%) |
| 19 to 25 Years | 49 (79.0%) | 13 (21.0%) |
| 26 to 34 Years | 70 (79.5%) | 18 (20.4%) |
| 35 to 44 Years | 79 (82.3%) | 17 (17.7%) |
| 45 to 54 Years | 70 (68.6%) | 32 (31.4%) |
| 55 to 64 Years | 77 (81.9%) | 17 (18.1%) |
| 65 to 74 Years | 61 (100.0%) | 0 (0.0%) |
| 75 Years and older | 62 (100.0%) | 0 (0.0%) |
| Total | 755 (84.6%) | 137 (15.4%) |
Health Insurance Coverage by Citizenship Status in Whitecone
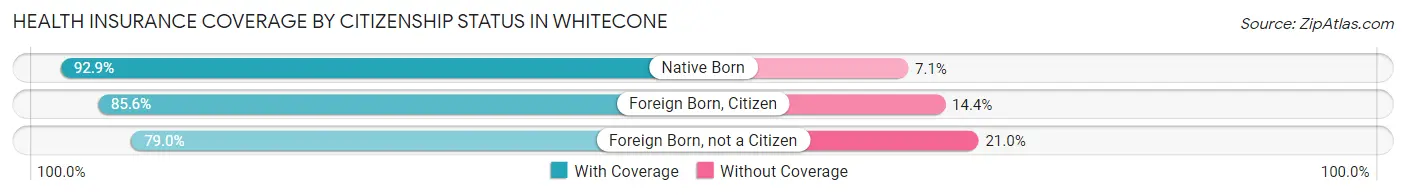
| Citizenship Status | With Coverage | Without Coverage |
| Native Born | 91 (92.9%) | 7 (7.1%) |
| Foreign Born, Citizen | 196 (85.6%) | 33 (14.4%) |
| Foreign Born, not a Citizen | 49 (79.0%) | 13 (21.0%) |
Health Insurance Coverage by Household Income in Whitecone
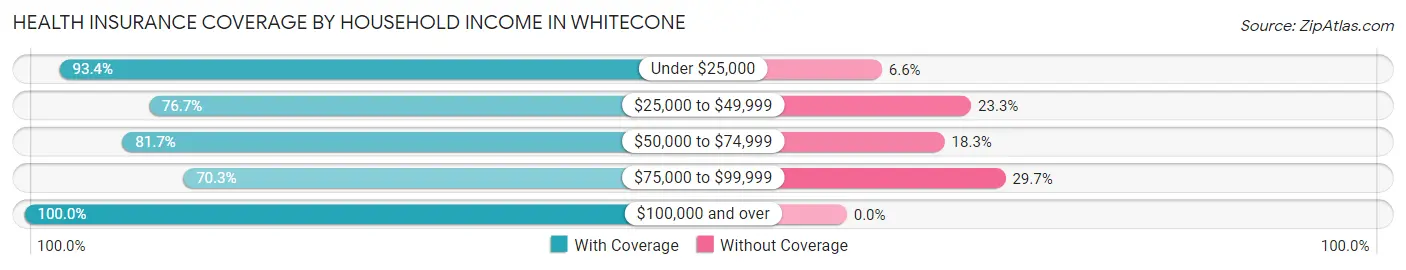
| Household Income | With Coverage | Without Coverage |
| Under $25,000 | 313 (93.4%) | 22 (6.6%) |
| $25,000 to $49,999 | 270 (76.7%) | 82 (23.3%) |
| $50,000 to $74,999 | 49 (81.7%) | 11 (18.3%) |
| $75,000 to $99,999 | 52 (70.3%) | 22 (29.7%) |
| $100,000 and over | 71 (100.0%) | 0 (0.0%) |
Public vs Private Health Insurance Coverage by Age in Whitecone
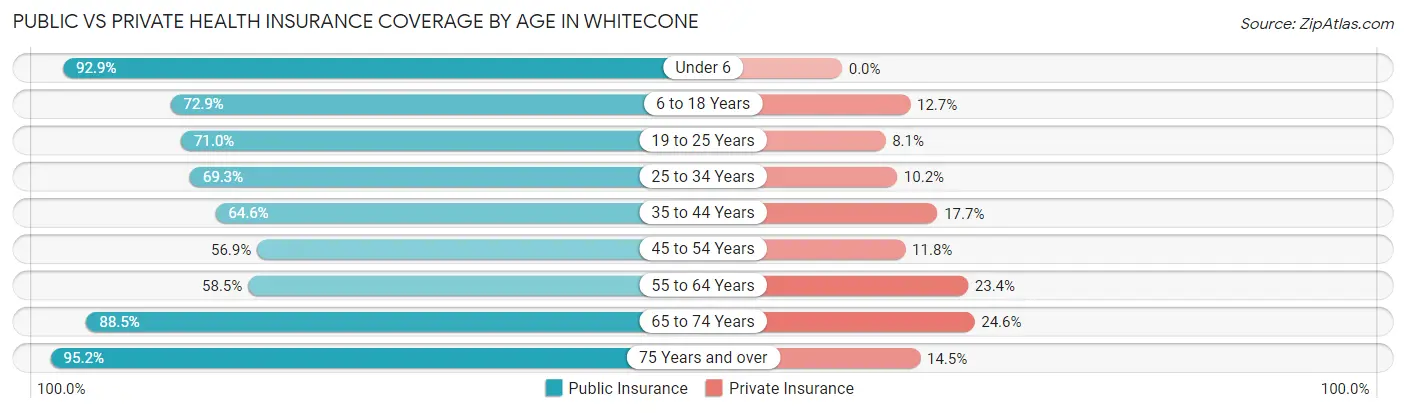
| Age Bracket | Public Insurance | Private Insurance |
| Under 6 | 91 (92.9%) | 0 (0.0%) |
| 6 to 18 Years | 167 (72.9%) | 29 (12.7%) |
| 19 to 25 Years | 44 (71.0%) | 5 (8.1%) |
| 25 to 34 Years | 61 (69.3%) | 9 (10.2%) |
| 35 to 44 Years | 62 (64.6%) | 17 (17.7%) |
| 45 to 54 Years | 58 (56.9%) | 12 (11.8%) |
| 55 to 64 Years | 55 (58.5%) | 22 (23.4%) |
| 65 to 74 Years | 54 (88.5%) | 15 (24.6%) |
| 75 Years and over | 59 (95.2%) | 9 (14.5%) |
| Total | 651 (73.0%) | 118 (13.2%) |
Disability Status by Sex by Age in Whitecone
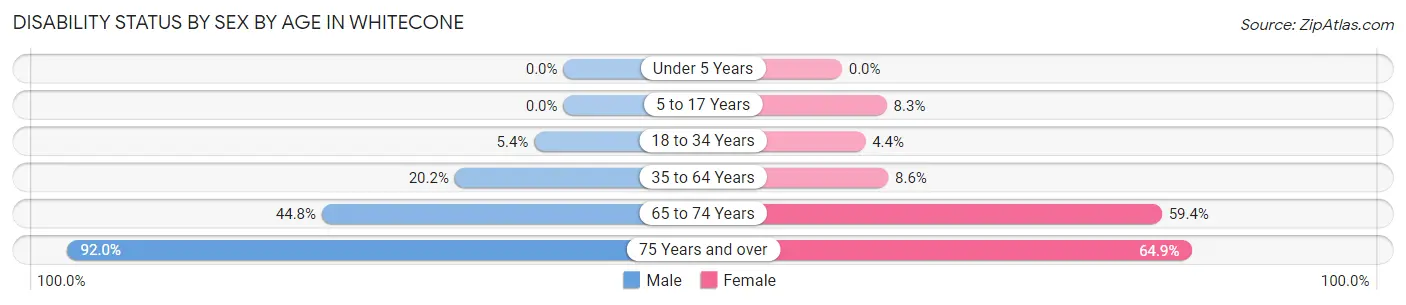
| Age Bracket | Male | Female |
| Under 5 Years | 0 (0.0%) | 0 (0.0%) |
| 5 to 17 Years | 0 (0.0%) | 11 (8.3%) |
| 18 to 34 Years | 4 (5.4%) | 5 (4.3%) |
| 35 to 64 Years | 26 (20.2%) | 14 (8.6%) |
| 65 to 74 Years | 13 (44.8%) | 19 (59.4%) |
| 75 Years and over | 23 (92.0%) | 24 (64.9%) |
Disability Class by Sex by Age in Whitecone
Disability Class: Hearing Difficulty
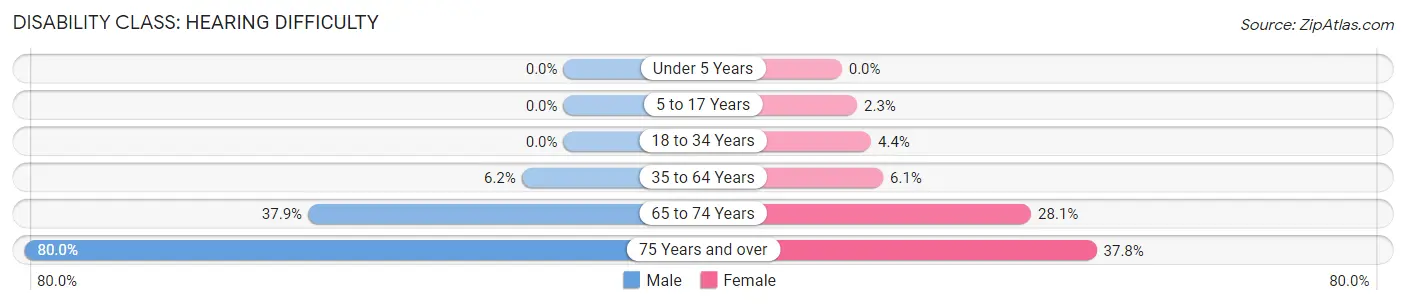
| Age Bracket | Male | Female |
| Under 5 Years | 0 (0.0%) | 0 (0.0%) |
| 5 to 17 Years | 0 (0.0%) | 3 (2.3%) |
| 18 to 34 Years | 0 (0.0%) | 5 (4.3%) |
| 35 to 64 Years | 8 (6.2%) | 10 (6.1%) |
| 65 to 74 Years | 11 (37.9%) | 9 (28.1%) |
| 75 Years and over | 20 (80.0%) | 14 (37.8%) |
Disability Class: Vision Difficulty
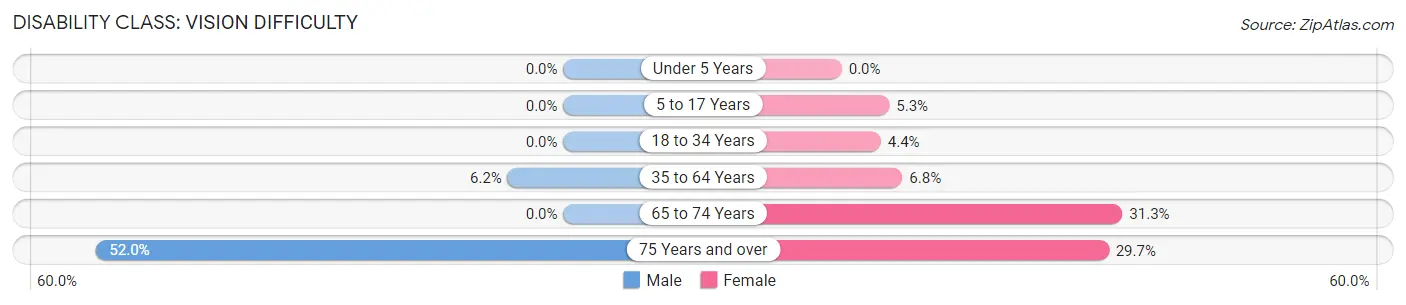
| Age Bracket | Male | Female |
| Under 5 Years | 0 (0.0%) | 0 (0.0%) |
| 5 to 17 Years | 0 (0.0%) | 7 (5.3%) |
| 18 to 34 Years | 0 (0.0%) | 5 (4.3%) |
| 35 to 64 Years | 8 (6.2%) | 11 (6.8%) |
| 65 to 74 Years | 0 (0.0%) | 10 (31.2%) |
| 75 Years and over | 13 (52.0%) | 11 (29.7%) |
Disability Class: Cognitive Difficulty
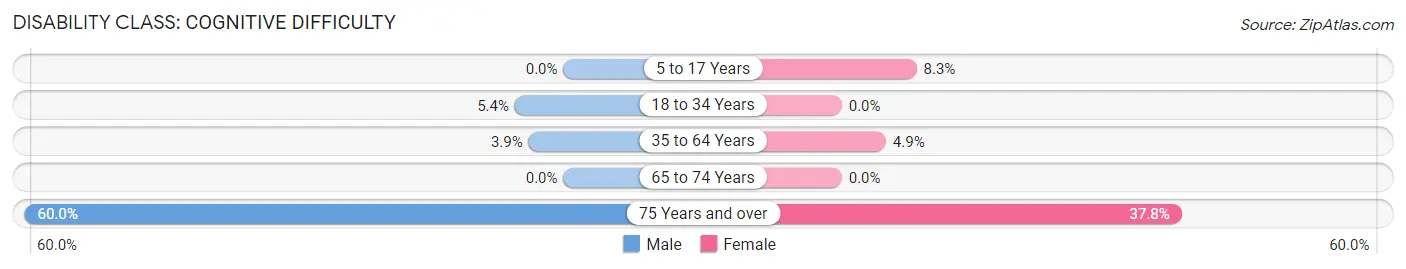
| Age Bracket | Male | Female |
| 5 to 17 Years | 0 (0.0%) | 11 (8.3%) |
| 18 to 34 Years | 4 (5.4%) | 0 (0.0%) |
| 35 to 64 Years | 5 (3.9%) | 8 (4.9%) |
| 65 to 74 Years | 0 (0.0%) | 0 (0.0%) |
| 75 Years and over | 15 (60.0%) | 14 (37.8%) |
Disability Class: Ambulatory Difficulty
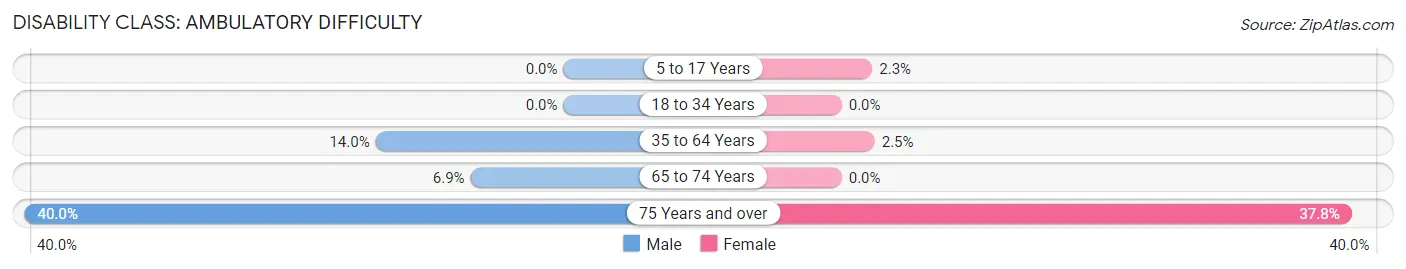
| Age Bracket | Male | Female |
| 5 to 17 Years | 0 (0.0%) | 3 (2.3%) |
| 18 to 34 Years | 0 (0.0%) | 0 (0.0%) |
| 35 to 64 Years | 18 (14.0%) | 4 (2.5%) |
| 65 to 74 Years | 2 (6.9%) | 0 (0.0%) |
| 75 Years and over | 10 (40.0%) | 14 (37.8%) |
Disability Class: Self-Care Difficulty
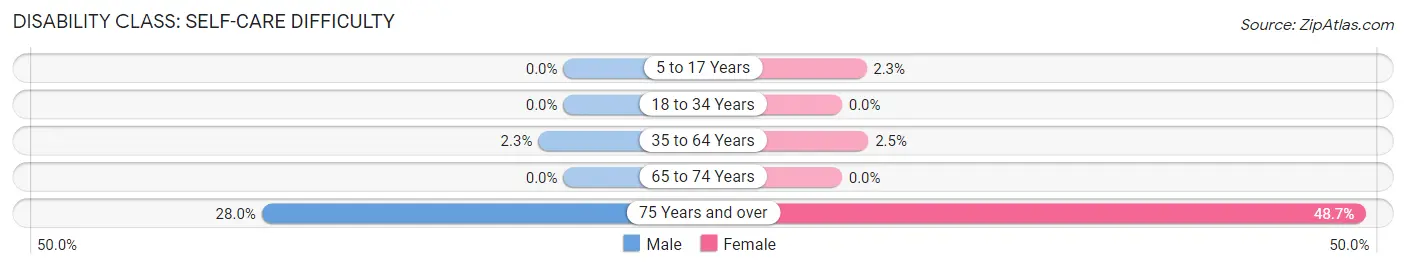
| Age Bracket | Male | Female |
| 5 to 17 Years | 0 (0.0%) | 3 (2.3%) |
| 18 to 34 Years | 0 (0.0%) | 0 (0.0%) |
| 35 to 64 Years | 3 (2.3%) | 4 (2.5%) |
| 65 to 74 Years | 0 (0.0%) | 0 (0.0%) |
| 75 Years and over | 7 (28.0%) | 18 (48.6%) |
Technology Access in Whitecone
Computing Device Access in Whitecone
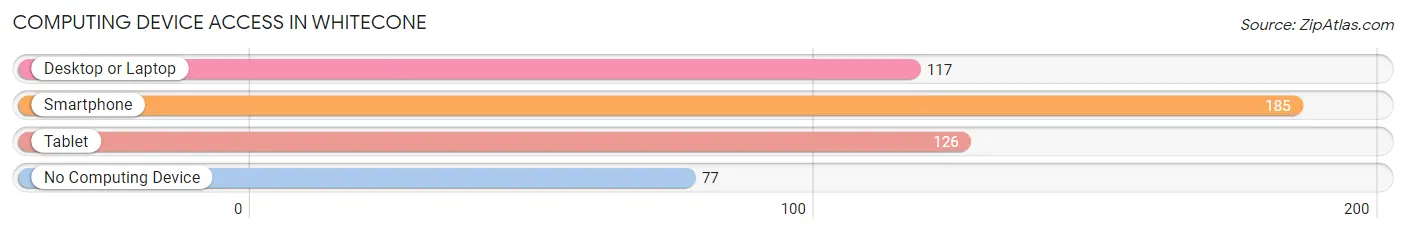
| Device Type | # Households | % Households |
| Desktop or Laptop | 117 | 42.2% |
| Smartphone | 185 | 66.8% |
| Tablet | 126 | 45.5% |
| No Computing Device | 77 | 27.8% |
| Total | 277 | 100.0% |
Internet Access in Whitecone
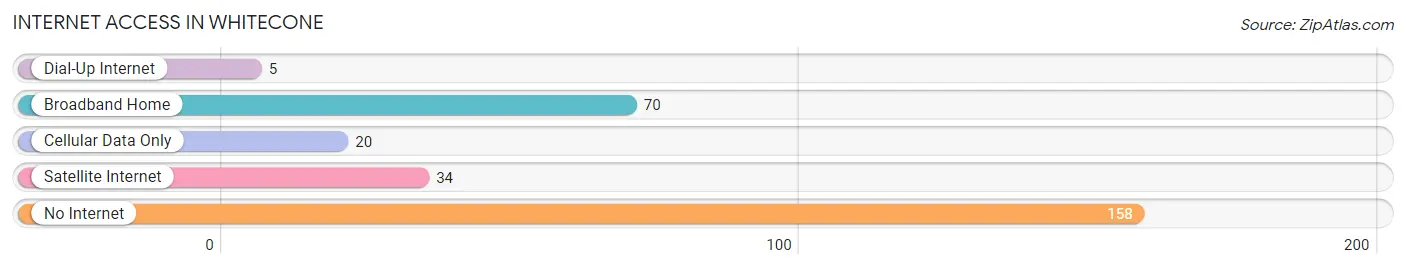
| Internet Type | # Households | % Households |
| Dial-Up Internet | 5 | 1.8% |
| Broadband Home | 70 | 25.3% |
| Cellular Data Only | 20 | 7.2% |
| Satellite Internet | 34 | 12.3% |
| No Internet | 158 | 57.0% |
| Total | 277 | 100.0% |
Whitecone Summary
Whitecone is a small unincorporated community located in Apache County, Arizona. It is situated in the White Mountains of Arizona, approximately 20 miles east of the town of Show Low. The community is located on the White Mountain Apache Indian Reservation, and is home to the White Mountain Apache Tribe.
History
Whitecone was originally established in the late 1800s as a trading post for the White Mountain Apache Tribe. The trading post was located near the junction of the White River and the Little Colorado River. The trading post was a popular spot for the Apache to trade goods and services with the settlers who were moving into the area.
In the early 1900s, the trading post was replaced by a general store, which served as the main source of supplies for the local Apache. The store was owned and operated by the White Mountain Apache Tribe, and was the only store in the area for many years.
In the 1950s, the White Mountain Apache Tribe opened a school in Whitecone. The school was the first public school in the area, and served as a source of education for the local Apache children.
Geography
Whitecone is located in the White Mountains of Arizona, approximately 20 miles east of the town of Show Low. The community is situated at an elevation of 6,000 feet, and is surrounded by the Apache-Sitgreaves National Forest. The White River and the Little Colorado River both flow through the area, providing a source of water for the local Apache.
The climate in Whitecone is semi-arid, with hot summers and cold winters. The average annual temperature is around 50 degrees Fahrenheit, with temperatures ranging from the low 30s in the winter to the high 90s in the summer.
Economy
The economy of Whitecone is largely based on tourism and the timber industry. The White Mountain Apache Tribe operates a number of tourist attractions in the area, including the White Mountain Apache Cultural Center and the White Mountain Apache Museum. The timber industry is also a major source of income for the local Apache, as the Apache-Sitgreaves National Forest provides a large source of timber for the tribe.
The White Mountain Apache Tribe also operates a number of businesses in the area, including a casino, a hotel, and a restaurant. These businesses provide employment opportunities for the local Apache, as well as a source of income for the tribe.
Demographics
As of the 2010 census, the population of Whitecone was 1,072. The population is primarily Native American, with the White Mountain Apache Tribe making up the majority of the population. The median age of the population is 33.7 years, and the median household income is $25,000.
Conclusion
Whitecone is a small unincorporated community located in Apache County, Arizona. It is situated in the White Mountains of Arizona, and is home to the White Mountain Apache Tribe. The economy of Whitecone is largely based on tourism and the timber industry, and the population is primarily Native American. The White Mountain Apache Tribe operates a number of businesses in the area, providing employment opportunities for the local Apache.
Common Questions
What is Per Capita Income in Whitecone?
Per Capita income in Whitecone is $9,827.
What is the Median Family Income in Whitecone?
Median Family Income in Whitecone is $25,536.
What is the Median Household income in Whitecone?
Median Household Income in Whitecone is $25,795.
What is Income or Wage Gap in Whitecone?
Income or Wage Gap in Whitecone is 35.2%.
Women in Whitecone earn 64.8 cents for every dollar earned by a man.
What is Family Income Deficit in Whitecone?
Family Income Deficit in Whitecone is $14,117.
Families that are below poverty line in Whitecone earn $14,117 less on average than the poverty threshold level.
What is Inequality or Gini Index in Whitecone?
Inequality or Gini Index in Whitecone is 0.52.
What is the Total Population of Whitecone?
Total Population of Whitecone is 892.
What is the Total Male Population of Whitecone?
Total Male Population of Whitecone is 383.
What is the Total Female Population of Whitecone?
Total Female Population of Whitecone is 509.
What is the Ratio of Males per 100 Females in Whitecone?
There are 75.25 Males per 100 Females in Whitecone.
What is the Ratio of Females per 100 Males in Whitecone?
There are 132.90 Females per 100 Males in Whitecone.
What is the Median Population Age in Whitecone?
Median Population Age in Whitecone is 31.6 Years.
What is the Average Family Size in Whitecone
Average Family Size in Whitecone is 3.7 People.
What is the Average Household Size in Whitecone
Average Household Size in Whitecone is 3.2 People.
How Large is the Labor Force in Whitecone?
There are 203 People in the Labor Forcein in Whitecone.
What is the Percentage of People in the Labor Force in Whitecone?
32.1% of People are in the Labor Force in Whitecone.
What is the Unemployment Rate in Whitecone?
Unemployment Rate in Whitecone is 20.2%.