White Mountain Lake, AZ Map & Demographics
White Mountain Lake Map
White Mountain Lake Overview
$19,235
PER CAPITA INCOME
$53,705
AVG FAMILY INCOME
$36,719
AVG HOUSEHOLD INCOME
15.2%
WAGE / INCOME GAP [ % ]
84.8¢/ $1
WAGE / INCOME GAP [ $ ]
0.46
INEQUALITY / GINI INDEX
2,817
TOTAL POPULATION
1,299
MALE POPULATION
1,518
FEMALE POPULATION
85.57
MALES / 100 FEMALES
116.86
FEMALES / 100 MALES
36.0
MEDIAN AGE
3.7
AVG FAMILY SIZE
2.9
AVG HOUSEHOLD SIZE
876
LABOR FORCE [ PEOPLE ]
40.4%
PERCENT IN LABOR FORCE
12.1%
UNEMPLOYMENT RATE
White Mountain Lake Zip Codes
White Mountain Lake Area Codes
Income in White Mountain Lake
Income Overview in White Mountain Lake
Per Capita Income in White Mountain Lake is $19,235, while median incomes of families and households are $53,705 and $36,719 respectively.
| Characteristic | Number | Measure |
| Per Capita Income | 2,817 | $19,235 |
| Median Family Income | 581 | $53,705 |
| Mean Family Income | 581 | $67,694 |
| Median Household Income | 960 | $36,719 |
| Mean Household Income | 960 | $55,030 |
| Income Deficit | 581 | $0 |
| Wage / Income Gap (%) | 2,817 | 15.24% |
| Wage / Income Gap ($) | 2,817 | 84.76¢ per $1 |
| Gini / Inequality Index | 2,817 | 0.46 |
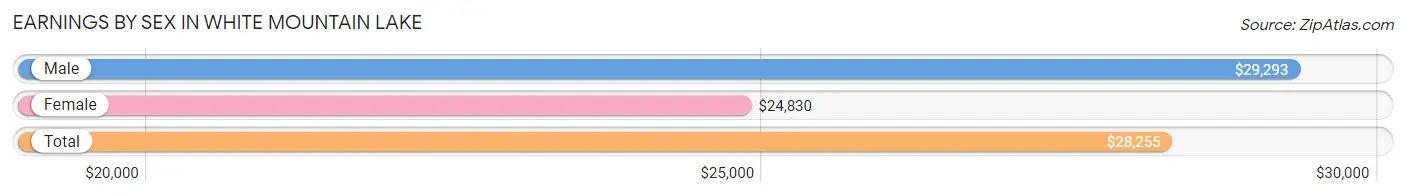
Earnings by Sex in White Mountain Lake
Average Earnings in White Mountain Lake are $28,255, $29,293 for men and $24,830 for women, a difference of 15.2%.
| Sex | Number | Average Earnings |
| Male | 556 (63.2%) | $29,293 |
| Female | 323 (36.7%) | $24,830 |
| Total | 879 (100.0%) | $28,255 |
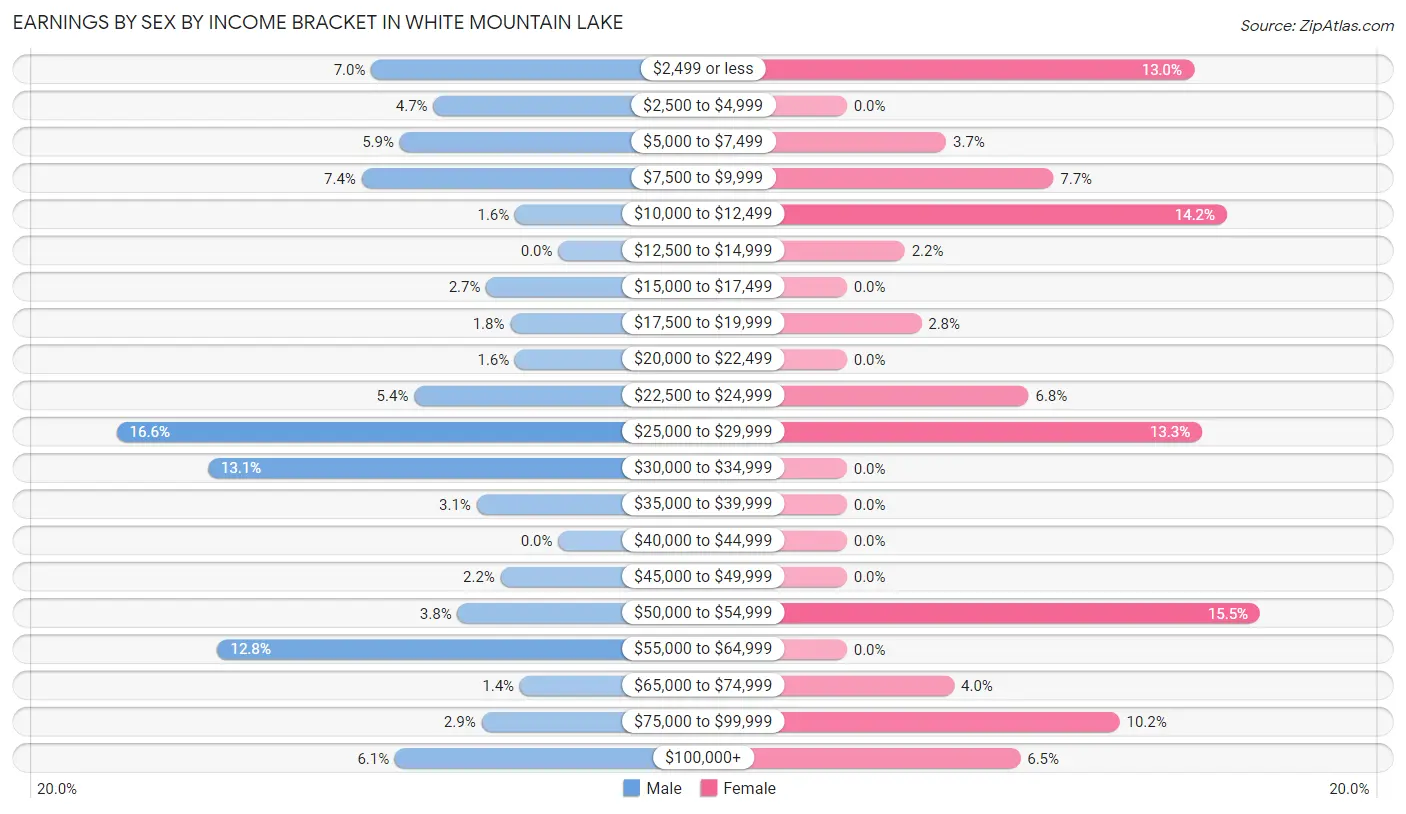
Earnings by Sex by Income Bracket in White Mountain Lake
The most common earnings brackets in White Mountain Lake are $25,000 to $29,999 for men (92 | 16.6%) and $50,000 to $54,999 for women (50 | 15.5%).
| Income | Male | Female |
| $2,499 or less | 39 (7.0%) | 42 (13.0%) |
| $2,500 to $4,999 | 26 (4.7%) | 0 (0.0%) |
| $5,000 to $7,499 | 33 (5.9%) | 12 (3.7%) |
| $7,500 to $9,999 | 41 (7.4%) | 25 (7.7%) |
| $10,000 to $12,499 | 9 (1.6%) | 46 (14.2%) |
| $12,500 to $14,999 | 0 (0.0%) | 7 (2.2%) |
| $15,000 to $17,499 | 15 (2.7%) | 0 (0.0%) |
| $17,500 to $19,999 | 10 (1.8%) | 9 (2.8%) |
| $20,000 to $22,499 | 9 (1.6%) | 0 (0.0%) |
| $22,500 to $24,999 | 30 (5.4%) | 22 (6.8%) |
| $25,000 to $29,999 | 92 (16.6%) | 43 (13.3%) |
| $30,000 to $34,999 | 73 (13.1%) | 0 (0.0%) |
| $35,000 to $39,999 | 17 (3.1%) | 0 (0.0%) |
| $40,000 to $44,999 | 0 (0.0%) | 0 (0.0%) |
| $45,000 to $49,999 | 12 (2.2%) | 0 (0.0%) |
| $50,000 to $54,999 | 21 (3.8%) | 50 (15.5%) |
| $55,000 to $64,999 | 71 (12.8%) | 0 (0.0%) |
| $65,000 to $74,999 | 8 (1.4%) | 13 (4.0%) |
| $75,000 to $99,999 | 16 (2.9%) | 33 (10.2%) |
| $100,000+ | 34 (6.1%) | 21 (6.5%) |
| Total | 556 (100.0%) | 323 (100.0%) |
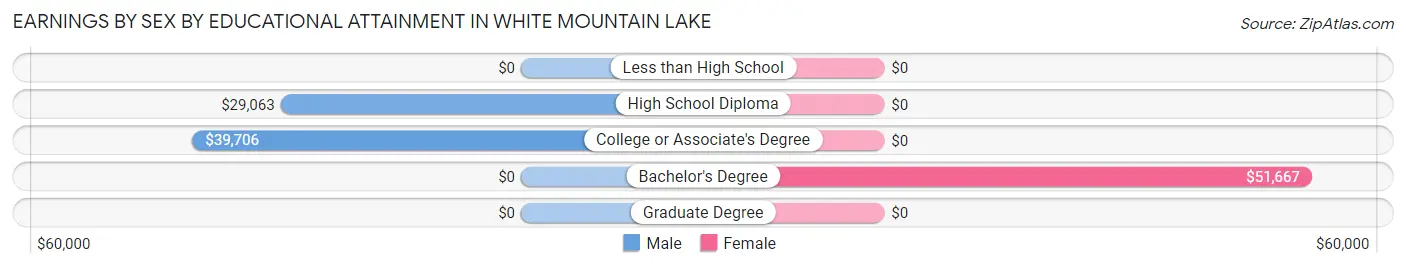
Earnings by Sex by Educational Attainment in White Mountain Lake
Average earnings in White Mountain Lake are $32,894 for men and $25,331 for women, a difference of 23.0%. Men with an educational attainment of college or associate's degree enjoy the highest average annual earnings of $39,706, while those with high school diploma education earn the least with $29,063. Women with an educational attainment of bachelor's degree earn the most with the average annual earnings of $51,667, while those with bachelor's degree education have the smallest earnings of $51,667.
| Educational Attainment | Male Income | Female Income |
| Less than High School | - | - |
| High School Diploma | $29,063 | $0 |
| College or Associate's Degree | $39,706 | $0 |
| Bachelor's Degree | - | - |
| Graduate Degree | - | - |
| Total | $32,894 | $25,331 |
Family Income in White Mountain Lake
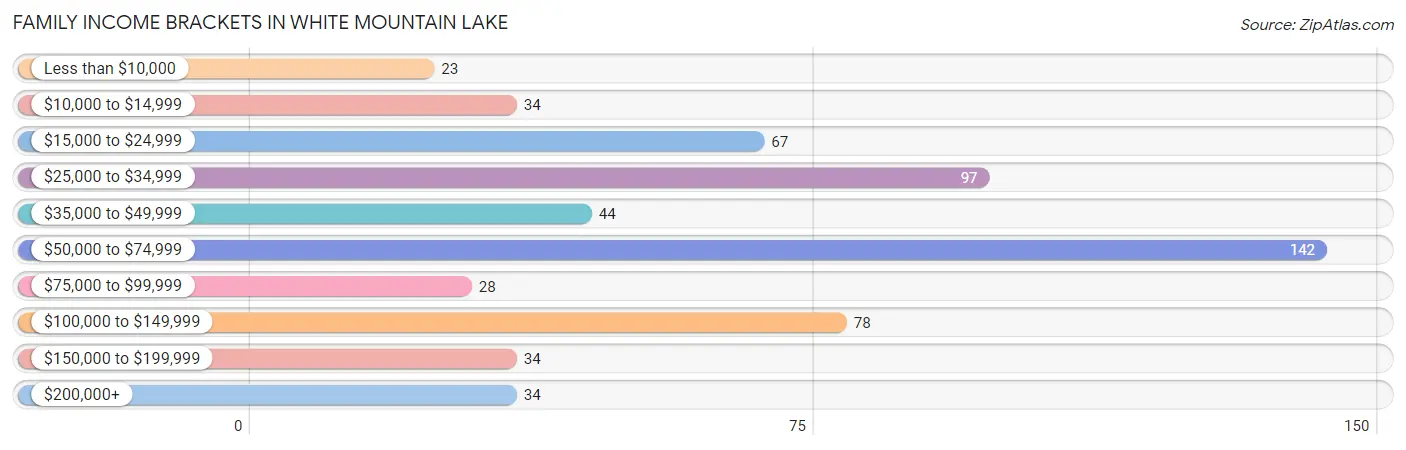
Family Income Brackets in White Mountain Lake
According to the White Mountain Lake family income data, there are 142 families falling into the $50,000 to $74,999 income range, which is the most common income bracket and makes up 24.4% of all families. Conversely, the less than $10,000 income bracket is the least frequent group with only 23 families (4.0%) belonging to this category.
| Income Bracket | # Families | % Families |
| Less than $10,000 | 23 | 4.0% |
| $10,000 to $14,999 | 34 | 5.9% |
| $15,000 to $24,999 | 67 | 11.5% |
| $25,000 to $34,999 | 97 | 16.7% |
| $35,000 to $49,999 | 44 | 7.6% |
| $50,000 to $74,999 | 142 | 24.4% |
| $75,000 to $99,999 | 28 | 4.8% |
| $100,000 to $149,999 | 78 | 13.4% |
| $150,000 to $199,999 | 34 | 5.9% |
| $200,000+ | 34 | 5.9% |
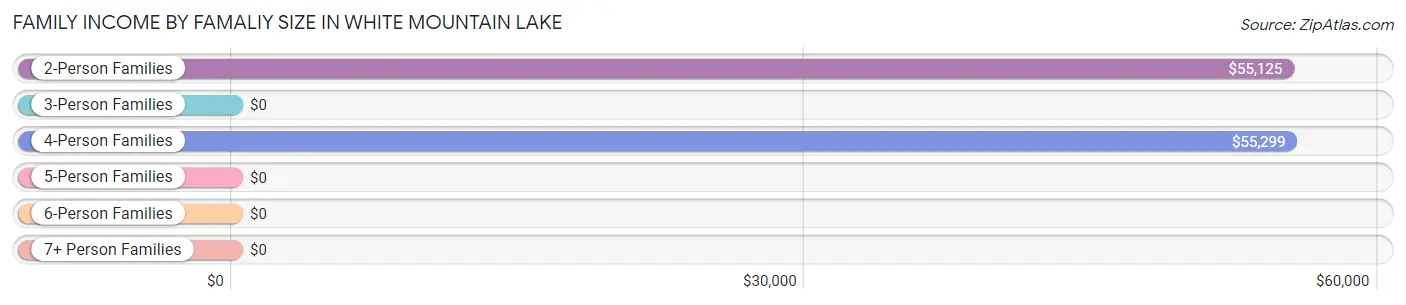
Family Income by Famaliy Size in White Mountain Lake
4-person families (143 | 24.6%) account for the highest median family income in White Mountain Lake with $55,299 per family, while 2-person families (265 | 45.6%) have the highest median income of $27,562 per family member.
| Income Bracket | # Families | Median Income |
| 2-Person Families | 265 (45.6%) | $55,125 |
| 3-Person Families | 63 (10.8%) | $0 |
| 4-Person Families | 143 (24.6%) | $55,299 |
| 5-Person Families | 43 (7.4%) | $0 |
| 6-Person Families | 34 (5.9%) | $0 |
| 7+ Person Families | 33 (5.7%) | $0 |
| Total | 581 (100.0%) | $53,705 |
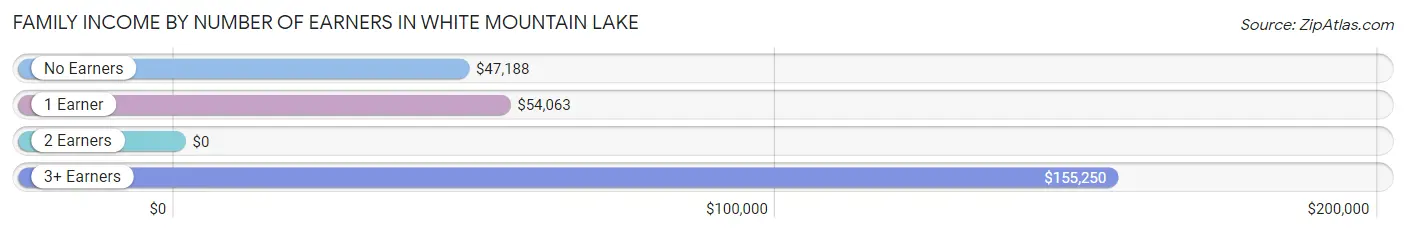
Family Income by Number of Earners in White Mountain Lake
| Number of Earners | # Families | Median Income |
| No Earners | 229 (39.4%) | $47,188 |
| 1 Earner | 165 (28.4%) | $54,063 |
| 2 Earners | 143 (24.6%) | $0 |
| 3+ Earners | 44 (7.6%) | $155,250 |
| Total | 581 (100.0%) | $53,705 |
Household Income in White Mountain Lake
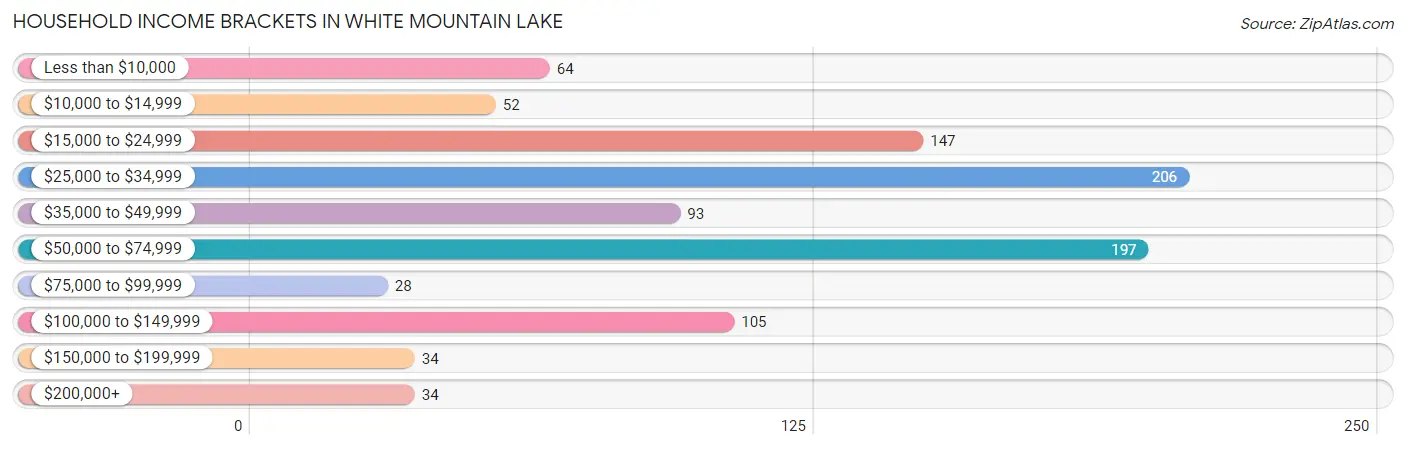
Household Income Brackets in White Mountain Lake
With 206 households falling in the category, the $25,000 to $34,999 income range is the most frequent in White Mountain Lake, accounting for 21.5% of all households. In contrast, only 28 households (2.9%) fall into the $75,000 to $99,999 income bracket, making it the least populous group.
| Income Bracket | # Households | % Households |
| Less than $10,000 | 64 | 6.7% |
| $10,000 to $14,999 | 52 | 5.4% |
| $15,000 to $24,999 | 147 | 15.3% |
| $25,000 to $34,999 | 206 | 21.5% |
| $35,000 to $49,999 | 93 | 9.7% |
| $50,000 to $74,999 | 197 | 20.5% |
| $75,000 to $99,999 | 28 | 2.9% |
| $100,000 to $149,999 | 105 | 10.9% |
| $150,000 to $199,999 | 34 | 3.5% |
| $200,000+ | 34 | 3.5% |
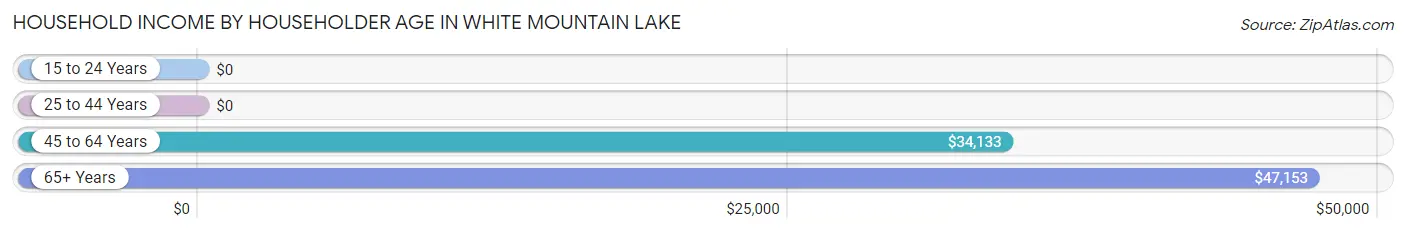
Household Income by Householder Age in White Mountain Lake
The median household income in White Mountain Lake is $36,719, with the highest median household income of $47,153 found in the 65+ years age bracket for the primary householder. A total of 477 households (49.7%) fall into this category. Meanwhile, the 15 to 24 years age bracket for the primary householder has the lowest median household income of $0, with 13 households (1.3%) in this group.
| Income Bracket | # Households | Median Income |
| 15 to 24 Years | 13 (1.3%) | $0 |
| 25 to 44 Years | 187 (19.5%) | $0 |
| 45 to 64 Years | 283 (29.5%) | $34,133 |
| 65+ Years | 477 (49.7%) | $47,153 |
| Total | 960 (100.0%) | $36,719 |
Poverty in White Mountain Lake
Income Below Poverty by Sex and Age in White Mountain Lake
With 33.8% poverty level for males and 41.0% for females among the residents of White Mountain Lake, 6 to 11 year old males and 12 to 14 year old females are the most vulnerable to poverty, with 45 males (100.0%) and 48 females (100.0%) in their respective age groups living below the poverty level.
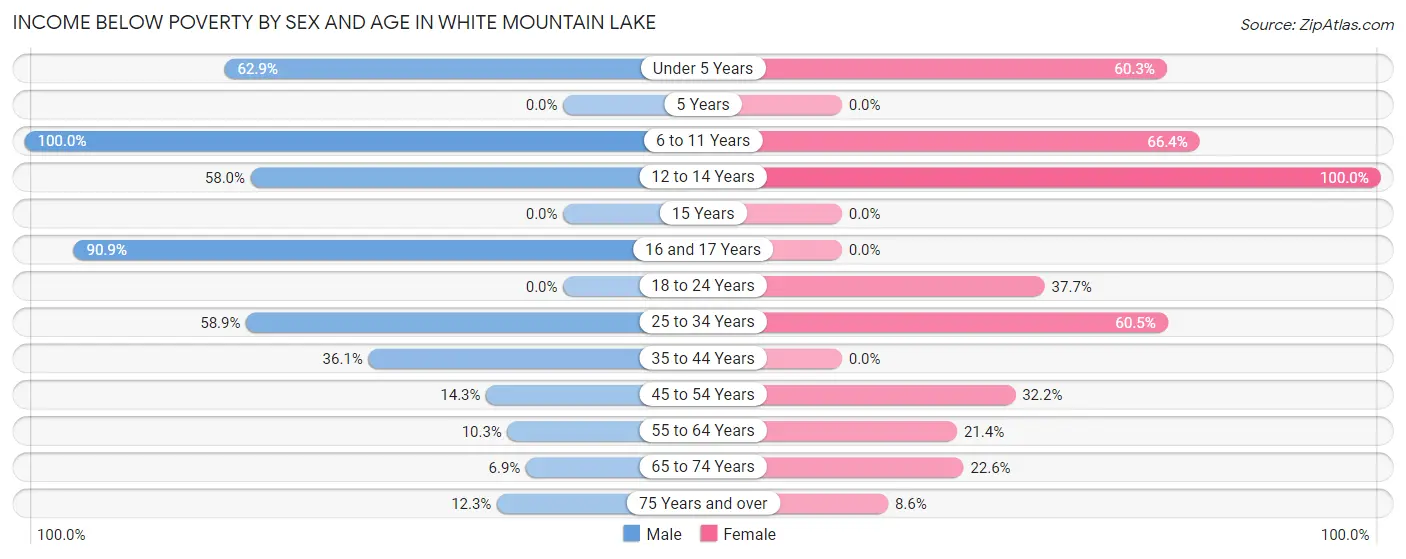
| Age Bracket | Male | Female |
| Under 5 Years | 61 (62.9%) | 123 (60.3%) |
| 5 Years | 0 (0.0%) | 0 (0.0%) |
| 6 to 11 Years | 45 (100.0%) | 87 (66.4%) |
| 12 to 14 Years | 29 (58.0%) | 48 (100.0%) |
| 15 Years | 0 (0.0%) | 0 (0.0%) |
| 16 and 17 Years | 90 (90.9%) | 0 (0.0%) |
| 18 to 24 Years | 0 (0.0%) | 32 (37.7%) |
| 25 to 34 Years | 113 (58.9%) | 156 (60.5%) |
| 35 to 44 Years | 30 (36.1%) | 0 (0.0%) |
| 45 to 54 Years | 22 (14.3%) | 47 (32.2%) |
| 55 to 64 Years | 19 (10.3%) | 31 (21.4%) |
| 65 to 74 Years | 16 (6.9%) | 63 (22.6%) |
| 75 Years and over | 14 (12.3%) | 6 (8.6%) |
| Total | 439 (33.8%) | 593 (41.0%) |
Income Above Poverty by Sex and Age in White Mountain Lake
According to the poverty statistics in White Mountain Lake, males aged 18 to 24 years and females aged 16 and 17 years are the age groups that are most secure financially, with 100.0% of males and 100.0% of females in these age groups living above the poverty line.
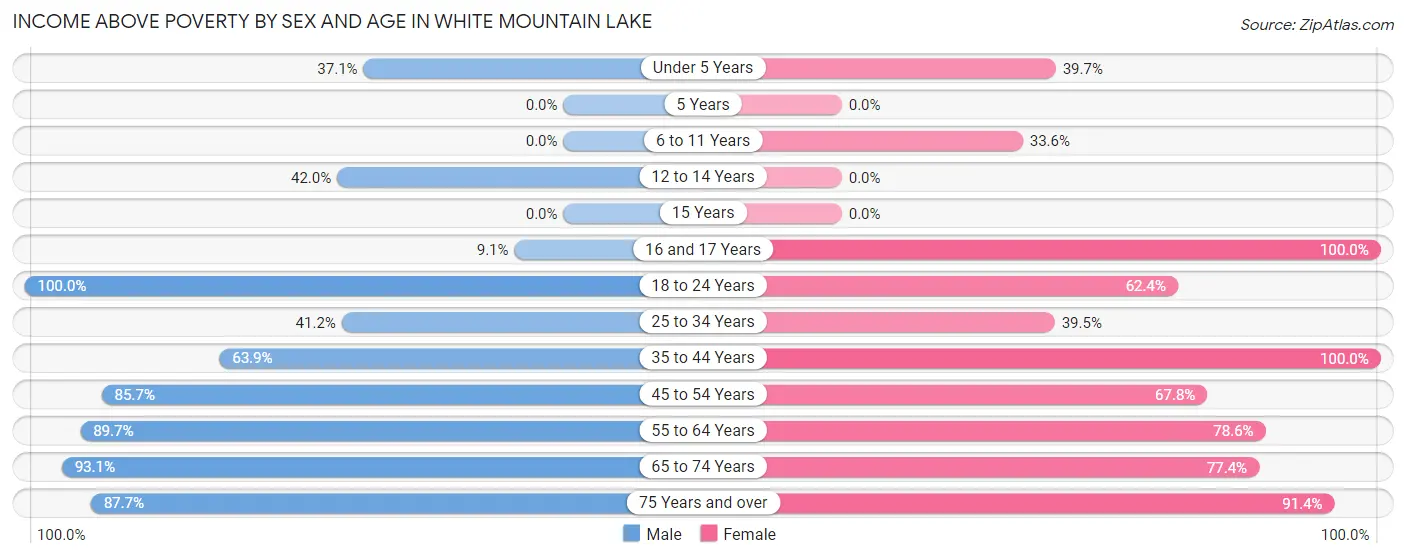
| Age Bracket | Male | Female |
| Under 5 Years | 36 (37.1%) | 81 (39.7%) |
| 5 Years | 0 (0.0%) | 0 (0.0%) |
| 6 to 11 Years | 0 (0.0%) | 44 (33.6%) |
| 12 to 14 Years | 21 (42.0%) | 0 (0.0%) |
| 15 Years | 0 (0.0%) | 0 (0.0%) |
| 16 and 17 Years | 9 (9.1%) | 33 (100.0%) |
| 18 to 24 Years | 49 (100.0%) | 53 (62.4%) |
| 25 to 34 Years | 79 (41.1%) | 102 (39.5%) |
| 35 to 44 Years | 53 (63.9%) | 46 (100.0%) |
| 45 to 54 Years | 132 (85.7%) | 99 (67.8%) |
| 55 to 64 Years | 165 (89.7%) | 114 (78.6%) |
| 65 to 74 Years | 216 (93.1%) | 216 (77.4%) |
| 75 Years and over | 100 (87.7%) | 64 (91.4%) |
| Total | 860 (66.2%) | 852 (59.0%) |
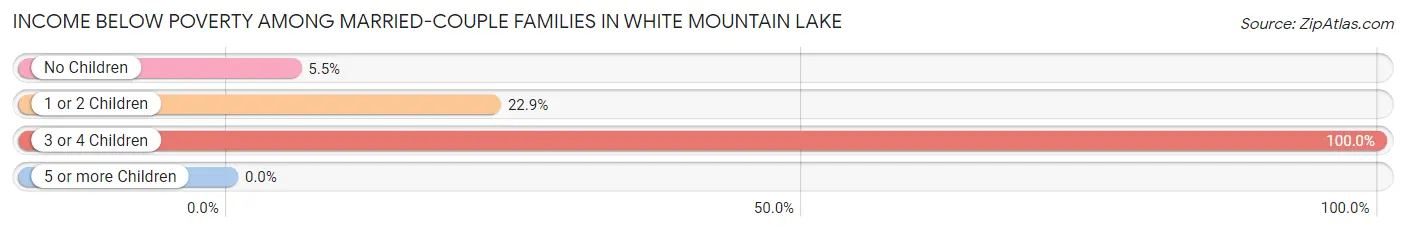
Income Below Poverty Among Married-Couple Families in White Mountain Lake
The poverty statistics for married-couple families in White Mountain Lake show that 24.0% or 116 of the total 484 families live below the poverty line. Families with 3 or 4 children have the highest poverty rate of 100.0%, comprising of 64 families. On the other hand, families with no children have the lowest poverty rate of 5.5%, which includes 14 families.
| Children | Above Poverty | Below Poverty |
| No Children | 240 (94.5%) | 14 (5.5%) |
| 1 or 2 Children | 128 (77.1%) | 38 (22.9%) |
| 3 or 4 Children | 0 (0.0%) | 64 (100.0%) |
| 5 or more Children | 0 (0.0%) | 0 (0.0%) |
| Total | 368 (76.0%) | 116 (24.0%) |
Income Below Poverty Among Single-Parent Households in White Mountain Lake
According to the poverty data in White Mountain Lake, 30.6% or 15 single-father households and 47.9% or 23 single-mother households are living below the poverty line. Among single-father households, those with 1 or 2 children have the highest poverty rate, with 15 households (100.0%) experiencing poverty. Likewise, among single-mother households, those with 5 or more children have the highest poverty rate, with 23 households (100.0%) falling below the poverty line.
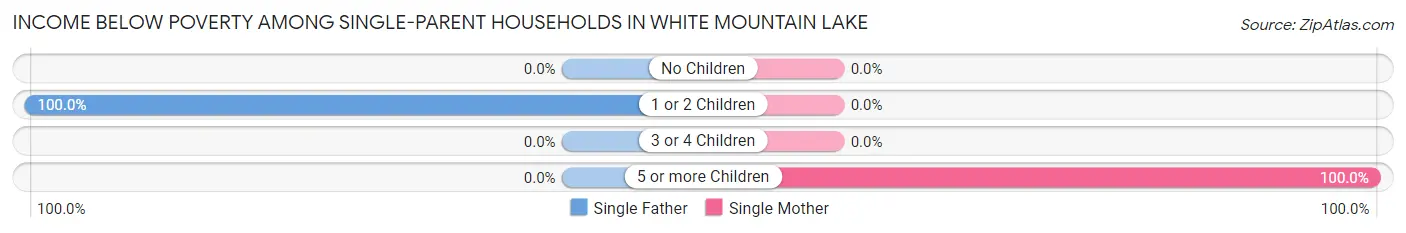
| Children | Single Father | Single Mother |
| No Children | 0 (0.0%) | 0 (0.0%) |
| 1 or 2 Children | 15 (100.0%) | 0 (0.0%) |
| 3 or 4 Children | 0 (0.0%) | 0 (0.0%) |
| 5 or more Children | 0 (0.0%) | 23 (100.0%) |
| Total | 15 (30.6%) | 23 (47.9%) |
Income Below Poverty Among Married-Couple vs Single-Parent Households in White Mountain Lake
The poverty data for White Mountain Lake shows that 116 of the married-couple family households (24.0%) and 38 of the single-parent households (39.2%) are living below the poverty level. Within the married-couple family households, those with 3 or 4 children have the highest poverty rate, with 64 households (100.0%) falling below the poverty line. Among the single-parent households, those with 1 or 2 children have the highest poverty rate, with 15 household (100.0%) living below poverty.
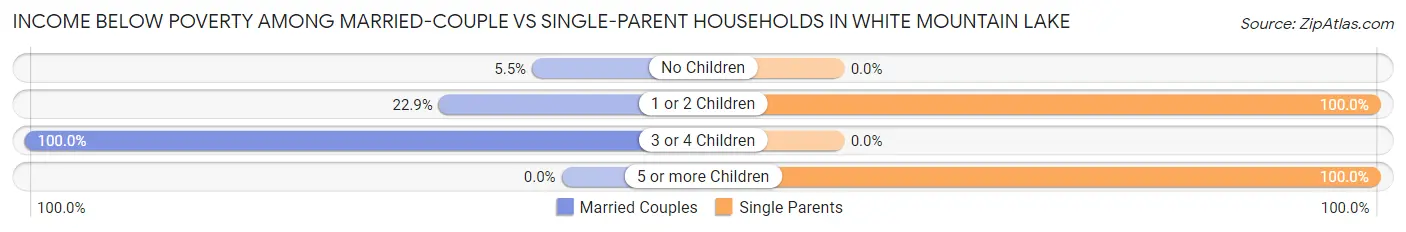
| Children | Married-Couple Families | Single-Parent Households |
| No Children | 14 (5.5%) | 0 (0.0%) |
| 1 or 2 Children | 38 (22.9%) | 15 (100.0%) |
| 3 or 4 Children | 64 (100.0%) | 0 (0.0%) |
| 5 or more Children | 0 (0.0%) | 23 (100.0%) |
| Total | 116 (24.0%) | 38 (39.2%) |
Race in White Mountain Lake
The most populous races in White Mountain Lake are White / Caucasian (2,147 | 76.2%), Hispanic or Latino (802 | 28.5%), and Two or more Races (356 | 12.6%).
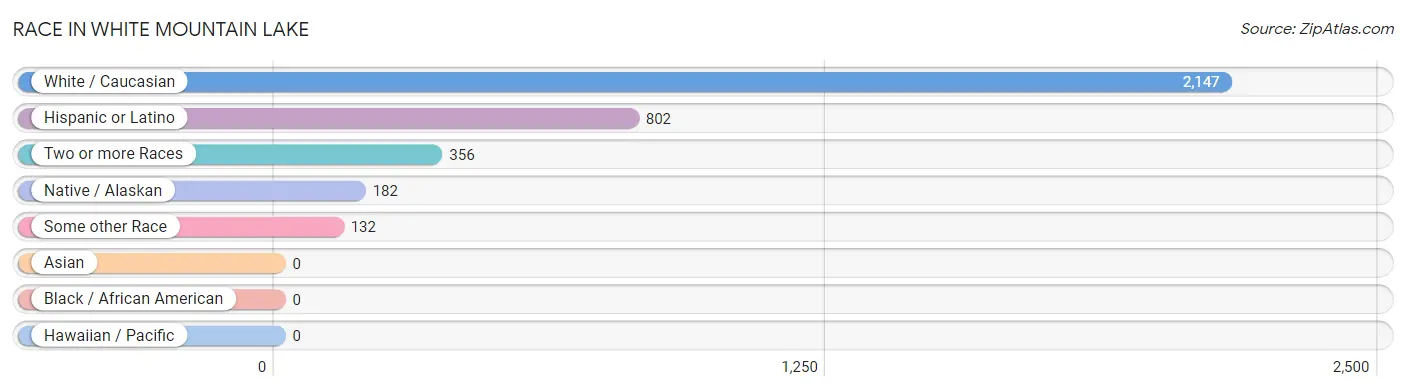
| Race | # Population | % Population |
| Asian | 0 | 0.0% |
| Black / African American | 0 | 0.0% |
| Hawaiian / Pacific | 0 | 0.0% |
| Hispanic or Latino | 802 | 28.5% |
| Native / Alaskan | 182 | 6.5% |
| White / Caucasian | 2,147 | 76.2% |
| Two or more Races | 356 | 12.6% |
| Some other Race | 132 | 4.7% |
| Total | 2,817 | 100.0% |
Ancestry in White Mountain Lake
The most populous ancestries reported in White Mountain Lake are German (701 | 24.9%), Mexican (584 | 20.7%), American (411 | 14.6%), English (356 | 12.6%), and Irish (298 | 10.6%), together accounting for 83.4% of all White Mountain Lake residents.
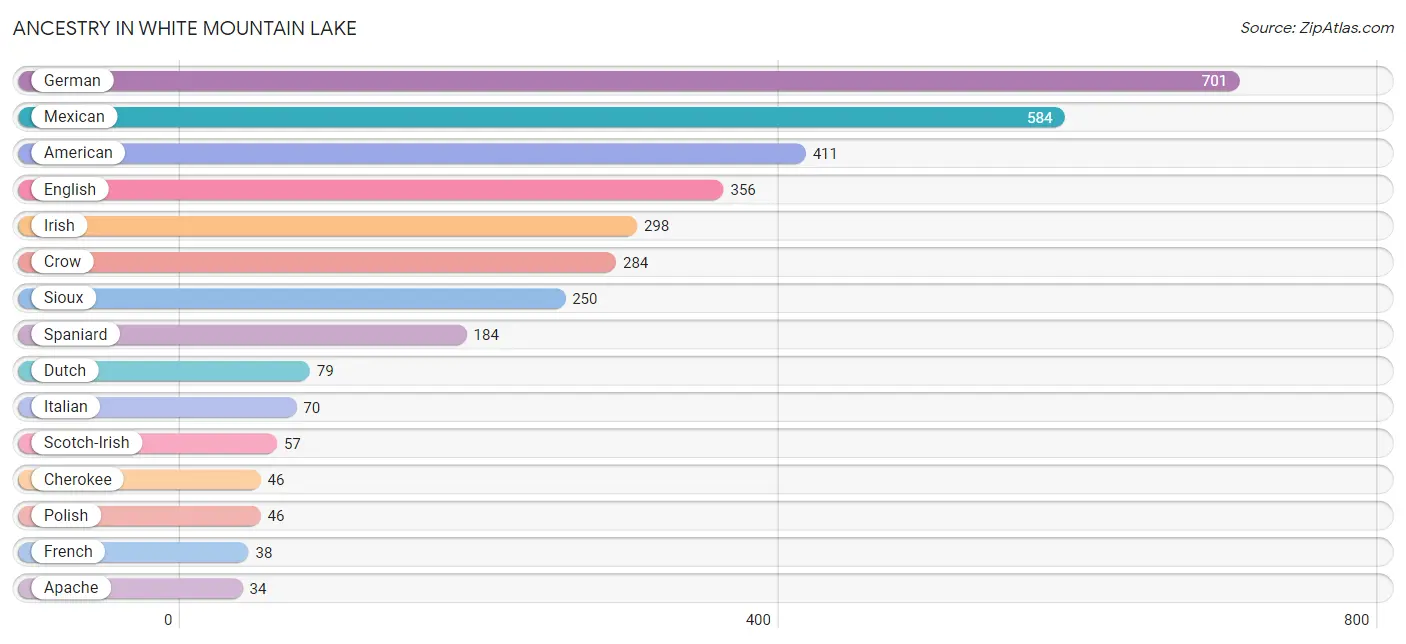
| Ancestry | # Population | % Population |
| American | 411 | 14.6% |
| Apache | 34 | 1.2% |
| Cajun | 12 | 0.4% |
| Cherokee | 46 | 1.6% |
| Crow | 284 | 10.1% |
| Danish | 9 | 0.3% |
| Dutch | 79 | 2.8% |
| Eastern European | 13 | 0.5% |
| English | 356 | 12.6% |
| European | 9 | 0.3% |
| Finnish | 7 | 0.3% |
| French | 38 | 1.3% |
| German | 701 | 24.9% |
| Greek | 23 | 0.8% |
| Irish | 298 | 10.6% |
| Italian | 70 | 2.5% |
| Mexican | 584 | 20.7% |
| Norwegian | 14 | 0.5% |
| Polish | 46 | 1.6% |
| Scandinavian | 17 | 0.6% |
| Scotch-Irish | 57 | 2.0% |
| Scottish | 10 | 0.4% |
| Sioux | 250 | 8.9% |
| Spaniard | 184 | 6.5% |
| Spanish | 34 | 1.2% |
| Swedish | 16 | 0.6% |
| Swiss | 9 | 0.3% |
| Welsh | 18 | 0.6% |
| Yugoslavian | 6 | 0.2% | View All 29 Rows |
Immigrants in White Mountain Lake
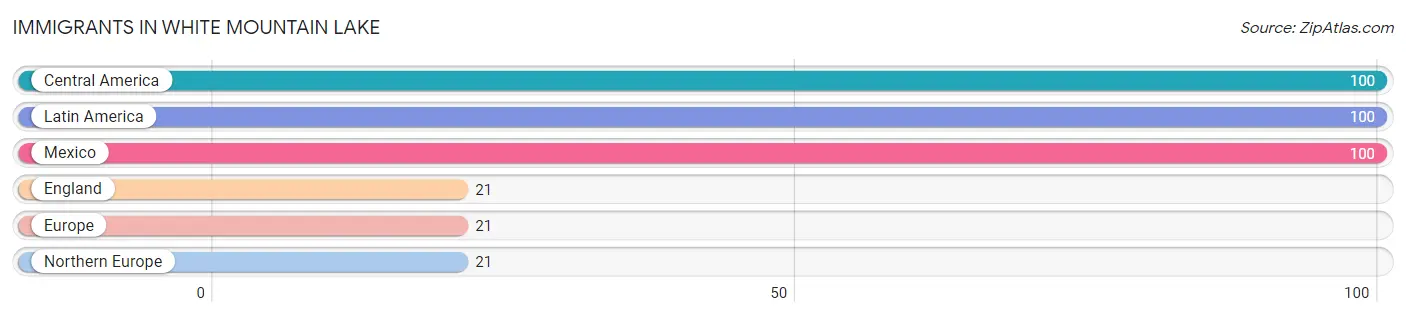
The most numerous immigrant groups reported in White Mountain Lake came from Central America (100 | 3.5%), Latin America (100 | 3.5%), Mexico (100 | 3.5%), England (21 | 0.7%), and Europe (21 | 0.7%), together accounting for 12.1% of all White Mountain Lake residents.
| Immigration Origin | # Population | % Population |
| Central America | 100 | 3.5% |
| England | 21 | 0.7% |
| Europe | 21 | 0.7% |
| Latin America | 100 | 3.5% |
| Mexico | 100 | 3.5% |
| Northern Europe | 21 | 0.7% | View All 6 Rows |
Sex and Age in White Mountain Lake
Sex and Age in White Mountain Lake
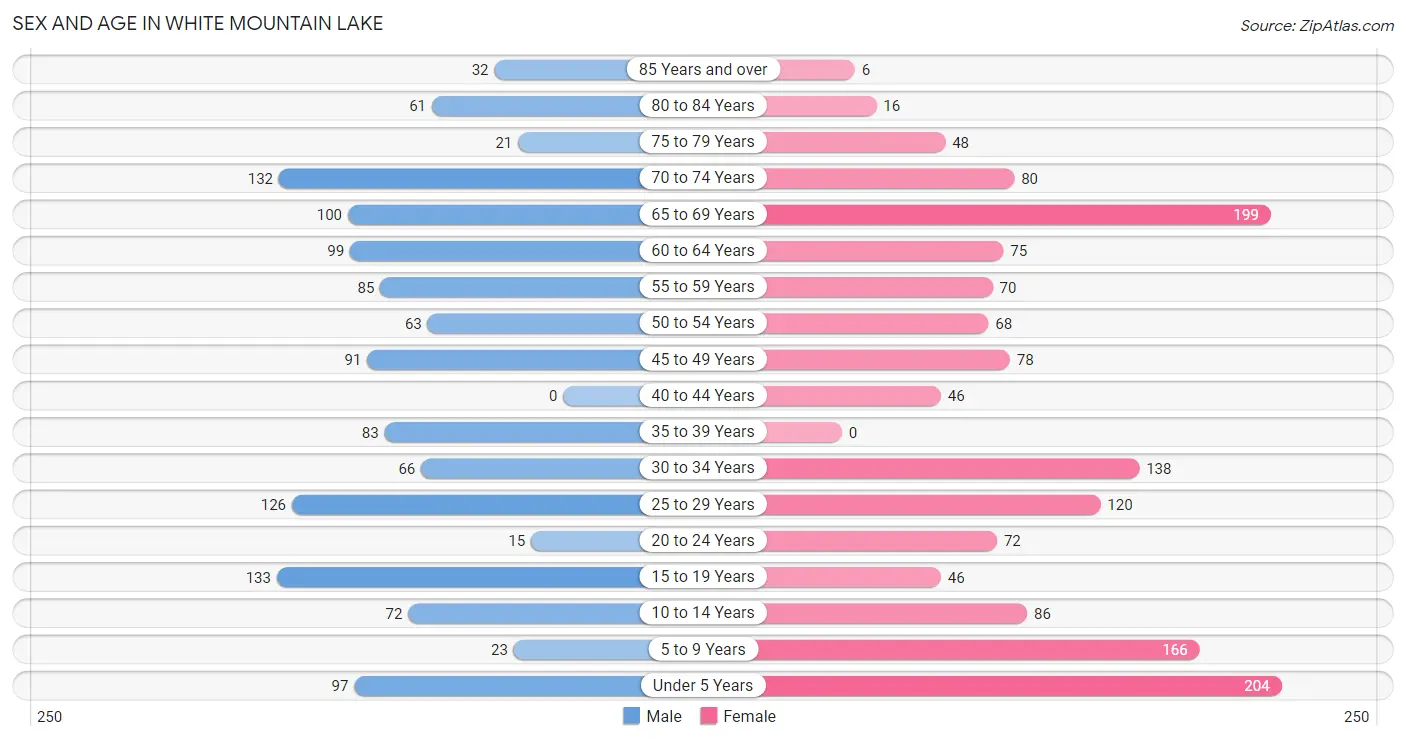
The most populous age groups in White Mountain Lake are 15 to 19 Years (133 | 10.2%) for men and Under 5 Years (204 | 13.4%) for women.
| Age Bracket | Male | Female |
| Under 5 Years | 97 (7.5%) | 204 (13.4%) |
| 5 to 9 Years | 23 (1.8%) | 166 (10.9%) |
| 10 to 14 Years | 72 (5.5%) | 86 (5.7%) |
| 15 to 19 Years | 133 (10.2%) | 46 (3.0%) |
| 20 to 24 Years | 15 (1.1%) | 72 (4.7%) |
| 25 to 29 Years | 126 (9.7%) | 120 (7.9%) |
| 30 to 34 Years | 66 (5.1%) | 138 (9.1%) |
| 35 to 39 Years | 83 (6.4%) | 0 (0.0%) |
| 40 to 44 Years | 0 (0.0%) | 46 (3.0%) |
| 45 to 49 Years | 91 (7.0%) | 78 (5.1%) |
| 50 to 54 Years | 63 (4.9%) | 68 (4.5%) |
| 55 to 59 Years | 85 (6.5%) | 70 (4.6%) |
| 60 to 64 Years | 99 (7.6%) | 75 (4.9%) |
| 65 to 69 Years | 100 (7.7%) | 199 (13.1%) |
| 70 to 74 Years | 132 (10.2%) | 80 (5.3%) |
| 75 to 79 Years | 21 (1.6%) | 48 (3.2%) |
| 80 to 84 Years | 61 (4.7%) | 16 (1.1%) |
| 85 Years and over | 32 (2.5%) | 6 (0.4%) |
| Total | 1,299 (100.0%) | 1,518 (100.0%) |
Families and Households in White Mountain Lake
Median Family Size in White Mountain Lake
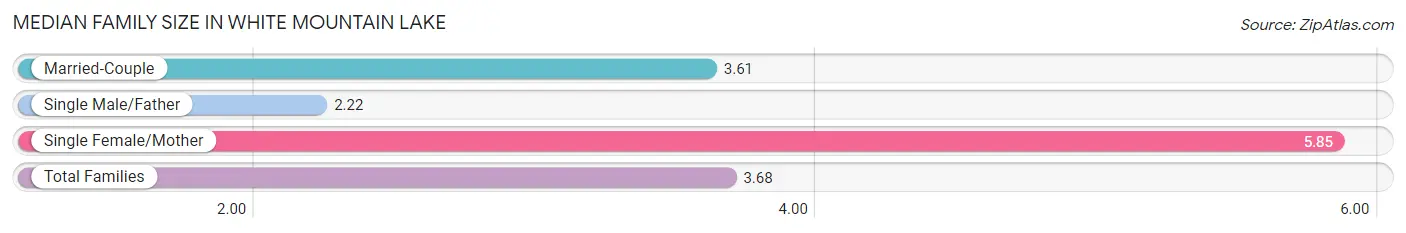
The median family size in White Mountain Lake is 3.68 persons per family, with single female/mother families (48 | 8.3%) accounting for the largest median family size of 5.85 persons per family. On the other hand, single male/father families (49 | 8.4%) represent the smallest median family size with 2.22 persons per family.
| Family Type | # Families | Family Size |
| Married-Couple | 484 (83.3%) | 3.61 |
| Single Male/Father | 49 (8.4%) | 2.22 |
| Single Female/Mother | 48 (8.3%) | 5.85 |
| Total Families | 581 (100.0%) | 3.68 |
Median Household Size in White Mountain Lake
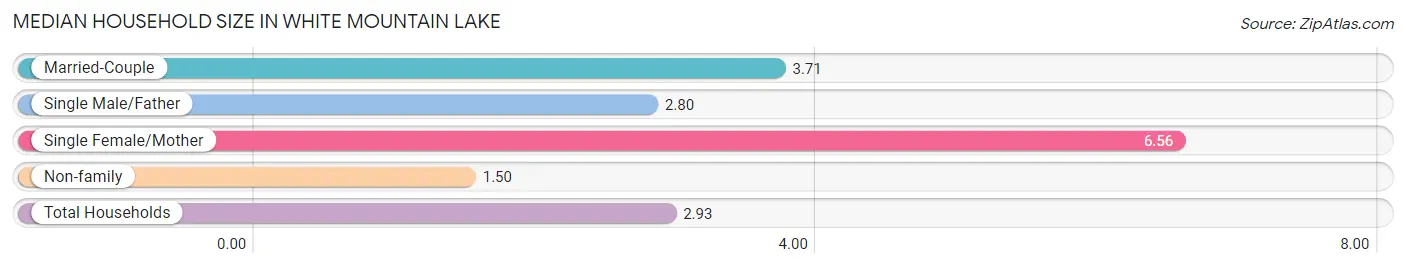
The median household size in White Mountain Lake is 2.93 persons per household, with single female/mother households (48 | 5.0%) accounting for the largest median household size of 6.56 persons per household. non-family households (379 | 39.5%) represent the smallest median household size with 1.50 persons per household.
| Household Type | # Households | Household Size |
| Married-Couple | 484 (50.4%) | 3.71 |
| Single Male/Father | 49 (5.1%) | 2.80 |
| Single Female/Mother | 48 (5.0%) | 6.56 |
| Non-family | 379 (39.5%) | 1.50 |
| Total Households | 960 (100.0%) | 2.93 |
Household Size by Marriage Status in White Mountain Lake
Out of a total of 960 households in White Mountain Lake, 581 (60.5%) are family households, while 379 (39.5%) are nonfamily households. The most numerous type of family households are 2-person households, comprising 240, and the most common type of nonfamily households are 1-person households, comprising 273.
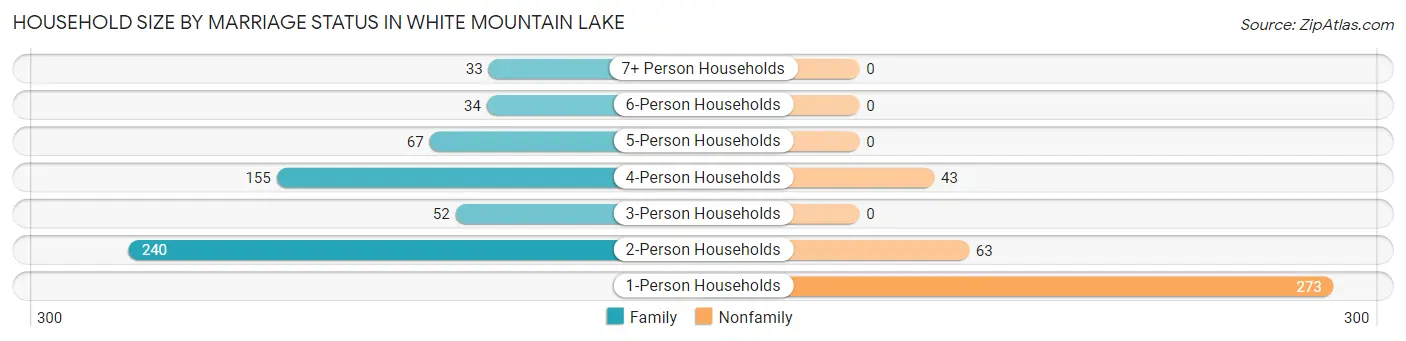
| Household Size | Family Households | Nonfamily Households |
| 1-Person Households | - | 273 (28.4%) |
| 2-Person Households | 240 (25.0%) | 63 (6.6%) |
| 3-Person Households | 52 (5.4%) | 0 (0.0%) |
| 4-Person Households | 155 (16.2%) | 43 (4.5%) |
| 5-Person Households | 67 (7.0%) | 0 (0.0%) |
| 6-Person Households | 34 (3.5%) | 0 (0.0%) |
| 7+ Person Households | 33 (3.4%) | 0 (0.0%) |
| Total | 581 (60.5%) | 379 (39.5%) |
Female Fertility in White Mountain Lake
Fertility by Age in White Mountain Lake
Average fertility rate in White Mountain Lake is 132.0 births per 1,000 women. Women in the age bracket of 20 to 34 years have the highest fertility rate with 200.0 births per 1,000 women. Women in the age bracket of 20 to 34 years acount for 100.0% of all women with births.
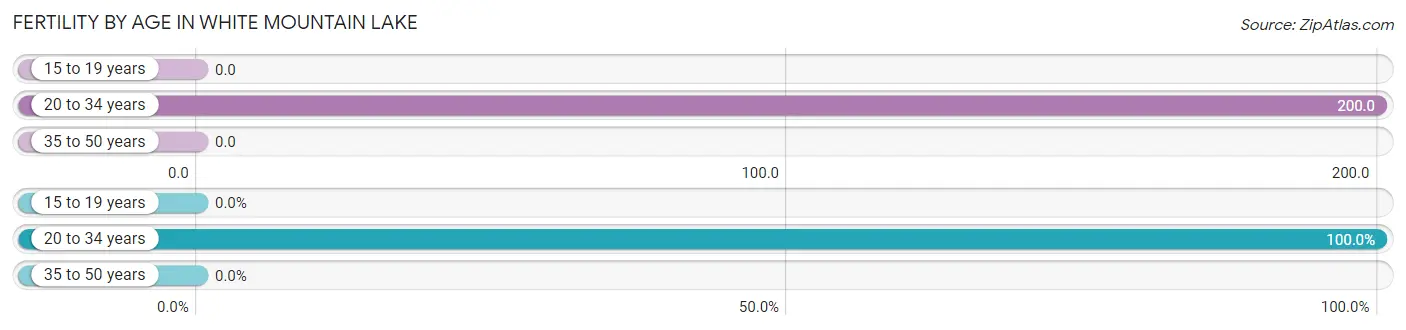
| Age Bracket | Women with Births | Births / 1,000 Women |
| 15 to 19 years | 0 (0.0%) | 0.0 |
| 20 to 34 years | 66 (100.0%) | 200.0 |
| 35 to 50 years | 0 (0.0%) | 0.0 |
| Total | 66 (100.0%) | 132.0 |
Fertility by Age by Marriage Status in White Mountain Lake
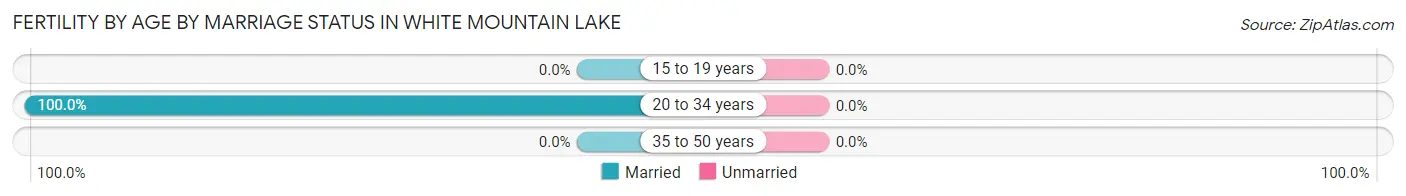
| Age Bracket | Married | Unmarried |
| 15 to 19 years | 0 (0.0%) | 0 (0.0%) |
| 20 to 34 years | 66 (100.0%) | 0 (0.0%) |
| 35 to 50 years | 0 (0.0%) | 0 (0.0%) |
| Total | 66 (100.0%) | 0 (0.0%) |
Fertility by Education in White Mountain Lake
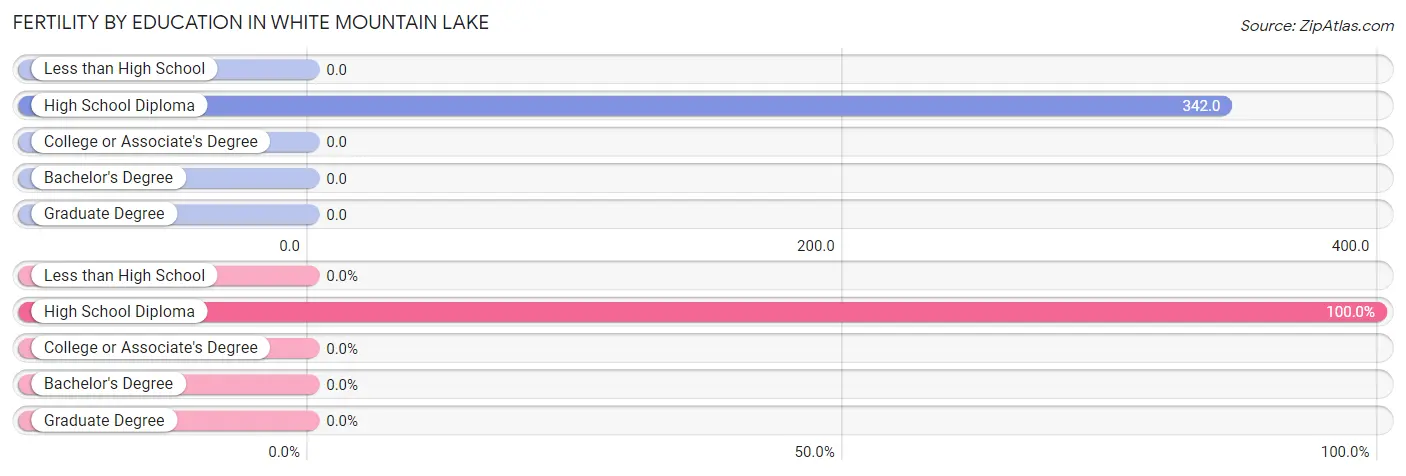
| Educational Attainment | Women with Births | Births / 1,000 Women |
| Less than High School | 0 (0.0%) | 0.0 |
| High School Diploma | 66 (100.0%) | 342.0 |
| College or Associate's Degree | 0 (0.0%) | 0.0 |
| Bachelor's Degree | 0 (0.0%) | 0.0 |
| Graduate Degree | 0 (0.0%) | 0.0 |
| Total | 66 (100.0%) | 132.0 |
Fertility by Education by Marriage Status in White Mountain Lake
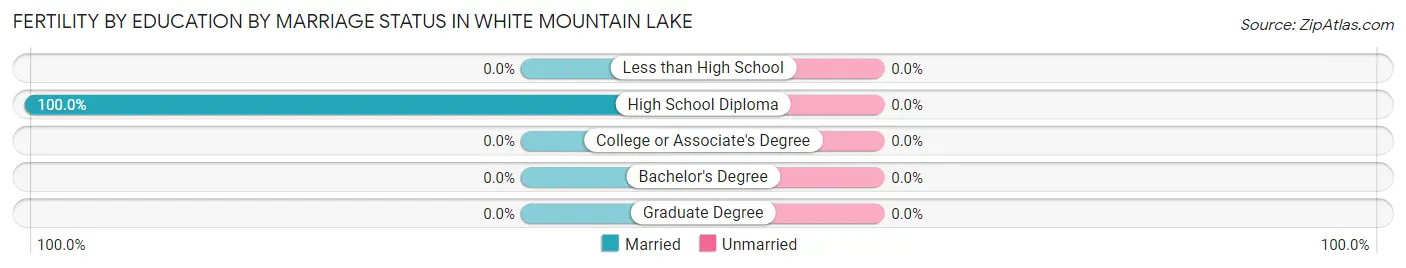
| Educational Attainment | Married | Unmarried |
| Less than High School | 0 (0.0%) | 0 (0.0%) |
| High School Diploma | 66 (100.0%) | 0 (0.0%) |
| College or Associate's Degree | 0 (0.0%) | 0 (0.0%) |
| Bachelor's Degree | 0 (0.0%) | 0 (0.0%) |
| Graduate Degree | 0 (0.0%) | 0 (0.0%) |
| Total | 66 (100.0%) | 0 (0.0%) |
Employment Characteristics in White Mountain Lake
Employment by Class of Employer in White Mountain Lake
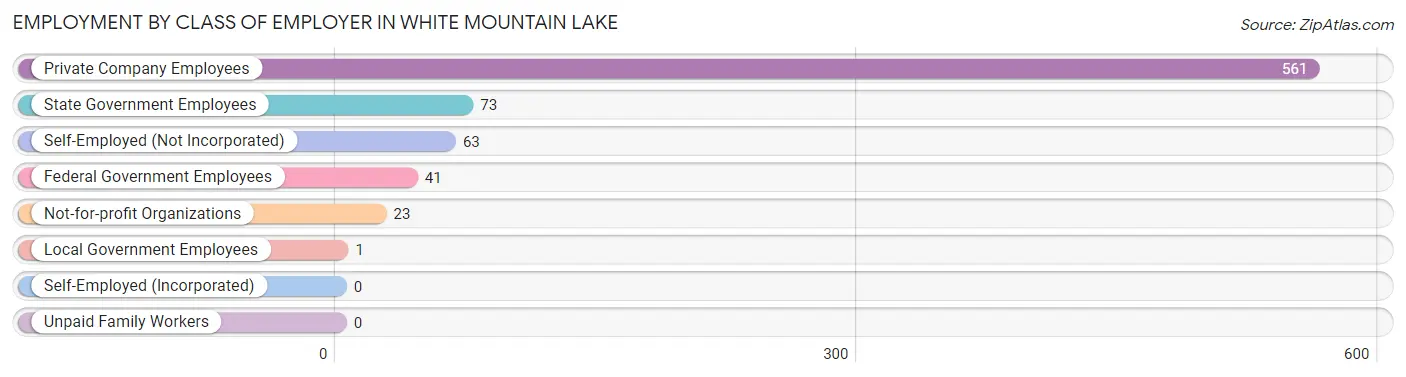
Among the 762 employed individuals in White Mountain Lake, private company employees (561 | 73.6%), state government employees (73 | 9.6%), and self-employed (not incorporated) (63 | 8.3%) make up the most common classes of employment.
| Employer Class | # Employees | % Employees |
| Private Company Employees | 561 | 73.6% |
| Self-Employed (Incorporated) | 0 | 0.0% |
| Self-Employed (Not Incorporated) | 63 | 8.3% |
| Not-for-profit Organizations | 23 | 3.0% |
| Local Government Employees | 1 | 0.1% |
| State Government Employees | 73 | 9.6% |
| Federal Government Employees | 41 | 5.4% |
| Unpaid Family Workers | 0 | 0.0% |
| Total | 762 | 100.0% |
Employment Status by Age in White Mountain Lake
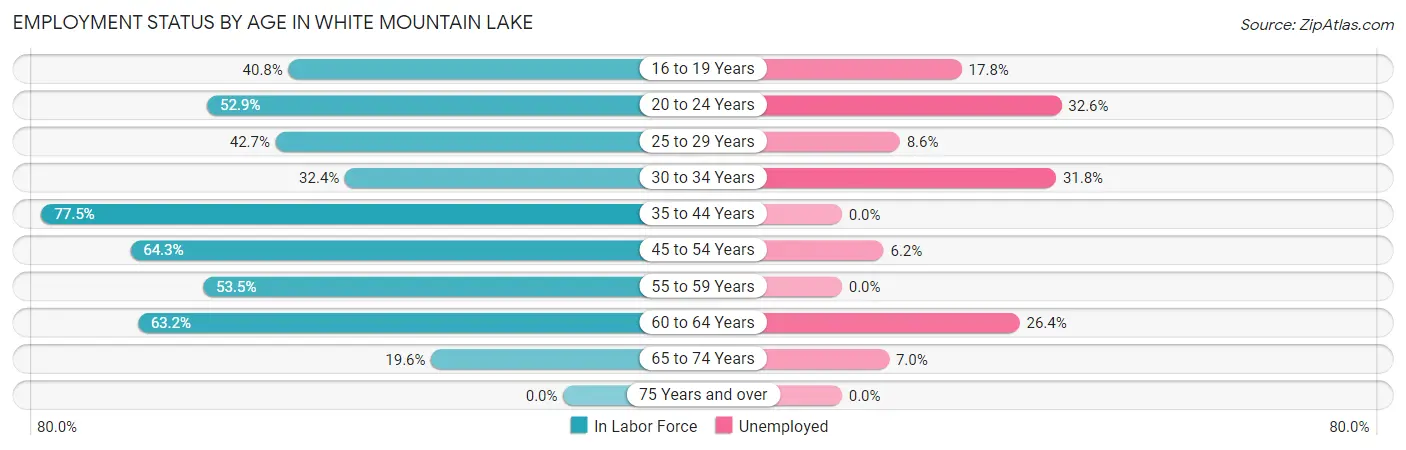
According to the labor force statistics for White Mountain Lake, out of the total population over 16 years of age (2,169), 40.4% or 876 individuals are in the labor force, with 12.1% or 106 of them unemployed. The age group with the highest labor force participation rate is 35 to 44 years, with 77.5% or 100 individuals in the labor force. Within the labor force, the 20 to 24 years age range has the highest percentage of unemployed individuals, with 32.6% or 15 of them being unemployed.
| Age Bracket | In Labor Force | Unemployed |
| 16 to 19 Years | 73 (40.8%) | 13 (17.8%) |
| 20 to 24 Years | 46 (52.9%) | 15 (32.6%) |
| 25 to 29 Years | 105 (42.7%) | 9 (8.6%) |
| 30 to 34 Years | 66 (32.4%) | 21 (31.8%) |
| 35 to 44 Years | 100 (77.5%) | 0 (0.0%) |
| 45 to 54 Years | 193 (64.3%) | 12 (6.2%) |
| 55 to 59 Years | 83 (53.5%) | 0 (0.0%) |
| 60 to 64 Years | 110 (63.2%) | 29 (26.4%) |
| 65 to 74 Years | 100 (19.6%) | 7 (7.0%) |
| 75 Years and over | 0 (0.0%) | 0 (0.0%) |
| Total | 876 (40.4%) | 106 (12.1%) |
Employment Status by Educational Attainment in White Mountain Lake
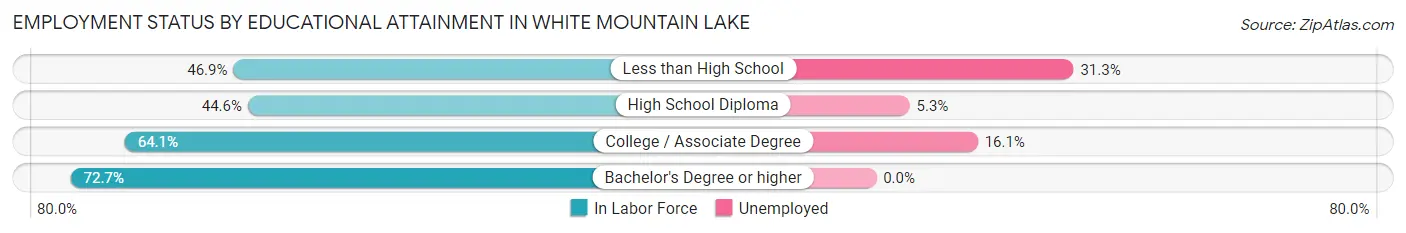
According to labor force statistics for White Mountain Lake, 54.4% of individuals (657) out of the total population between 25 and 64 years of age (1,208) are in the labor force, with 10.8% or 71 of them being unemployed. The group with the highest labor force participation rate are those with the educational attainment of bachelor's degree or higher, with 72.7% or 117 individuals in the labor force. Within the labor force, individuals with less than high school education have the highest percentage of unemployment, with 31.3% or 21 of them being unemployed.
| Educational Attainment | In Labor Force | Unemployed |
| Less than High School | 67 (46.9%) | 45 (31.3%) |
| High School Diploma | 243 (44.6%) | 29 (5.3%) |
| College / Associate Degree | 230 (64.1%) | 58 (16.1%) |
| Bachelor's Degree or higher | 117 (72.7%) | 0 (0.0%) |
| Total | 657 (54.4%) | 130 (10.8%) |
Employment Occupations by Sex in White Mountain Lake
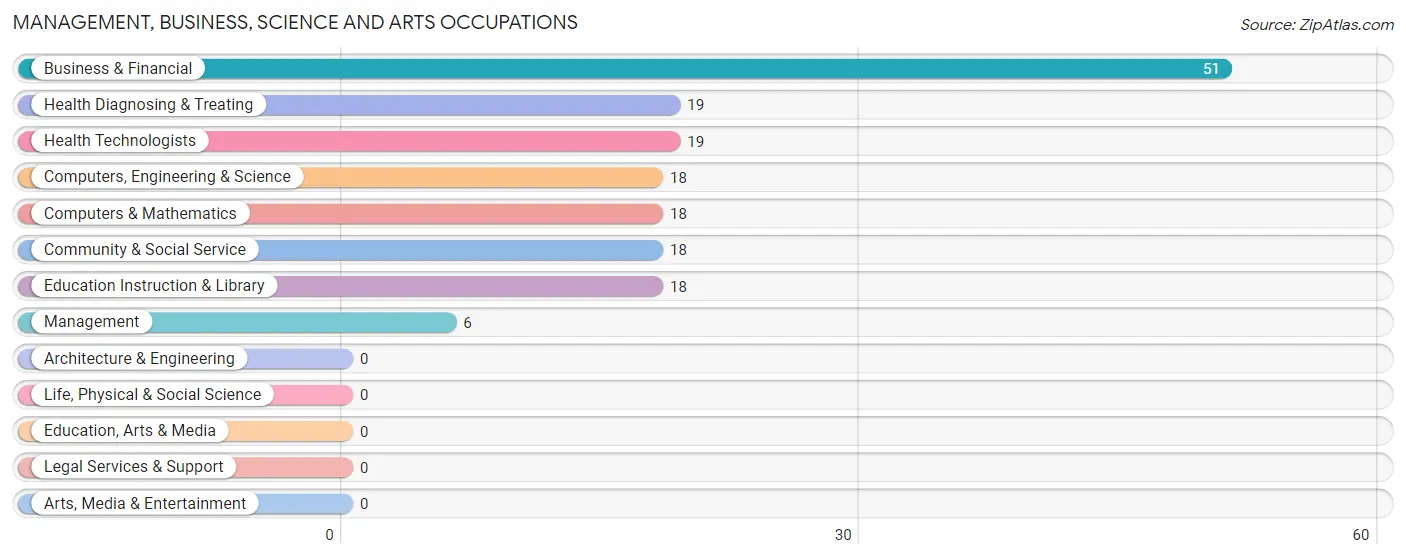
Management, Business, Science and Arts Occupations
The most common Management, Business, Science and Arts occupations in White Mountain Lake are Business & Financial (51 | 6.6%), Health Diagnosing & Treating (19 | 2.5%), Health Technologists (19 | 2.5%), Computers, Engineering & Science (18 | 2.3%), and Computers & Mathematics (18 | 2.3%).
Management, Business, Science and Arts Occupations by Sex
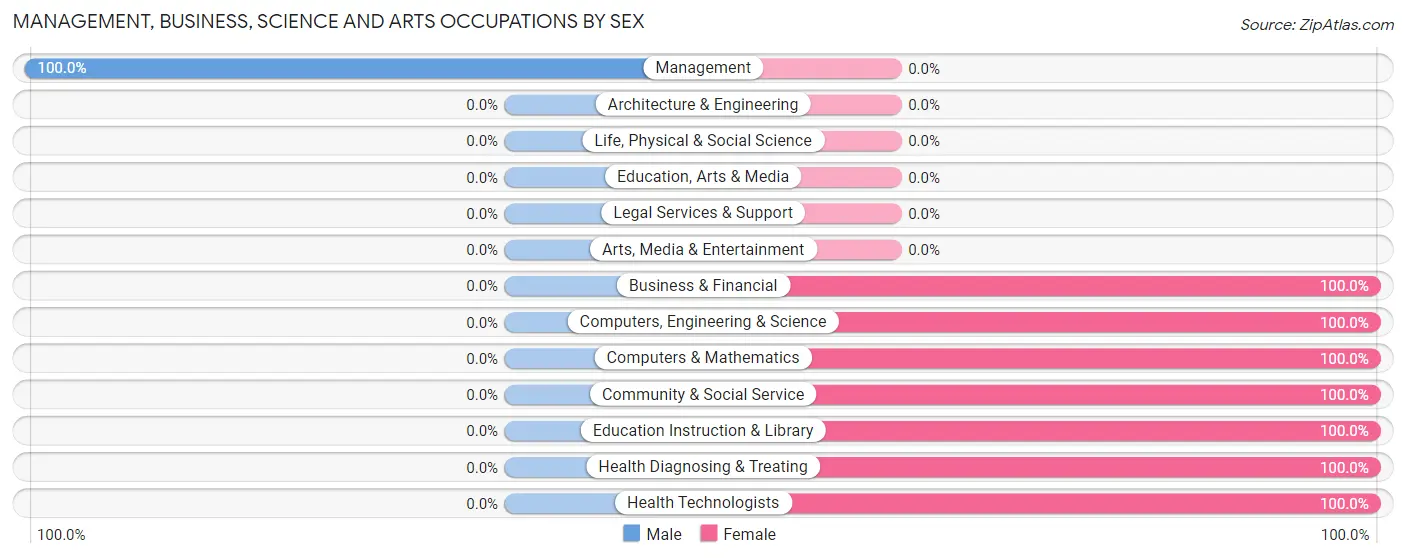
| Occupation | Male | Female |
| Management | 6 (100.0%) | 0 (0.0%) |
| Business & Financial | 0 (0.0%) | 51 (100.0%) |
| Computers, Engineering & Science | 0 (0.0%) | 18 (100.0%) |
| Computers & Mathematics | 0 (0.0%) | 18 (100.0%) |
| Architecture & Engineering | 0 (0.0%) | 0 (0.0%) |
| Life, Physical & Social Science | 0 (0.0%) | 0 (0.0%) |
| Community & Social Service | 0 (0.0%) | 18 (100.0%) |
| Education, Arts & Media | 0 (0.0%) | 0 (0.0%) |
| Legal Services & Support | 0 (0.0%) | 0 (0.0%) |
| Education Instruction & Library | 0 (0.0%) | 18 (100.0%) |
| Arts, Media & Entertainment | 0 (0.0%) | 0 (0.0%) |
| Health Diagnosing & Treating | 0 (0.0%) | 19 (100.0%) |
| Health Technologists | 0 (0.0%) | 19 (100.0%) |
| Total (Category) | 6 (5.4%) | 106 (94.6%) |
| Total (Overall) | 489 (63.5%) | 281 (36.5%) |
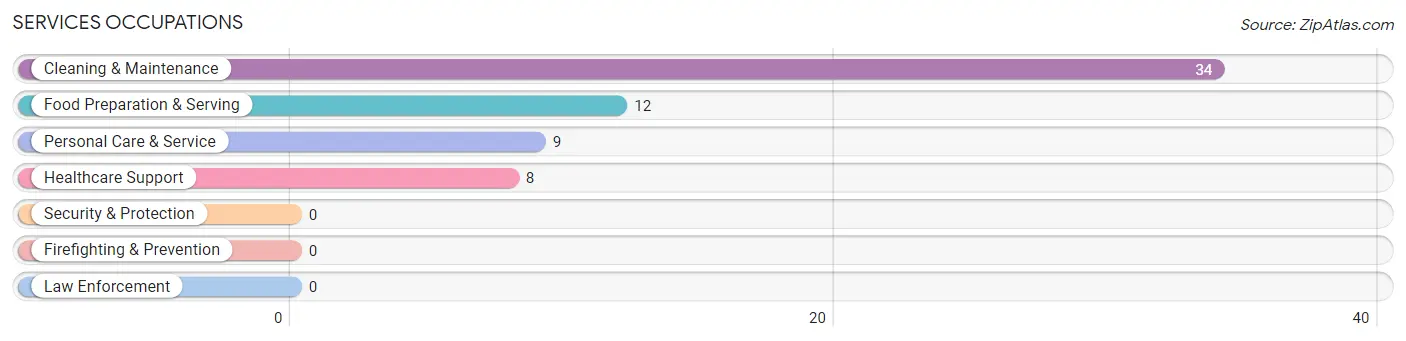
Services Occupations
The most common Services occupations in White Mountain Lake are Cleaning & Maintenance (34 | 4.4%), Food Preparation & Serving (12 | 1.6%), Personal Care & Service (9 | 1.2%), and Healthcare Support (8 | 1.0%).
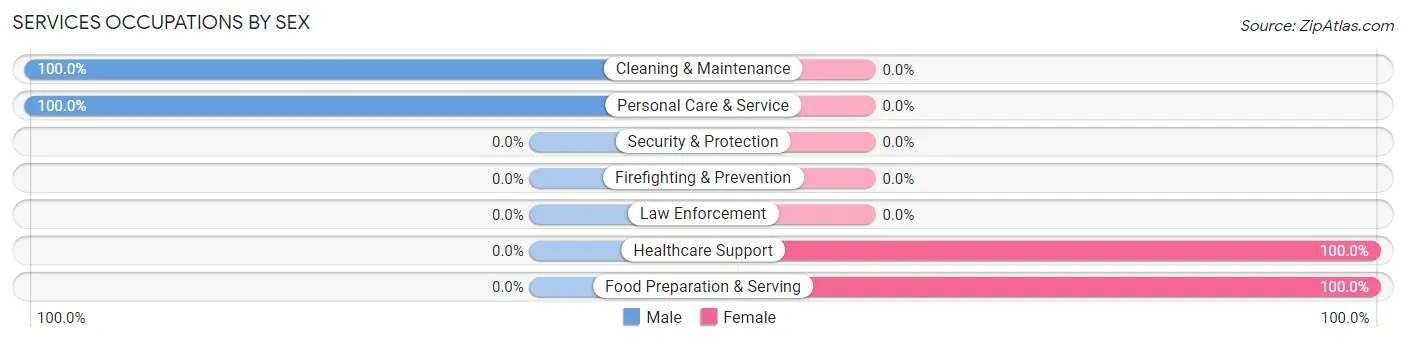
Services Occupations by Sex
Within the Services occupations in White Mountain Lake, the most male-oriented occupations are Cleaning & Maintenance (100.0%), and Personal Care & Service (100.0%), while the most female-oriented occupations are Healthcare Support (100.0%), and Food Preparation & Serving (100.0%).
| Occupation | Male | Female |
| Healthcare Support | 0 (0.0%) | 8 (100.0%) |
| Security & Protection | 0 (0.0%) | 0 (0.0%) |
| Firefighting & Prevention | 0 (0.0%) | 0 (0.0%) |
| Law Enforcement | 0 (0.0%) | 0 (0.0%) |
| Food Preparation & Serving | 0 (0.0%) | 12 (100.0%) |
| Cleaning & Maintenance | 34 (100.0%) | 0 (0.0%) |
| Personal Care & Service | 9 (100.0%) | 0 (0.0%) |
| Total (Category) | 43 (68.2%) | 20 (31.8%) |
| Total (Overall) | 489 (63.5%) | 281 (36.5%) |
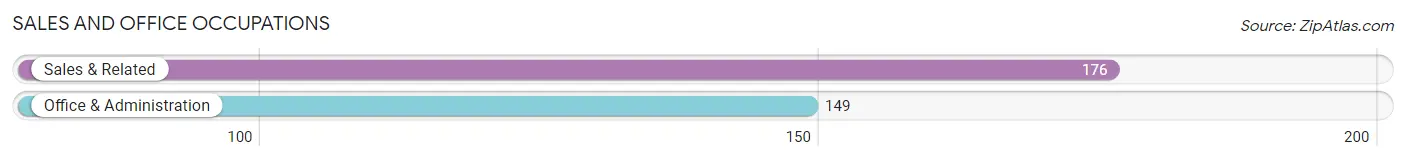
Sales and Office Occupations
The most common Sales and Office occupations in White Mountain Lake are Sales & Related (176 | 22.9%), and Office & Administration (149 | 19.4%).
Sales and Office Occupations by Sex
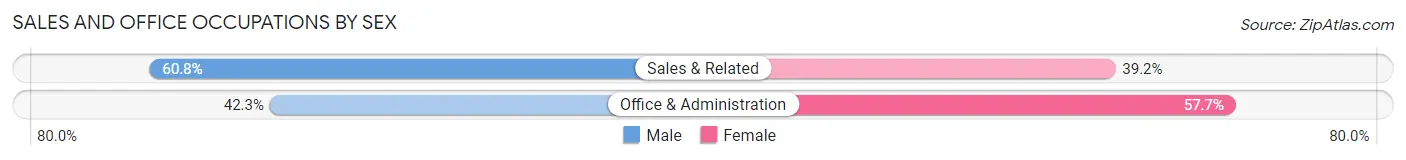
| Occupation | Male | Female |
| Sales & Related | 107 (60.8%) | 69 (39.2%) |
| Office & Administration | 63 (42.3%) | 86 (57.7%) |
| Total (Category) | 170 (52.3%) | 155 (47.7%) |
| Total (Overall) | 489 (63.5%) | 281 (36.5%) |
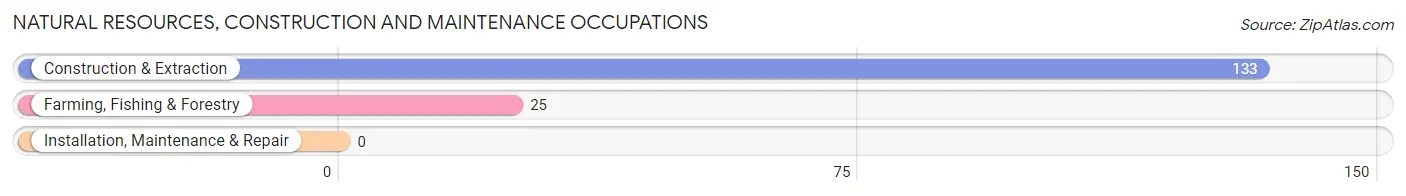
Natural Resources, Construction and Maintenance Occupations
The most common Natural Resources, Construction and Maintenance occupations in White Mountain Lake are Construction & Extraction (133 | 17.3%), and Farming, Fishing & Forestry (25 | 3.3%).
Natural Resources, Construction and Maintenance Occupations by Sex
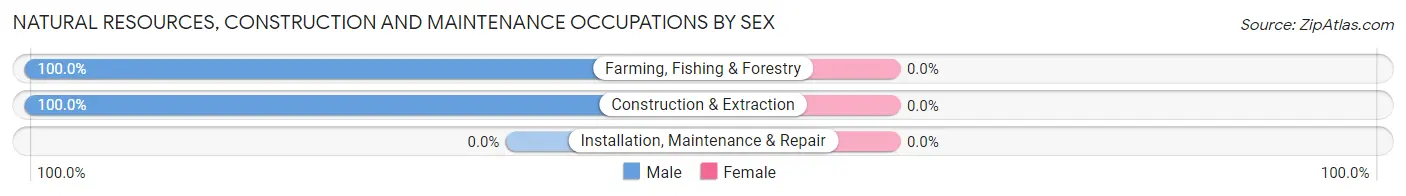
| Occupation | Male | Female |
| Farming, Fishing & Forestry | 25 (100.0%) | 0 (0.0%) |
| Construction & Extraction | 133 (100.0%) | 0 (0.0%) |
| Installation, Maintenance & Repair | 0 (0.0%) | 0 (0.0%) |
| Total (Category) | 158 (100.0%) | 0 (0.0%) |
| Total (Overall) | 489 (63.5%) | 281 (36.5%) |
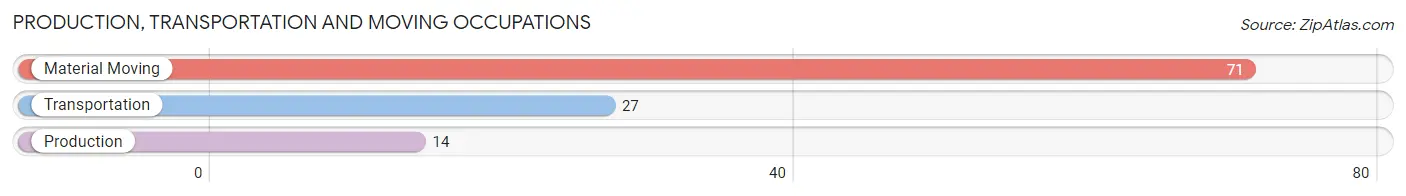
Production, Transportation and Moving Occupations
The most common Production, Transportation and Moving occupations in White Mountain Lake are Material Moving (71 | 9.2%), Transportation (27 | 3.5%), and Production (14 | 1.8%).
Production, Transportation and Moving Occupations by Sex
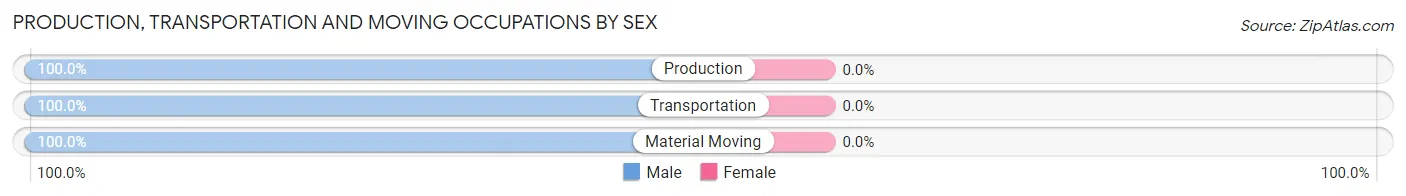
| Occupation | Male | Female |
| Production | 14 (100.0%) | 0 (0.0%) |
| Transportation | 27 (100.0%) | 0 (0.0%) |
| Material Moving | 71 (100.0%) | 0 (0.0%) |
| Total (Category) | 112 (100.0%) | 0 (0.0%) |
| Total (Overall) | 489 (63.5%) | 281 (36.5%) |
Employment Industries by Sex in White Mountain Lake
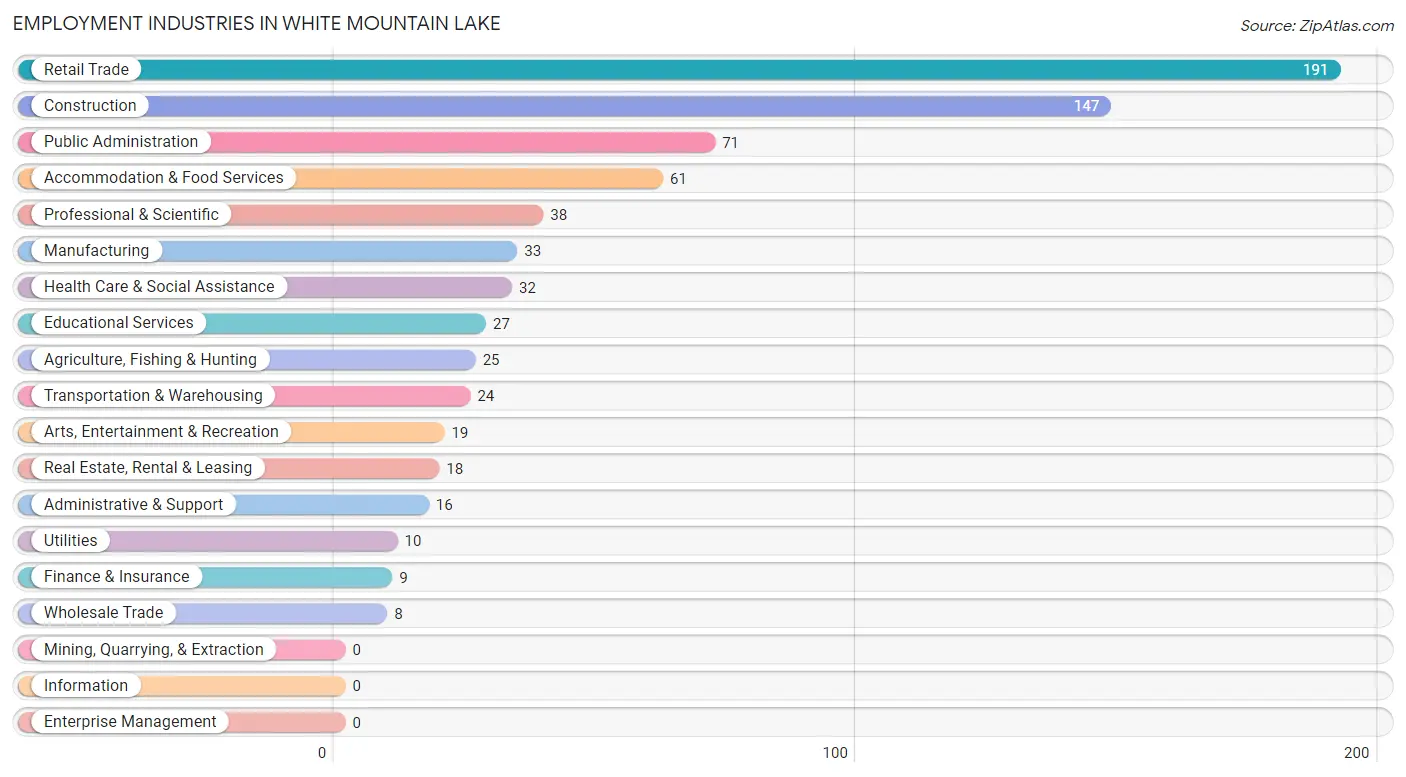
Employment Industries in White Mountain Lake
The major employment industries in White Mountain Lake include Retail Trade (191 | 24.8%), Construction (147 | 19.1%), Public Administration (71 | 9.2%), Accommodation & Food Services (61 | 7.9%), and Professional & Scientific (38 | 4.9%).
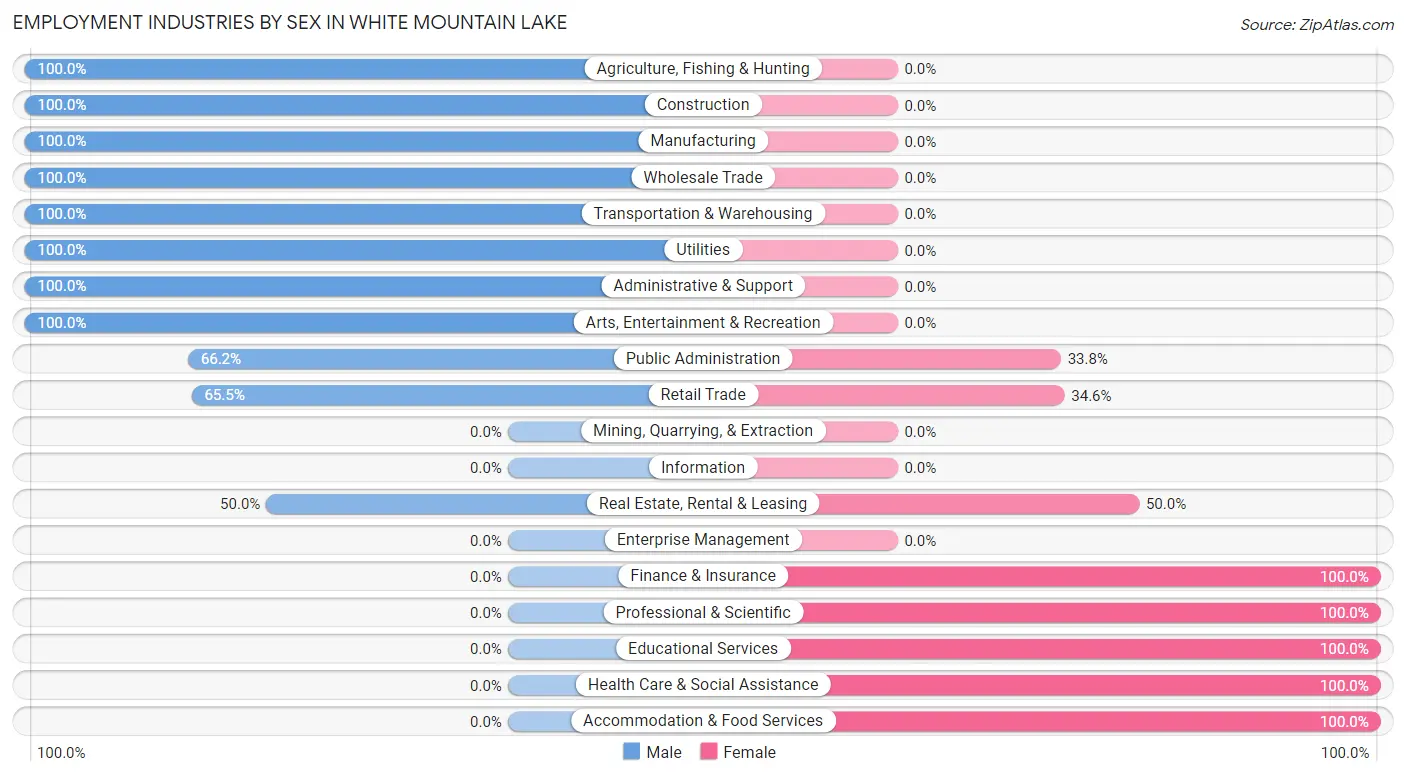
Employment Industries by Sex in White Mountain Lake
The White Mountain Lake industries that see more men than women are Agriculture, Fishing & Hunting (100.0%), Construction (100.0%), and Manufacturing (100.0%), whereas the industries that tend to have a higher number of women are Finance & Insurance (100.0%), Professional & Scientific (100.0%), and Educational Services (100.0%).
| Industry | Male | Female |
| Agriculture, Fishing & Hunting | 25 (100.0%) | 0 (0.0%) |
| Mining, Quarrying, & Extraction | 0 (0.0%) | 0 (0.0%) |
| Construction | 147 (100.0%) | 0 (0.0%) |
| Manufacturing | 33 (100.0%) | 0 (0.0%) |
| Wholesale Trade | 8 (100.0%) | 0 (0.0%) |
| Retail Trade | 125 (65.4%) | 66 (34.5%) |
| Transportation & Warehousing | 24 (100.0%) | 0 (0.0%) |
| Utilities | 10 (100.0%) | 0 (0.0%) |
| Information | 0 (0.0%) | 0 (0.0%) |
| Finance & Insurance | 0 (0.0%) | 9 (100.0%) |
| Real Estate, Rental & Leasing | 9 (50.0%) | 9 (50.0%) |
| Professional & Scientific | 0 (0.0%) | 38 (100.0%) |
| Enterprise Management | 0 (0.0%) | 0 (0.0%) |
| Administrative & Support | 16 (100.0%) | 0 (0.0%) |
| Educational Services | 0 (0.0%) | 27 (100.0%) |
| Health Care & Social Assistance | 0 (0.0%) | 32 (100.0%) |
| Arts, Entertainment & Recreation | 19 (100.0%) | 0 (0.0%) |
| Accommodation & Food Services | 0 (0.0%) | 61 (100.0%) |
| Public Administration | 47 (66.2%) | 24 (33.8%) |
| Total | 489 (63.5%) | 281 (36.5%) |
Education in White Mountain Lake
School Enrollment in White Mountain Lake
The most common levels of schooling among the 552 students in White Mountain Lake are middle school (158 | 28.6%), high school (145 | 26.3%), and elementary school (128 | 23.2%).
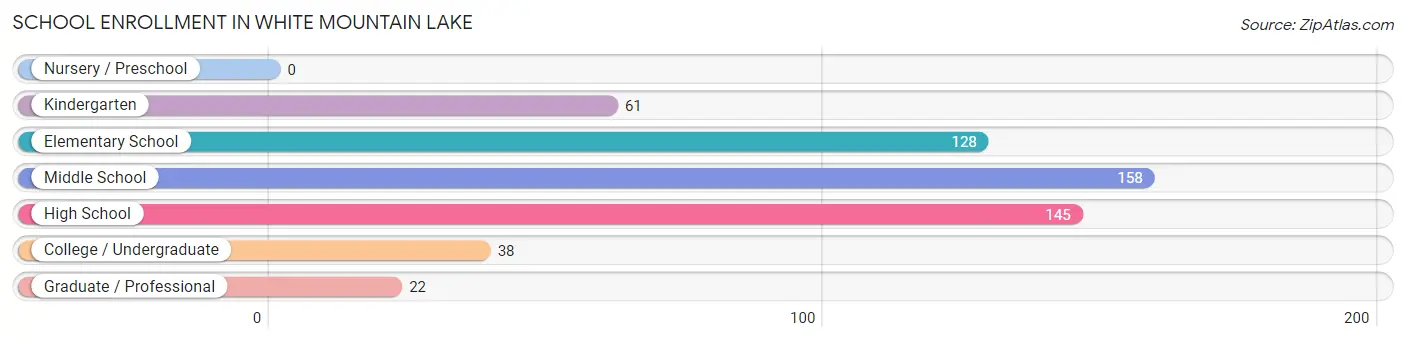
| School Level | # Students | % Students |
| Nursery / Preschool | 0 | 0.0% |
| Kindergarten | 61 | 11.1% |
| Elementary School | 128 | 23.2% |
| Middle School | 158 | 28.6% |
| High School | 145 | 26.3% |
| College / Undergraduate | 38 | 6.9% |
| Graduate / Professional | 22 | 4.0% |
| Total | 552 | 100.0% |
School Enrollment by Age by Funding Source in White Mountain Lake
Out of a total of 552 students who are enrolled in schools in White Mountain Lake, 21 (3.8%) attend a private institution, while the remaining 531 (96.2%) are enrolled in public schools. The age group of 10 to 14 year olds has the highest likelihood of being enrolled in private schools, with 21 (13.3% in the age bracket) enrolled. Conversely, the age group of 5 to 9 year old has the lowest likelihood of being enrolled in a private school, with 189 (100.0% in the age bracket) attending a public institution.
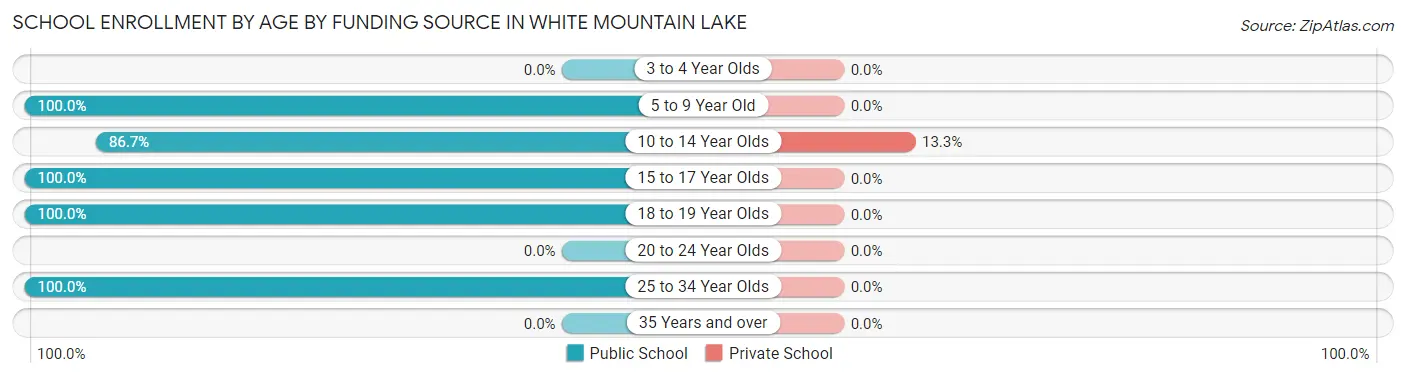
| Age Bracket | Public School | Private School |
| 3 to 4 Year Olds | 0 (0.0%) | 0 (0.0%) |
| 5 to 9 Year Old | 189 (100.0%) | 0 (0.0%) |
| 10 to 14 Year Olds | 137 (86.7%) | 21 (13.3%) |
| 15 to 17 Year Olds | 123 (100.0%) | 0 (0.0%) |
| 18 to 19 Year Olds | 22 (100.0%) | 0 (0.0%) |
| 20 to 24 Year Olds | 0 (0.0%) | 0 (0.0%) |
| 25 to 34 Year Olds | 60 (100.0%) | 0 (0.0%) |
| 35 Years and over | 0 (0.0%) | 0 (0.0%) |
| Total | 531 (96.2%) | 21 (3.8%) |
Educational Attainment by Field of Study in White Mountain Lake
Science & technology (82 | 31.4%), arts & humanities (46 | 17.6%), bio, nature & agricultural (40 | 15.3%), education (26 | 10.0%), and literature & languages (18 | 6.9%) are the most common fields of study among 261 individuals in White Mountain Lake who have obtained a bachelor's degree or higher.
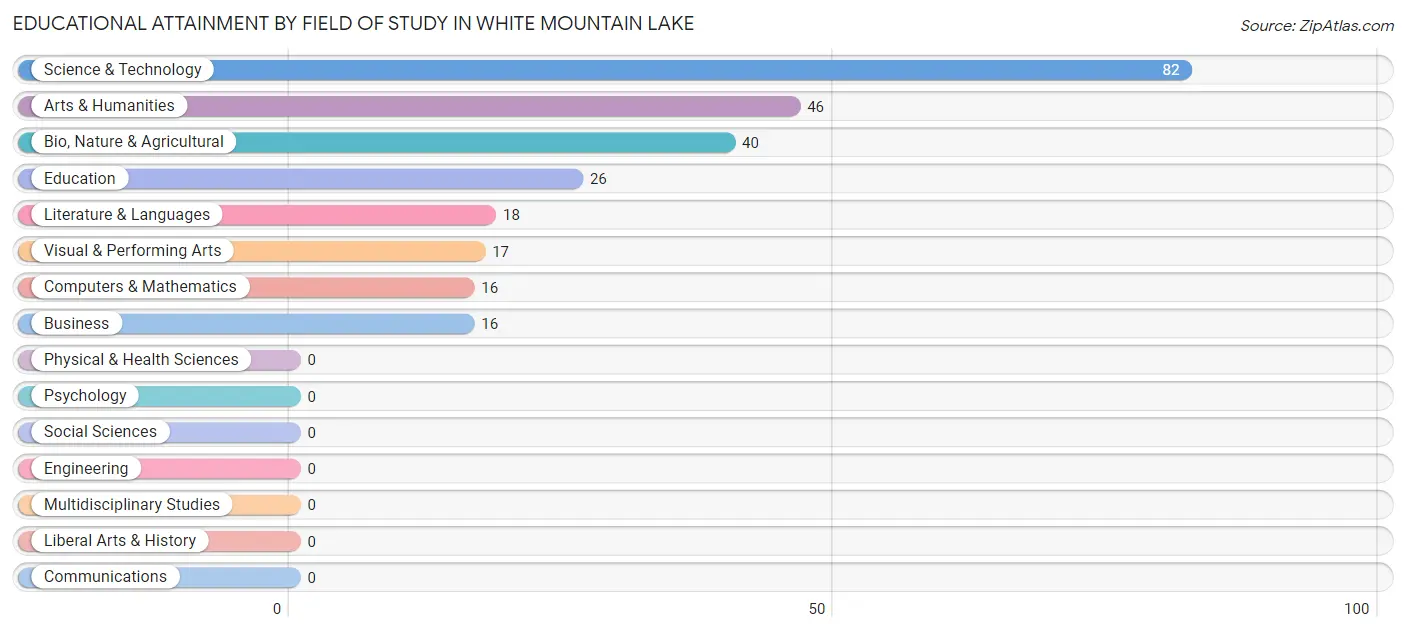
| Field of Study | # Graduates | % Graduates |
| Computers & Mathematics | 16 | 6.1% |
| Bio, Nature & Agricultural | 40 | 15.3% |
| Physical & Health Sciences | 0 | 0.0% |
| Psychology | 0 | 0.0% |
| Social Sciences | 0 | 0.0% |
| Engineering | 0 | 0.0% |
| Multidisciplinary Studies | 0 | 0.0% |
| Science & Technology | 82 | 31.4% |
| Business | 16 | 6.1% |
| Education | 26 | 10.0% |
| Literature & Languages | 18 | 6.9% |
| Liberal Arts & History | 0 | 0.0% |
| Visual & Performing Arts | 17 | 6.5% |
| Communications | 0 | 0.0% |
| Arts & Humanities | 46 | 17.6% |
| Total | 261 | 100.0% |
Transportation & Commute in White Mountain Lake
Vehicle Availability by Sex in White Mountain Lake
The most prevalent vehicle ownership categories in White Mountain Lake are males with 2 vehicles (197, accounting for 41.0%) and females with 2 vehicles (33, making up 70.1%).
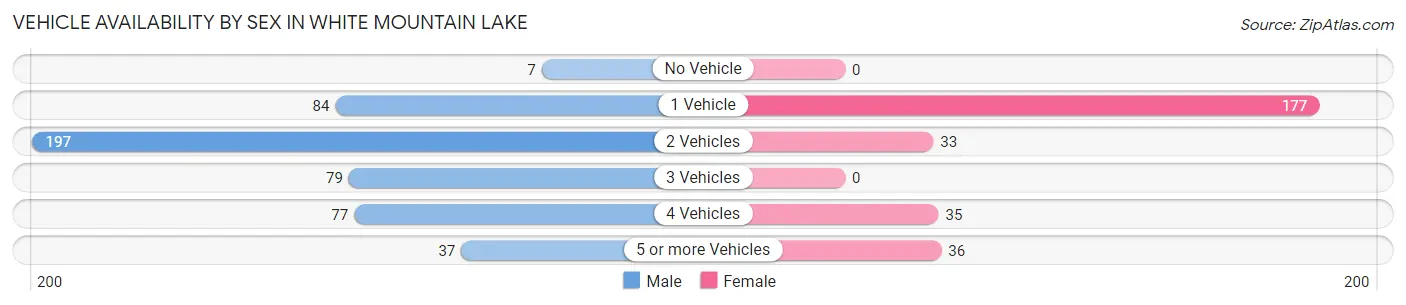
| Vehicles Available | Male | Female |
| No Vehicle | 7 (1.5%) | 0 (0.0%) |
| 1 Vehicle | 84 (17.5%) | 177 (63.0%) |
| 2 Vehicles | 197 (41.0%) | 33 (11.7%) |
| 3 Vehicles | 79 (16.4%) | 0 (0.0%) |
| 4 Vehicles | 77 (16.0%) | 35 (12.5%) |
| 5 or more Vehicles | 37 (7.7%) | 36 (12.8%) |
| Total | 481 (100.0%) | 281 (100.0%) |
Commute Time in White Mountain Lake
The most frequently occuring commute durations in White Mountain Lake are 20 to 24 minutes (208 commuters, 28.6%), 60 to 89 minutes (140 commuters, 19.3%), and 45 to 59 minutes (81 commuters, 11.2%).
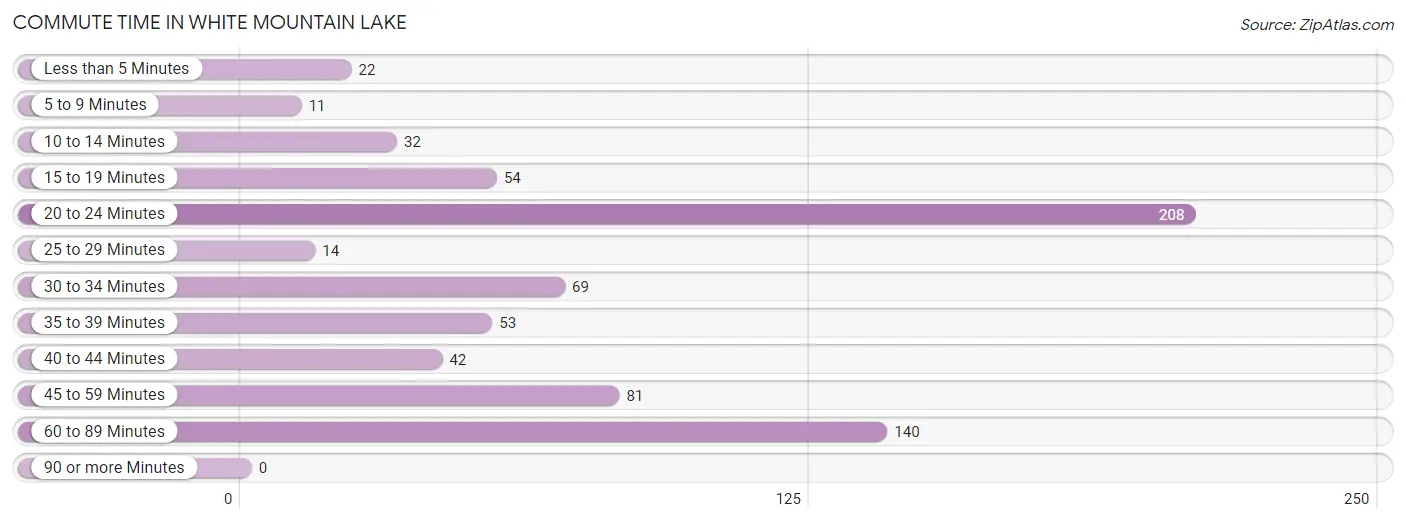
| Commute Time | # Commuters | % Commuters |
| Less than 5 Minutes | 22 | 3.0% |
| 5 to 9 Minutes | 11 | 1.5% |
| 10 to 14 Minutes | 32 | 4.4% |
| 15 to 19 Minutes | 54 | 7.4% |
| 20 to 24 Minutes | 208 | 28.6% |
| 25 to 29 Minutes | 14 | 1.9% |
| 30 to 34 Minutes | 69 | 9.5% |
| 35 to 39 Minutes | 53 | 7.3% |
| 40 to 44 Minutes | 42 | 5.8% |
| 45 to 59 Minutes | 81 | 11.2% |
| 60 to 89 Minutes | 140 | 19.3% |
| 90 or more Minutes | 0 | 0.0% |
Commute Time by Sex in White Mountain Lake
The most common commute times in White Mountain Lake are 20 to 24 minutes (129 commuters, 27.3%) for males and 20 to 24 minutes (79 commuters, 31.1%) for females.
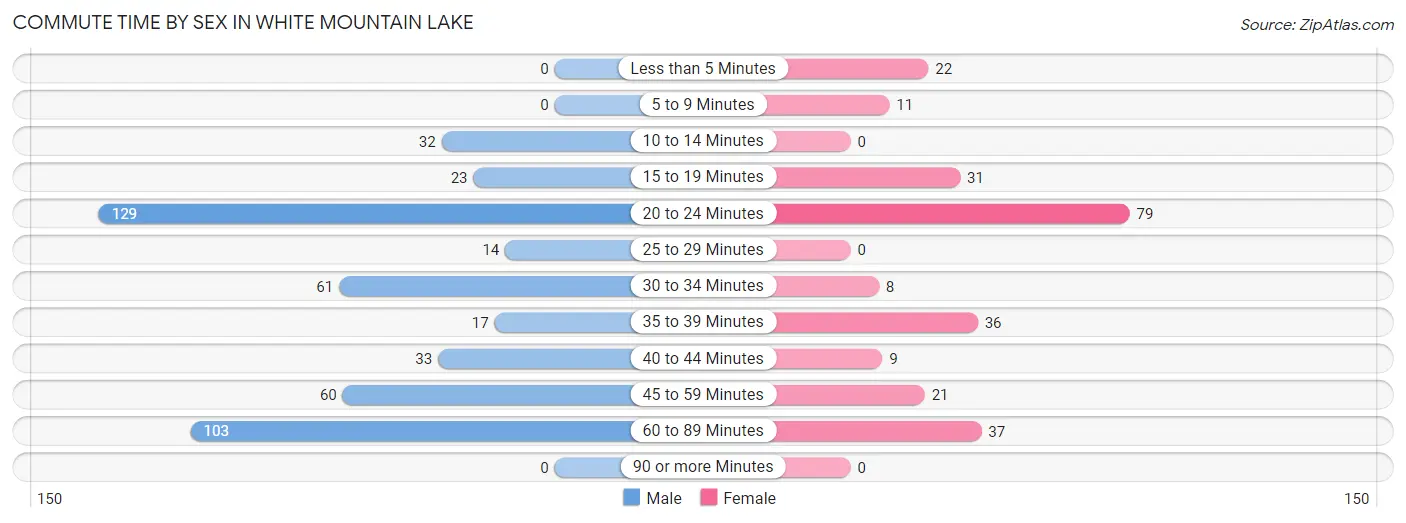
| Commute Time | Male | Female |
| Less than 5 Minutes | 0 (0.0%) | 22 (8.7%) |
| 5 to 9 Minutes | 0 (0.0%) | 11 (4.3%) |
| 10 to 14 Minutes | 32 (6.8%) | 0 (0.0%) |
| 15 to 19 Minutes | 23 (4.9%) | 31 (12.2%) |
| 20 to 24 Minutes | 129 (27.3%) | 79 (31.1%) |
| 25 to 29 Minutes | 14 (3.0%) | 0 (0.0%) |
| 30 to 34 Minutes | 61 (12.9%) | 8 (3.2%) |
| 35 to 39 Minutes | 17 (3.6%) | 36 (14.2%) |
| 40 to 44 Minutes | 33 (7.0%) | 9 (3.5%) |
| 45 to 59 Minutes | 60 (12.7%) | 21 (8.3%) |
| 60 to 89 Minutes | 103 (21.8%) | 37 (14.6%) |
| 90 or more Minutes | 0 (0.0%) | 0 (0.0%) |
Time of Departure to Work by Sex in White Mountain Lake
The most frequent times of departure to work in White Mountain Lake are 12:00 AM to 4:59 AM (96, 20.3%) for males and 5:30 AM to 5:59 AM (59, 23.2%) for females.
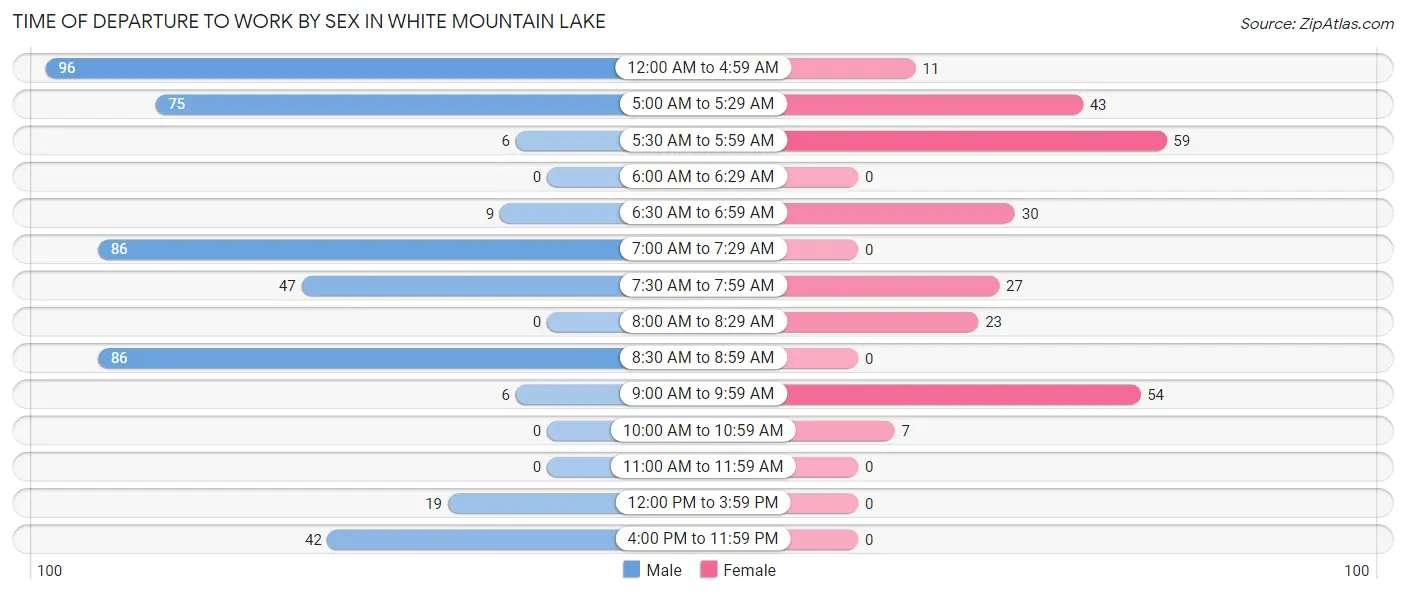
| Time of Departure | Male | Female |
| 12:00 AM to 4:59 AM | 96 (20.3%) | 11 (4.3%) |
| 5:00 AM to 5:29 AM | 75 (15.9%) | 43 (16.9%) |
| 5:30 AM to 5:59 AM | 6 (1.3%) | 59 (23.2%) |
| 6:00 AM to 6:29 AM | 0 (0.0%) | 0 (0.0%) |
| 6:30 AM to 6:59 AM | 9 (1.9%) | 30 (11.8%) |
| 7:00 AM to 7:29 AM | 86 (18.2%) | 0 (0.0%) |
| 7:30 AM to 7:59 AM | 47 (10.0%) | 27 (10.6%) |
| 8:00 AM to 8:29 AM | 0 (0.0%) | 23 (9.1%) |
| 8:30 AM to 8:59 AM | 86 (18.2%) | 0 (0.0%) |
| 9:00 AM to 9:59 AM | 6 (1.3%) | 54 (21.3%) |
| 10:00 AM to 10:59 AM | 0 (0.0%) | 7 (2.8%) |
| 11:00 AM to 11:59 AM | 0 (0.0%) | 0 (0.0%) |
| 12:00 PM to 3:59 PM | 19 (4.0%) | 0 (0.0%) |
| 4:00 PM to 11:59 PM | 42 (8.9%) | 0 (0.0%) |
| Total | 472 (100.0%) | 254 (100.0%) |
Housing Occupancy in White Mountain Lake
Occupancy by Ownership in White Mountain Lake
Of the total 960 dwellings in White Mountain Lake, owner-occupied units account for 726 (75.6%), while renter-occupied units make up 234 (24.4%).
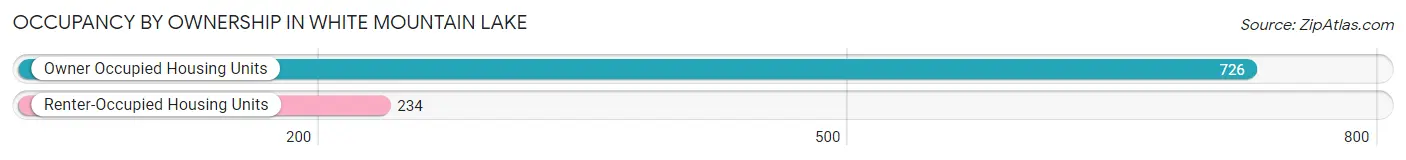
| Occupancy | # Housing Units | % Housing Units |
| Owner Occupied Housing Units | 726 | 75.6% |
| Renter-Occupied Housing Units | 234 | 24.4% |
| Total Occupied Housing Units | 960 | 100.0% |
Occupancy by Household Size in White Mountain Lake
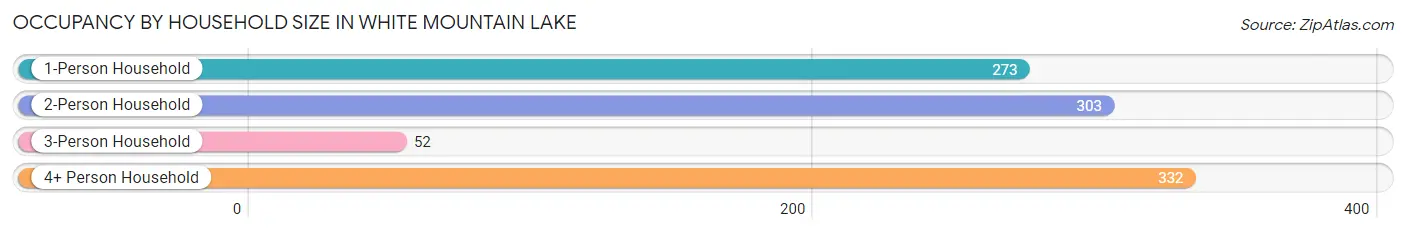
| Household Size | # Housing Units | % Housing Units |
| 1-Person Household | 273 | 28.4% |
| 2-Person Household | 303 | 31.6% |
| 3-Person Household | 52 | 5.4% |
| 4+ Person Household | 332 | 34.6% |
| Total Housing Units | 960 | 100.0% |
Occupancy by Ownership by Household Size in White Mountain Lake
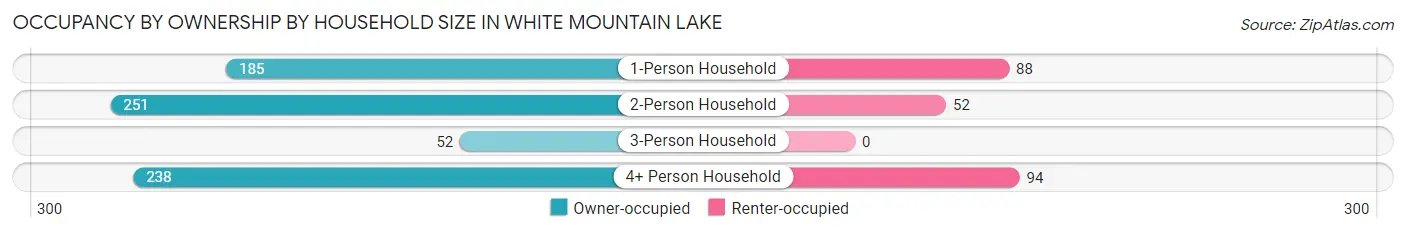
| Household Size | Owner-occupied | Renter-occupied |
| 1-Person Household | 185 (67.8%) | 88 (32.2%) |
| 2-Person Household | 251 (82.8%) | 52 (17.2%) |
| 3-Person Household | 52 (100.0%) | 0 (0.0%) |
| 4+ Person Household | 238 (71.7%) | 94 (28.3%) |
| Total Housing Units | 726 (75.6%) | 234 (24.4%) |
Occupancy by Educational Attainment in White Mountain Lake
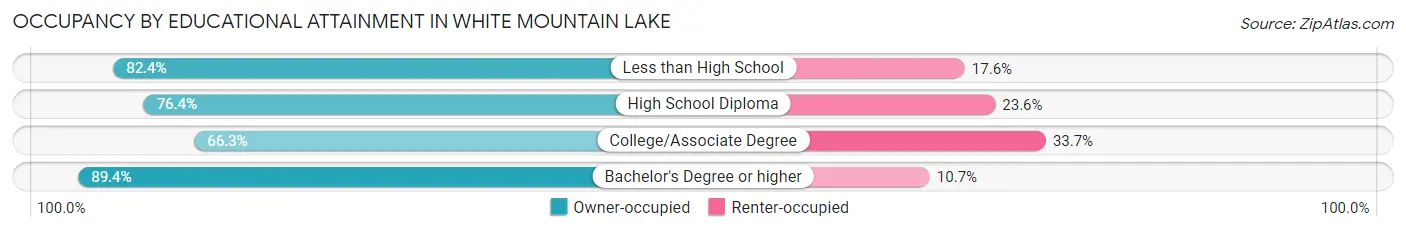
| Household Size | Owner-occupied | Renter-occupied |
| Less than High School | 164 (82.4%) | 35 (17.6%) |
| High School Diploma | 139 (76.4%) | 43 (23.6%) |
| College/Associate Degree | 272 (66.3%) | 138 (33.7%) |
| Bachelor's Degree or higher | 151 (89.3%) | 18 (10.6%) |
Occupancy by Age of Householder in White Mountain Lake
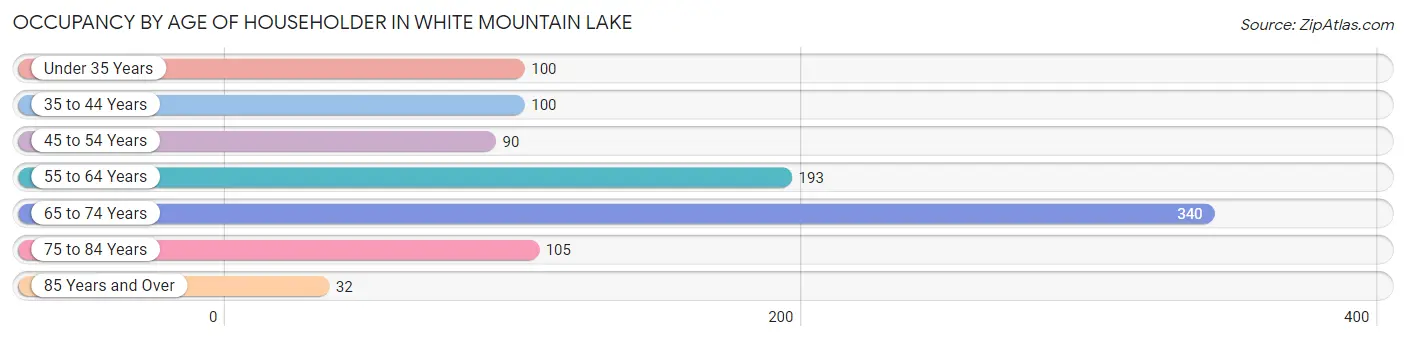
| Age Bracket | # Households | % Households |
| Under 35 Years | 100 | 10.4% |
| 35 to 44 Years | 100 | 10.4% |
| 45 to 54 Years | 90 | 9.4% |
| 55 to 64 Years | 193 | 20.1% |
| 65 to 74 Years | 340 | 35.4% |
| 75 to 84 Years | 105 | 10.9% |
| 85 Years and Over | 32 | 3.3% |
| Total | 960 | 100.0% |
Housing Finances in White Mountain Lake
Median Income by Occupancy in White Mountain Lake
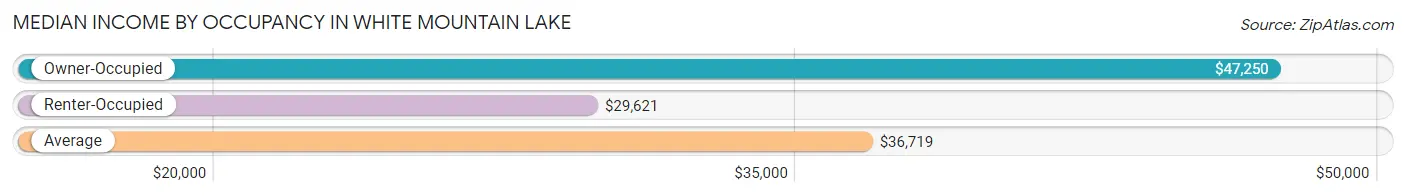
| Occupancy Type | # Households | Median Income |
| Owner-Occupied | 726 (75.6%) | $47,250 |
| Renter-Occupied | 234 (24.4%) | $29,621 |
| Average | 960 (100.0%) | $36,719 |
Occupancy by Householder Income Bracket in White Mountain Lake
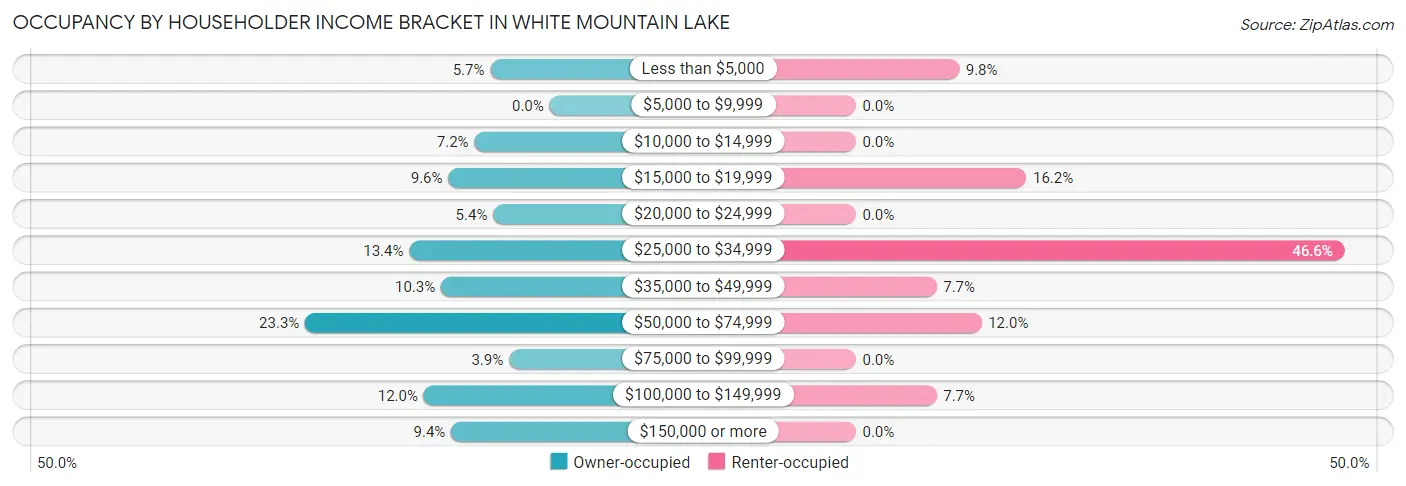
| Income Bracket | Owner-occupied | Renter-occupied |
| Less than $5,000 | 41 (5.7%) | 23 (9.8%) |
| $5,000 to $9,999 | 0 (0.0%) | 0 (0.0%) |
| $10,000 to $14,999 | 52 (7.2%) | 0 (0.0%) |
| $15,000 to $19,999 | 70 (9.6%) | 38 (16.2%) |
| $20,000 to $24,999 | 39 (5.4%) | 0 (0.0%) |
| $25,000 to $34,999 | 97 (13.4%) | 109 (46.6%) |
| $35,000 to $49,999 | 75 (10.3%) | 18 (7.7%) |
| $50,000 to $74,999 | 169 (23.3%) | 28 (12.0%) |
| $75,000 to $99,999 | 28 (3.9%) | 0 (0.0%) |
| $100,000 to $149,999 | 87 (12.0%) | 18 (7.7%) |
| $150,000 or more | 68 (9.4%) | 0 (0.0%) |
| Total | 726 (100.0%) | 234 (100.0%) |
Monthly Housing Cost Tiers in White Mountain Lake
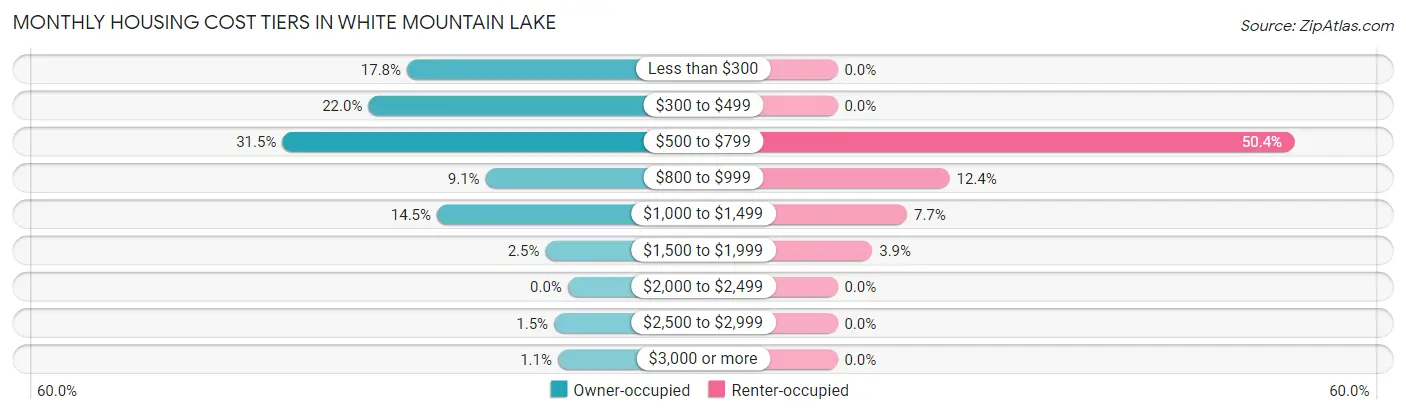
| Monthly Cost | Owner-occupied | Renter-occupied |
| Less than $300 | 129 (17.8%) | 0 (0.0%) |
| $300 to $499 | 160 (22.0%) | 0 (0.0%) |
| $500 to $799 | 229 (31.5%) | 118 (50.4%) |
| $800 to $999 | 66 (9.1%) | 29 (12.4%) |
| $1,000 to $1,499 | 105 (14.5%) | 18 (7.7%) |
| $1,500 to $1,999 | 18 (2.5%) | 9 (3.8%) |
| $2,000 to $2,499 | 0 (0.0%) | 0 (0.0%) |
| $2,500 to $2,999 | 11 (1.5%) | 0 (0.0%) |
| $3,000 or more | 8 (1.1%) | 0 (0.0%) |
| Total | 726 (100.0%) | 234 (100.0%) |
Physical Housing Characteristics in White Mountain Lake
Housing Structures in White Mountain Lake
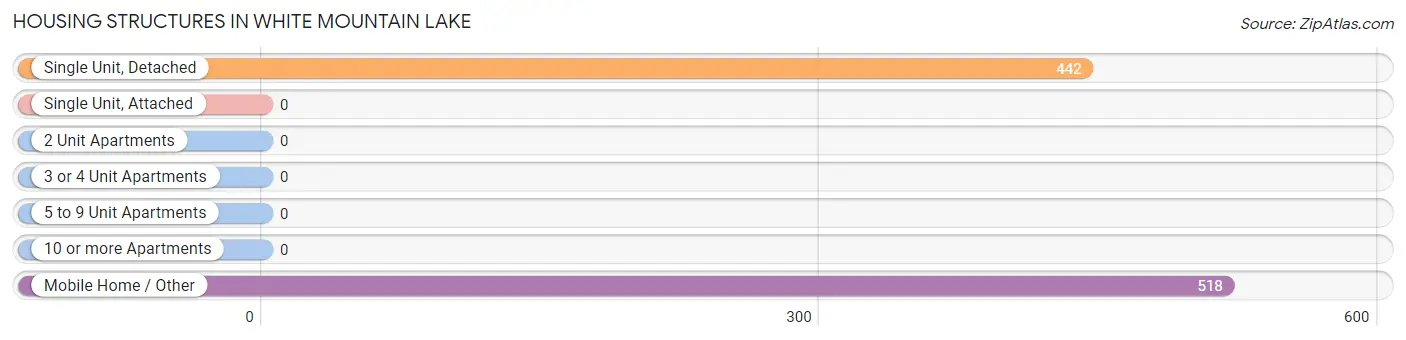
| Structure Type | # Housing Units | % Housing Units |
| Single Unit, Detached | 442 | 46.0% |
| Single Unit, Attached | 0 | 0.0% |
| 2 Unit Apartments | 0 | 0.0% |
| 3 or 4 Unit Apartments | 0 | 0.0% |
| 5 to 9 Unit Apartments | 0 | 0.0% |
| 10 or more Apartments | 0 | 0.0% |
| Mobile Home / Other | 518 | 54.0% |
| Total | 960 | 100.0% |
Housing Structures by Occupancy in White Mountain Lake
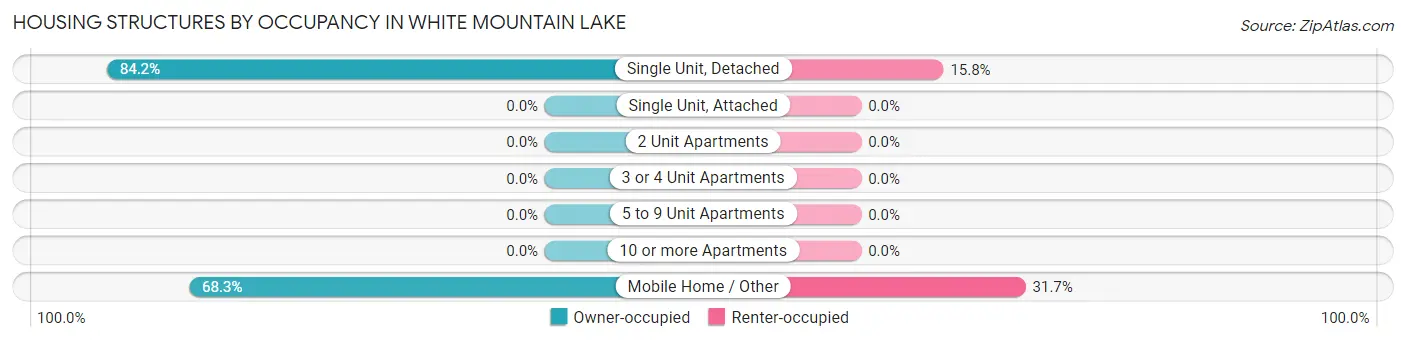
| Structure Type | Owner-occupied | Renter-occupied |
| Single Unit, Detached | 372 (84.2%) | 70 (15.8%) |
| Single Unit, Attached | 0 (0.0%) | 0 (0.0%) |
| 2 Unit Apartments | 0 (0.0%) | 0 (0.0%) |
| 3 or 4 Unit Apartments | 0 (0.0%) | 0 (0.0%) |
| 5 to 9 Unit Apartments | 0 (0.0%) | 0 (0.0%) |
| 10 or more Apartments | 0 (0.0%) | 0 (0.0%) |
| Mobile Home / Other | 354 (68.3%) | 164 (31.7%) |
| Total | 726 (75.6%) | 234 (24.4%) |
Housing Structures by Number of Rooms in White Mountain Lake
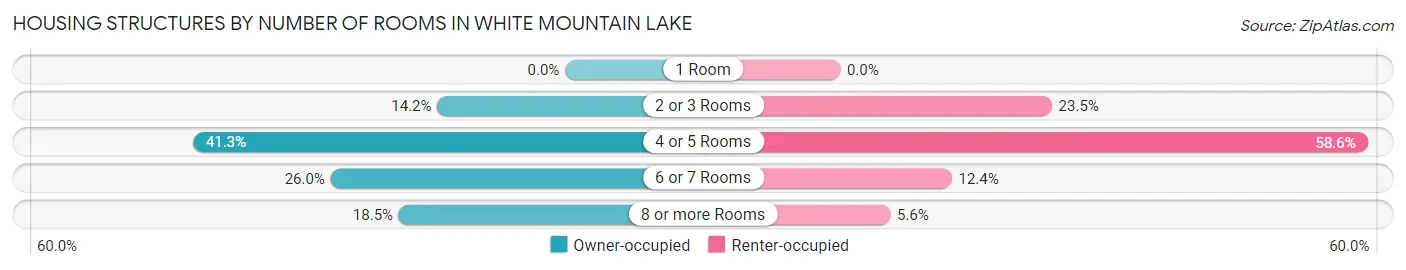
| Number of Rooms | Owner-occupied | Renter-occupied |
| 1 Room | 0 (0.0%) | 0 (0.0%) |
| 2 or 3 Rooms | 103 (14.2%) | 55 (23.5%) |
| 4 or 5 Rooms | 300 (41.3%) | 137 (58.6%) |
| 6 or 7 Rooms | 189 (26.0%) | 29 (12.4%) |
| 8 or more Rooms | 134 (18.5%) | 13 (5.6%) |
| Total | 726 (100.0%) | 234 (100.0%) |
Housing Structure by Heating Type in White Mountain Lake
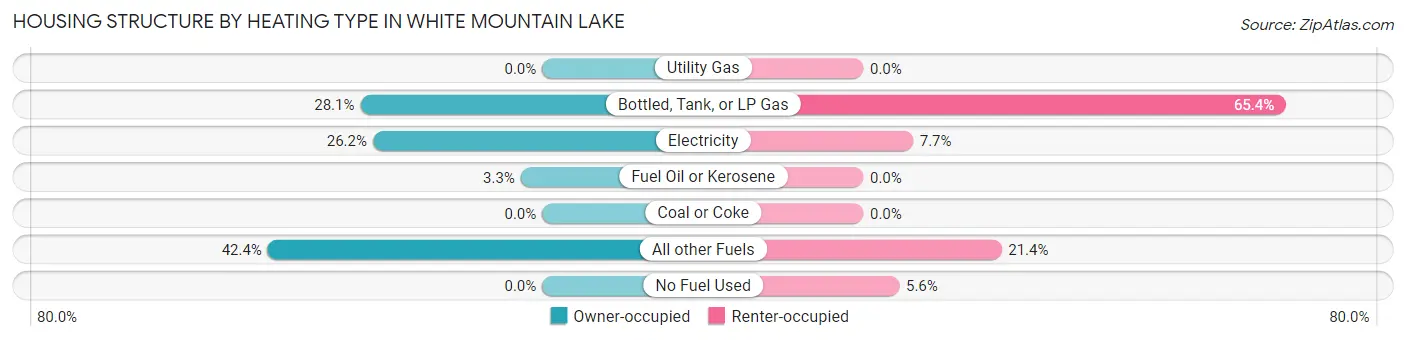
| Heating Type | Owner-occupied | Renter-occupied |
| Utility Gas | 0 (0.0%) | 0 (0.0%) |
| Bottled, Tank, or LP Gas | 204 (28.1%) | 153 (65.4%) |
| Electricity | 190 (26.2%) | 18 (7.7%) |
| Fuel Oil or Kerosene | 24 (3.3%) | 0 (0.0%) |
| Coal or Coke | 0 (0.0%) | 0 (0.0%) |
| All other Fuels | 308 (42.4%) | 50 (21.4%) |
| No Fuel Used | 0 (0.0%) | 13 (5.6%) |
| Total | 726 (100.0%) | 234 (100.0%) |
Household Vehicle Usage in White Mountain Lake
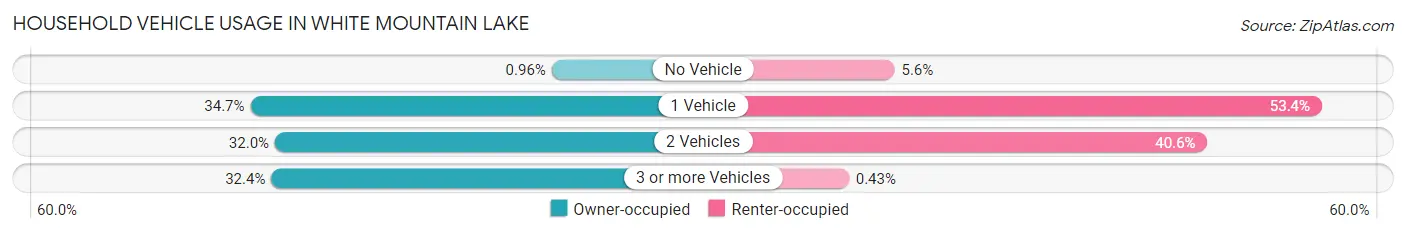
| Vehicles per Household | Owner-occupied | Renter-occupied |
| No Vehicle | 7 (1.0%) | 13 (5.6%) |
| 1 Vehicle | 252 (34.7%) | 125 (53.4%) |
| 2 Vehicles | 232 (32.0%) | 95 (40.6%) |
| 3 or more Vehicles | 235 (32.4%) | 1 (0.4%) |
| Total | 726 (100.0%) | 234 (100.0%) |
Real Estate & Mortgages in White Mountain Lake
Real Estate and Mortgage Overview in White Mountain Lake
| Characteristic | Without Mortgage | With Mortgage |
| Housing Units | 400 | 326 |
| Median Property Value | $100,000 | $140,700 |
| Median Household Income | $53,281 | $23 |
| Monthly Housing Costs | $380 | $0 |
| Real Estate Taxes | $761 | $34 |
Property Value by Mortgage Status in White Mountain Lake
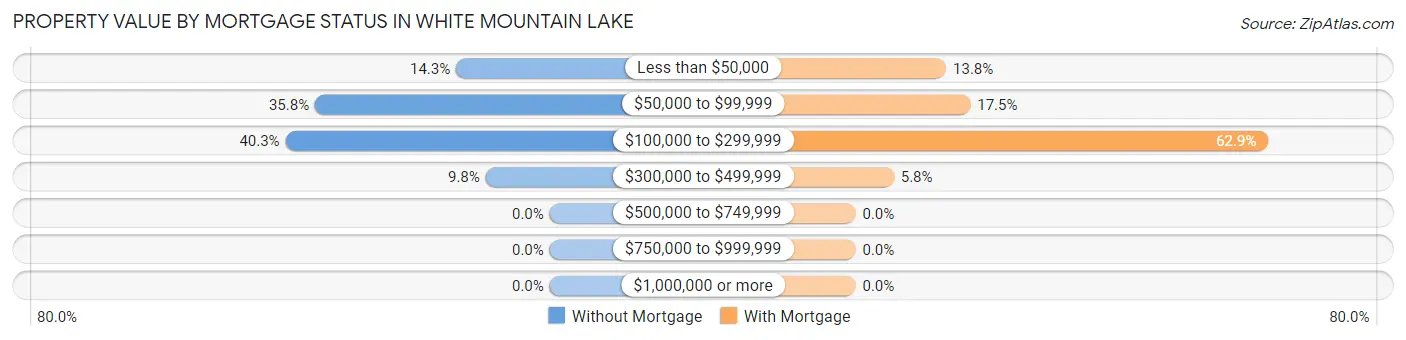
| Property Value | Without Mortgage | With Mortgage |
| Less than $50,000 | 57 (14.2%) | 45 (13.8%) |
| $50,000 to $99,999 | 143 (35.7%) | 57 (17.5%) |
| $100,000 to $299,999 | 161 (40.3%) | 205 (62.9%) |
| $300,000 to $499,999 | 39 (9.8%) | 19 (5.8%) |
| $500,000 to $749,999 | 0 (0.0%) | 0 (0.0%) |
| $750,000 to $999,999 | 0 (0.0%) | 0 (0.0%) |
| $1,000,000 or more | 0 (0.0%) | 0 (0.0%) |
| Total | 400 (100.0%) | 326 (100.0%) |
Household Income by Mortgage Status in White Mountain Lake
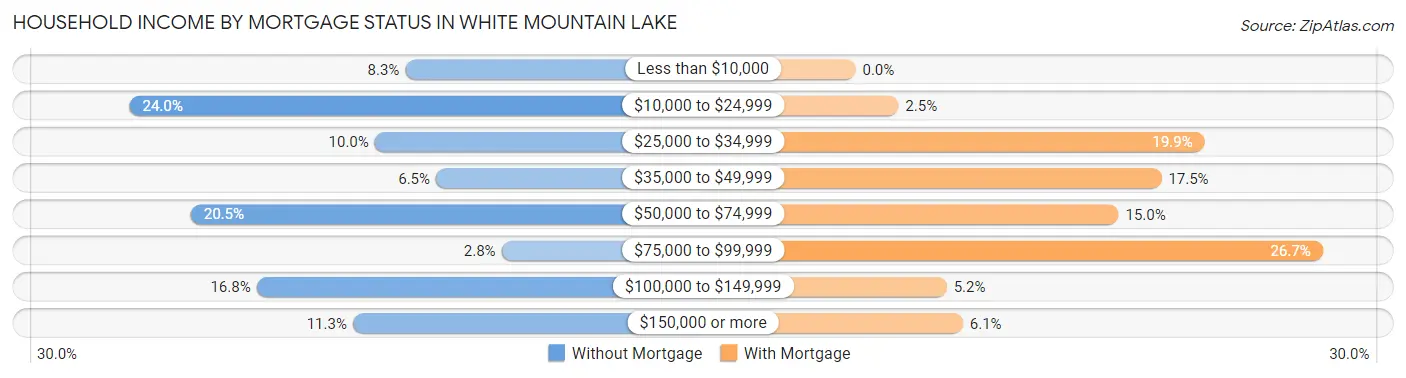
| Household Income | Without Mortgage | With Mortgage |
| Less than $10,000 | 33 (8.3%) | 0 (0.0%) |
| $10,000 to $24,999 | 96 (24.0%) | 8 (2.5%) |
| $25,000 to $34,999 | 40 (10.0%) | 65 (19.9%) |
| $35,000 to $49,999 | 26 (6.5%) | 57 (17.5%) |
| $50,000 to $74,999 | 82 (20.5%) | 49 (15.0%) |
| $75,000 to $99,999 | 11 (2.8%) | 87 (26.7%) |
| $100,000 to $149,999 | 67 (16.8%) | 17 (5.2%) |
| $150,000 or more | 45 (11.3%) | 20 (6.1%) |
| Total | 400 (100.0%) | 326 (100.0%) |
Property Value to Household Income Ratio in White Mountain Lake
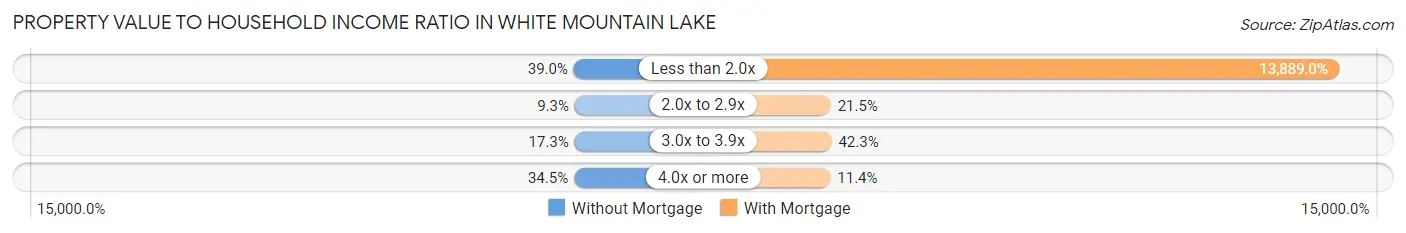
| Value-to-Income Ratio | Without Mortgage | With Mortgage |
| Less than 2.0x | 156 (39.0%) | 45,278 (13,889.0%) |
| 2.0x to 2.9x | 37 (9.2%) | 70 (21.5%) |
| 3.0x to 3.9x | 69 (17.2%) | 138 (42.3%) |
| 4.0x or more | 138 (34.5%) | 37 (11.4%) |
| Total | 400 (100.0%) | 326 (100.0%) |
Real Estate Taxes by Mortgage Status in White Mountain Lake
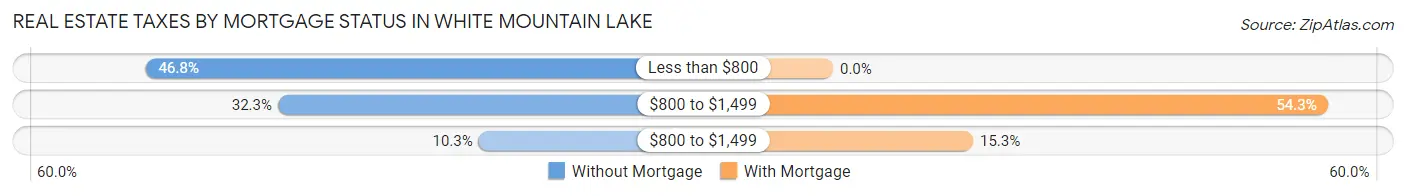
| Property Taxes | Without Mortgage | With Mortgage |
| Less than $800 | 187 (46.8%) | 0 (0.0%) |
| $800 to $1,499 | 129 (32.3%) | 177 (54.3%) |
| $800 to $1,499 | 41 (10.2%) | 50 (15.3%) |
| Total | 400 (100.0%) | 326 (100.0%) |
Health & Disability in White Mountain Lake
Health Insurance Coverage by Age in White Mountain Lake
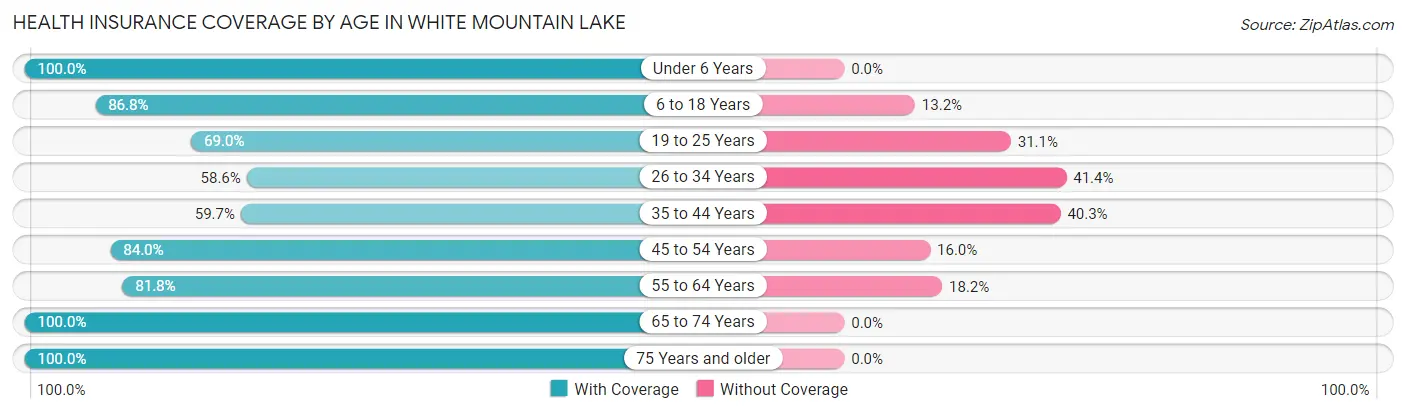
| Age Bracket | With Coverage | Without Coverage |
| Under 6 Years | 301 (100.0%) | 0 (0.0%) |
| 6 to 18 Years | 435 (86.8%) | 66 (13.2%) |
| 19 to 25 Years | 151 (69.0%) | 68 (31.0%) |
| 26 to 34 Years | 201 (58.6%) | 142 (41.4%) |
| 35 to 44 Years | 77 (59.7%) | 52 (40.3%) |
| 45 to 54 Years | 252 (84.0%) | 48 (16.0%) |
| 55 to 64 Years | 269 (81.8%) | 60 (18.2%) |
| 65 to 74 Years | 511 (100.0%) | 0 (0.0%) |
| 75 Years and older | 184 (100.0%) | 0 (0.0%) |
| Total | 2,381 (84.5%) | 436 (15.5%) |
Health Insurance Coverage by Citizenship Status in White Mountain Lake
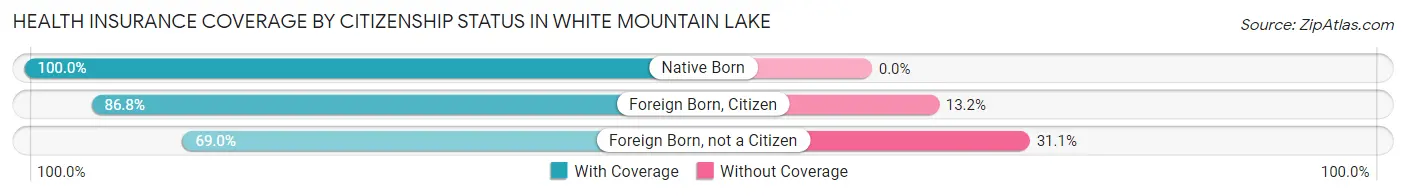
| Citizenship Status | With Coverage | Without Coverage |
| Native Born | 301 (100.0%) | 0 (0.0%) |
| Foreign Born, Citizen | 435 (86.8%) | 66 (13.2%) |
| Foreign Born, not a Citizen | 151 (69.0%) | 68 (31.0%) |
Health Insurance Coverage by Household Income in White Mountain Lake
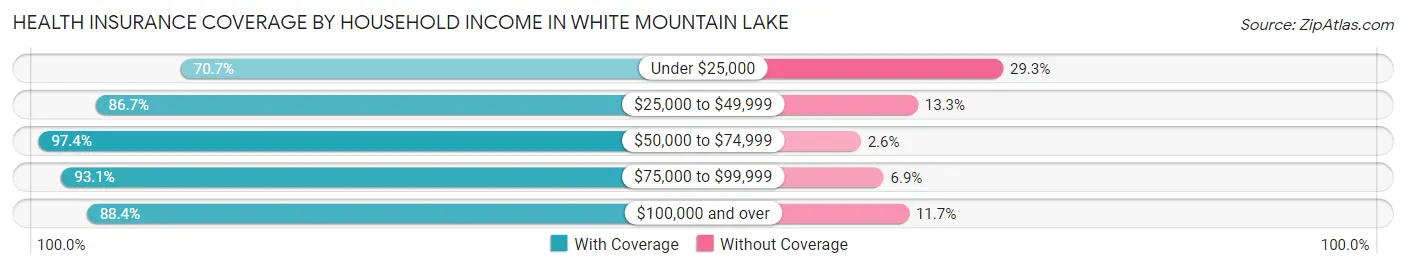
| Household Income | With Coverage | Without Coverage |
| Under $25,000 | 604 (70.7%) | 250 (29.3%) |
| $25,000 to $49,999 | 632 (86.7%) | 97 (13.3%) |
| $50,000 to $74,999 | 560 (97.4%) | 15 (2.6%) |
| $75,000 to $99,999 | 54 (93.1%) | 4 (6.9%) |
| $100,000 and over | 531 (88.3%) | 70 (11.7%) |
Public vs Private Health Insurance Coverage by Age in White Mountain Lake
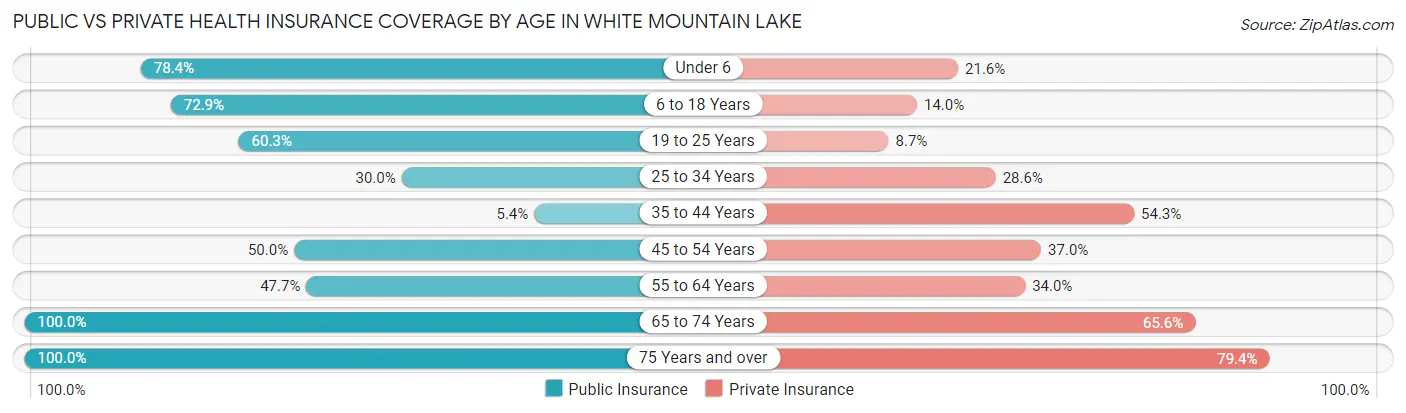
| Age Bracket | Public Insurance | Private Insurance |
| Under 6 | 236 (78.4%) | 65 (21.6%) |
| 6 to 18 Years | 365 (72.9%) | 70 (14.0%) |
| 19 to 25 Years | 132 (60.3%) | 19 (8.7%) |
| 25 to 34 Years | 103 (30.0%) | 98 (28.6%) |
| 35 to 44 Years | 7 (5.4%) | 70 (54.3%) |
| 45 to 54 Years | 150 (50.0%) | 111 (37.0%) |
| 55 to 64 Years | 157 (47.7%) | 112 (34.0%) |
| 65 to 74 Years | 511 (100.0%) | 335 (65.6%) |
| 75 Years and over | 184 (100.0%) | 146 (79.3%) |
| Total | 1,845 (65.5%) | 1,026 (36.4%) |
Disability Status by Sex by Age in White Mountain Lake
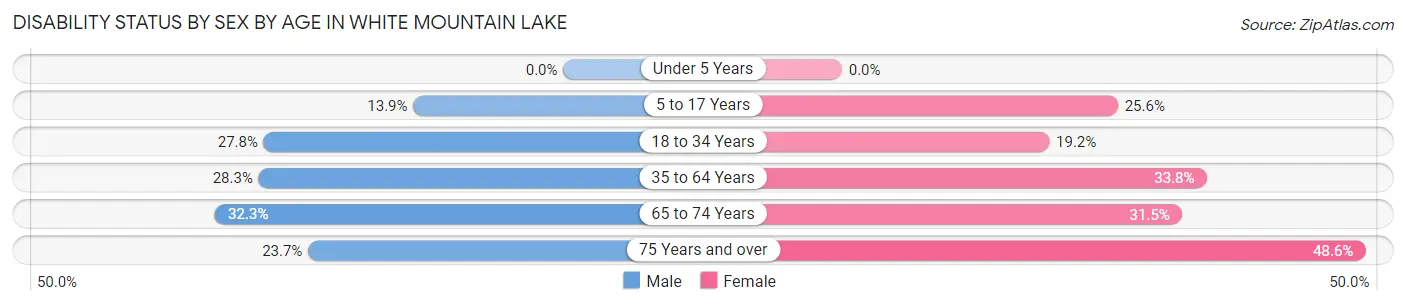
| Age Bracket | Male | Female |
| Under 5 Years | 0 (0.0%) | 0 (0.0%) |
| 5 to 17 Years | 27 (13.9%) | 73 (25.6%) |
| 18 to 34 Years | 67 (27.8%) | 66 (19.2%) |
| 35 to 64 Years | 119 (28.3%) | 114 (33.8%) |
| 65 to 74 Years | 75 (32.3%) | 88 (31.5%) |
| 75 Years and over | 27 (23.7%) | 34 (48.6%) |
Disability Class by Sex by Age in White Mountain Lake
Disability Class: Hearing Difficulty
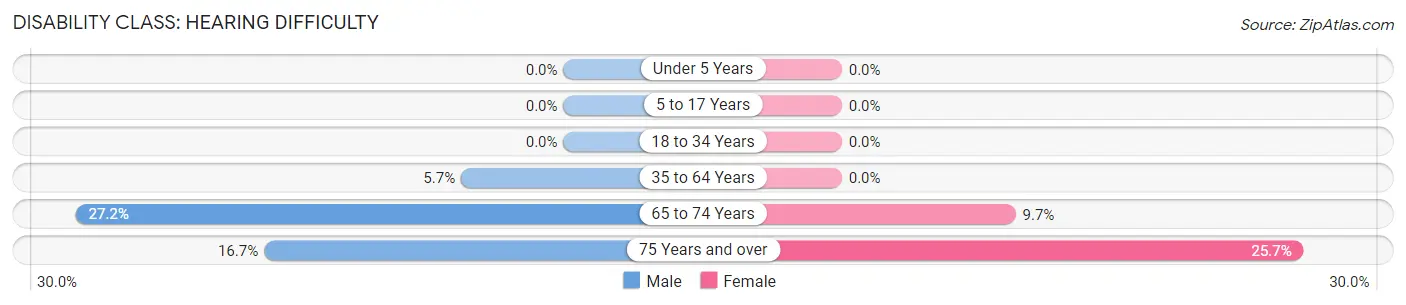
| Age Bracket | Male | Female |
| Under 5 Years | 0 (0.0%) | 0 (0.0%) |
| 5 to 17 Years | 0 (0.0%) | 0 (0.0%) |
| 18 to 34 Years | 0 (0.0%) | 0 (0.0%) |
| 35 to 64 Years | 24 (5.7%) | 0 (0.0%) |
| 65 to 74 Years | 63 (27.2%) | 27 (9.7%) |
| 75 Years and over | 19 (16.7%) | 18 (25.7%) |
Disability Class: Vision Difficulty
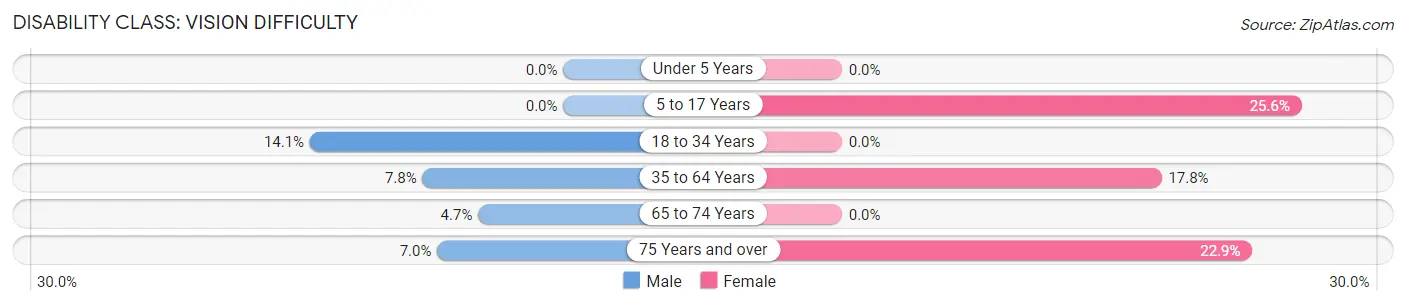
| Age Bracket | Male | Female |
| Under 5 Years | 0 (0.0%) | 0 (0.0%) |
| 5 to 17 Years | 0 (0.0%) | 73 (25.6%) |
| 18 to 34 Years | 34 (14.1%) | 0 (0.0%) |
| 35 to 64 Years | 33 (7.8%) | 60 (17.8%) |
| 65 to 74 Years | 11 (4.7%) | 0 (0.0%) |
| 75 Years and over | 8 (7.0%) | 16 (22.9%) |
Disability Class: Cognitive Difficulty
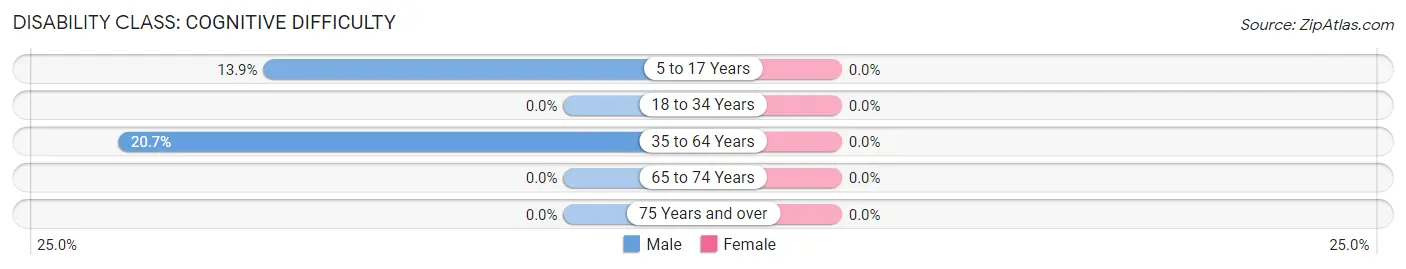
| Age Bracket | Male | Female |
| 5 to 17 Years | 27 (13.9%) | 0 (0.0%) |
| 18 to 34 Years | 0 (0.0%) | 0 (0.0%) |
| 35 to 64 Years | 87 (20.7%) | 0 (0.0%) |
| 65 to 74 Years | 0 (0.0%) | 0 (0.0%) |
| 75 Years and over | 0 (0.0%) | 0 (0.0%) |
Disability Class: Ambulatory Difficulty
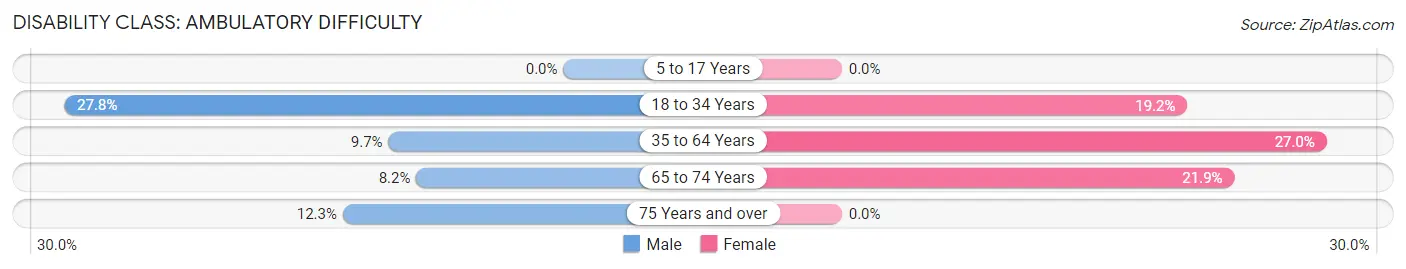
| Age Bracket | Male | Female |
| 5 to 17 Years | 0 (0.0%) | 0 (0.0%) |
| 18 to 34 Years | 67 (27.8%) | 66 (19.2%) |
| 35 to 64 Years | 41 (9.7%) | 91 (27.0%) |
| 65 to 74 Years | 19 (8.2%) | 61 (21.9%) |
| 75 Years and over | 14 (12.3%) | 0 (0.0%) |
Disability Class: Self-Care Difficulty
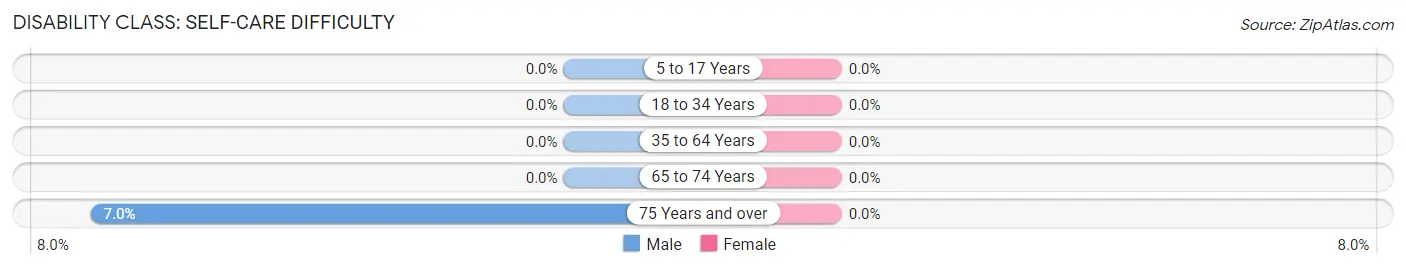
| Age Bracket | Male | Female |
| 5 to 17 Years | 0 (0.0%) | 0 (0.0%) |
| 18 to 34 Years | 0 (0.0%) | 0 (0.0%) |
| 35 to 64 Years | 0 (0.0%) | 0 (0.0%) |
| 65 to 74 Years | 0 (0.0%) | 0 (0.0%) |
| 75 Years and over | 8 (7.0%) | 0 (0.0%) |
Technology Access in White Mountain Lake
Computing Device Access in White Mountain Lake
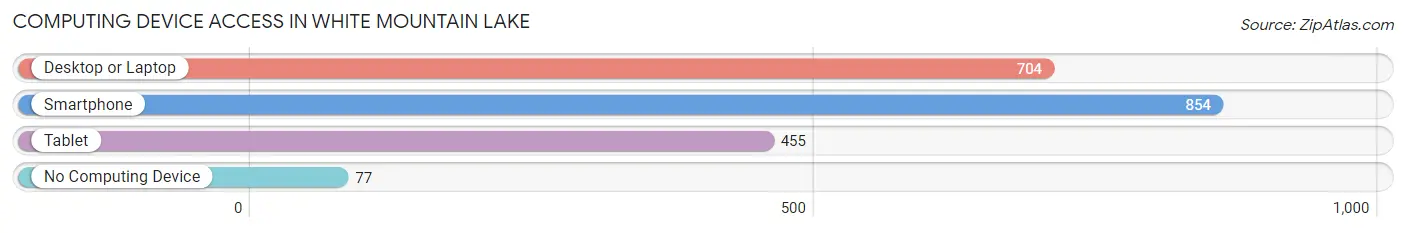
| Device Type | # Households | % Households |
| Desktop or Laptop | 704 | 73.3% |
| Smartphone | 854 | 89.0% |
| Tablet | 455 | 47.4% |
| No Computing Device | 77 | 8.0% |
| Total | 960 | 100.0% |
Internet Access in White Mountain Lake
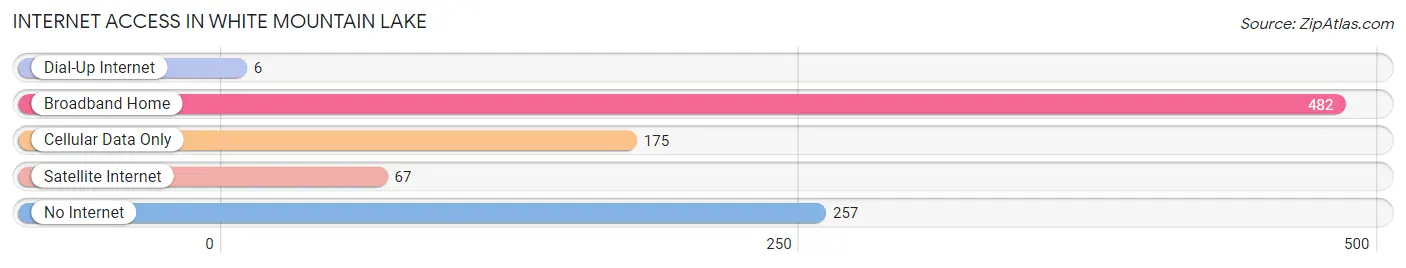
| Internet Type | # Households | % Households |
| Dial-Up Internet | 6 | 0.6% |
| Broadband Home | 482 | 50.2% |
| Cellular Data Only | 175 | 18.2% |
| Satellite Internet | 67 | 7.0% |
| No Internet | 257 | 26.8% |
| Total | 960 | 100.0% |
White Mountain Lake Summary
White Mountain Lake is a small unincorporated community located in Navajo County, Arizona. It is situated in the White Mountains of Arizona, approximately 30 miles east of Show Low. The community is located at an elevation of 6,400 feet and is surrounded by the Apache-Sitgreaves National Forest.
History
White Mountain Lake was originally inhabited by the Apache Indians. The first settlers to the area were ranchers who arrived in the late 1800s. The area was known as White Mountain Lake because of the large lake located nearby. The lake was created by a dam built in the early 1900s.
The community was officially established in the early 1900s when the White Mountain Lake Post Office was established. The post office was located in a small store owned by the local ranchers. The store served as a gathering place for the local ranchers and was the center of the community.
In the early 1900s, the area was also home to a small sawmill. The sawmill was used to cut lumber for the local ranchers and was the main source of income for the community.
In the 1950s, the area began to attract tourists and vacationers. The lake was stocked with fish and became a popular spot for fishing and camping. The area also became a popular destination for snowmobiling and skiing.
Geography
White Mountain Lake is located in the White Mountains of Arizona. The area is surrounded by the Apache-Sitgreaves National Forest and is located at an elevation of 6,400 feet. The area is known for its scenic beauty and is home to a variety of wildlife.
The climate in White Mountain Lake is semi-arid with hot summers and cold winters. The average temperature in the summer is around 80 degrees Fahrenheit and the average temperature in the winter is around 30 degrees Fahrenheit.
Economy
The economy of White Mountain Lake is largely based on tourism. The area is a popular destination for fishing, camping, snowmobiling, and skiing. The area is also home to a variety of restaurants, shops, and lodging.
The area is also home to a variety of businesses that provide services to the local community. These businesses include a grocery store, a hardware store, a gas station, and a post office.
Demographics
As of the 2010 census, the population of White Mountain Lake was 1,093. The population is largely made up of White (90.2%) and Native American (9.8%) residents. The median household income in the area is $37,500 and the median age is 44.
Conclusion
White Mountain Lake is a small unincorporated community located in Navajo County, Arizona. It is situated in the White Mountains of Arizona, approximately 30 miles east of Show Low. The community is surrounded by the Apache-Sitgreaves National Forest and is known for its scenic beauty and variety of wildlife. The economy of White Mountain Lake is largely based on tourism and the area is home to a variety of businesses that provide services to the local community. The population of White Mountain Lake is largely made up of White and Native American residents and the median household income is $37,500.
Common Questions
What is Per Capita Income in White Mountain Lake?
Per Capita income in White Mountain Lake is $19,235.
What is the Median Family Income in White Mountain Lake?
Median Family Income in White Mountain Lake is $53,705.
What is the Median Household income in White Mountain Lake?
Median Household Income in White Mountain Lake is $36,719.
What is Income or Wage Gap in White Mountain Lake?
Income or Wage Gap in White Mountain Lake is 15.2%.
Women in White Mountain Lake earn 84.8 cents for every dollar earned by a man.
What is Inequality or Gini Index in White Mountain Lake?
Inequality or Gini Index in White Mountain Lake is 0.46.
What is the Total Population of White Mountain Lake?
Total Population of White Mountain Lake is 2,817.
What is the Total Male Population of White Mountain Lake?
Total Male Population of White Mountain Lake is 1,299.
What is the Total Female Population of White Mountain Lake?
Total Female Population of White Mountain Lake is 1,518.
What is the Ratio of Males per 100 Females in White Mountain Lake?
There are 85.57 Males per 100 Females in White Mountain Lake.
What is the Ratio of Females per 100 Males in White Mountain Lake?
There are 116.86 Females per 100 Males in White Mountain Lake.
What is the Median Population Age in White Mountain Lake?
Median Population Age in White Mountain Lake is 36.0 Years.
What is the Average Family Size in White Mountain Lake
Average Family Size in White Mountain Lake is 3.7 People.
What is the Average Household Size in White Mountain Lake
Average Household Size in White Mountain Lake is 2.9 People.
How Large is the Labor Force in White Mountain Lake?
There are 876 People in the Labor Forcein in White Mountain Lake.
What is the Percentage of People in the Labor Force in White Mountain Lake?
40.4% of People are in the Labor Force in White Mountain Lake.
What is the Unemployment Rate in White Mountain Lake?
Unemployment Rate in White Mountain Lake is 12.1%.