Greasewood, AZ Map & Demographics
Greasewood Map
Greasewood Overview
$14,214
PER CAPITA INCOME
$23,750
AVG FAMILY INCOME
$22,708
AVG HOUSEHOLD INCOME
8.4%
WAGE / INCOME GAP [ % ]
91.6¢/ $1
WAGE / INCOME GAP [ $ ]
$11,032
FAMILY INCOME DEFICIT
0.50
INEQUALITY / GINI INDEX
281
TOTAL POPULATION
134
MALE POPULATION
147
FEMALE POPULATION
91.16
MALES / 100 FEMALES
109.70
FEMALES / 100 MALES
42.6
MEDIAN AGE
3.5
AVG FAMILY SIZE
2.8
AVG HOUSEHOLD SIZE
78
LABOR FORCE [ PEOPLE ]
34.2%
PERCENT IN LABOR FORCE
20.5%
UNEMPLOYMENT RATE
Income in Greasewood
Income Overview in Greasewood
Per Capita Income in Greasewood is $14,214, while median incomes of families and households are $23,750 and $22,708 respectively.
| Characteristic | Number | Measure |
| Per Capita Income | 281 | $14,214 |
| Median Family Income | 70 | $23,750 |
| Mean Family Income | 70 | $40,591 |
| Median Household Income | 99 | $22,708 |
| Mean Household Income | 99 | $38,452 |
| Income Deficit | 70 | $11,032 |
| Wage / Income Gap (%) | 281 | 8.44% |
| Wage / Income Gap ($) | 281 | 91.56¢ per $1 |
| Gini / Inequality Index | 281 | 0.50 |
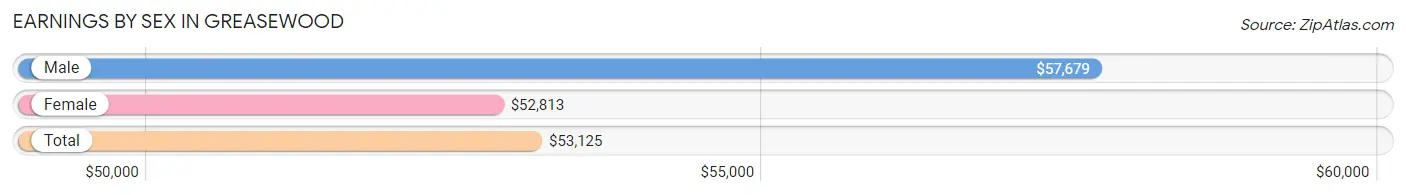
Earnings by Sex in Greasewood
Average Earnings in Greasewood are $53,125, $57,679 for men and $52,813 for women, a difference of 8.4%.
| Sex | Number | Average Earnings |
| Male | 29 (46.8%) | $57,679 |
| Female | 33 (53.2%) | $52,813 |
| Total | 62 (100.0%) | $53,125 |
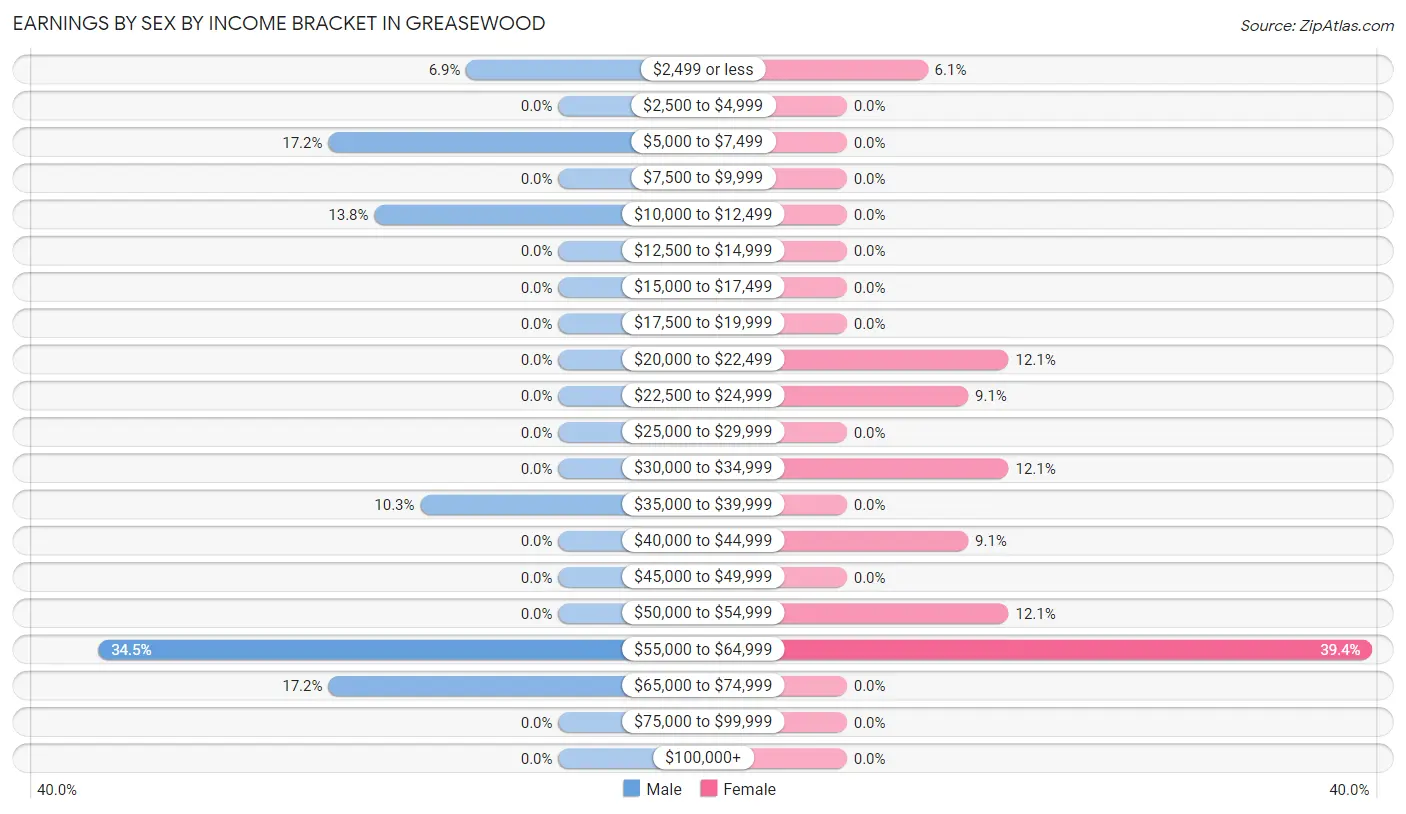
Earnings by Sex by Income Bracket in Greasewood
The most common earnings brackets in Greasewood are $55,000 to $64,999 for men (10 | 34.5%) and $55,000 to $64,999 for women (13 | 39.4%).
| Income | Male | Female |
| $2,499 or less | 2 (6.9%) | 2 (6.1%) |
| $2,500 to $4,999 | 0 (0.0%) | 0 (0.0%) |
| $5,000 to $7,499 | 5 (17.2%) | 0 (0.0%) |
| $7,500 to $9,999 | 0 (0.0%) | 0 (0.0%) |
| $10,000 to $12,499 | 4 (13.8%) | 0 (0.0%) |
| $12,500 to $14,999 | 0 (0.0%) | 0 (0.0%) |
| $15,000 to $17,499 | 0 (0.0%) | 0 (0.0%) |
| $17,500 to $19,999 | 0 (0.0%) | 0 (0.0%) |
| $20,000 to $22,499 | 0 (0.0%) | 4 (12.1%) |
| $22,500 to $24,999 | 0 (0.0%) | 3 (9.1%) |
| $25,000 to $29,999 | 0 (0.0%) | 0 (0.0%) |
| $30,000 to $34,999 | 0 (0.0%) | 4 (12.1%) |
| $35,000 to $39,999 | 3 (10.3%) | 0 (0.0%) |
| $40,000 to $44,999 | 0 (0.0%) | 3 (9.1%) |
| $45,000 to $49,999 | 0 (0.0%) | 0 (0.0%) |
| $50,000 to $54,999 | 0 (0.0%) | 4 (12.1%) |
| $55,000 to $64,999 | 10 (34.5%) | 13 (39.4%) |
| $65,000 to $74,999 | 5 (17.2%) | 0 (0.0%) |
| $75,000 to $99,999 | 0 (0.0%) | 0 (0.0%) |
| $100,000+ | 0 (0.0%) | 0 (0.0%) |
| Total | 29 (100.0%) | 33 (100.0%) |
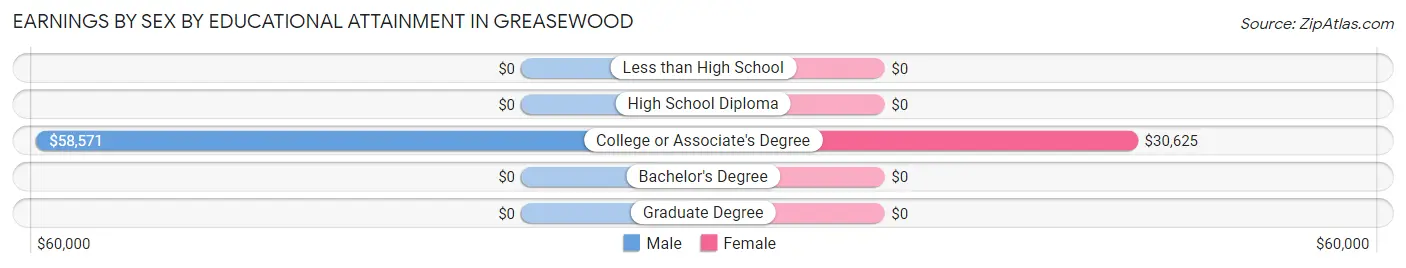
Earnings by Sex by Educational Attainment in Greasewood
Average earnings in Greasewood are $57,679 for men and $52,813 for women, a difference of 8.4%. Men with an educational attainment of college or associate's degree enjoy the highest average annual earnings of $58,571, while those with college or associate's degree education earn the least with $58,571. Women with an educational attainment of college or associate's degree earn the most with the average annual earnings of $30,625, while those with college or associate's degree education have the smallest earnings of $30,625.
| Educational Attainment | Male Income | Female Income |
| Less than High School | - | - |
| High School Diploma | - | - |
| College or Associate's Degree | $58,571 | $30,625 |
| Bachelor's Degree | - | - |
| Graduate Degree | - | - |
| Total | $57,679 | $52,813 |
Family Income in Greasewood
Family Income Brackets in Greasewood
According to the Greasewood family income data, there are 22 families falling into the $15,000 to $24,999 income range, which is the most common income bracket and makes up 31.4% of all families.
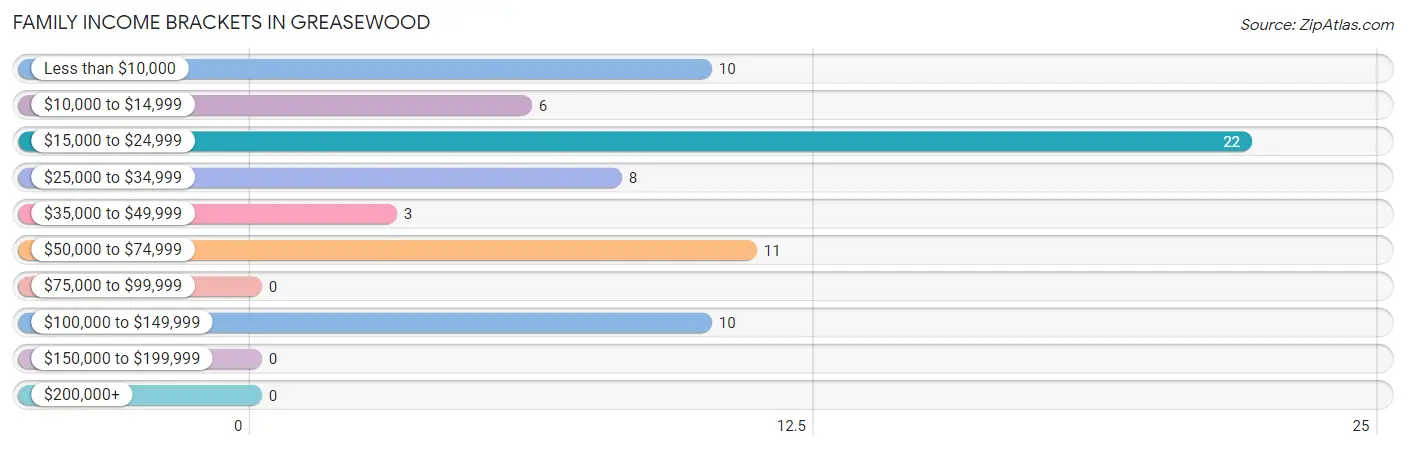
| Income Bracket | # Families | % Families |
| Less than $10,000 | 10 | 14.3% |
| $10,000 to $14,999 | 6 | 8.6% |
| $15,000 to $24,999 | 22 | 31.4% |
| $25,000 to $34,999 | 8 | 11.4% |
| $35,000 to $49,999 | 3 | 4.3% |
| $50,000 to $74,999 | 11 | 15.7% |
| $75,000 to $99,999 | 0 | 0.0% |
| $100,000 to $149,999 | 10 | 14.3% |
| $150,000 to $199,999 | 0 | 0.0% |
| $200,000+ | 0 | 0.0% |
Family Income by Famaliy Size in Greasewood
2-person families (23 | 32.9%) account for the highest median family income in Greasewood with $23,750 per family, while 2-person families (23 | 32.9%) have the highest median income of $11,875 per family member.
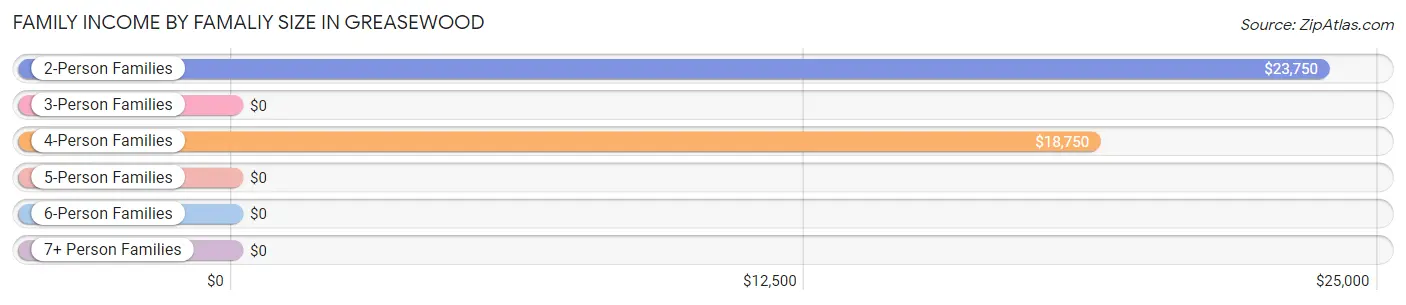
| Income Bracket | # Families | Median Income |
| 2-Person Families | 23 (32.9%) | $23,750 |
| 3-Person Families | 22 (31.4%) | $0 |
| 4-Person Families | 16 (22.9%) | $18,750 |
| 5-Person Families | 5 (7.1%) | $0 |
| 6-Person Families | 0 (0.0%) | $0 |
| 7+ Person Families | 4 (5.7%) | $0 |
| Total | 70 (100.0%) | $23,750 |
Family Income by Number of Earners in Greasewood
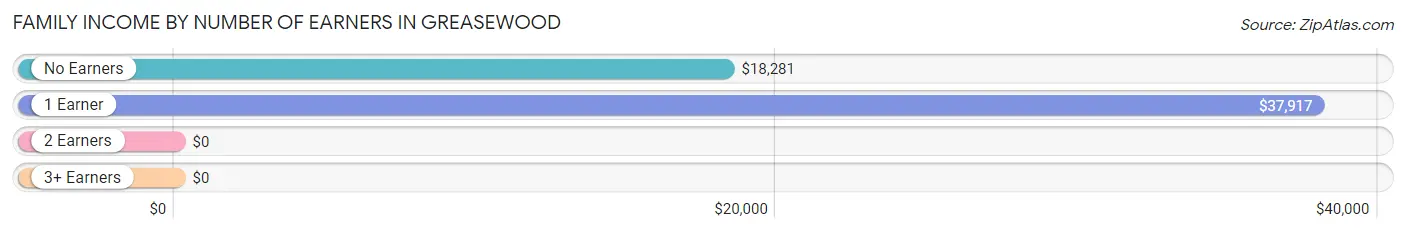
| Number of Earners | # Families | Median Income |
| No Earners | 33 (47.1%) | $18,281 |
| 1 Earner | 27 (38.6%) | $37,917 |
| 2 Earners | 7 (10.0%) | $0 |
| 3+ Earners | 3 (4.3%) | $0 |
| Total | 70 (100.0%) | $23,750 |
Household Income in Greasewood
Household Income Brackets in Greasewood
With 22 households falling in the category, the $15,000 to $24,999 income range is the most frequent in Greasewood, accounting for 22.2% of all households.
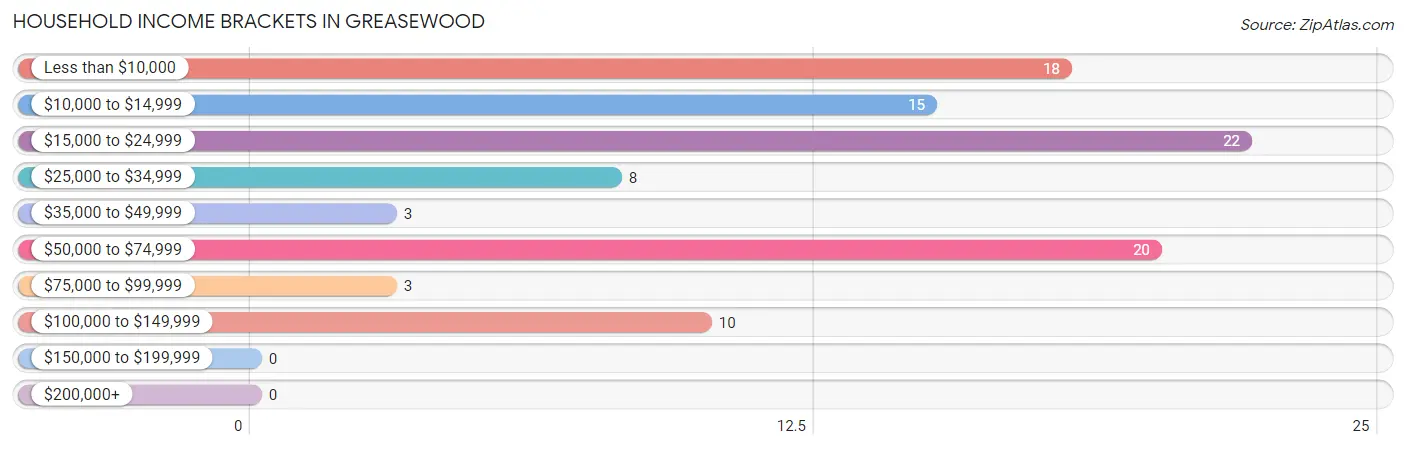
| Income Bracket | # Households | % Households |
| Less than $10,000 | 18 | 18.2% |
| $10,000 to $14,999 | 15 | 15.2% |
| $15,000 to $24,999 | 22 | 22.2% |
| $25,000 to $34,999 | 8 | 8.1% |
| $35,000 to $49,999 | 3 | 3.0% |
| $50,000 to $74,999 | 20 | 20.2% |
| $75,000 to $99,999 | 3 | 3.0% |
| $100,000 to $149,999 | 10 | 10.1% |
| $150,000 to $199,999 | 0 | 0.0% |
| $200,000+ | 0 | 0.0% |
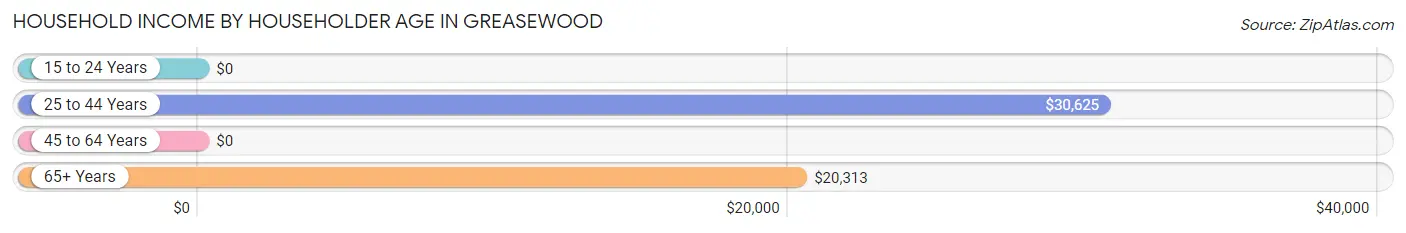
Household Income by Householder Age in Greasewood
The median household income in Greasewood is $22,708, with the highest median household income of $30,625 found in the 25 to 44 years age bracket for the primary householder. A total of 26 households (26.3%) fall into this category.
| Income Bracket | # Households | Median Income |
| 15 to 24 Years | 0 (0.0%) | $0 |
| 25 to 44 Years | 26 (26.3%) | $30,625 |
| 45 to 64 Years | 36 (36.4%) | $0 |
| 65+ Years | 37 (37.4%) | $20,313 |
| Total | 99 (100.0%) | $22,708 |
Poverty in Greasewood
Income Below Poverty by Sex and Age in Greasewood
With 45.5% poverty level for males and 53.1% for females among the residents of Greasewood, 18 to 24 year old males and 5 year old females are the most vulnerable to poverty, with 9 males (100.0%) and 4 females (100.0%) in their respective age groups living below the poverty level.
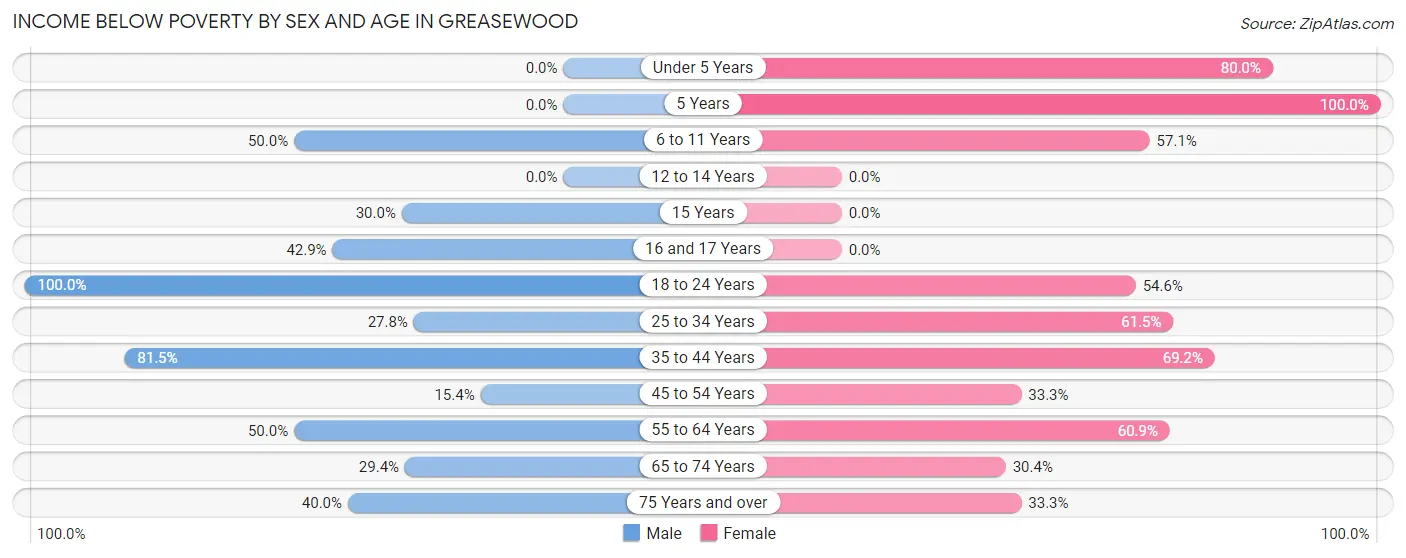
| Age Bracket | Male | Female |
| Under 5 Years | 0 (0.0%) | 12 (80.0%) |
| 5 Years | 0 (0.0%) | 4 (100.0%) |
| 6 to 11 Years | 3 (50.0%) | 4 (57.1%) |
| 12 to 14 Years | 0 (0.0%) | 0 (0.0%) |
| 15 Years | 3 (30.0%) | 0 (0.0%) |
| 16 and 17 Years | 3 (42.9%) | 0 (0.0%) |
| 18 to 24 Years | 9 (100.0%) | 12 (54.5%) |
| 25 to 34 Years | 5 (27.8%) | 8 (61.5%) |
| 35 to 44 Years | 22 (81.5%) | 9 (69.2%) |
| 45 to 54 Years | 2 (15.4%) | 4 (33.3%) |
| 55 to 64 Years | 7 (50.0%) | 14 (60.9%) |
| 65 to 74 Years | 5 (29.4%) | 7 (30.4%) |
| 75 Years and over | 2 (40.0%) | 4 (33.3%) |
| Total | 61 (45.5%) | 78 (53.1%) |
Income Above Poverty by Sex and Age in Greasewood
According to the poverty statistics in Greasewood, males aged 5 years and females aged 12 to 14 years are the age groups that are most secure financially, with 100.0% of males and 100.0% of females in these age groups living above the poverty line.
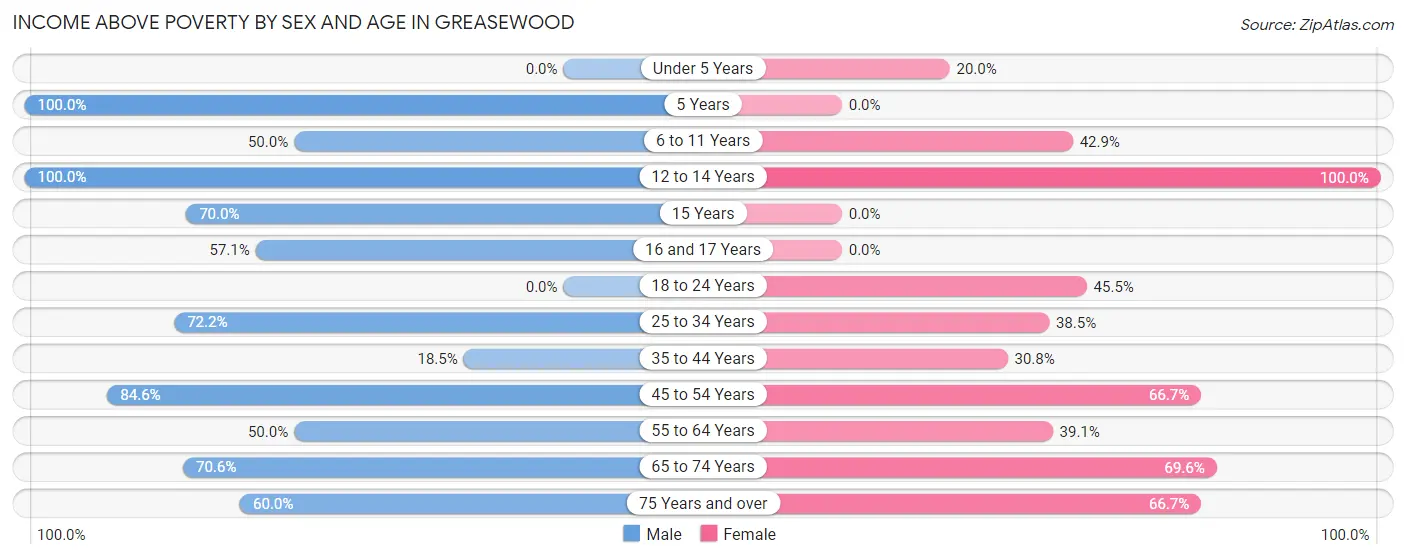
| Age Bracket | Male | Female |
| Under 5 Years | 0 (0.0%) | 3 (20.0%) |
| 5 Years | 4 (100.0%) | 0 (0.0%) |
| 6 to 11 Years | 3 (50.0%) | 3 (42.9%) |
| 12 to 14 Years | 4 (100.0%) | 3 (100.0%) |
| 15 Years | 7 (70.0%) | 0 (0.0%) |
| 16 and 17 Years | 4 (57.1%) | 0 (0.0%) |
| 18 to 24 Years | 0 (0.0%) | 10 (45.5%) |
| 25 to 34 Years | 13 (72.2%) | 5 (38.5%) |
| 35 to 44 Years | 5 (18.5%) | 4 (30.8%) |
| 45 to 54 Years | 11 (84.6%) | 8 (66.7%) |
| 55 to 64 Years | 7 (50.0%) | 9 (39.1%) |
| 65 to 74 Years | 12 (70.6%) | 16 (69.6%) |
| 75 Years and over | 3 (60.0%) | 8 (66.7%) |
| Total | 73 (54.5%) | 69 (46.9%) |
Income Below Poverty Among Married-Couple Families in Greasewood
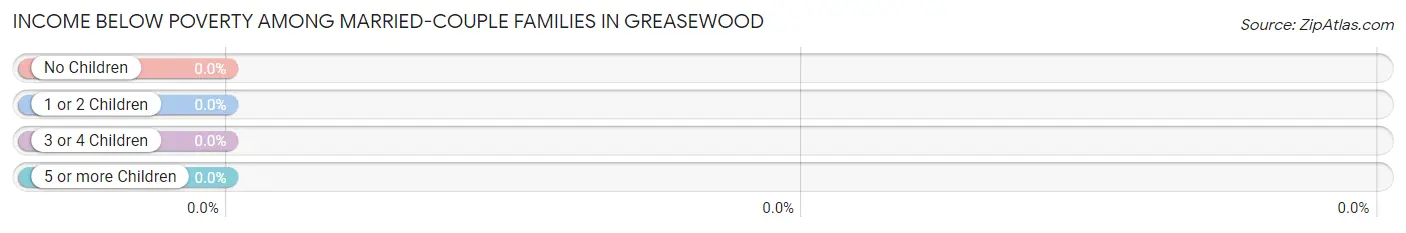
| Children | Above Poverty | Below Poverty |
| No Children | 13 (100.0%) | 0 (0.0%) |
| 1 or 2 Children | 0 (0.0%) | 0 (0.0%) |
| 3 or 4 Children | 9 (100.0%) | 0 (0.0%) |
| 5 or more Children | 0 (0.0%) | 0 (0.0%) |
| Total | 22 (100.0%) | 0 (0.0%) |
Income Below Poverty Among Single-Parent Households in Greasewood
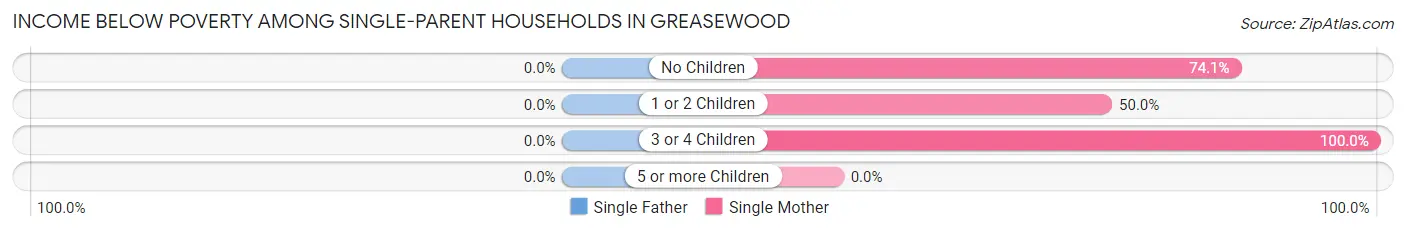
| Children | Single Father | Single Mother |
| No Children | 0 (0.0%) | 20 (74.1%) |
| 1 or 2 Children | 0 (0.0%) | 7 (50.0%) |
| 3 or 4 Children | 0 (0.0%) | 4 (100.0%) |
| 5 or more Children | 0 (0.0%) | 0 (0.0%) |
| Total | 0 (0.0%) | 31 (68.9%) |
Income Below Poverty Among Married-Couple vs Single-Parent Households in Greasewood
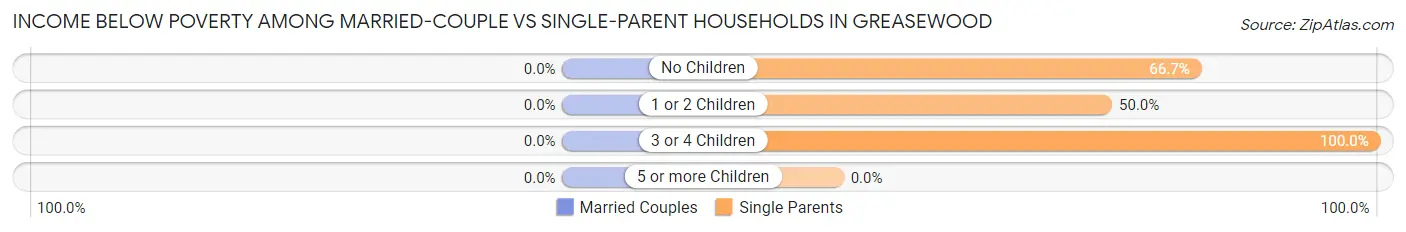
| Children | Married-Couple Families | Single-Parent Households |
| No Children | 0 (0.0%) | 20 (66.7%) |
| 1 or 2 Children | 0 (0.0%) | 7 (50.0%) |
| 3 or 4 Children | 0 (0.0%) | 4 (100.0%) |
| 5 or more Children | 0 (0.0%) | 0 (0.0%) |
| Total | 0 (0.0%) | 31 (64.6%) |
Race in Greasewood
The most populous races in Greasewood are Native / Alaskan (279 | 99.3%), Hispanic or Latino (12 | 4.3%), and White / Caucasian (2 | 0.7%).
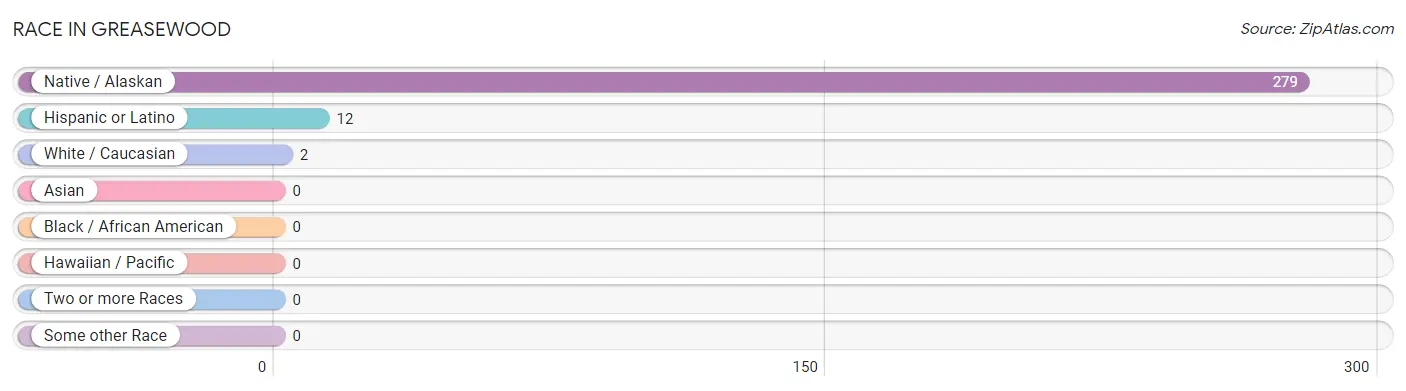
| Race | # Population | % Population |
| Asian | 0 | 0.0% |
| Black / African American | 0 | 0.0% |
| Hawaiian / Pacific | 0 | 0.0% |
| Hispanic or Latino | 12 | 4.3% |
| Native / Alaskan | 279 | 99.3% |
| White / Caucasian | 2 | 0.7% |
| Two or more Races | 0 | 0.0% |
| Some other Race | 0 | 0.0% |
| Total | 281 | 100.0% |
Ancestry in Greasewood
The most populous ancestries reported in Greasewood are , and Navajo (279 | 99.3%), together accounting for 99.3% of all Greasewood residents.

| Ancestry | # Population | % Population |
| Navajo | 279 | 99.3% | View All 1 Rows |
Immigrants in Greasewood

| Immigration Origin | # Population | % Population | View All 0 Rows |
Sex and Age in Greasewood
Sex and Age in Greasewood
The most populous age groups in Greasewood are 40 to 44 Years (27 | 20.2%) for men and 55 to 59 Years (20 | 13.6%) for women.
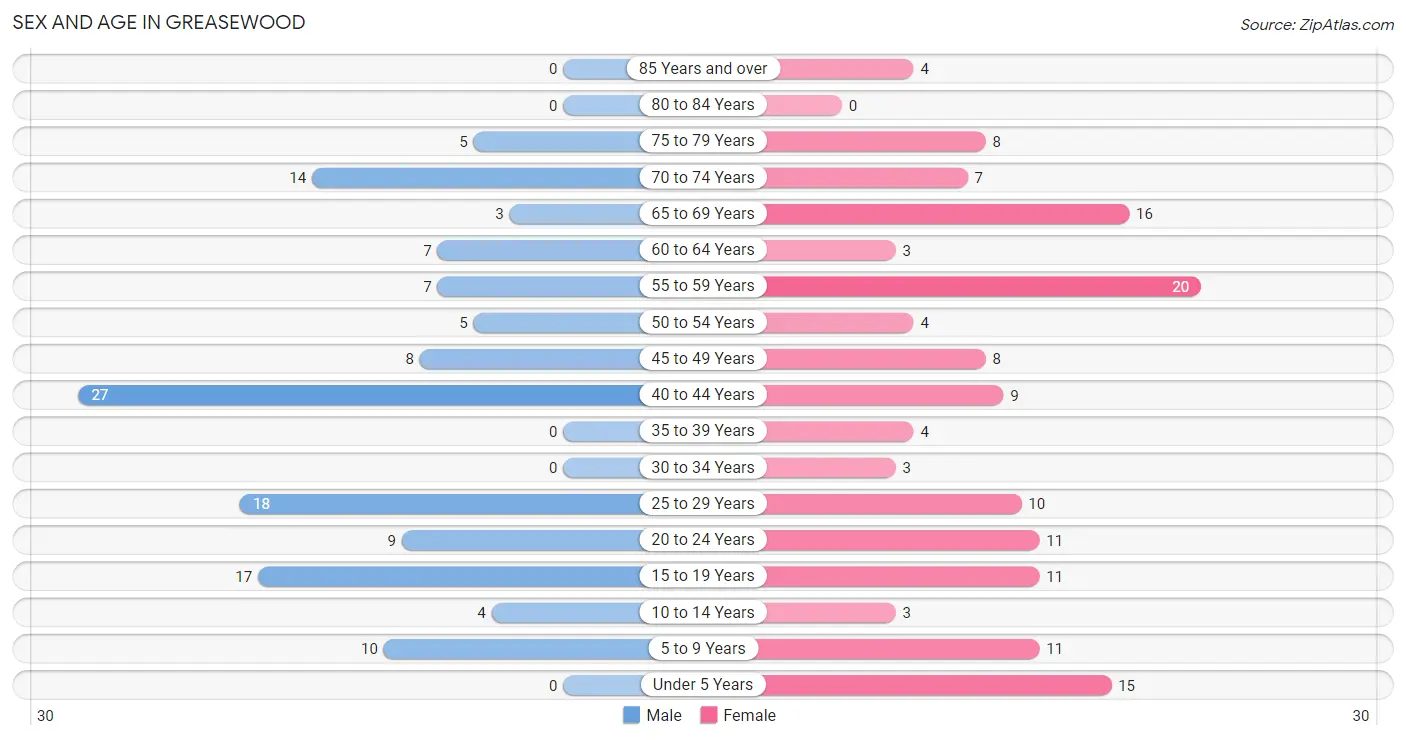
| Age Bracket | Male | Female |
| Under 5 Years | 0 (0.0%) | 15 (10.2%) |
| 5 to 9 Years | 10 (7.5%) | 11 (7.5%) |
| 10 to 14 Years | 4 (3.0%) | 3 (2.0%) |
| 15 to 19 Years | 17 (12.7%) | 11 (7.5%) |
| 20 to 24 Years | 9 (6.7%) | 11 (7.5%) |
| 25 to 29 Years | 18 (13.4%) | 10 (6.8%) |
| 30 to 34 Years | 0 (0.0%) | 3 (2.0%) |
| 35 to 39 Years | 0 (0.0%) | 4 (2.7%) |
| 40 to 44 Years | 27 (20.2%) | 9 (6.1%) |
| 45 to 49 Years | 8 (6.0%) | 8 (5.4%) |
| 50 to 54 Years | 5 (3.7%) | 4 (2.7%) |
| 55 to 59 Years | 7 (5.2%) | 20 (13.6%) |
| 60 to 64 Years | 7 (5.2%) | 3 (2.0%) |
| 65 to 69 Years | 3 (2.2%) | 16 (10.9%) |
| 70 to 74 Years | 14 (10.4%) | 7 (4.8%) |
| 75 to 79 Years | 5 (3.7%) | 8 (5.4%) |
| 80 to 84 Years | 0 (0.0%) | 0 (0.0%) |
| 85 Years and over | 0 (0.0%) | 4 (2.7%) |
| Total | 134 (100.0%) | 147 (100.0%) |
Families and Households in Greasewood
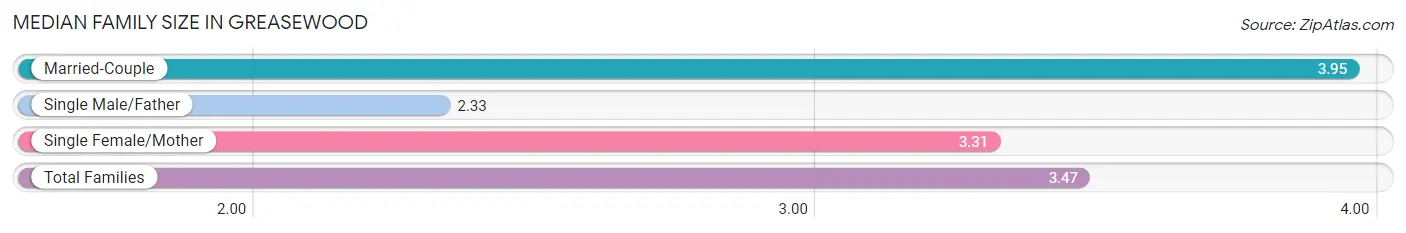
Median Family Size in Greasewood
The median family size in Greasewood is 3.47 persons per family, with married-couple families (22 | 31.4%) accounting for the largest median family size of 3.95 persons per family. On the other hand, single male/father families (3 | 4.3%) represent the smallest median family size with 2.33 persons per family.
| Family Type | # Families | Family Size |
| Married-Couple | 22 (31.4%) | 3.95 |
| Single Male/Father | 3 (4.3%) | 2.33 |
| Single Female/Mother | 45 (64.3%) | 3.31 |
| Total Families | 70 (100.0%) | 3.47 |
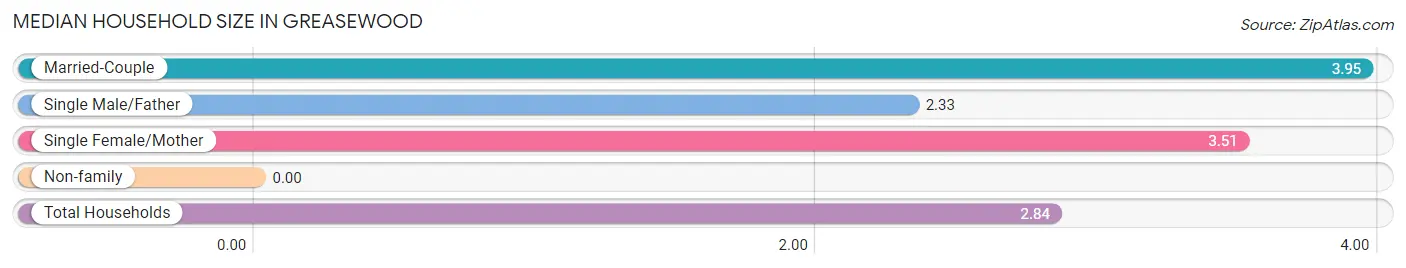
Median Household Size in Greasewood
| Household Type | # Households | Household Size |
| Married-Couple | 22 (22.2%) | 3.95 |
| Single Male/Father | 3 (3.0%) | 2.33 |
| Single Female/Mother | 45 (45.5%) | 3.51 |
| Non-family | 29 (29.3%) | - |
| Total Households | 99 (100.0%) | 2.84 |
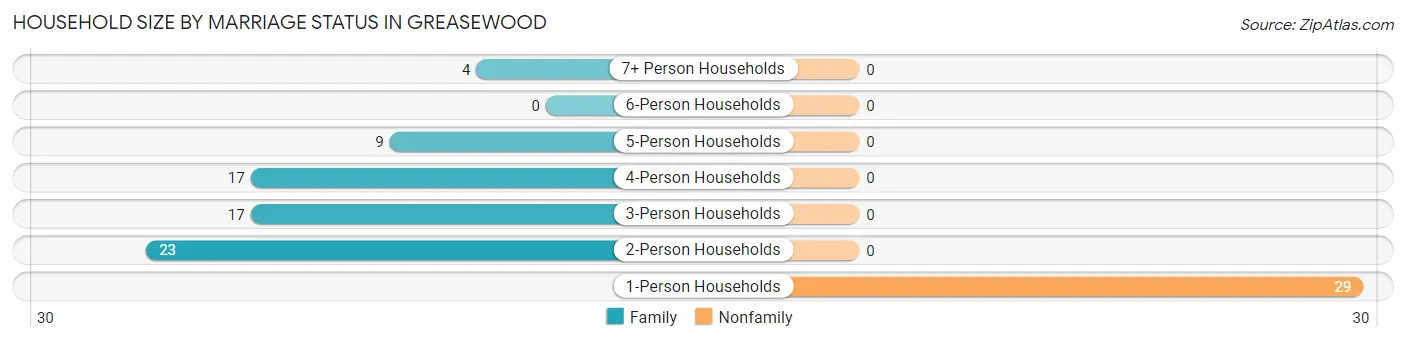
Household Size by Marriage Status in Greasewood
Out of a total of 99 households in Greasewood, 70 (70.7%) are family households, while 29 (29.3%) are nonfamily households. The most numerous type of family households are 2-person households, comprising 23, and the most common type of nonfamily households are 1-person households, comprising 29.
| Household Size | Family Households | Nonfamily Households |
| 1-Person Households | - | 29 (29.3%) |
| 2-Person Households | 23 (23.2%) | 0 (0.0%) |
| 3-Person Households | 17 (17.2%) | 0 (0.0%) |
| 4-Person Households | 17 (17.2%) | 0 (0.0%) |
| 5-Person Households | 9 (9.1%) | 0 (0.0%) |
| 6-Person Households | 0 (0.0%) | 0 (0.0%) |
| 7+ Person Households | 4 (4.0%) | 0 (0.0%) |
| Total | 70 (70.7%) | 29 (29.3%) |
Female Fertility in Greasewood
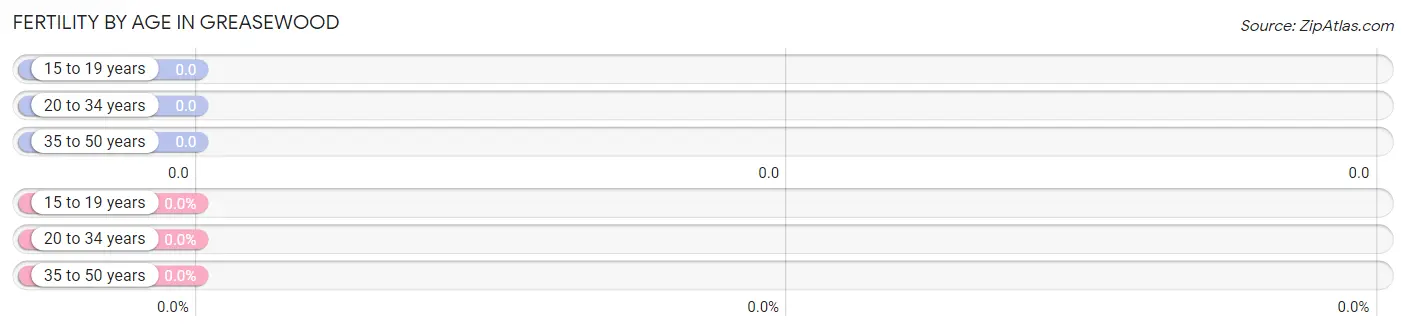
Fertility by Age in Greasewood
| Age Bracket | Women with Births | Births / 1,000 Women |
| 15 to 19 years | 0 (0.0%) | 0.0 |
| 20 to 34 years | 0 (0.0%) | 0.0 |
| 35 to 50 years | 0 (0.0%) | 0.0 |
| Total | 0 (0.0%) | 0.0 |
Fertility by Age by Marriage Status in Greasewood
| Age Bracket | Married | Unmarried |
| 15 to 19 years | 0 (0.0%) | 0 (0.0%) |
| 20 to 34 years | 0 (0.0%) | 0 (0.0%) |
| 35 to 50 years | 0 (0.0%) | 0 (0.0%) |
| Total | 0 (0.0%) | 0 (0.0%) |
Fertility by Education in Greasewood
| Educational Attainment | Women with Births | Births / 1,000 Women |
| Less than High School | 0 (0.0%) | 0.0 |
| High School Diploma | 0 (0.0%) | 0.0 |
| College or Associate's Degree | 0 (0.0%) | 0.0 |
| Bachelor's Degree | 0 (0.0%) | 0.0 |
| Graduate Degree | 0 (0.0%) | 0.0 |
| Total | 0 (0.0%) | 0.0 |
Fertility by Education by Marriage Status in Greasewood
| Educational Attainment | Married | Unmarried |
| Less than High School | 0 (0.0%) | 0 (0.0%) |
| High School Diploma | 0 (0.0%) | 0 (0.0%) |
| College or Associate's Degree | 0 (0.0%) | 0 (0.0%) |
| Bachelor's Degree | 0 (0.0%) | 0 (0.0%) |
| Graduate Degree | 0 (0.0%) | 0 (0.0%) |
| Total | 0 (0.0%) | 0 (0.0%) |
Employment Characteristics in Greasewood
Employment by Class of Employer in Greasewood
Among the 62 employed individuals in Greasewood, private company employees (20 | 32.3%), local government employees (19 | 30.6%), and federal government employees (17 | 27.4%) make up the most common classes of employment.
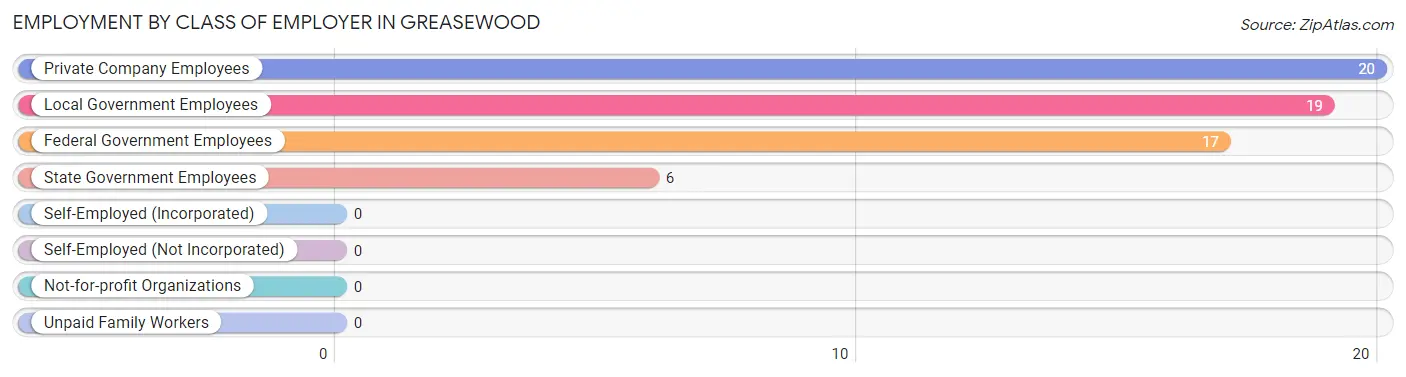
| Employer Class | # Employees | % Employees |
| Private Company Employees | 20 | 32.3% |
| Self-Employed (Incorporated) | 0 | 0.0% |
| Self-Employed (Not Incorporated) | 0 | 0.0% |
| Not-for-profit Organizations | 0 | 0.0% |
| Local Government Employees | 19 | 30.6% |
| State Government Employees | 6 | 9.7% |
| Federal Government Employees | 17 | 27.4% |
| Unpaid Family Workers | 0 | 0.0% |
| Total | 62 | 100.0% |
Employment Status by Age in Greasewood
According to the labor force statistics for Greasewood, out of the total population over 16 years of age (228), 34.2% or 78 individuals are in the labor force, with 20.5% or 16 of them unemployed. The age group with the highest labor force participation rate is 45 to 54 years, with 52.0% or 13 individuals in the labor force. Within the labor force, the 20 to 24 years age range has the highest percentage of unemployed individuals, with 100.0% or 6 of them being unemployed.
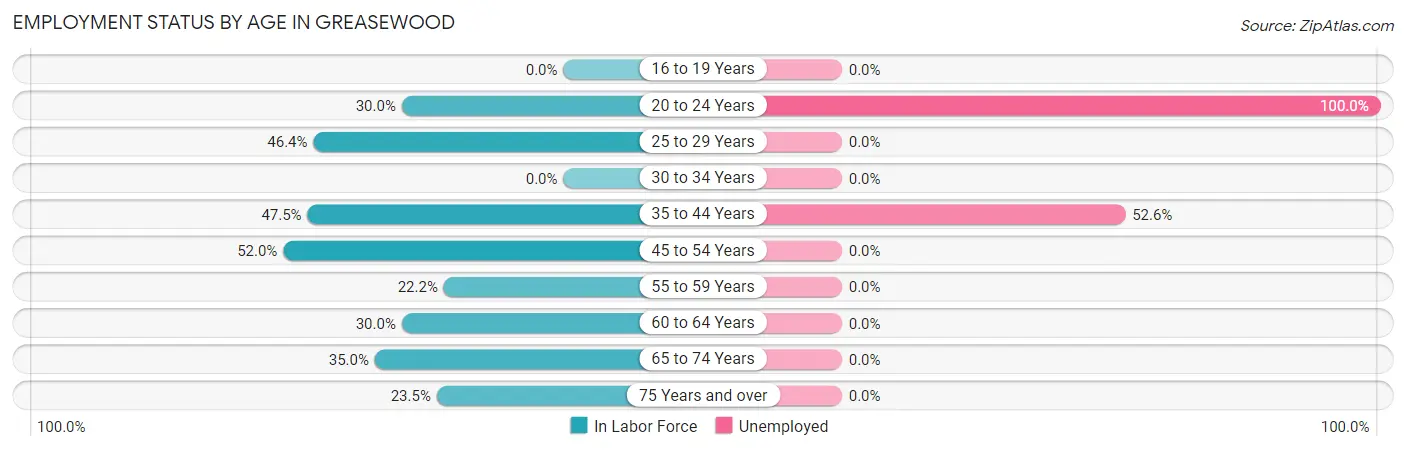
| Age Bracket | In Labor Force | Unemployed |
| 16 to 19 Years | 0 (0.0%) | 0 (0.0%) |
| 20 to 24 Years | 6 (30.0%) | 6 (100.0%) |
| 25 to 29 Years | 13 (46.4%) | 0 (0.0%) |
| 30 to 34 Years | 0 (0.0%) | 0 (0.0%) |
| 35 to 44 Years | 19 (47.5%) | 10 (52.6%) |
| 45 to 54 Years | 13 (52.0%) | 0 (0.0%) |
| 55 to 59 Years | 6 (22.2%) | 0 (0.0%) |
| 60 to 64 Years | 3 (30.0%) | 0 (0.0%) |
| 65 to 74 Years | 14 (35.0%) | 0 (0.0%) |
| 75 Years and over | 4 (23.5%) | 0 (0.0%) |
| Total | 78 (34.2%) | 16 (20.5%) |
Employment Status by Educational Attainment in Greasewood
According to labor force statistics for Greasewood, 40.6% of individuals (54) out of the total population between 25 and 64 years of age (133) are in the labor force, with 18.5% or 10 of them being unemployed. The group with the highest labor force participation rate are those with the educational attainment of bachelor's degree or higher, with 100.0% or 7 individuals in the labor force. Within the labor force, individuals with high school diploma education have the highest percentage of unemployment, with 31.3% or 5 of them being unemployed.
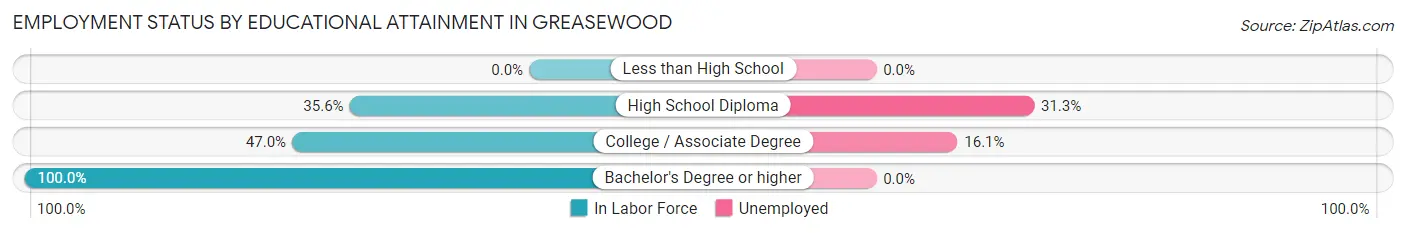
| Educational Attainment | In Labor Force | Unemployed |
| Less than High School | 0 (0.0%) | 0 (0.0%) |
| High School Diploma | 16 (35.6%) | 14 (31.3%) |
| College / Associate Degree | 31 (47.0%) | 11 (16.1%) |
| Bachelor's Degree or higher | 7 (100.0%) | 0 (0.0%) |
| Total | 54 (40.6%) | 25 (18.5%) |
Employment Occupations by Sex in Greasewood
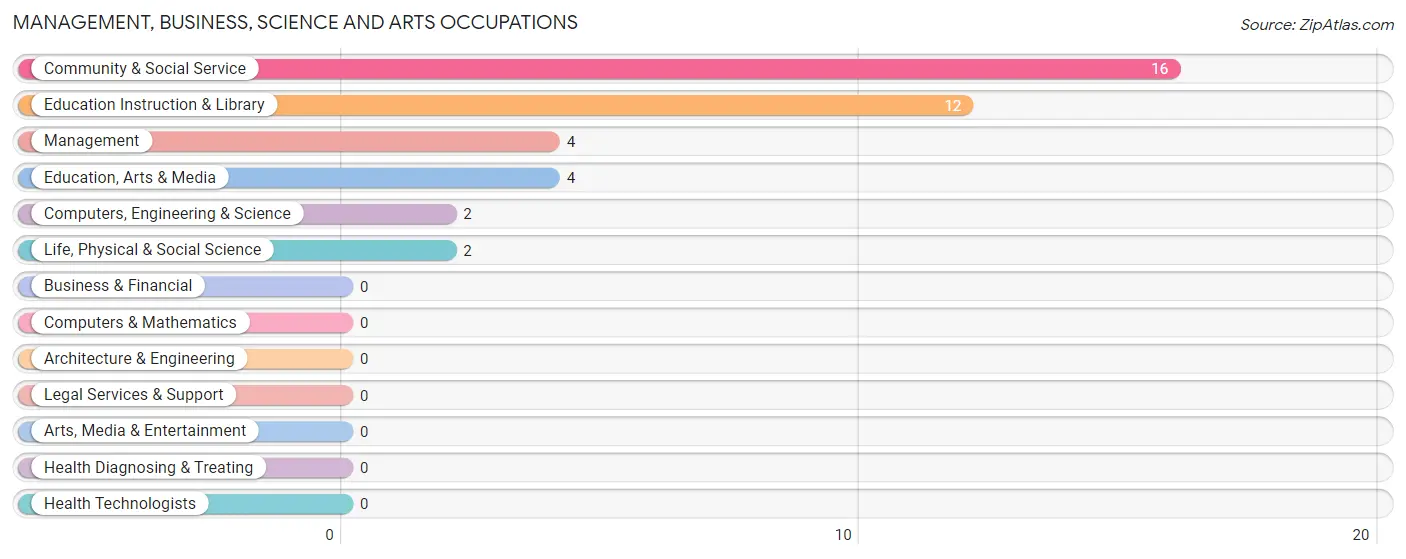
Management, Business, Science and Arts Occupations
The most common Management, Business, Science and Arts occupations in Greasewood are Community & Social Service (16 | 25.8%), Education Instruction & Library (12 | 19.4%), Management (4 | 6.5%), Education, Arts & Media (4 | 6.5%), and Computers, Engineering & Science (2 | 3.2%).
Management, Business, Science and Arts Occupations by Sex
Within the Management, Business, Science and Arts occupations in Greasewood, the most male-oriented occupations are Computers, Engineering & Science (100.0%), and Life, Physical & Social Science (100.0%), while the most female-oriented occupations are Management (100.0%), Community & Social Service (100.0%), and Education, Arts & Media (100.0%).
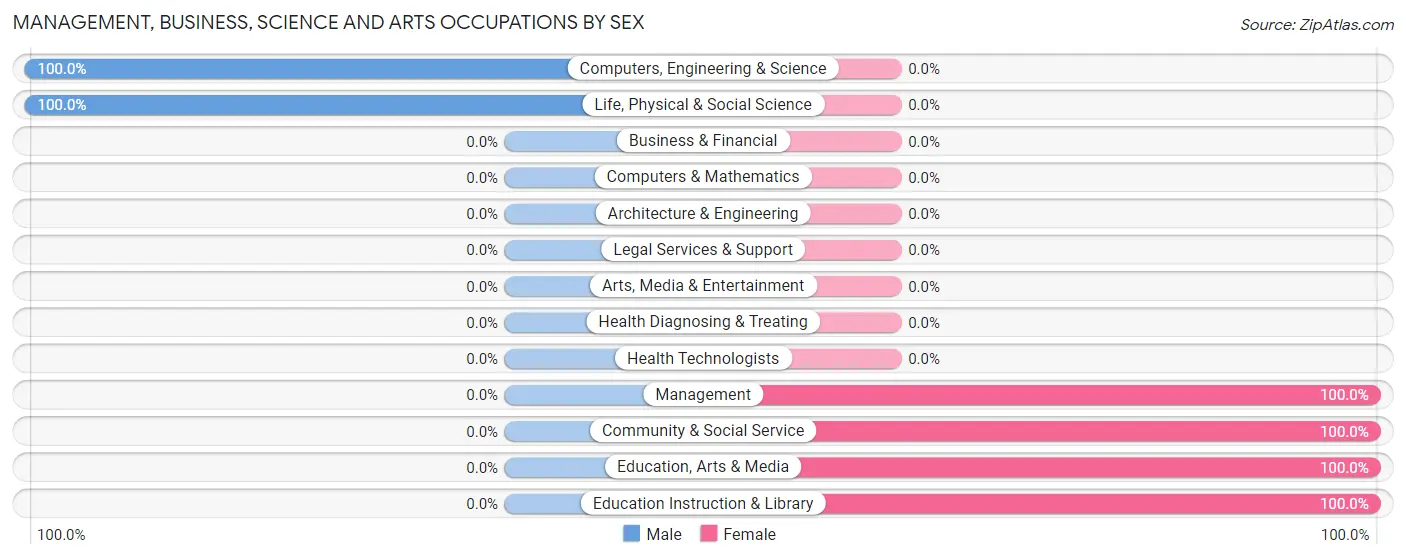
| Occupation | Male | Female |
| Management | 0 (0.0%) | 4 (100.0%) |
| Business & Financial | 0 (0.0%) | 0 (0.0%) |
| Computers, Engineering & Science | 2 (100.0%) | 0 (0.0%) |
| Computers & Mathematics | 0 (0.0%) | 0 (0.0%) |
| Architecture & Engineering | 0 (0.0%) | 0 (0.0%) |
| Life, Physical & Social Science | 2 (100.0%) | 0 (0.0%) |
| Community & Social Service | 0 (0.0%) | 16 (100.0%) |
| Education, Arts & Media | 0 (0.0%) | 4 (100.0%) |
| Legal Services & Support | 0 (0.0%) | 0 (0.0%) |
| Education Instruction & Library | 0 (0.0%) | 12 (100.0%) |
| Arts, Media & Entertainment | 0 (0.0%) | 0 (0.0%) |
| Health Diagnosing & Treating | 0 (0.0%) | 0 (0.0%) |
| Health Technologists | 0 (0.0%) | 0 (0.0%) |
| Total (Category) | 2 (9.1%) | 20 (90.9%) |
| Total (Overall) | 29 (46.8%) | 33 (53.2%) |
Services Occupations
The most common Services occupations in Greasewood are Cleaning & Maintenance (8 | 12.9%), Healthcare Support (7 | 11.3%), and Food Preparation & Serving (2 | 3.2%).
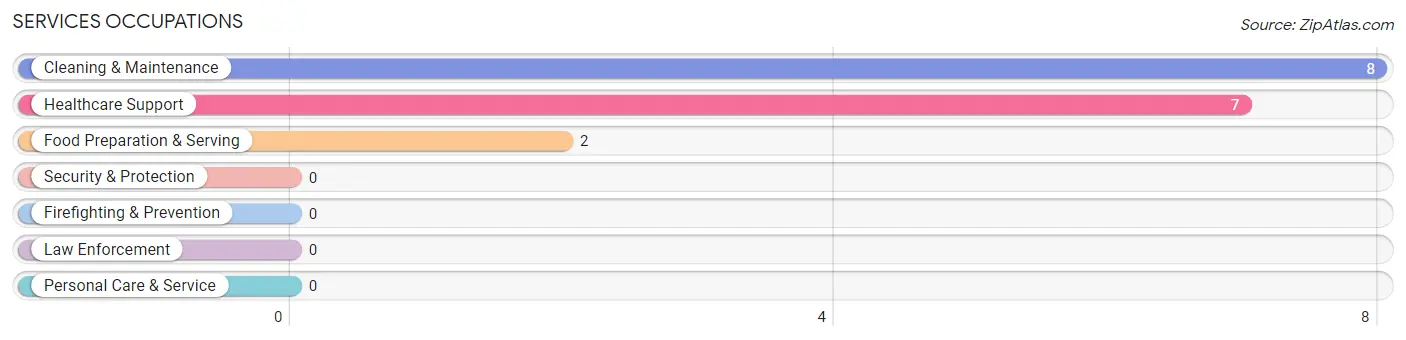
Services Occupations by Sex
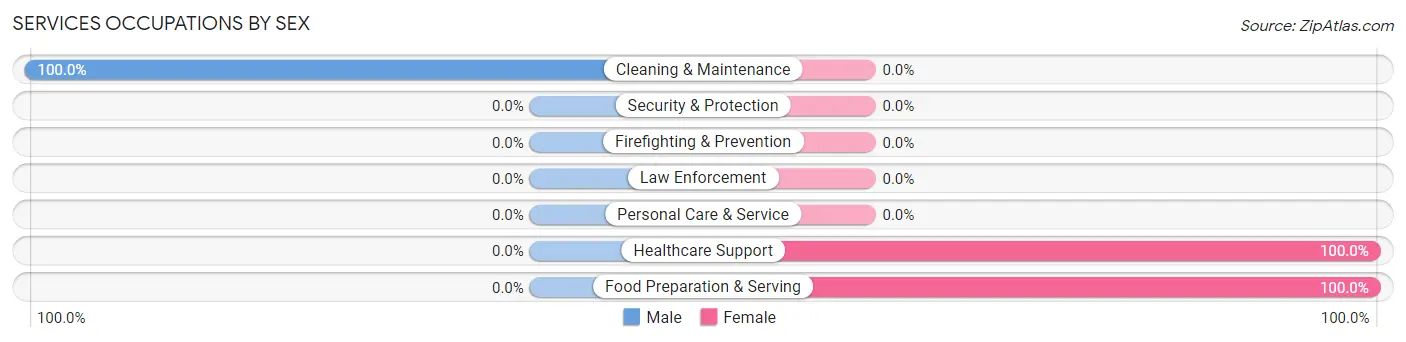
| Occupation | Male | Female |
| Healthcare Support | 0 (0.0%) | 7 (100.0%) |
| Security & Protection | 0 (0.0%) | 0 (0.0%) |
| Firefighting & Prevention | 0 (0.0%) | 0 (0.0%) |
| Law Enforcement | 0 (0.0%) | 0 (0.0%) |
| Food Preparation & Serving | 0 (0.0%) | 2 (100.0%) |
| Cleaning & Maintenance | 8 (100.0%) | 0 (0.0%) |
| Personal Care & Service | 0 (0.0%) | 0 (0.0%) |
| Total (Category) | 8 (47.1%) | 9 (52.9%) |
| Total (Overall) | 29 (46.8%) | 33 (53.2%) |
Sales and Office Occupations
The most common Sales and Office occupations in Greasewood are , and Office & Administration (4 | 6.5%).
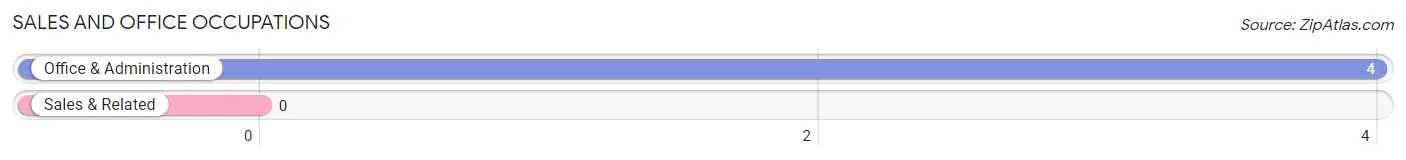
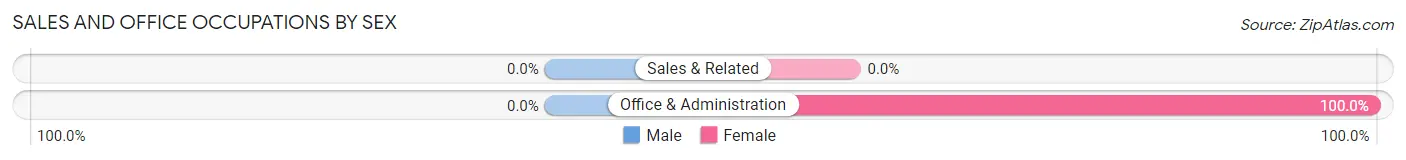
Sales and Office Occupations by Sex
| Occupation | Male | Female |
| Sales & Related | 0 (0.0%) | 0 (0.0%) |
| Office & Administration | 0 (0.0%) | 4 (100.0%) |
| Total (Category) | 0 (0.0%) | 4 (100.0%) |
| Total (Overall) | 29 (46.8%) | 33 (53.2%) |
Natural Resources, Construction and Maintenance Occupations
The most common Natural Resources, Construction and Maintenance occupations in Greasewood are , and Installation, Maintenance & Repair (8 | 12.9%).
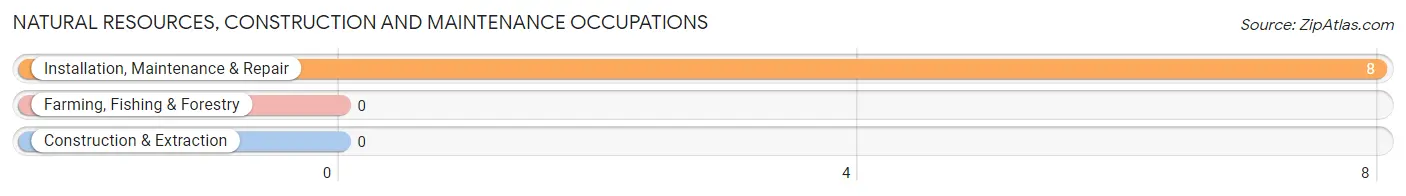
Natural Resources, Construction and Maintenance Occupations by Sex
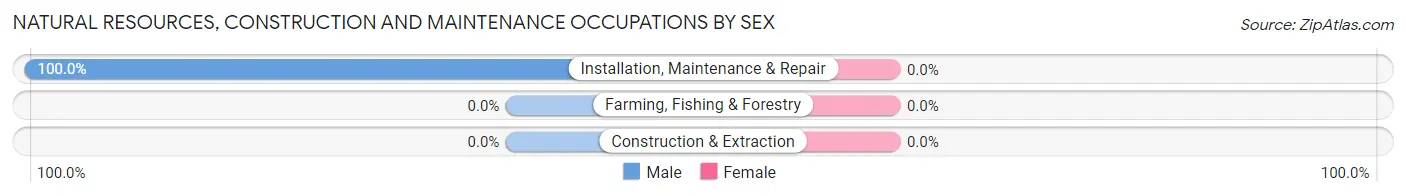
| Occupation | Male | Female |
| Farming, Fishing & Forestry | 0 (0.0%) | 0 (0.0%) |
| Construction & Extraction | 0 (0.0%) | 0 (0.0%) |
| Installation, Maintenance & Repair | 8 (100.0%) | 0 (0.0%) |
| Total (Category) | 8 (100.0%) | 0 (0.0%) |
| Total (Overall) | 29 (46.8%) | 33 (53.2%) |
Production, Transportation and Moving Occupations
The most common Production, Transportation and Moving occupations in Greasewood are Transportation (7 | 11.3%), and Production (4 | 6.5%).
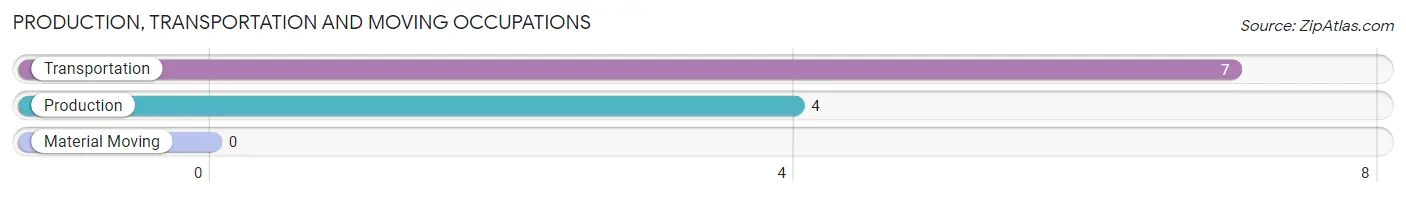
Production, Transportation and Moving Occupations by Sex
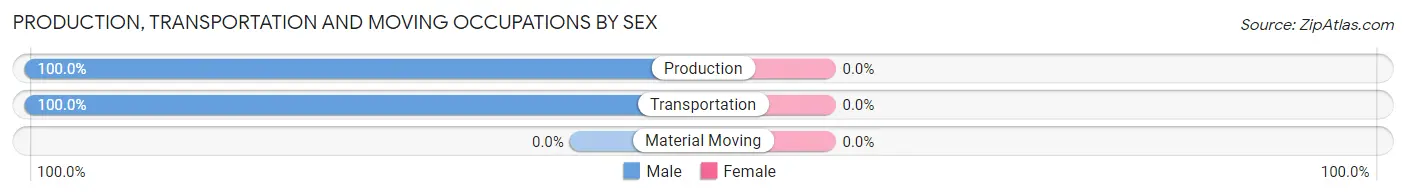
| Occupation | Male | Female |
| Production | 4 (100.0%) | 0 (0.0%) |
| Transportation | 7 (100.0%) | 0 (0.0%) |
| Material Moving | 0 (0.0%) | 0 (0.0%) |
| Total (Category) | 11 (100.0%) | 0 (0.0%) |
| Total (Overall) | 29 (46.8%) | 33 (53.2%) |
Employment Industries by Sex in Greasewood
Employment Industries in Greasewood
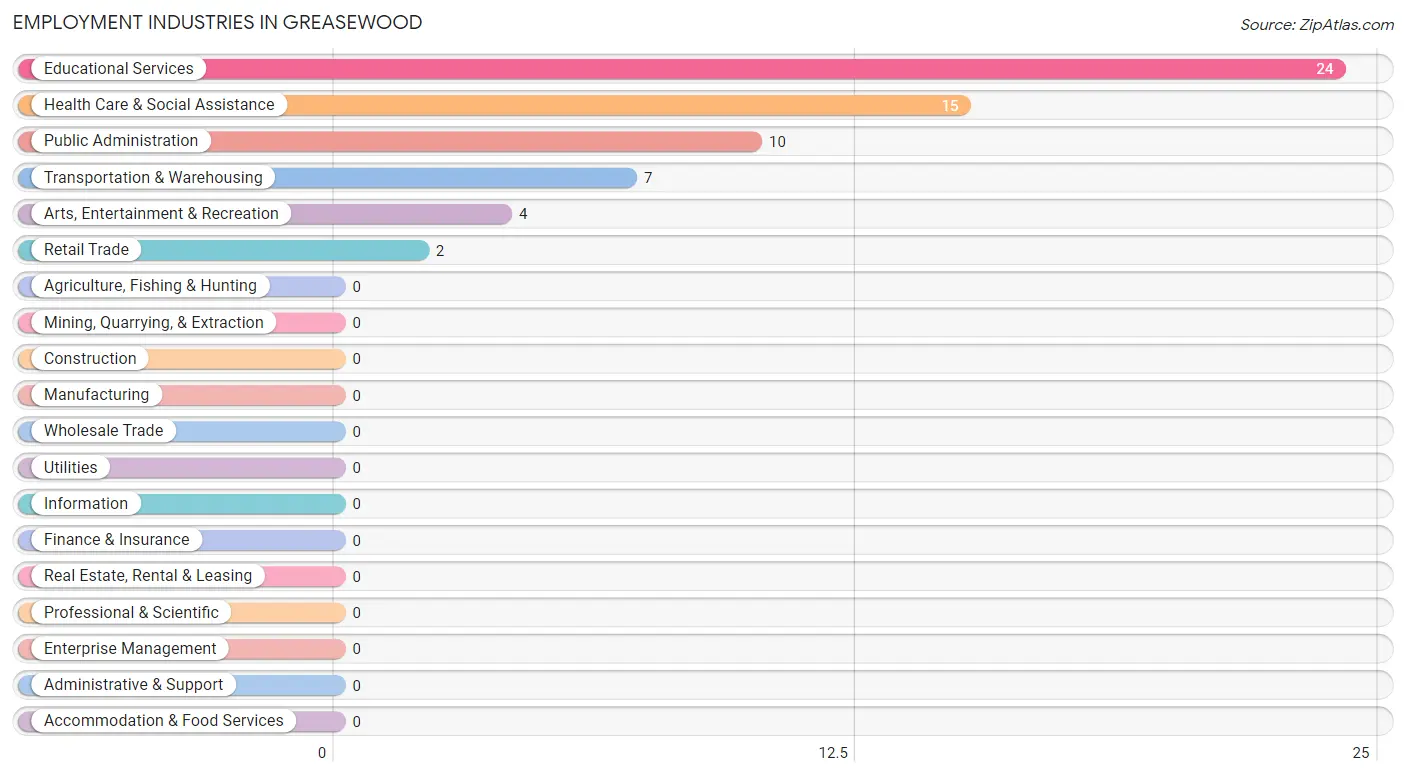
The major employment industries in Greasewood include Educational Services (24 | 38.7%), Health Care & Social Assistance (15 | 24.2%), Public Administration (10 | 16.1%), Transportation & Warehousing (7 | 11.3%), and Arts, Entertainment & Recreation (4 | 6.5%).
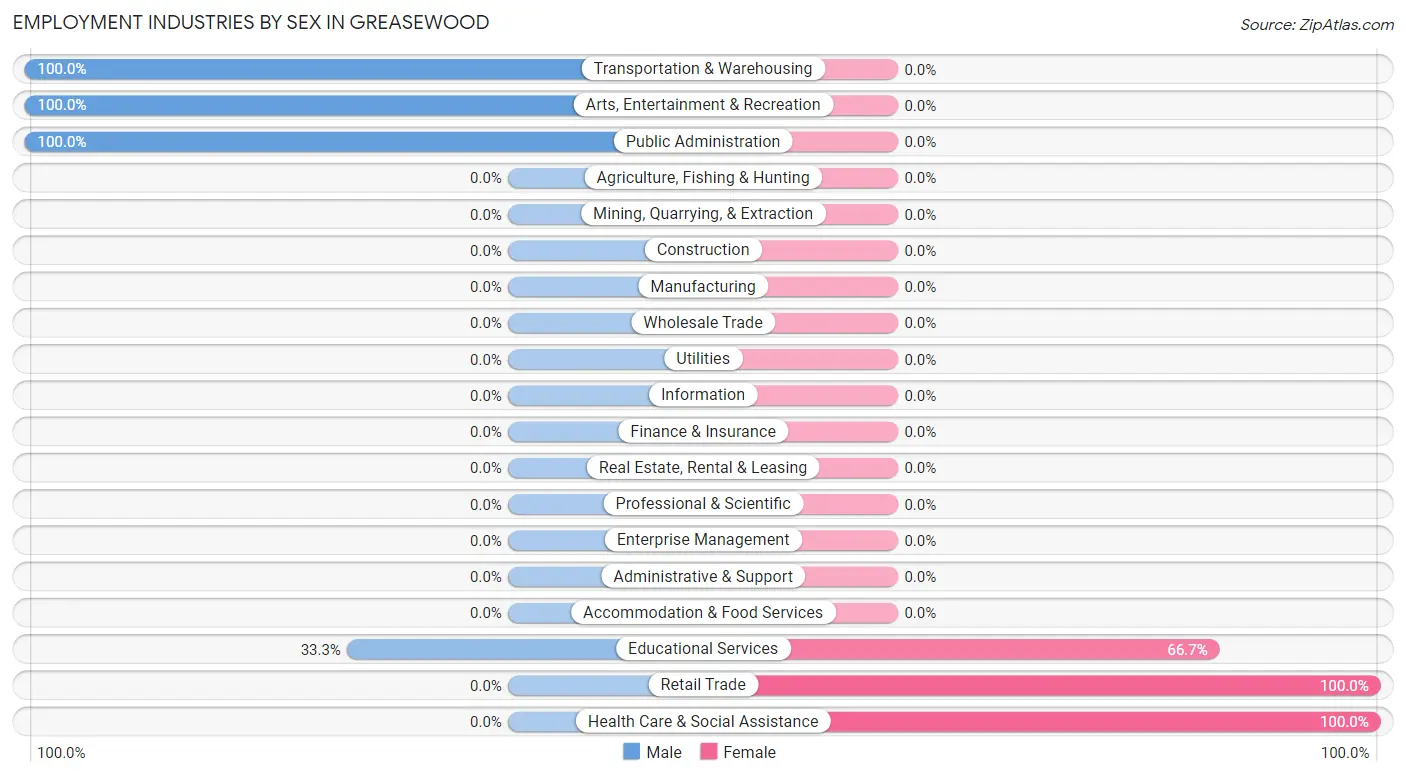
Employment Industries by Sex in Greasewood
The Greasewood industries that see more men than women are Transportation & Warehousing (100.0%), Arts, Entertainment & Recreation (100.0%), and Public Administration (100.0%), whereas the industries that tend to have a higher number of women are Retail Trade (100.0%), Health Care & Social Assistance (100.0%), and Educational Services (66.7%).
| Industry | Male | Female |
| Agriculture, Fishing & Hunting | 0 (0.0%) | 0 (0.0%) |
| Mining, Quarrying, & Extraction | 0 (0.0%) | 0 (0.0%) |
| Construction | 0 (0.0%) | 0 (0.0%) |
| Manufacturing | 0 (0.0%) | 0 (0.0%) |
| Wholesale Trade | 0 (0.0%) | 0 (0.0%) |
| Retail Trade | 0 (0.0%) | 2 (100.0%) |
| Transportation & Warehousing | 7 (100.0%) | 0 (0.0%) |
| Utilities | 0 (0.0%) | 0 (0.0%) |
| Information | 0 (0.0%) | 0 (0.0%) |
| Finance & Insurance | 0 (0.0%) | 0 (0.0%) |
| Real Estate, Rental & Leasing | 0 (0.0%) | 0 (0.0%) |
| Professional & Scientific | 0 (0.0%) | 0 (0.0%) |
| Enterprise Management | 0 (0.0%) | 0 (0.0%) |
| Administrative & Support | 0 (0.0%) | 0 (0.0%) |
| Educational Services | 8 (33.3%) | 16 (66.7%) |
| Health Care & Social Assistance | 0 (0.0%) | 15 (100.0%) |
| Arts, Entertainment & Recreation | 4 (100.0%) | 0 (0.0%) |
| Accommodation & Food Services | 0 (0.0%) | 0 (0.0%) |
| Public Administration | 10 (100.0%) | 0 (0.0%) |
| Total | 29 (46.8%) | 33 (53.2%) |
Education in Greasewood
School Enrollment in Greasewood
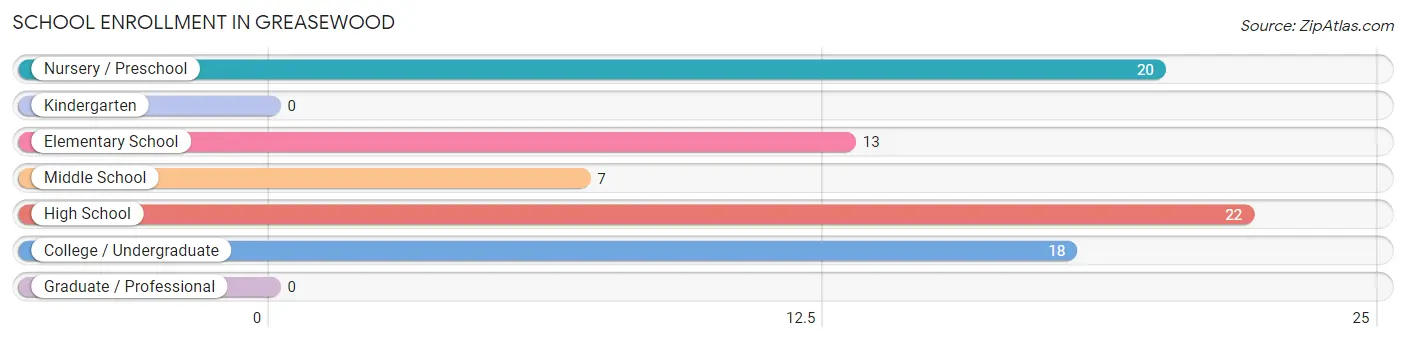
The most common levels of schooling among the 80 students in Greasewood are high school (22 | 27.5%), nursery / preschool (20 | 25.0%), and college / undergraduate (18 | 22.5%).
| School Level | # Students | % Students |
| Nursery / Preschool | 20 | 25.0% |
| Kindergarten | 0 | 0.0% |
| Elementary School | 13 | 16.3% |
| Middle School | 7 | 8.7% |
| High School | 22 | 27.5% |
| College / Undergraduate | 18 | 22.5% |
| Graduate / Professional | 0 | 0.0% |
| Total | 80 | 100.0% |
School Enrollment by Age by Funding Source in Greasewood
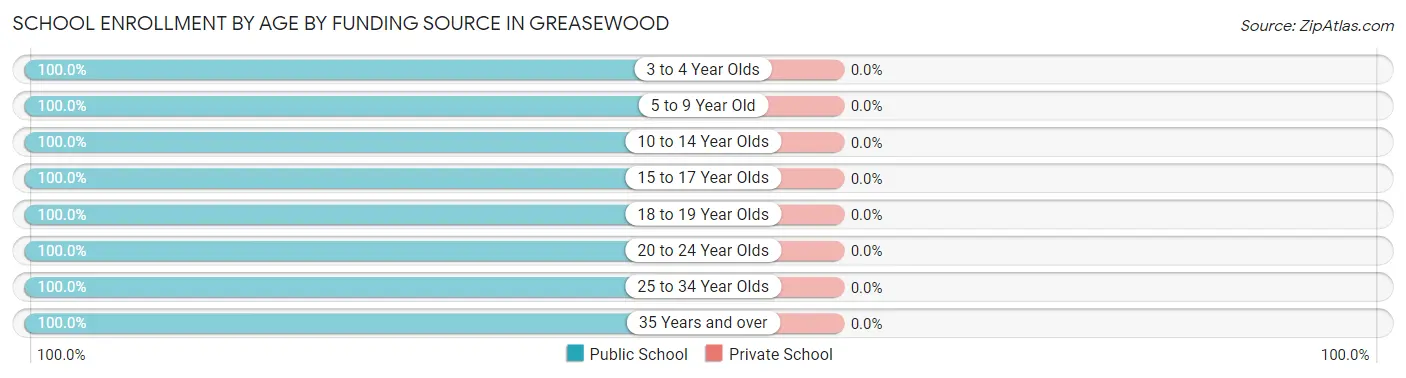
| Age Bracket | Public School | Private School |
| 3 to 4 Year Olds | 12 (100.0%) | 0 (0.0%) |
| 5 to 9 Year Old | 21 (100.0%) | 0 (0.0%) |
| 10 to 14 Year Olds | 7 (100.0%) | 0 (0.0%) |
| 15 to 17 Year Olds | 17 (100.0%) | 0 (0.0%) |
| 18 to 19 Year Olds | 5 (100.0%) | 0 (0.0%) |
| 20 to 24 Year Olds | 10 (100.0%) | 0 (0.0%) |
| 25 to 34 Year Olds | 4 (100.0%) | 0 (0.0%) |
| 35 Years and over | 4 (100.0%) | 0 (0.0%) |
| Total | 80 (100.0%) | 0 (0.0%) |
Educational Attainment by Field of Study in Greasewood
Education (9 | 52.9%), psychology (4 | 23.5%), and arts & humanities (4 | 23.5%) are the most common fields of study among 17 individuals in Greasewood who have obtained a bachelor's degree or higher.
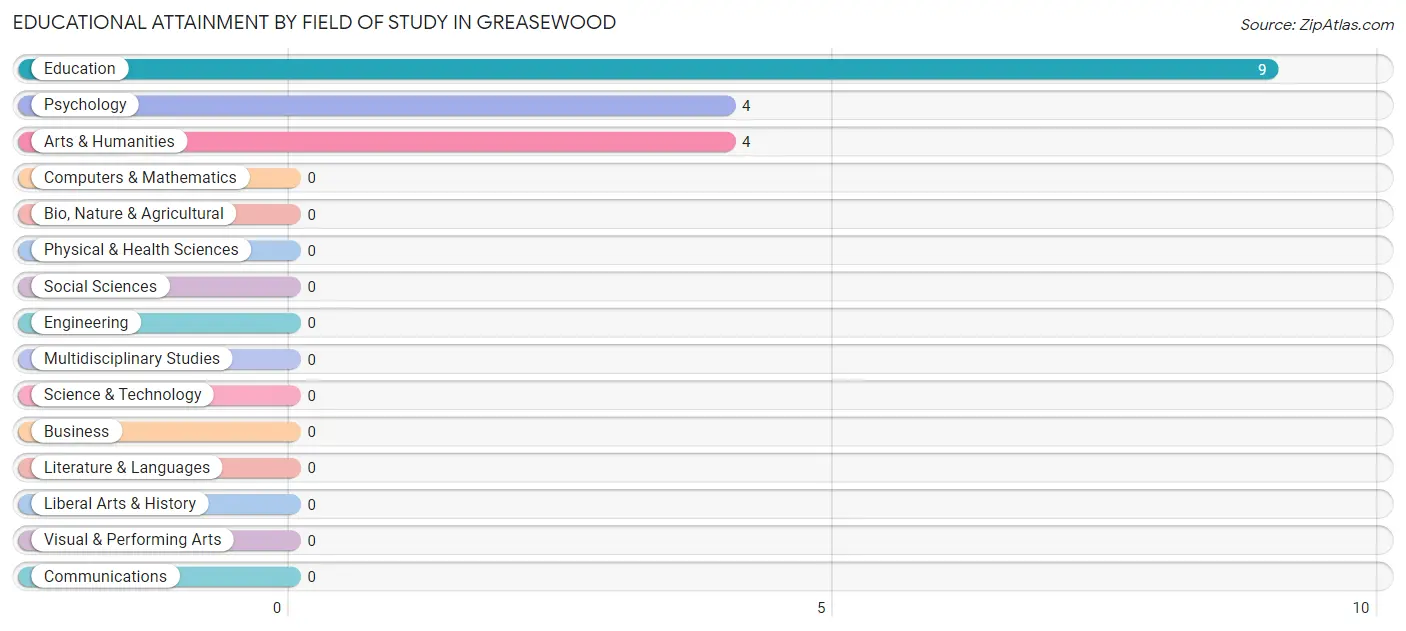
| Field of Study | # Graduates | % Graduates |
| Computers & Mathematics | 0 | 0.0% |
| Bio, Nature & Agricultural | 0 | 0.0% |
| Physical & Health Sciences | 0 | 0.0% |
| Psychology | 4 | 23.5% |
| Social Sciences | 0 | 0.0% |
| Engineering | 0 | 0.0% |
| Multidisciplinary Studies | 0 | 0.0% |
| Science & Technology | 0 | 0.0% |
| Business | 0 | 0.0% |
| Education | 9 | 52.9% |
| Literature & Languages | 0 | 0.0% |
| Liberal Arts & History | 0 | 0.0% |
| Visual & Performing Arts | 0 | 0.0% |
| Communications | 0 | 0.0% |
| Arts & Humanities | 4 | 23.5% |
| Total | 17 | 100.0% |
Transportation & Commute in Greasewood
Vehicle Availability by Sex in Greasewood
The most prevalent vehicle ownership categories in Greasewood are males with 1 vehicle (12, accounting for 41.4%) and females with 1 vehicle (12, making up 36.4%).
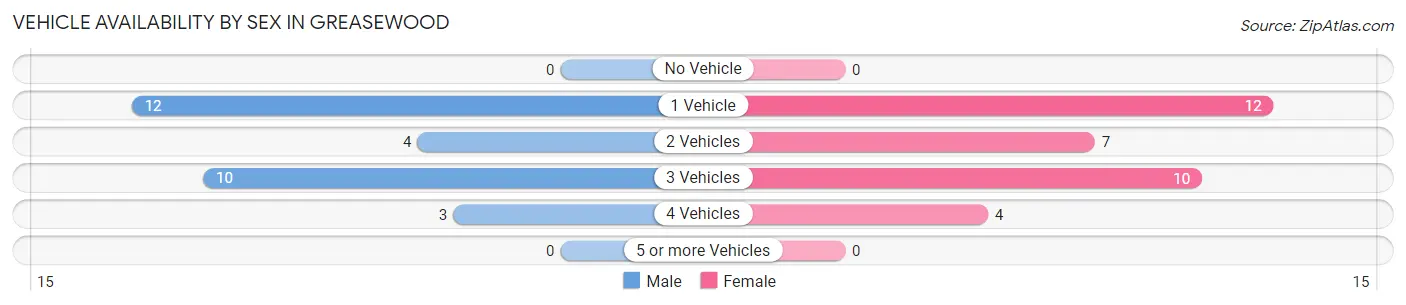
| Vehicles Available | Male | Female |
| No Vehicle | 0 (0.0%) | 0 (0.0%) |
| 1 Vehicle | 12 (41.4%) | 12 (36.4%) |
| 2 Vehicles | 4 (13.8%) | 7 (21.2%) |
| 3 Vehicles | 10 (34.5%) | 10 (30.3%) |
| 4 Vehicles | 3 (10.3%) | 4 (12.1%) |
| 5 or more Vehicles | 0 (0.0%) | 0 (0.0%) |
| Total | 29 (100.0%) | 33 (100.0%) |
Commute Time in Greasewood
The most frequently occuring commute durations in Greasewood are 5 to 9 minutes (23 commuters, 44.2%), 45 to 59 minutes (7 commuters, 13.5%), and 60 to 89 minutes (7 commuters, 13.5%).
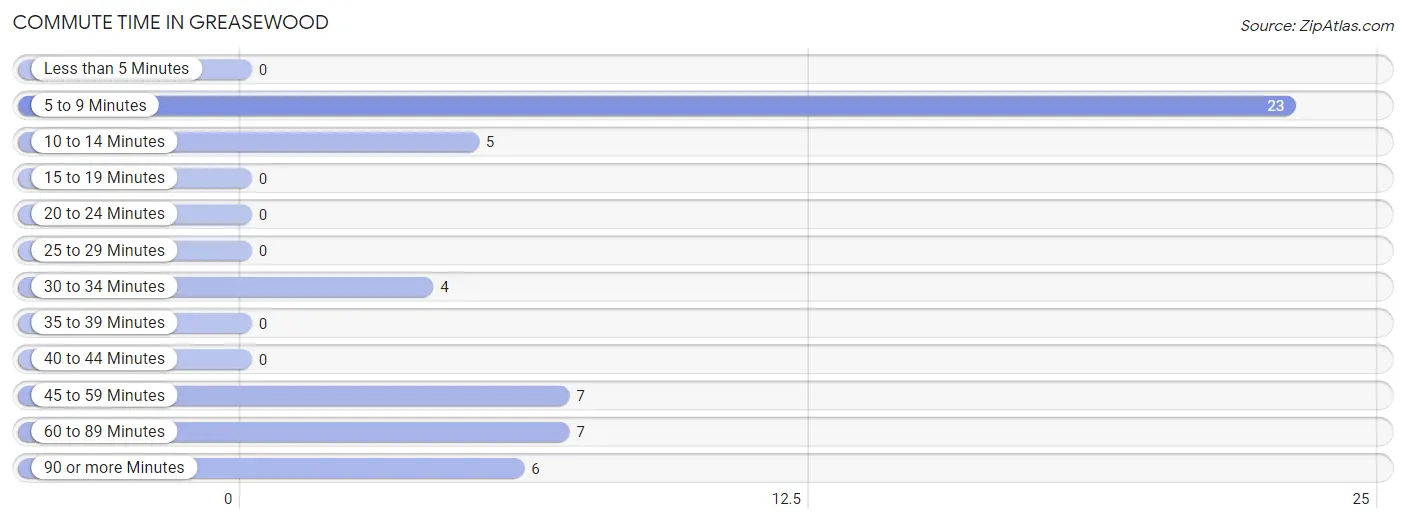
| Commute Time | # Commuters | % Commuters |
| Less than 5 Minutes | 0 | 0.0% |
| 5 to 9 Minutes | 23 | 44.2% |
| 10 to 14 Minutes | 5 | 9.6% |
| 15 to 19 Minutes | 0 | 0.0% |
| 20 to 24 Minutes | 0 | 0.0% |
| 25 to 29 Minutes | 0 | 0.0% |
| 30 to 34 Minutes | 4 | 7.7% |
| 35 to 39 Minutes | 0 | 0.0% |
| 40 to 44 Minutes | 0 | 0.0% |
| 45 to 59 Minutes | 7 | 13.5% |
| 60 to 89 Minutes | 7 | 13.5% |
| 90 or more Minutes | 6 | 11.5% |
Commute Time by Sex in Greasewood
The most common commute times in Greasewood are 5 to 9 minutes (7 commuters, 26.9%) for males and 5 to 9 minutes (16 commuters, 61.5%) for females.
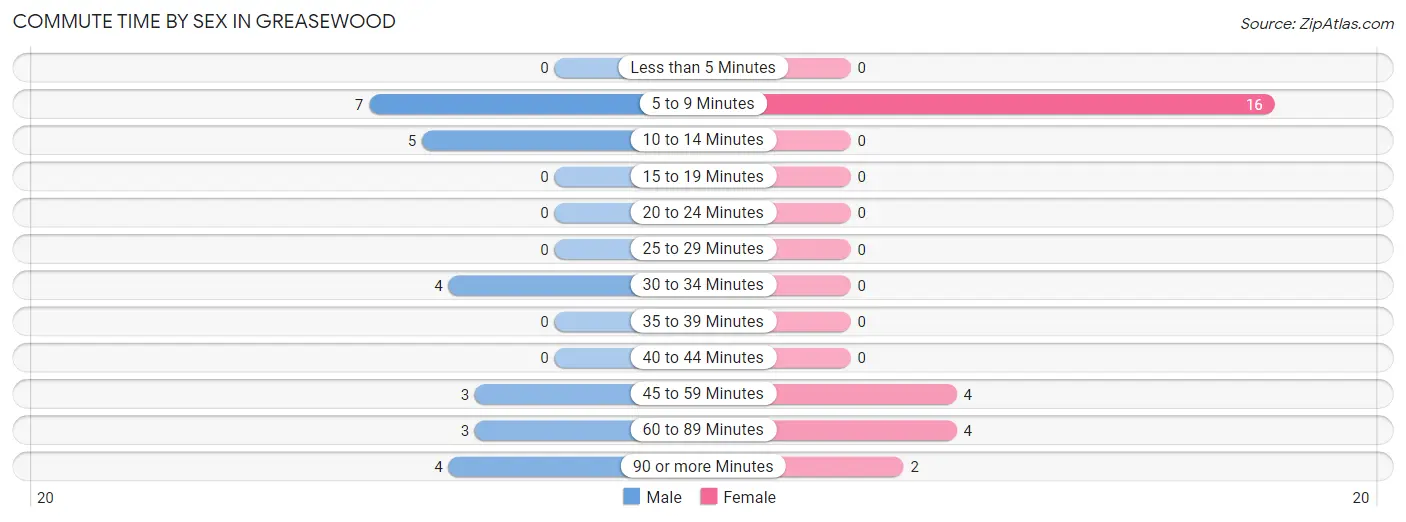
| Commute Time | Male | Female |
| Less than 5 Minutes | 0 (0.0%) | 0 (0.0%) |
| 5 to 9 Minutes | 7 (26.9%) | 16 (61.5%) |
| 10 to 14 Minutes | 5 (19.2%) | 0 (0.0%) |
| 15 to 19 Minutes | 0 (0.0%) | 0 (0.0%) |
| 20 to 24 Minutes | 0 (0.0%) | 0 (0.0%) |
| 25 to 29 Minutes | 0 (0.0%) | 0 (0.0%) |
| 30 to 34 Minutes | 4 (15.4%) | 0 (0.0%) |
| 35 to 39 Minutes | 0 (0.0%) | 0 (0.0%) |
| 40 to 44 Minutes | 0 (0.0%) | 0 (0.0%) |
| 45 to 59 Minutes | 3 (11.5%) | 4 (15.4%) |
| 60 to 89 Minutes | 3 (11.5%) | 4 (15.4%) |
| 90 or more Minutes | 4 (15.4%) | 2 (7.7%) |
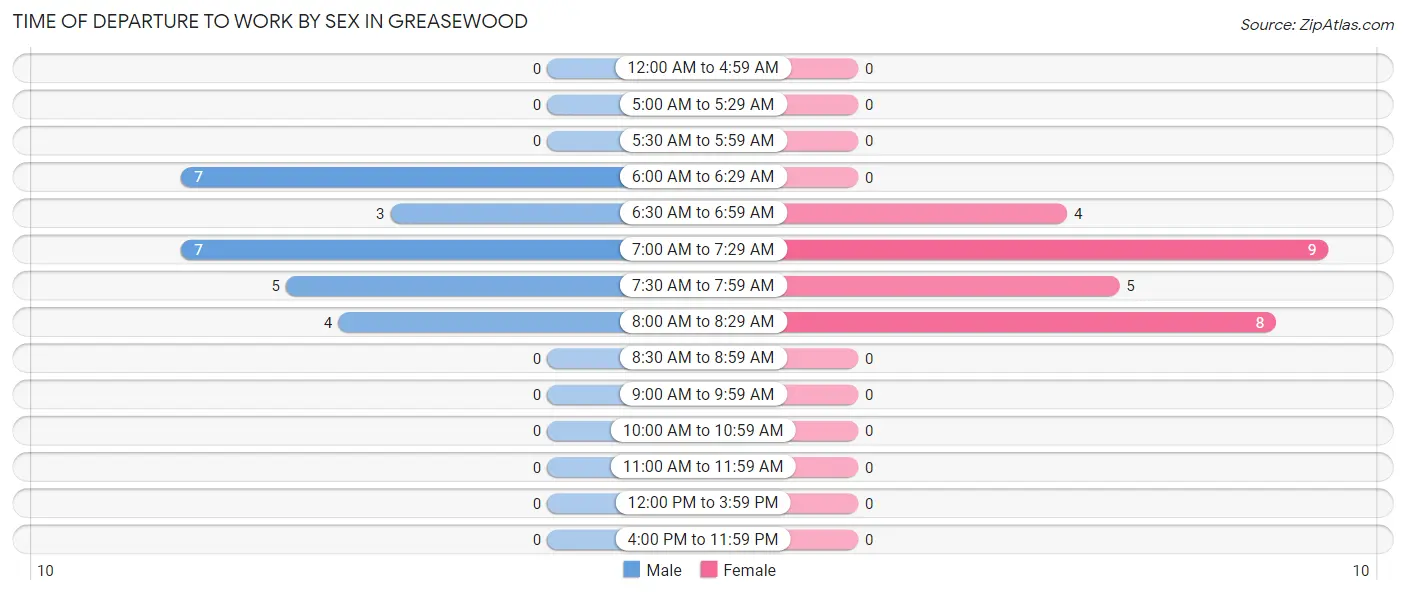
Time of Departure to Work by Sex in Greasewood
The most frequent times of departure to work in Greasewood are 6:00 AM to 6:29 AM (7, 26.9%) for males and 7:00 AM to 7:29 AM (9, 34.6%) for females.
| Time of Departure | Male | Female |
| 12:00 AM to 4:59 AM | 0 (0.0%) | 0 (0.0%) |
| 5:00 AM to 5:29 AM | 0 (0.0%) | 0 (0.0%) |
| 5:30 AM to 5:59 AM | 0 (0.0%) | 0 (0.0%) |
| 6:00 AM to 6:29 AM | 7 (26.9%) | 0 (0.0%) |
| 6:30 AM to 6:59 AM | 3 (11.5%) | 4 (15.4%) |
| 7:00 AM to 7:29 AM | 7 (26.9%) | 9 (34.6%) |
| 7:30 AM to 7:59 AM | 5 (19.2%) | 5 (19.2%) |
| 8:00 AM to 8:29 AM | 4 (15.4%) | 8 (30.8%) |
| 8:30 AM to 8:59 AM | 0 (0.0%) | 0 (0.0%) |
| 9:00 AM to 9:59 AM | 0 (0.0%) | 0 (0.0%) |
| 10:00 AM to 10:59 AM | 0 (0.0%) | 0 (0.0%) |
| 11:00 AM to 11:59 AM | 0 (0.0%) | 0 (0.0%) |
| 12:00 PM to 3:59 PM | 0 (0.0%) | 0 (0.0%) |
| 4:00 PM to 11:59 PM | 0 (0.0%) | 0 (0.0%) |
| Total | 26 (100.0%) | 26 (100.0%) |
Housing Occupancy in Greasewood
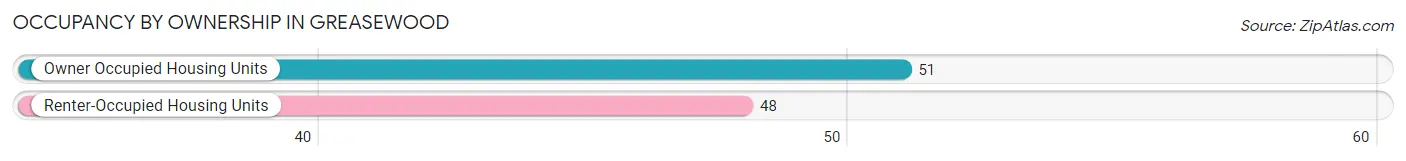
Occupancy by Ownership in Greasewood
Of the total 99 dwellings in Greasewood, owner-occupied units account for 51 (51.5%), while renter-occupied units make up 48 (48.5%).
| Occupancy | # Housing Units | % Housing Units |
| Owner Occupied Housing Units | 51 | 51.5% |
| Renter-Occupied Housing Units | 48 | 48.5% |
| Total Occupied Housing Units | 99 | 100.0% |
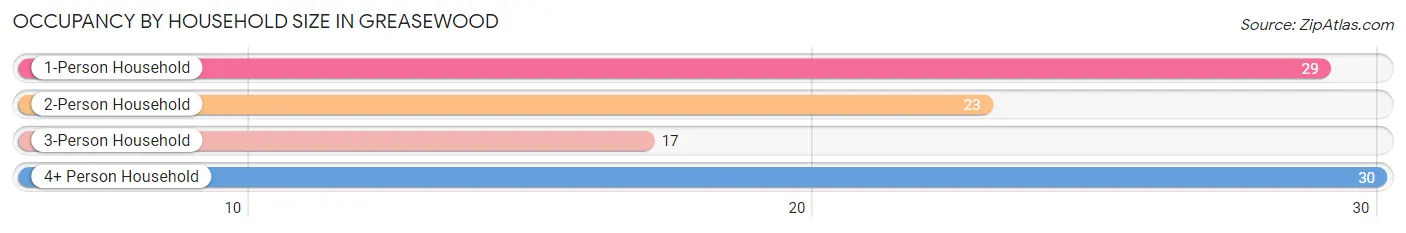
Occupancy by Household Size in Greasewood
| Household Size | # Housing Units | % Housing Units |
| 1-Person Household | 29 | 29.3% |
| 2-Person Household | 23 | 23.2% |
| 3-Person Household | 17 | 17.2% |
| 4+ Person Household | 30 | 30.3% |
| Total Housing Units | 99 | 100.0% |
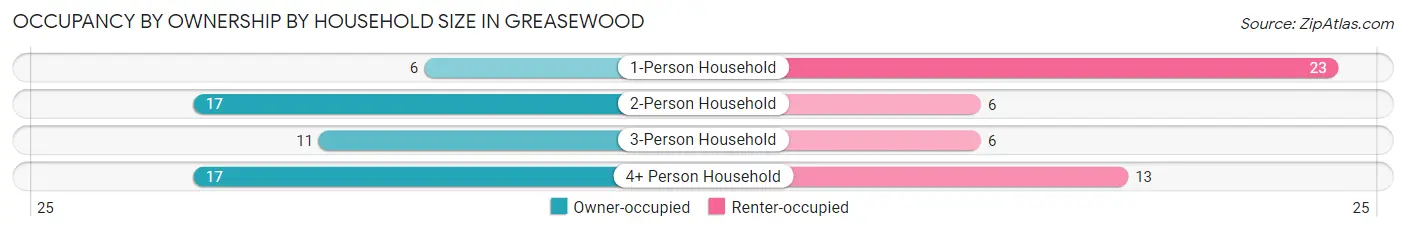
Occupancy by Ownership by Household Size in Greasewood
| Household Size | Owner-occupied | Renter-occupied |
| 1-Person Household | 6 (20.7%) | 23 (79.3%) |
| 2-Person Household | 17 (73.9%) | 6 (26.1%) |
| 3-Person Household | 11 (64.7%) | 6 (35.3%) |
| 4+ Person Household | 17 (56.7%) | 13 (43.3%) |
| Total Housing Units | 51 (51.5%) | 48 (48.5%) |
Occupancy by Educational Attainment in Greasewood
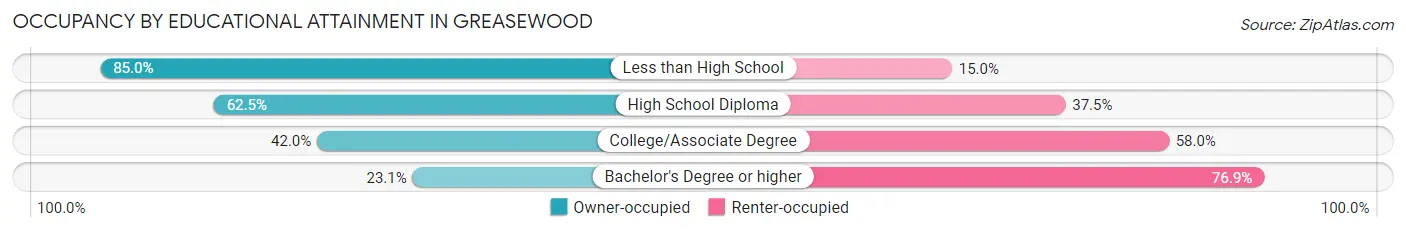
| Household Size | Owner-occupied | Renter-occupied |
| Less than High School | 17 (85.0%) | 3 (15.0%) |
| High School Diploma | 10 (62.5%) | 6 (37.5%) |
| College/Associate Degree | 21 (42.0%) | 29 (58.0%) |
| Bachelor's Degree or higher | 3 (23.1%) | 10 (76.9%) |
Occupancy by Age of Householder in Greasewood
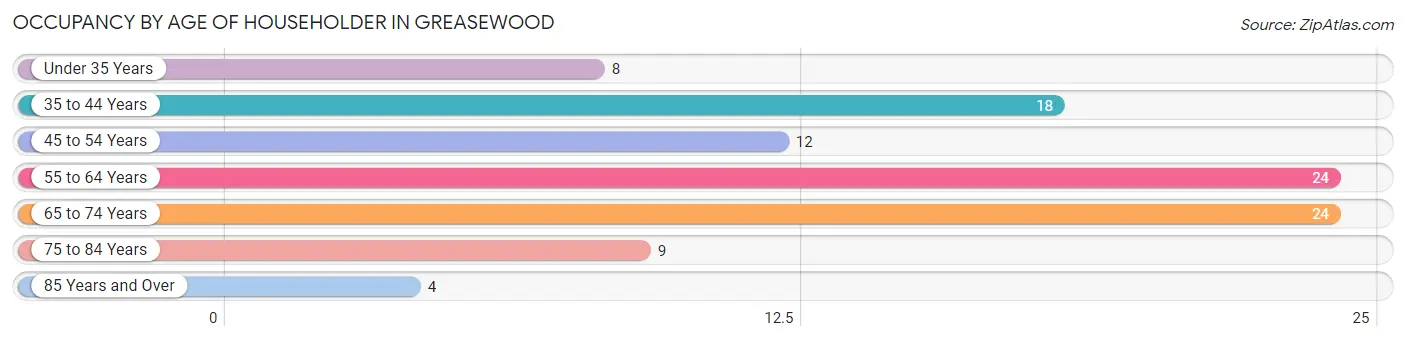
| Age Bracket | # Households | % Households |
| Under 35 Years | 8 | 8.1% |
| 35 to 44 Years | 18 | 18.2% |
| 45 to 54 Years | 12 | 12.1% |
| 55 to 64 Years | 24 | 24.2% |
| 65 to 74 Years | 24 | 24.2% |
| 75 to 84 Years | 9 | 9.1% |
| 85 Years and Over | 4 | 4.0% |
| Total | 99 | 100.0% |
Housing Finances in Greasewood
Median Income by Occupancy in Greasewood
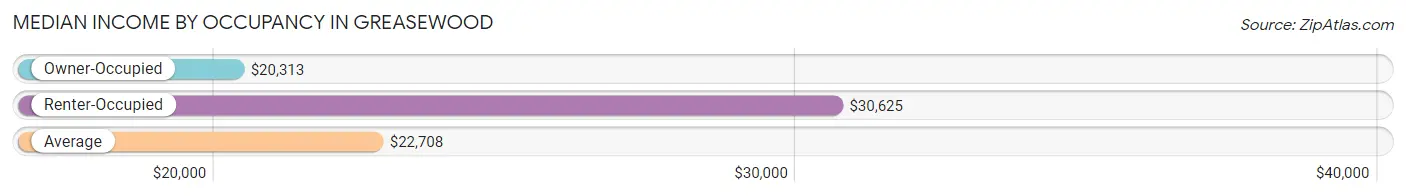
| Occupancy Type | # Households | Median Income |
| Owner-Occupied | 51 (51.5%) | $20,313 |
| Renter-Occupied | 48 (48.5%) | $30,625 |
| Average | 99 (100.0%) | $22,708 |
Occupancy by Householder Income Bracket in Greasewood
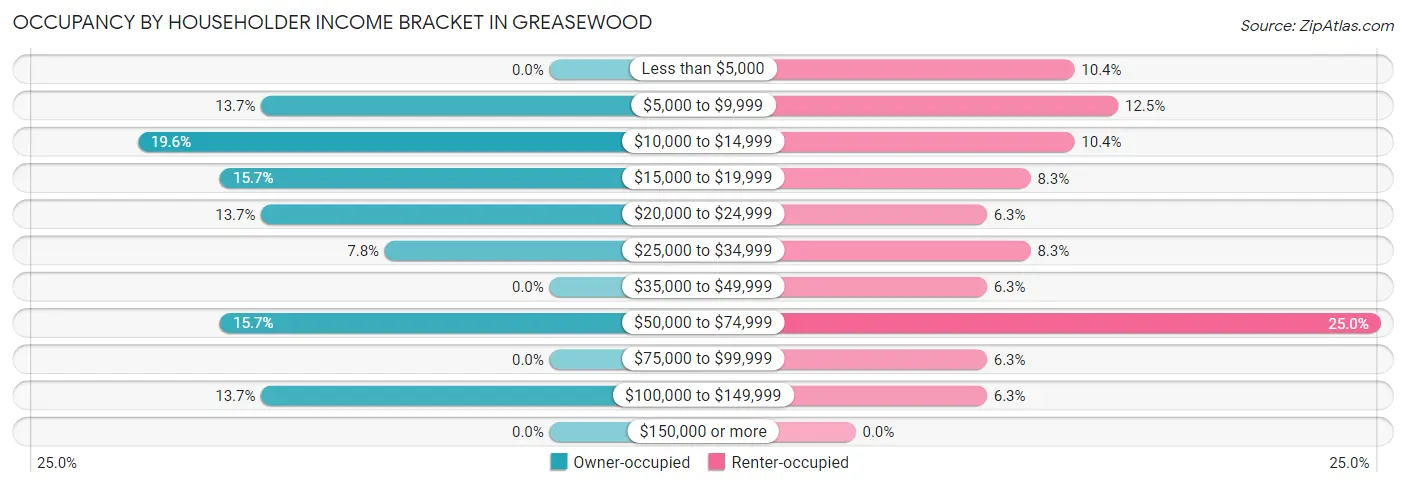
| Income Bracket | Owner-occupied | Renter-occupied |
| Less than $5,000 | 0 (0.0%) | 5 (10.4%) |
| $5,000 to $9,999 | 7 (13.7%) | 6 (12.5%) |
| $10,000 to $14,999 | 10 (19.6%) | 5 (10.4%) |
| $15,000 to $19,999 | 8 (15.7%) | 4 (8.3%) |
| $20,000 to $24,999 | 7 (13.7%) | 3 (6.2%) |
| $25,000 to $34,999 | 4 (7.8%) | 4 (8.3%) |
| $35,000 to $49,999 | 0 (0.0%) | 3 (6.2%) |
| $50,000 to $74,999 | 8 (15.7%) | 12 (25.0%) |
| $75,000 to $99,999 | 0 (0.0%) | 3 (6.2%) |
| $100,000 to $149,999 | 7 (13.7%) | 3 (6.2%) |
| $150,000 or more | 0 (0.0%) | 0 (0.0%) |
| Total | 51 (100.0%) | 48 (100.0%) |
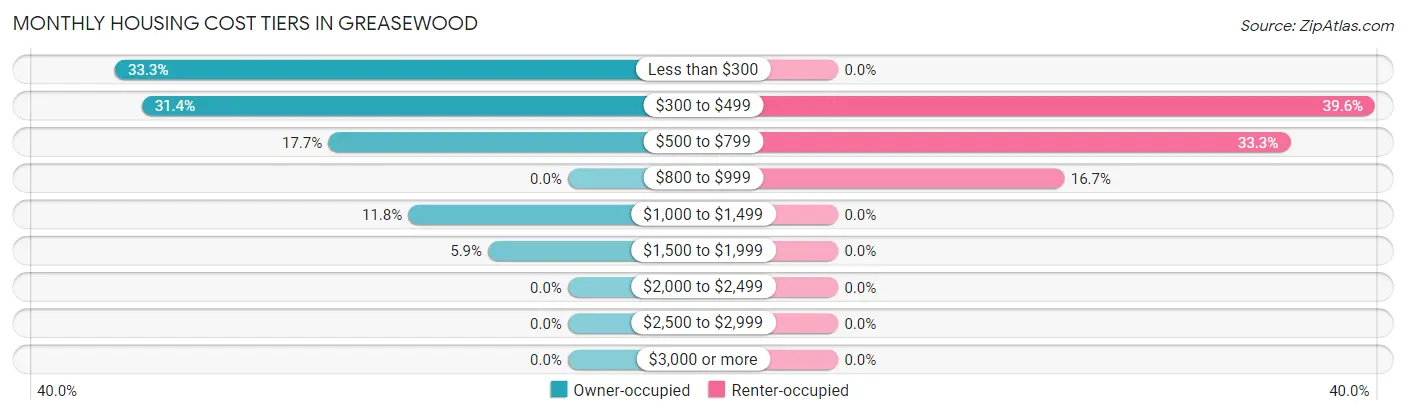
Monthly Housing Cost Tiers in Greasewood
| Monthly Cost | Owner-occupied | Renter-occupied |
| Less than $300 | 17 (33.3%) | 0 (0.0%) |
| $300 to $499 | 16 (31.4%) | 19 (39.6%) |
| $500 to $799 | 9 (17.6%) | 16 (33.3%) |
| $800 to $999 | 0 (0.0%) | 8 (16.7%) |
| $1,000 to $1,499 | 6 (11.8%) | 0 (0.0%) |
| $1,500 to $1,999 | 3 (5.9%) | 0 (0.0%) |
| $2,000 to $2,499 | 0 (0.0%) | 0 (0.0%) |
| $2,500 to $2,999 | 0 (0.0%) | 0 (0.0%) |
| $3,000 or more | 0 (0.0%) | 0 (0.0%) |
| Total | 51 (100.0%) | 48 (100.0%) |
Physical Housing Characteristics in Greasewood
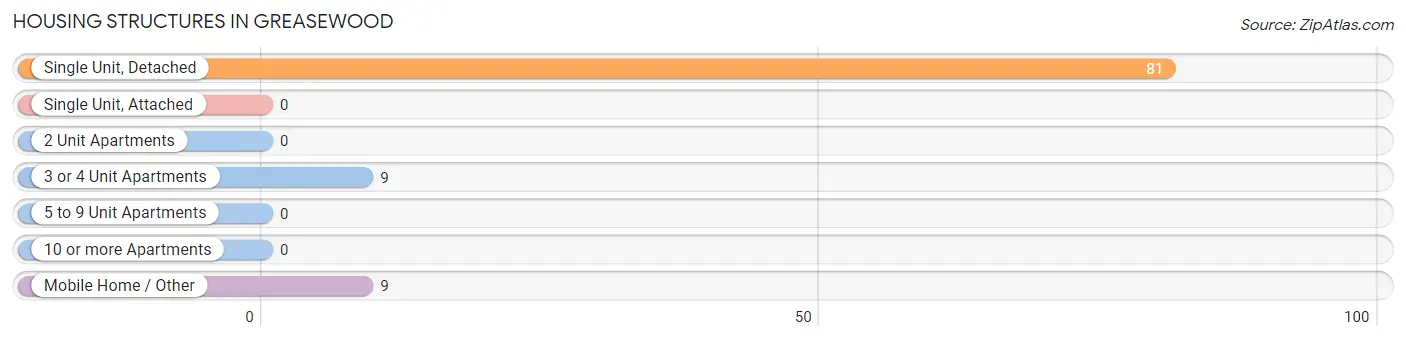
Housing Structures in Greasewood
| Structure Type | # Housing Units | % Housing Units |
| Single Unit, Detached | 81 | 81.8% |
| Single Unit, Attached | 0 | 0.0% |
| 2 Unit Apartments | 0 | 0.0% |
| 3 or 4 Unit Apartments | 9 | 9.1% |
| 5 to 9 Unit Apartments | 0 | 0.0% |
| 10 or more Apartments | 0 | 0.0% |
| Mobile Home / Other | 9 | 9.1% |
| Total | 99 | 100.0% |
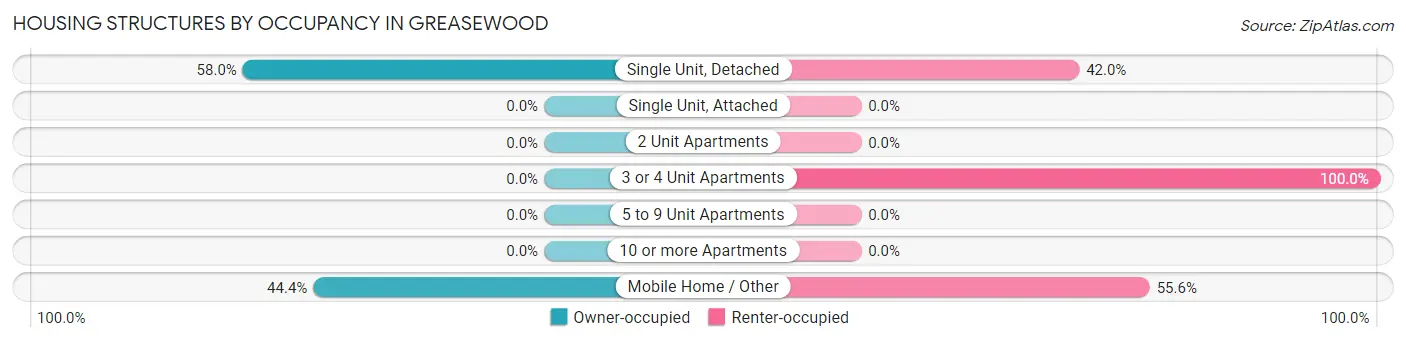
Housing Structures by Occupancy in Greasewood
| Structure Type | Owner-occupied | Renter-occupied |
| Single Unit, Detached | 47 (58.0%) | 34 (42.0%) |
| Single Unit, Attached | 0 (0.0%) | 0 (0.0%) |
| 2 Unit Apartments | 0 (0.0%) | 0 (0.0%) |
| 3 or 4 Unit Apartments | 0 (0.0%) | 9 (100.0%) |
| 5 to 9 Unit Apartments | 0 (0.0%) | 0 (0.0%) |
| 10 or more Apartments | 0 (0.0%) | 0 (0.0%) |
| Mobile Home / Other | 4 (44.4%) | 5 (55.6%) |
| Total | 51 (51.5%) | 48 (48.5%) |
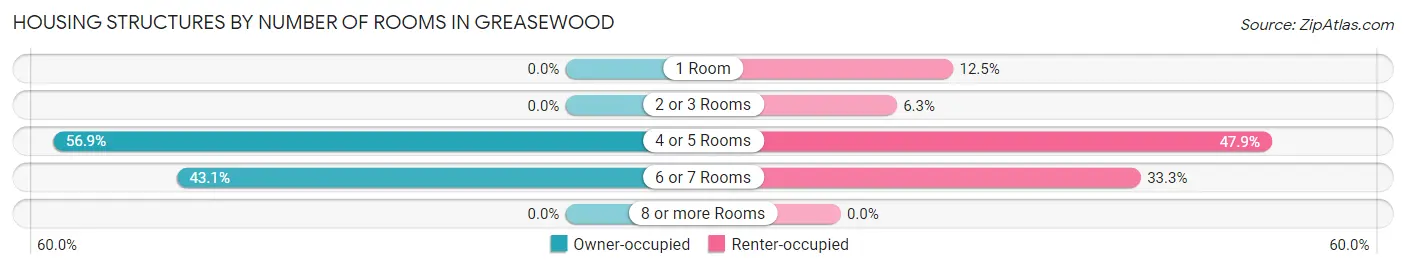
Housing Structures by Number of Rooms in Greasewood
| Number of Rooms | Owner-occupied | Renter-occupied |
| 1 Room | 0 (0.0%) | 6 (12.5%) |
| 2 or 3 Rooms | 0 (0.0%) | 3 (6.2%) |
| 4 or 5 Rooms | 29 (56.9%) | 23 (47.9%) |
| 6 or 7 Rooms | 22 (43.1%) | 16 (33.3%) |
| 8 or more Rooms | 0 (0.0%) | 0 (0.0%) |
| Total | 51 (100.0%) | 48 (100.0%) |
Housing Structure by Heating Type in Greasewood
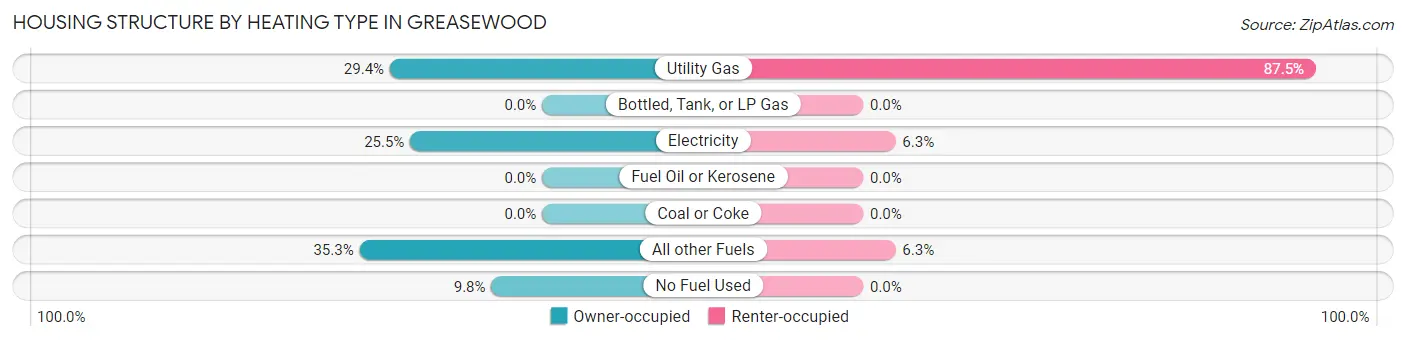
| Heating Type | Owner-occupied | Renter-occupied |
| Utility Gas | 15 (29.4%) | 42 (87.5%) |
| Bottled, Tank, or LP Gas | 0 (0.0%) | 0 (0.0%) |
| Electricity | 13 (25.5%) | 3 (6.2%) |
| Fuel Oil or Kerosene | 0 (0.0%) | 0 (0.0%) |
| Coal or Coke | 0 (0.0%) | 0 (0.0%) |
| All other Fuels | 18 (35.3%) | 3 (6.2%) |
| No Fuel Used | 5 (9.8%) | 0 (0.0%) |
| Total | 51 (100.0%) | 48 (100.0%) |
Household Vehicle Usage in Greasewood
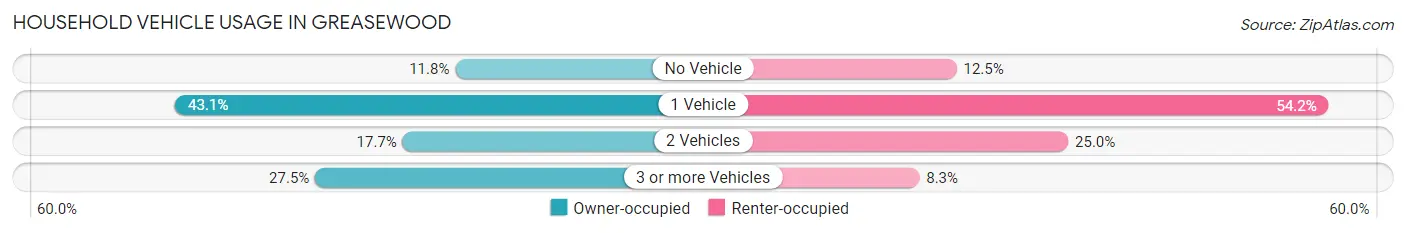
| Vehicles per Household | Owner-occupied | Renter-occupied |
| No Vehicle | 6 (11.8%) | 6 (12.5%) |
| 1 Vehicle | 22 (43.1%) | 26 (54.2%) |
| 2 Vehicles | 9 (17.6%) | 12 (25.0%) |
| 3 or more Vehicles | 14 (27.5%) | 4 (8.3%) |
| Total | 51 (100.0%) | 48 (100.0%) |
Real Estate & Mortgages in Greasewood
Real Estate and Mortgage Overview in Greasewood
| Characteristic | Without Mortgage | With Mortgage |
| Housing Units | 45 | 6 |
| Median Property Value | - | - |
| Median Household Income | $18,438 | $0 |
| Monthly Housing Costs | $321 | $0 |
| Real Estate Taxes | - | - |
Property Value by Mortgage Status in Greasewood
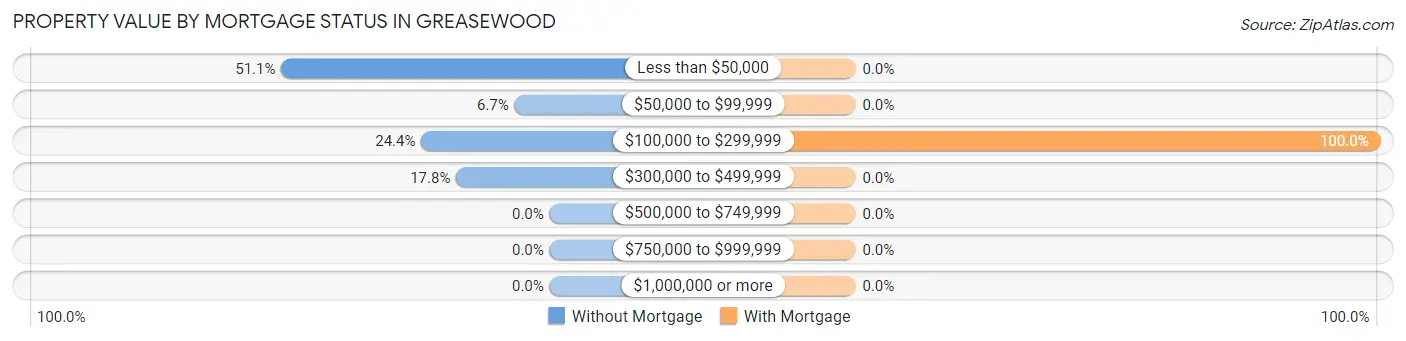
| Property Value | Without Mortgage | With Mortgage |
| Less than $50,000 | 23 (51.1%) | 0 (0.0%) |
| $50,000 to $99,999 | 3 (6.7%) | 0 (0.0%) |
| $100,000 to $299,999 | 11 (24.4%) | 6 (100.0%) |
| $300,000 to $499,999 | 8 (17.8%) | 0 (0.0%) |
| $500,000 to $749,999 | 0 (0.0%) | 0 (0.0%) |
| $750,000 to $999,999 | 0 (0.0%) | 0 (0.0%) |
| $1,000,000 or more | 0 (0.0%) | 0 (0.0%) |
| Total | 45 (100.0%) | 6 (100.0%) |
Household Income by Mortgage Status in Greasewood
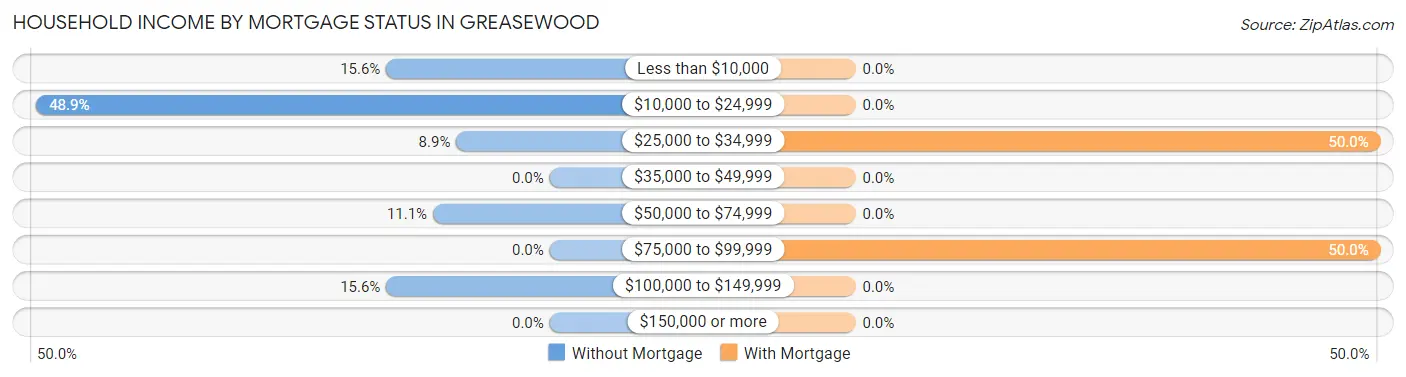
| Household Income | Without Mortgage | With Mortgage |
| Less than $10,000 | 7 (15.6%) | 0 (0.0%) |
| $10,000 to $24,999 | 22 (48.9%) | 0 (0.0%) |
| $25,000 to $34,999 | 4 (8.9%) | 3 (50.0%) |
| $35,000 to $49,999 | 0 (0.0%) | 0 (0.0%) |
| $50,000 to $74,999 | 5 (11.1%) | 0 (0.0%) |
| $75,000 to $99,999 | 0 (0.0%) | 3 (50.0%) |
| $100,000 to $149,999 | 7 (15.6%) | 0 (0.0%) |
| $150,000 or more | 0 (0.0%) | 0 (0.0%) |
| Total | 45 (100.0%) | 6 (100.0%) |
Property Value to Household Income Ratio in Greasewood
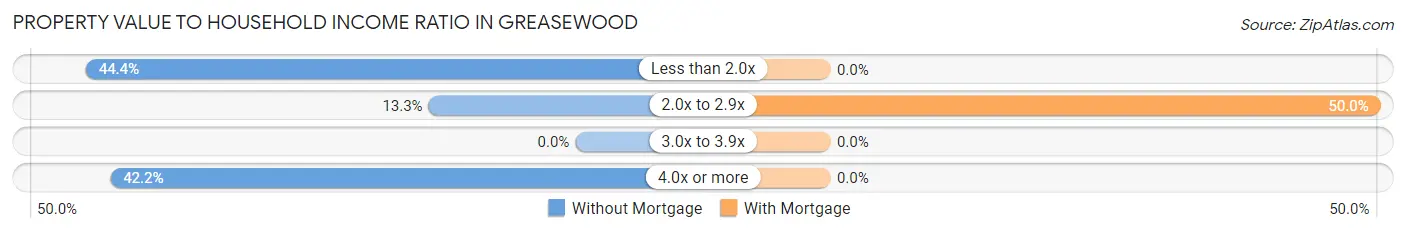
| Value-to-Income Ratio | Without Mortgage | With Mortgage |
| Less than 2.0x | 20 (44.4%) | 0 (0.0%) |
| 2.0x to 2.9x | 6 (13.3%) | 3 (50.0%) |
| 3.0x to 3.9x | 0 (0.0%) | 0 (0.0%) |
| 4.0x or more | 19 (42.2%) | 0 (0.0%) |
| Total | 45 (100.0%) | 6 (100.0%) |
Real Estate Taxes by Mortgage Status in Greasewood
| Property Taxes | Without Mortgage | With Mortgage |
| Less than $800 | 0 (0.0%) | 0 (0.0%) |
| $800 to $1,499 | 0 (0.0%) | 0 (0.0%) |
| $800 to $1,499 | 0 (0.0%) | 0 (0.0%) |
| Total | 45 (100.0%) | 6 (100.0%) |
Health & Disability in Greasewood
Health Insurance Coverage by Age in Greasewood
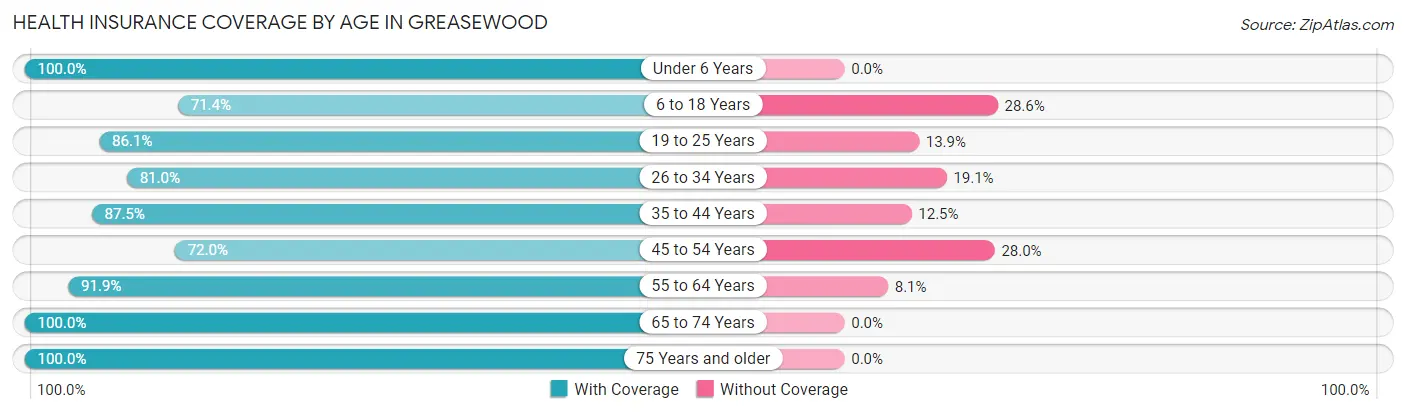
| Age Bracket | With Coverage | Without Coverage |
| Under 6 Years | 23 (100.0%) | 0 (0.0%) |
| 6 to 18 Years | 30 (71.4%) | 12 (28.6%) |
| 19 to 25 Years | 31 (86.1%) | 5 (13.9%) |
| 26 to 34 Years | 17 (80.9%) | 4 (19.1%) |
| 35 to 44 Years | 35 (87.5%) | 5 (12.5%) |
| 45 to 54 Years | 18 (72.0%) | 7 (28.0%) |
| 55 to 64 Years | 34 (91.9%) | 3 (8.1%) |
| 65 to 74 Years | 40 (100.0%) | 0 (0.0%) |
| 75 Years and older | 17 (100.0%) | 0 (0.0%) |
| Total | 245 (87.2%) | 36 (12.8%) |
Health Insurance Coverage by Citizenship Status in Greasewood
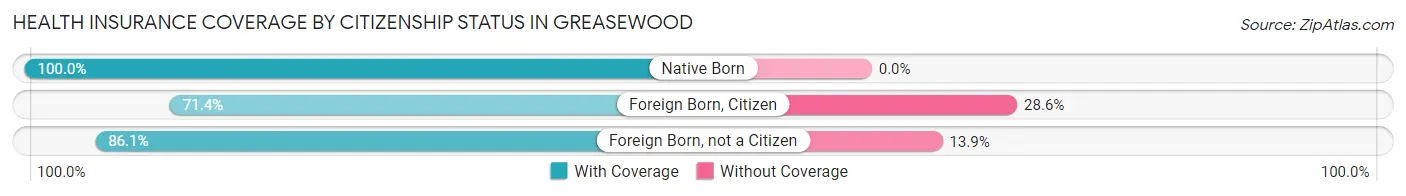
| Citizenship Status | With Coverage | Without Coverage |
| Native Born | 23 (100.0%) | 0 (0.0%) |
| Foreign Born, Citizen | 30 (71.4%) | 12 (28.6%) |
| Foreign Born, not a Citizen | 31 (86.1%) | 5 (13.9%) |
Health Insurance Coverage by Household Income in Greasewood
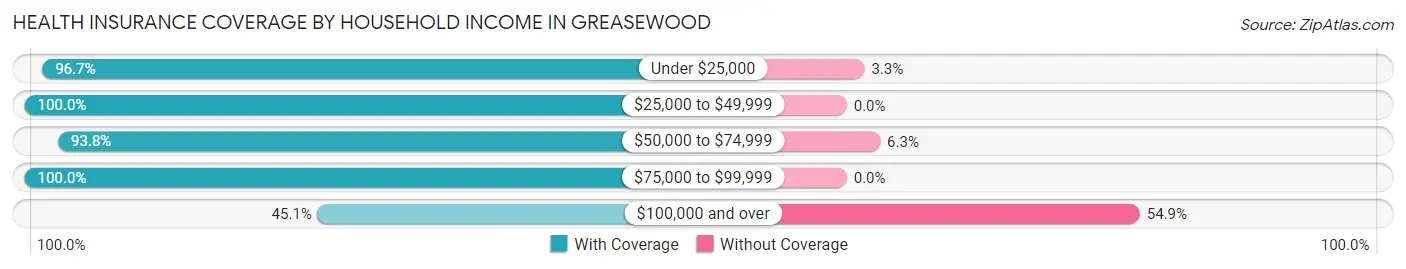
| Household Income | With Coverage | Without Coverage |
| Under $25,000 | 146 (96.7%) | 5 (3.3%) |
| $25,000 to $49,999 | 28 (100.0%) | 0 (0.0%) |
| $50,000 to $74,999 | 45 (93.8%) | 3 (6.2%) |
| $75,000 to $99,999 | 3 (100.0%) | 0 (0.0%) |
| $100,000 and over | 23 (45.1%) | 28 (54.9%) |
Public vs Private Health Insurance Coverage by Age in Greasewood
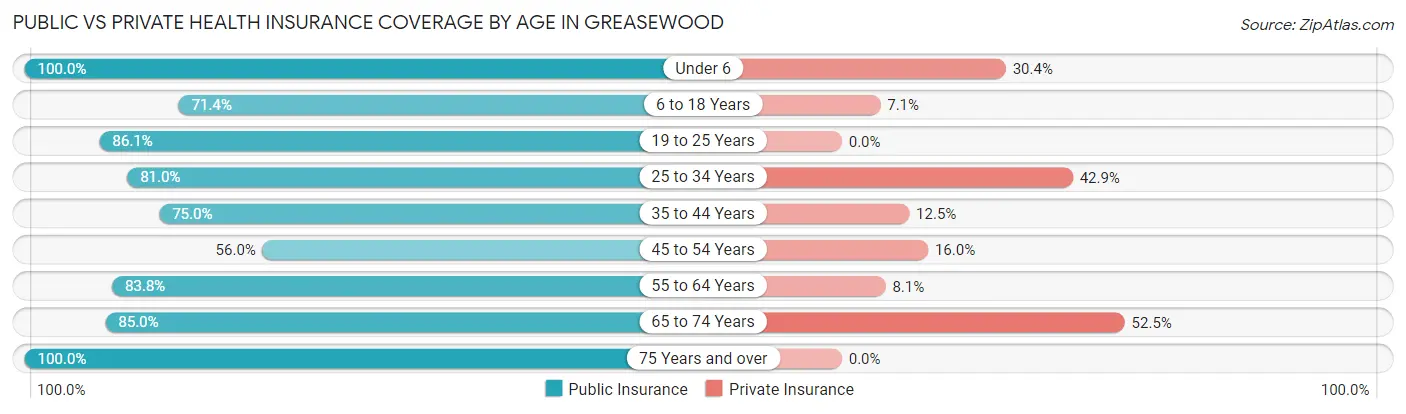
| Age Bracket | Public Insurance | Private Insurance |
| Under 6 | 23 (100.0%) | 7 (30.4%) |
| 6 to 18 Years | 30 (71.4%) | 3 (7.1%) |
| 19 to 25 Years | 31 (86.1%) | 0 (0.0%) |
| 25 to 34 Years | 17 (80.9%) | 9 (42.9%) |
| 35 to 44 Years | 30 (75.0%) | 5 (12.5%) |
| 45 to 54 Years | 14 (56.0%) | 4 (16.0%) |
| 55 to 64 Years | 31 (83.8%) | 3 (8.1%) |
| 65 to 74 Years | 34 (85.0%) | 21 (52.5%) |
| 75 Years and over | 17 (100.0%) | 0 (0.0%) |
| Total | 227 (80.8%) | 52 (18.5%) |
Disability Status by Sex by Age in Greasewood
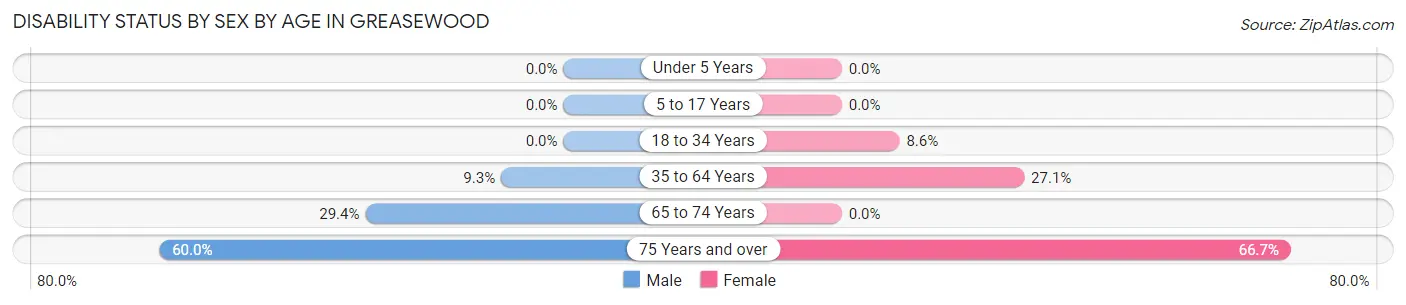
| Age Bracket | Male | Female |
| Under 5 Years | 0 (0.0%) | 0 (0.0%) |
| 5 to 17 Years | 0 (0.0%) | 0 (0.0%) |
| 18 to 34 Years | 0 (0.0%) | 3 (8.6%) |
| 35 to 64 Years | 5 (9.3%) | 13 (27.1%) |
| 65 to 74 Years | 5 (29.4%) | 0 (0.0%) |
| 75 Years and over | 3 (60.0%) | 8 (66.7%) |
Disability Class by Sex by Age in Greasewood
Disability Class: Hearing Difficulty
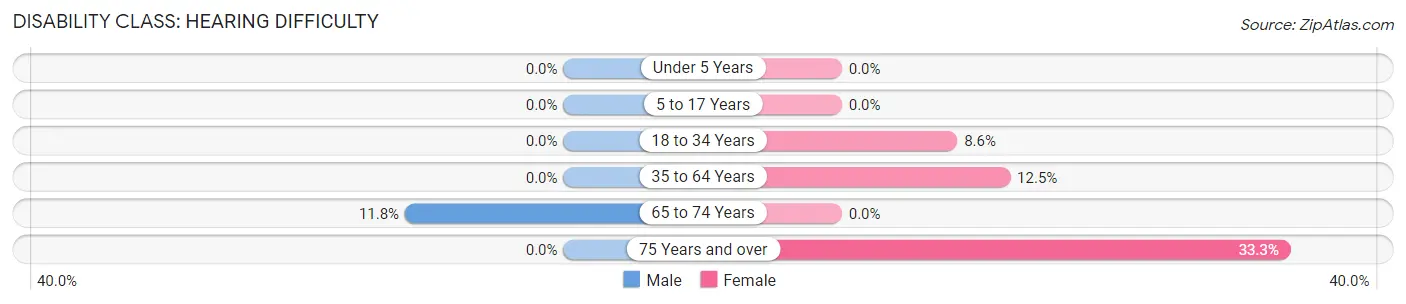
| Age Bracket | Male | Female |
| Under 5 Years | 0 (0.0%) | 0 (0.0%) |
| 5 to 17 Years | 0 (0.0%) | 0 (0.0%) |
| 18 to 34 Years | 0 (0.0%) | 3 (8.6%) |
| 35 to 64 Years | 0 (0.0%) | 6 (12.5%) |
| 65 to 74 Years | 2 (11.8%) | 0 (0.0%) |
| 75 Years and over | 0 (0.0%) | 4 (33.3%) |
Disability Class: Vision Difficulty
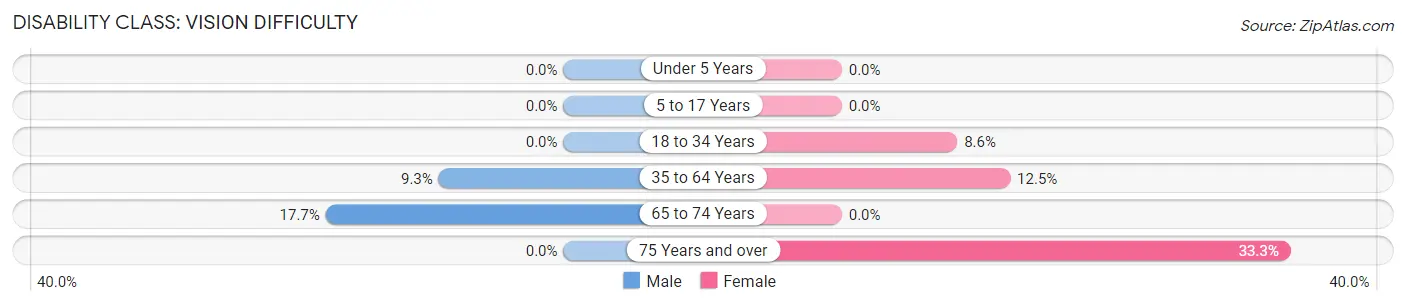
| Age Bracket | Male | Female |
| Under 5 Years | 0 (0.0%) | 0 (0.0%) |
| 5 to 17 Years | 0 (0.0%) | 0 (0.0%) |
| 18 to 34 Years | 0 (0.0%) | 3 (8.6%) |
| 35 to 64 Years | 5 (9.3%) | 6 (12.5%) |
| 65 to 74 Years | 3 (17.6%) | 0 (0.0%) |
| 75 Years and over | 0 (0.0%) | 4 (33.3%) |
Disability Class: Cognitive Difficulty
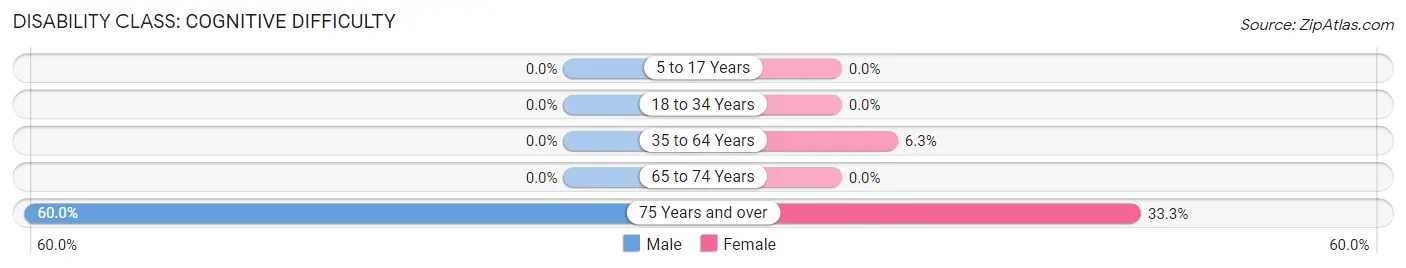
| Age Bracket | Male | Female |
| 5 to 17 Years | 0 (0.0%) | 0 (0.0%) |
| 18 to 34 Years | 0 (0.0%) | 0 (0.0%) |
| 35 to 64 Years | 0 (0.0%) | 3 (6.2%) |
| 65 to 74 Years | 0 (0.0%) | 0 (0.0%) |
| 75 Years and over | 3 (60.0%) | 4 (33.3%) |
Disability Class: Ambulatory Difficulty
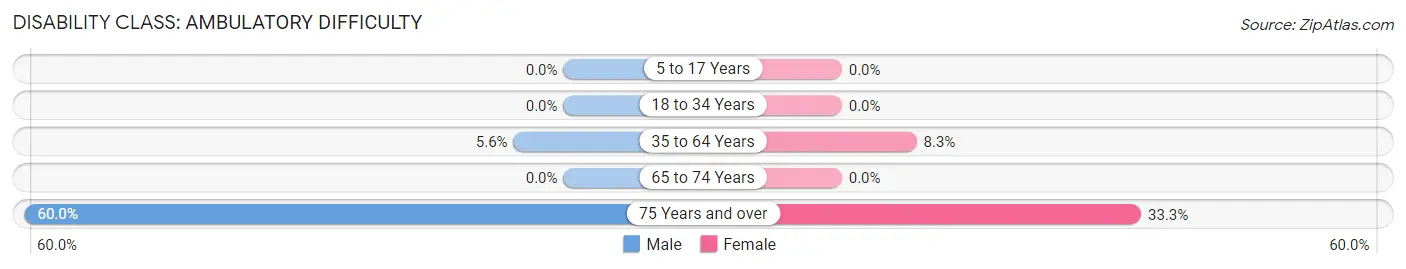
| Age Bracket | Male | Female |
| 5 to 17 Years | 0 (0.0%) | 0 (0.0%) |
| 18 to 34 Years | 0 (0.0%) | 0 (0.0%) |
| 35 to 64 Years | 3 (5.6%) | 4 (8.3%) |
| 65 to 74 Years | 0 (0.0%) | 0 (0.0%) |
| 75 Years and over | 3 (60.0%) | 4 (33.3%) |
Disability Class: Self-Care Difficulty
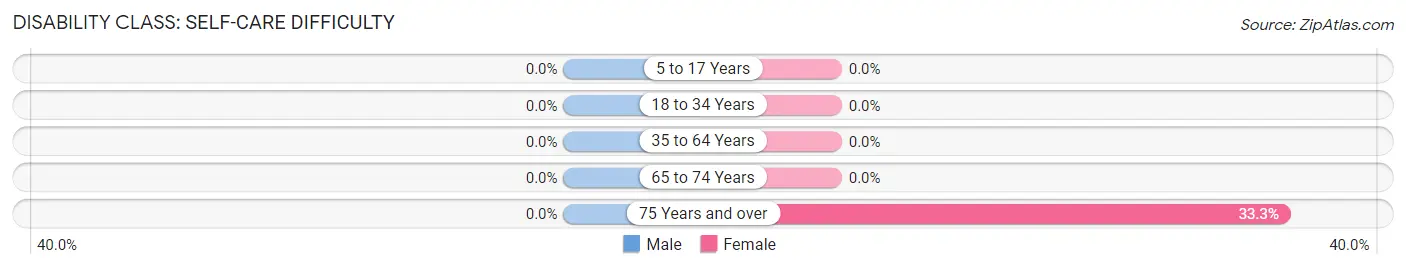
| Age Bracket | Male | Female |
| 5 to 17 Years | 0 (0.0%) | 0 (0.0%) |
| 18 to 34 Years | 0 (0.0%) | 0 (0.0%) |
| 35 to 64 Years | 0 (0.0%) | 0 (0.0%) |
| 65 to 74 Years | 0 (0.0%) | 0 (0.0%) |
| 75 Years and over | 0 (0.0%) | 4 (33.3%) |
Technology Access in Greasewood
Computing Device Access in Greasewood
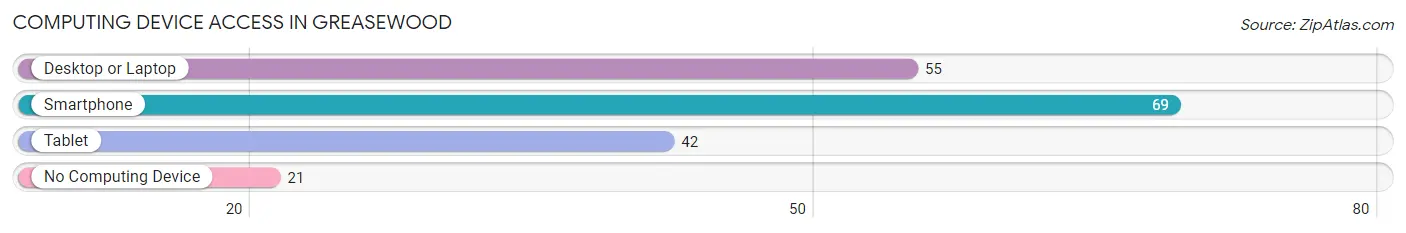
| Device Type | # Households | % Households |
| Desktop or Laptop | 55 | 55.6% |
| Smartphone | 69 | 69.7% |
| Tablet | 42 | 42.4% |
| No Computing Device | 21 | 21.2% |
| Total | 99 | 100.0% |
Internet Access in Greasewood
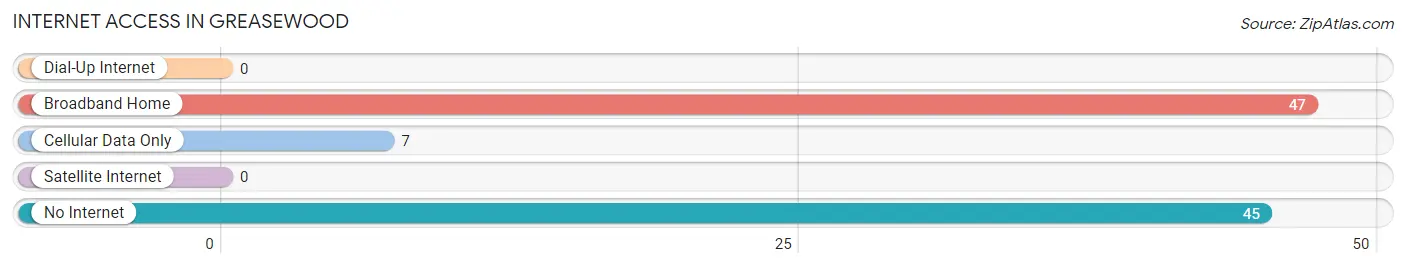
| Internet Type | # Households | % Households |
| Dial-Up Internet | 0 | 0.0% |
| Broadband Home | 47 | 47.5% |
| Cellular Data Only | 7 | 7.1% |
| Satellite Internet | 0 | 0.0% |
| No Internet | 45 | 45.5% |
| Total | 99 | 100.0% |
Greasewood Summary
Greasewood, Arizona is a small unincorporated community located in Navajo County, Arizona. It is situated in the northeastern part of the state, approximately 25 miles south of the Utah border. The town is located in the Navajo Nation, the largest Native American reservation in the United States. Greasewood is a rural community with a population of approximately 500 people.
History
The area that is now Greasewood was originally inhabited by the Navajo people. The town was established in the late 1800s as a trading post for the Navajo people. The town was named after the greasewood shrubs that grew in the area. The town was also known as “Greasewood Springs” due to the presence of a natural spring in the area.
In the early 1900s, the town began to grow as more settlers moved to the area. The town was home to a post office, a school, a general store, and a few other businesses. The town was also home to a number of sheep and cattle ranches.
In the 1950s, the town began to decline as the population began to move away. The post office closed in the 1960s and the school closed in the 1970s. The town has remained relatively small since then, with a population of around 500 people.
Geography
Greasewood is located in the northeastern part of Arizona, approximately 25 miles south of the Utah border. The town is situated in the Navajo Nation, the largest Native American reservation in the United States. The town is located in the high desert region of Arizona, with an elevation of 5,000 feet. The area is characterized by dry, hot summers and cold, snowy winters.
The town is located near the San Juan River, which is a tributary of the Colorado River. The area is also home to a number of natural springs, which provide water for the town.
Economy
The economy of Greasewood is largely based on agriculture and ranching. The town is home to a number of sheep and cattle ranches, as well as a few small farms. The town is also home to a number of small businesses, including a general store, a gas station, and a few restaurants.
Demographics
As of the 2010 census, the population of Greasewood was 498. The town is predominantly Native American, with the majority of the population being Navajo. The median household income in the town is $25,000, and the median age is 33. The town has a poverty rate of 28.3%, which is higher than the national average.
Common Questions
What is Per Capita Income in Greasewood?
Per Capita income in Greasewood is $14,214.
What is the Median Family Income in Greasewood?
Median Family Income in Greasewood is $23,750.
What is the Median Household income in Greasewood?
Median Household Income in Greasewood is $22,708.
What is Income or Wage Gap in Greasewood?
Income or Wage Gap in Greasewood is 8.4%.
Women in Greasewood earn 91.6 cents for every dollar earned by a man.
What is Family Income Deficit in Greasewood?
Family Income Deficit in Greasewood is $11,032.
Families that are below poverty line in Greasewood earn $11,032 less on average than the poverty threshold level.
What is Inequality or Gini Index in Greasewood?
Inequality or Gini Index in Greasewood is 0.50.
What is the Total Population of Greasewood?
Total Population of Greasewood is 281.
What is the Total Male Population of Greasewood?
Total Male Population of Greasewood is 134.
What is the Total Female Population of Greasewood?
Total Female Population of Greasewood is 147.
What is the Ratio of Males per 100 Females in Greasewood?
There are 91.16 Males per 100 Females in Greasewood.
What is the Ratio of Females per 100 Males in Greasewood?
There are 109.70 Females per 100 Males in Greasewood.
What is the Median Population Age in Greasewood?
Median Population Age in Greasewood is 42.6 Years.
What is the Average Family Size in Greasewood
Average Family Size in Greasewood is 3.5 People.
What is the Average Household Size in Greasewood
Average Household Size in Greasewood is 2.8 People.
How Large is the Labor Force in Greasewood?
There are 78 People in the Labor Forcein in Greasewood.
What is the Percentage of People in the Labor Force in Greasewood?
34.2% of People are in the Labor Force in Greasewood.
What is the Unemployment Rate in Greasewood?
Unemployment Rate in Greasewood is 20.5%.