Beaver Dam, AZ Map & Demographics
Beaver Dam Map
Beaver Dam Overview
$24,765
PER CAPITA INCOME
$64,803
AVG FAMILY INCOME
$45,550
AVG HOUSEHOLD INCOME
25.8%
WAGE / INCOME GAP [ % ]
74.2¢/ $1
WAGE / INCOME GAP [ $ ]
0.42
INEQUALITY / GINI INDEX
2,013
TOTAL POPULATION
932
MALE POPULATION
1,081
FEMALE POPULATION
86.22
MALES / 100 FEMALES
115.99
FEMALES / 100 MALES
50.5
MEDIAN AGE
2.4
AVG FAMILY SIZE
2.1
AVG HOUSEHOLD SIZE
1,060
LABOR FORCE [ PEOPLE ]
54.2%
PERCENT IN LABOR FORCE
7.7%
UNEMPLOYMENT RATE
Beaver Dam Area Codes
Income in Beaver Dam
Income Overview in Beaver Dam
Per Capita Income in Beaver Dam is $24,765, while median incomes of families and households are $64,803 and $45,550 respectively.
| Characteristic | Number | Measure |
| Per Capita Income | 2,013 | $24,765 |
| Median Family Income | 685 | $64,803 |
| Mean Family Income | 685 | $73,509 |
| Median Household Income | 971 | $45,550 |
| Mean Household Income | 971 | $56,571 |
| Income Deficit | 685 | $0 |
| Wage / Income Gap (%) | 2,013 | 25.76% |
| Wage / Income Gap ($) | 2,013 | 74.24¢ per $1 |
| Gini / Inequality Index | 2,013 | 0.42 |
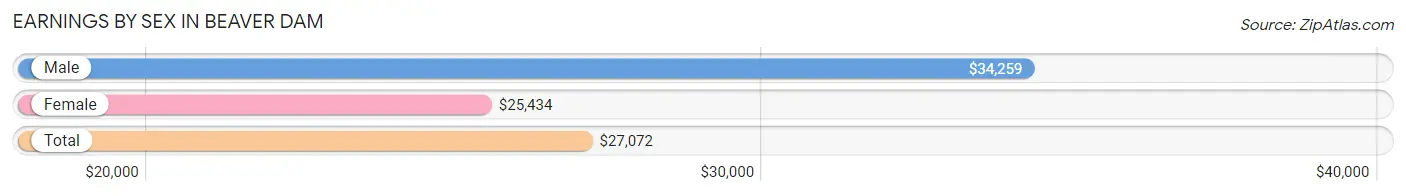
Earnings by Sex in Beaver Dam
Average Earnings in Beaver Dam are $27,072, $34,259 for men and $25,434 for women, a difference of 25.8%.
| Sex | Number | Average Earnings |
| Male | 409 (39.4%) | $34,259 |
| Female | 630 (60.6%) | $25,434 |
| Total | 1,039 (100.0%) | $27,072 |
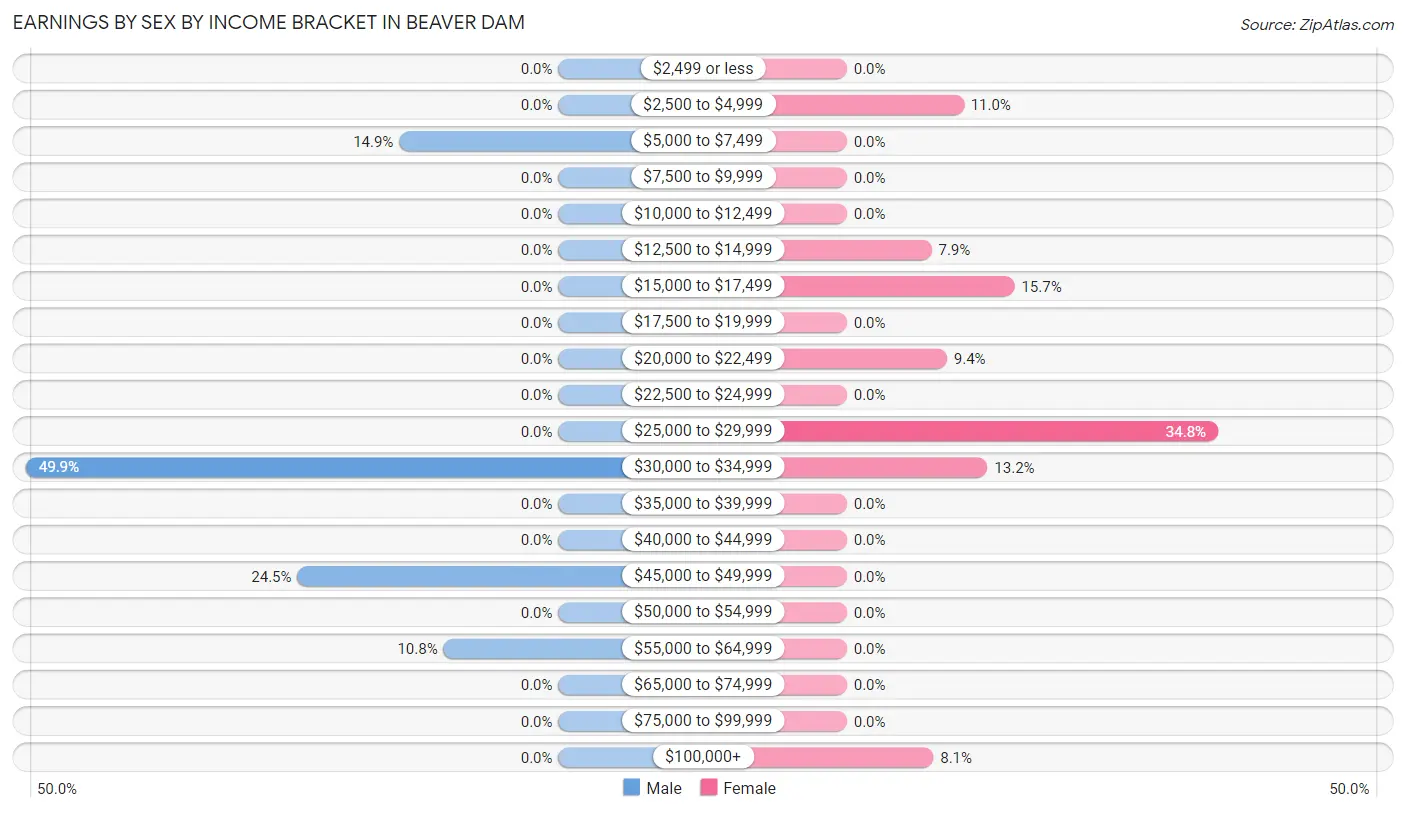
Earnings by Sex by Income Bracket in Beaver Dam
The most common earnings brackets in Beaver Dam are $30,000 to $34,999 for men (204 | 49.9%) and $25,000 to $29,999 for women (219 | 34.8%).
| Income | Male | Female |
| $2,499 or less | 0 (0.0%) | 0 (0.0%) |
| $2,500 to $4,999 | 0 (0.0%) | 69 (11.0%) |
| $5,000 to $7,499 | 61 (14.9%) | 0 (0.0%) |
| $7,500 to $9,999 | 0 (0.0%) | 0 (0.0%) |
| $10,000 to $12,499 | 0 (0.0%) | 0 (0.0%) |
| $12,500 to $14,999 | 0 (0.0%) | 50 (7.9%) |
| $15,000 to $17,499 | 0 (0.0%) | 99 (15.7%) |
| $17,500 to $19,999 | 0 (0.0%) | 0 (0.0%) |
| $20,000 to $22,499 | 0 (0.0%) | 59 (9.4%) |
| $22,500 to $24,999 | 0 (0.0%) | 0 (0.0%) |
| $25,000 to $29,999 | 0 (0.0%) | 219 (34.8%) |
| $30,000 to $34,999 | 204 (49.9%) | 83 (13.2%) |
| $35,000 to $39,999 | 0 (0.0%) | 0 (0.0%) |
| $40,000 to $44,999 | 0 (0.0%) | 0 (0.0%) |
| $45,000 to $49,999 | 100 (24.4%) | 0 (0.0%) |
| $50,000 to $54,999 | 0 (0.0%) | 0 (0.0%) |
| $55,000 to $64,999 | 44 (10.8%) | 0 (0.0%) |
| $65,000 to $74,999 | 0 (0.0%) | 0 (0.0%) |
| $75,000 to $99,999 | 0 (0.0%) | 0 (0.0%) |
| $100,000+ | 0 (0.0%) | 51 (8.1%) |
| Total | 409 (100.0%) | 630 (100.0%) |
Earnings by Sex by Educational Attainment in Beaver Dam
| Educational Attainment | Male Income | Female Income |
| Less than High School | - | - |
| High School Diploma | - | - |
| College or Associate's Degree | - | - |
| Bachelor's Degree | - | - |
| Graduate Degree | - | - |
| Total | $33,646 | $25,434 |
Family Income in Beaver Dam
Family Income Brackets in Beaver Dam
According to the Beaver Dam family income data, there are 287 families falling into the $75,000 to $99,999 income range, which is the most common income bracket and makes up 41.9% of all families.
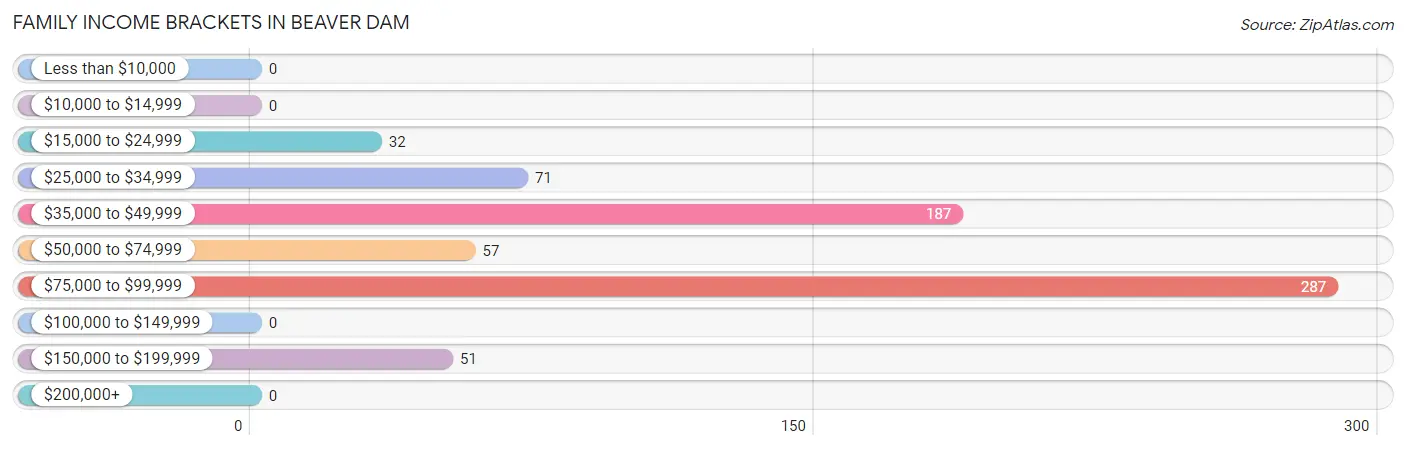
| Income Bracket | # Families | % Families |
| Less than $10,000 | 0 | 0.0% |
| $10,000 to $14,999 | 0 | 0.0% |
| $15,000 to $24,999 | 32 | 4.7% |
| $25,000 to $34,999 | 71 | 10.4% |
| $35,000 to $49,999 | 187 | 27.3% |
| $50,000 to $74,999 | 57 | 8.3% |
| $75,000 to $99,999 | 287 | 41.9% |
| $100,000 to $149,999 | 0 | 0.0% |
| $150,000 to $199,999 | 51 | 7.4% |
| $200,000+ | 0 | 0.0% |
Family Income by Famaliy Size in Beaver Dam
2-person families (366 | 53.4%) account for the highest median family income in Beaver Dam with $45,884 per family, while 2-person families (366 | 53.4%) have the highest median income of $22,942 per family member.
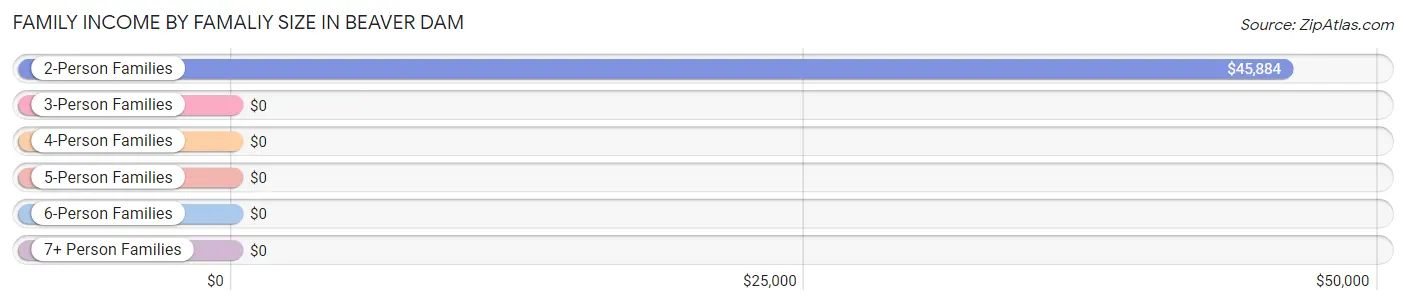
| Income Bracket | # Families | Median Income |
| 2-Person Families | 366 (53.4%) | $45,884 |
| 3-Person Families | 115 (16.8%) | $0 |
| 4-Person Families | 204 (29.8%) | $0 |
| 5-Person Families | 0 (0.0%) | $0 |
| 6-Person Families | 0 (0.0%) | $0 |
| 7+ Person Families | 0 (0.0%) | $0 |
| Total | 685 (100.0%) | $64,803 |
Family Income by Number of Earners in Beaver Dam
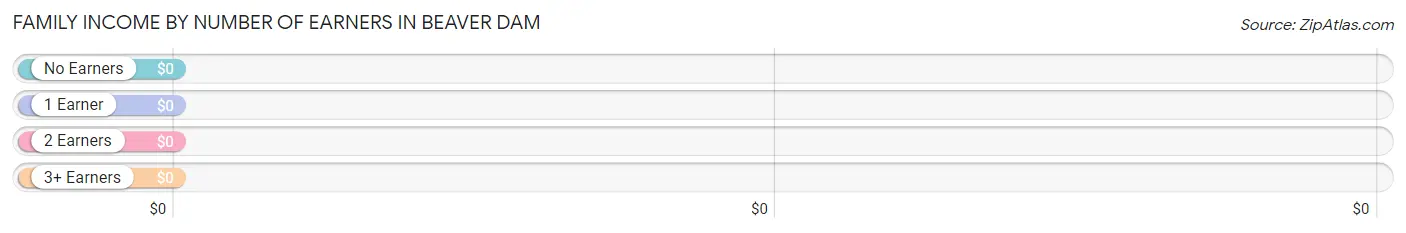
| Number of Earners | # Families | Median Income |
| No Earners | 148 (21.6%) | $0 |
| 1 Earner | 128 (18.7%) | $0 |
| 2 Earners | 205 (29.9%) | $0 |
| 3+ Earners | 204 (29.8%) | $0 |
| Total | 685 (100.0%) | $64,803 |
Household Income in Beaver Dam
Household Income Brackets in Beaver Dam
With 287 households falling in the category, the $75,000 to $99,999 income range is the most frequent in Beaver Dam, accounting for 29.6% of all households.
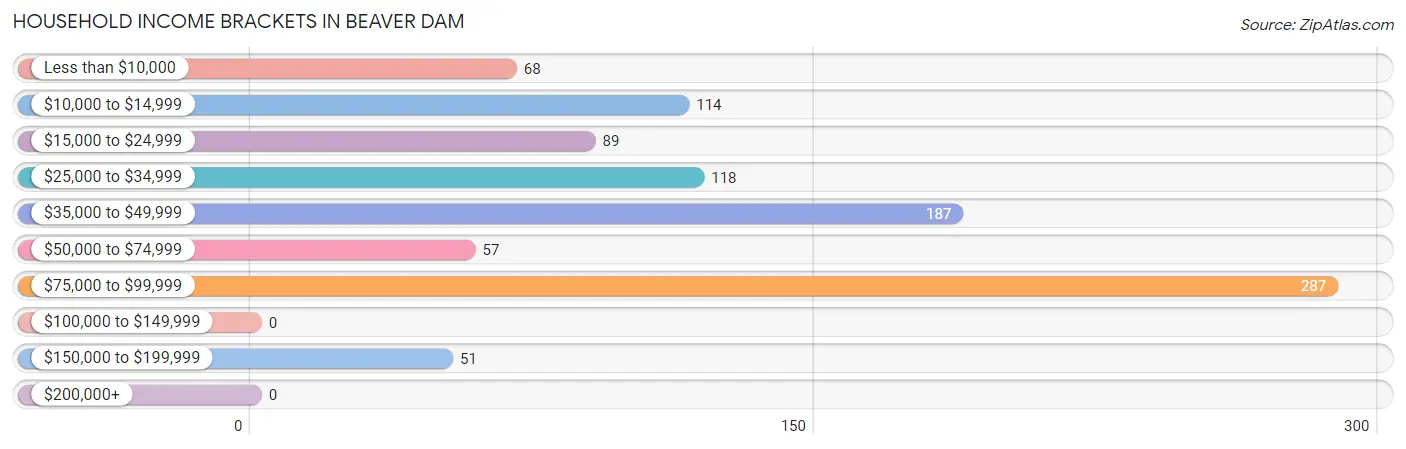
| Income Bracket | # Households | % Households |
| Less than $10,000 | 68 | 7.0% |
| $10,000 to $14,999 | 114 | 11.7% |
| $15,000 to $24,999 | 89 | 9.2% |
| $25,000 to $34,999 | 118 | 12.2% |
| $35,000 to $49,999 | 187 | 19.3% |
| $50,000 to $74,999 | 57 | 5.9% |
| $75,000 to $99,999 | 287 | 29.6% |
| $100,000 to $149,999 | 0 | 0.0% |
| $150,000 to $199,999 | 51 | 5.3% |
| $200,000+ | 0 | 0.0% |
Household Income by Householder Age in Beaver Dam
| Income Bracket | # Households | Median Income |
| 15 to 24 Years | 0 (0.0%) | $0 |
| 25 to 44 Years | 83 (8.6%) | $0 |
| 45 to 64 Years | 536 (55.2%) | $0 |
| 65+ Years | 352 (36.2%) | $0 |
| Total | 971 (100.0%) | $45,550 |
Poverty in Beaver Dam
Income Below Poverty by Sex and Age in Beaver Dam
With 24.9% poverty level for males and 16.8% for females among the residents of Beaver Dam, 12 to 14 year old males and 75 year old and over females are the most vulnerable to poverty, with 57 males (100.0%) and 68 females (100.0%) in their respective age groups living below the poverty level.
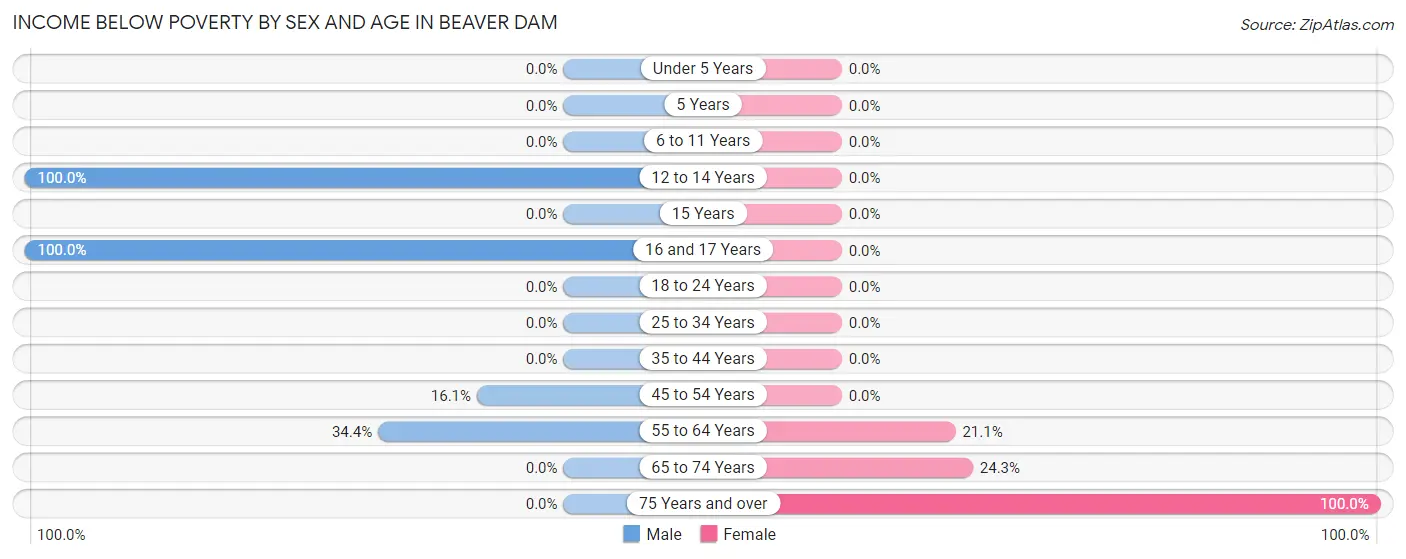
| Age Bracket | Male | Female |
| Under 5 Years | 0 (0.0%) | 0 (0.0%) |
| 5 Years | 0 (0.0%) | 0 (0.0%) |
| 6 to 11 Years | 0 (0.0%) | 0 (0.0%) |
| 12 to 14 Years | 57 (100.0%) | 0 (0.0%) |
| 15 Years | 0 (0.0%) | 0 (0.0%) |
| 16 and 17 Years | 82 (100.0%) | 0 (0.0%) |
| 18 to 24 Years | 0 (0.0%) | 0 (0.0%) |
| 25 to 34 Years | 0 (0.0%) | 0 (0.0%) |
| 35 to 44 Years | 0 (0.0%) | 0 (0.0%) |
| 45 to 54 Years | 61 (16.1%) | 0 (0.0%) |
| 55 to 64 Years | 32 (34.4%) | 50 (21.1%) |
| 65 to 74 Years | 0 (0.0%) | 64 (24.3%) |
| 75 Years and over | 0 (0.0%) | 68 (100.0%) |
| Total | 232 (24.9%) | 182 (16.8%) |
Income Above Poverty by Sex and Age in Beaver Dam
According to the poverty statistics in Beaver Dam, males aged 18 to 24 years and females aged 18 to 24 years are the age groups that are most secure financially, with 100.0% of males and 100.0% of females in these age groups living above the poverty line.
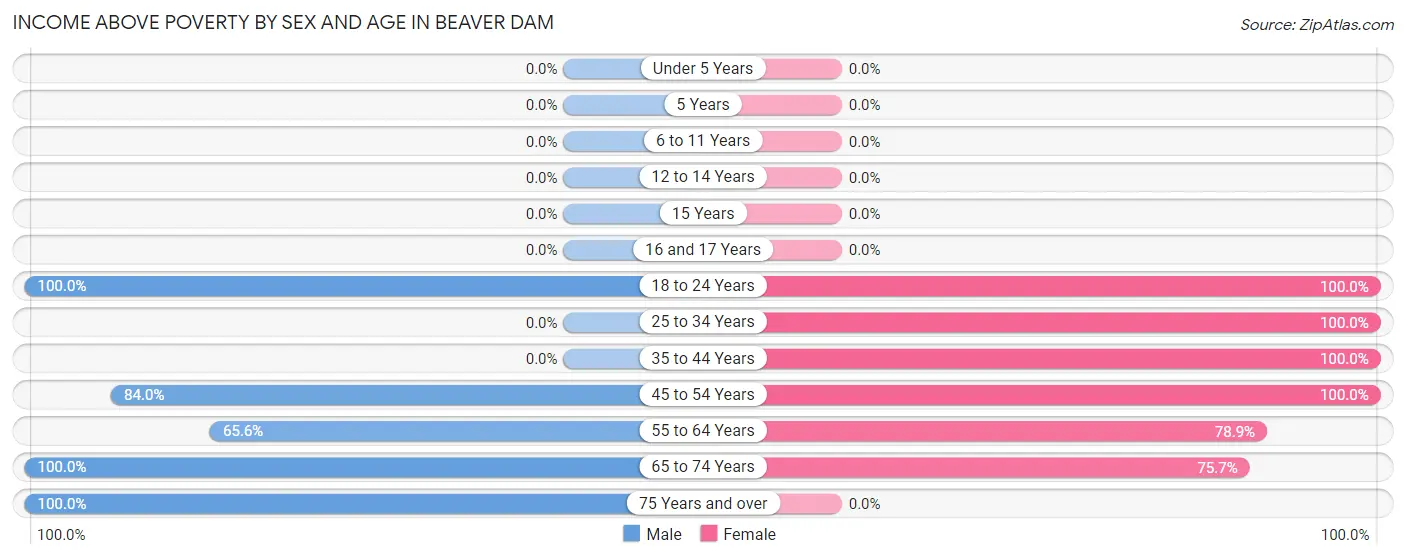
| Age Bracket | Male | Female |
| Under 5 Years | 0 (0.0%) | 0 (0.0%) |
| 5 Years | 0 (0.0%) | 0 (0.0%) |
| 6 to 11 Years | 0 (0.0%) | 0 (0.0%) |
| 12 to 14 Years | 0 (0.0%) | 0 (0.0%) |
| 15 Years | 0 (0.0%) | 0 (0.0%) |
| 16 and 17 Years | 0 (0.0%) | 0 (0.0%) |
| 18 to 24 Years | 100 (100.0%) | 63 (100.0%) |
| 25 to 34 Years | 0 (0.0%) | 148 (100.0%) |
| 35 to 44 Years | 0 (0.0%) | 83 (100.0%) |
| 45 to 54 Years | 319 (84.0%) | 219 (100.0%) |
| 55 to 64 Years | 61 (65.6%) | 187 (78.9%) |
| 65 to 74 Years | 173 (100.0%) | 199 (75.7%) |
| 75 Years and over | 47 (100.0%) | 0 (0.0%) |
| Total | 700 (75.1%) | 899 (83.2%) |
Income Below Poverty Among Married-Couple Families in Beaver Dam
| Children | Above Poverty | Below Poverty |
| No Children | 570 (100.0%) | 0 (0.0%) |
| 1 or 2 Children | 0 (0.0%) | 0 (0.0%) |
| 3 or 4 Children | 0 (0.0%) | 0 (0.0%) |
| 5 or more Children | 0 (0.0%) | 0 (0.0%) |
| Total | 570 (100.0%) | 0 (0.0%) |
Income Below Poverty Among Single-Parent Households in Beaver Dam
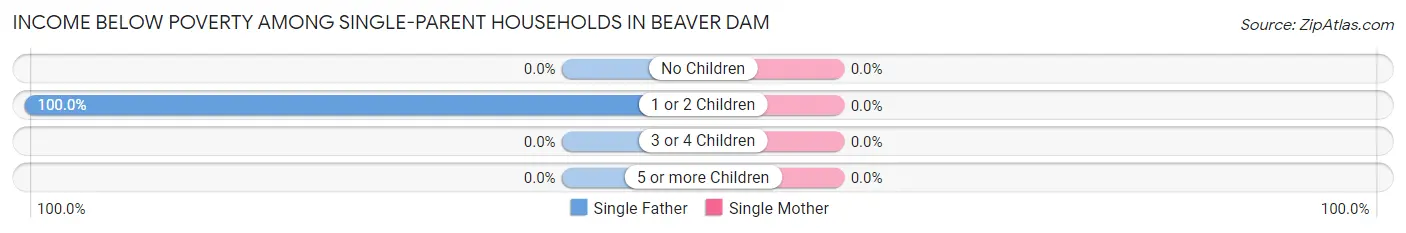
| Children | Single Father | Single Mother |
| No Children | 0 (0.0%) | 0 (0.0%) |
| 1 or 2 Children | 32 (100.0%) | 0 (0.0%) |
| 3 or 4 Children | 0 (0.0%) | 0 (0.0%) |
| 5 or more Children | 0 (0.0%) | 0 (0.0%) |
| Total | 32 (100.0%) | 0 (0.0%) |
Income Below Poverty Among Married-Couple vs Single-Parent Households in Beaver Dam
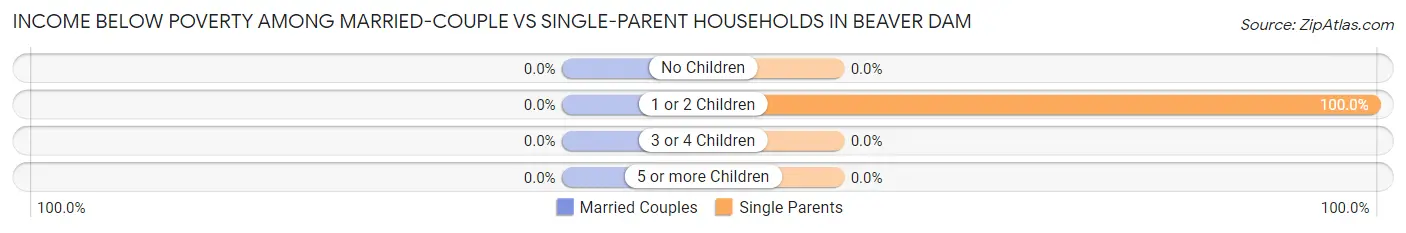
| Children | Married-Couple Families | Single-Parent Households |
| No Children | 0 (0.0%) | 0 (0.0%) |
| 1 or 2 Children | 0 (0.0%) | 32 (100.0%) |
| 3 or 4 Children | 0 (0.0%) | 0 (0.0%) |
| 5 or more Children | 0 (0.0%) | 0 (0.0%) |
| Total | 0 (0.0%) | 32 (27.8%) |
Race in Beaver Dam
The most populous races in Beaver Dam are Hispanic or Latino (1,151 | 57.2%), White / Caucasian (1,090 | 54.1%), and Some other Race (841 | 41.8%).
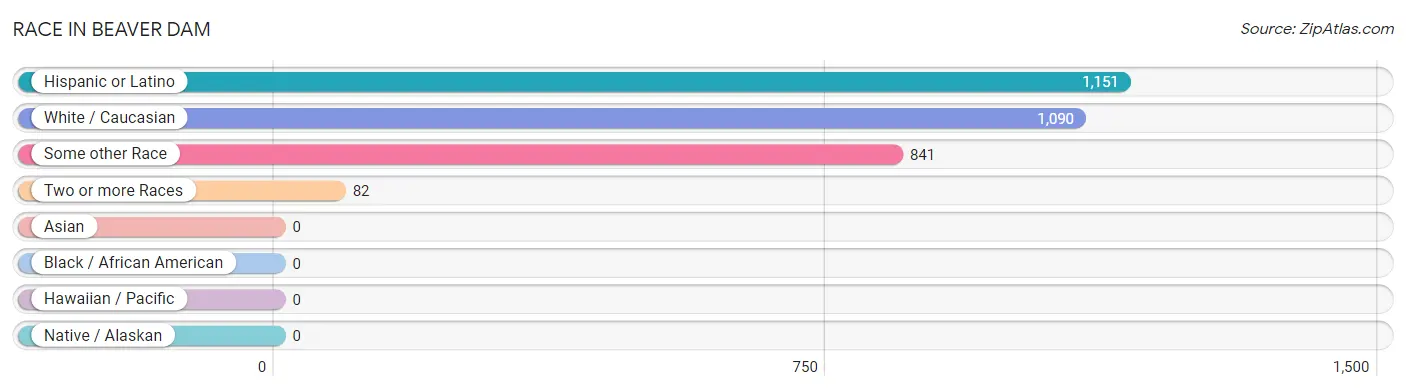
| Race | # Population | % Population |
| Asian | 0 | 0.0% |
| Black / African American | 0 | 0.0% |
| Hawaiian / Pacific | 0 | 0.0% |
| Hispanic or Latino | 1,151 | 57.2% |
| Native / Alaskan | 0 | 0.0% |
| White / Caucasian | 1,090 | 54.1% |
| Two or more Races | 82 | 4.1% |
| Some other Race | 841 | 41.8% |
| Total | 2,013 | 100.0% |
Ancestry in Beaver Dam
The most populous ancestries reported in Beaver Dam are Mexican (777 | 38.6%), English (391 | 19.4%), Irish (285 | 14.2%), Italian (139 | 6.9%), and German (137 | 6.8%), together accounting for 85.9% of all Beaver Dam residents.
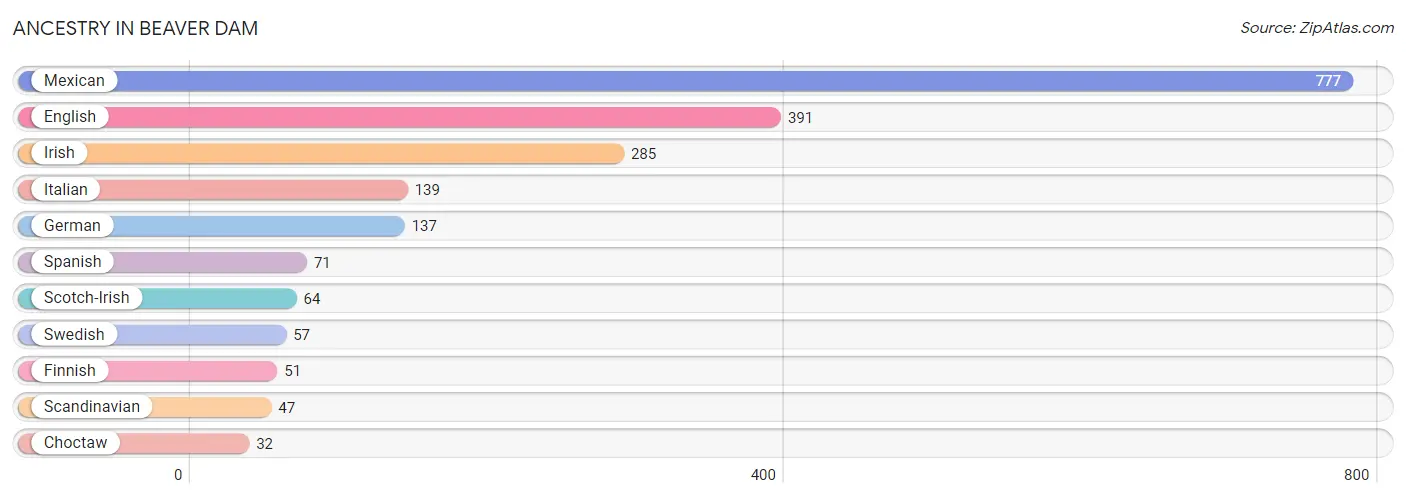
| Ancestry | # Population | % Population |
| Choctaw | 32 | 1.6% |
| English | 391 | 19.4% |
| Finnish | 51 | 2.5% |
| German | 137 | 6.8% |
| Irish | 285 | 14.2% |
| Italian | 139 | 6.9% |
| Mexican | 777 | 38.6% |
| Scandinavian | 47 | 2.3% |
| Scotch-Irish | 64 | 3.2% |
| Spanish | 71 | 3.5% |
| Swedish | 57 | 2.8% | View All 11 Rows |
Immigrants in Beaver Dam
The most numerous immigrant groups reported in Beaver Dam came from Central America (497 | 24.7%), Latin America (497 | 24.7%), and Mexico (497 | 24.7%), together accounting for 74.1% of all Beaver Dam residents.
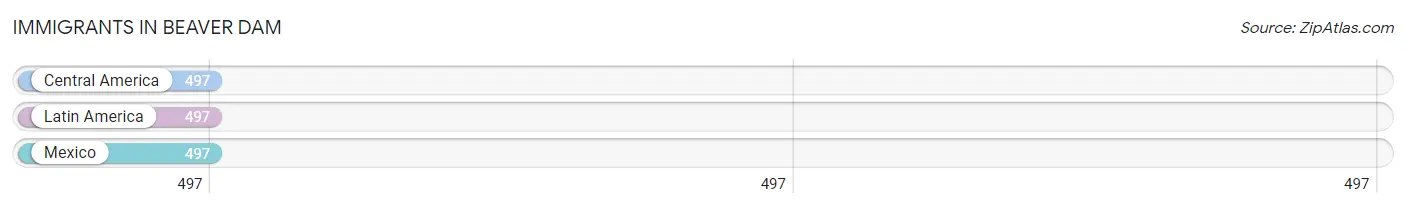
| Immigration Origin | # Population | % Population |
| Central America | 497 | 24.7% |
| Latin America | 497 | 24.7% |
| Mexico | 497 | 24.7% | View All 3 Rows |
Sex and Age in Beaver Dam
Sex and Age in Beaver Dam
The most populous age groups in Beaver Dam are 45 to 49 Years (248 | 26.6%) for men and 70 to 74 Years (263 | 24.3%) for women.
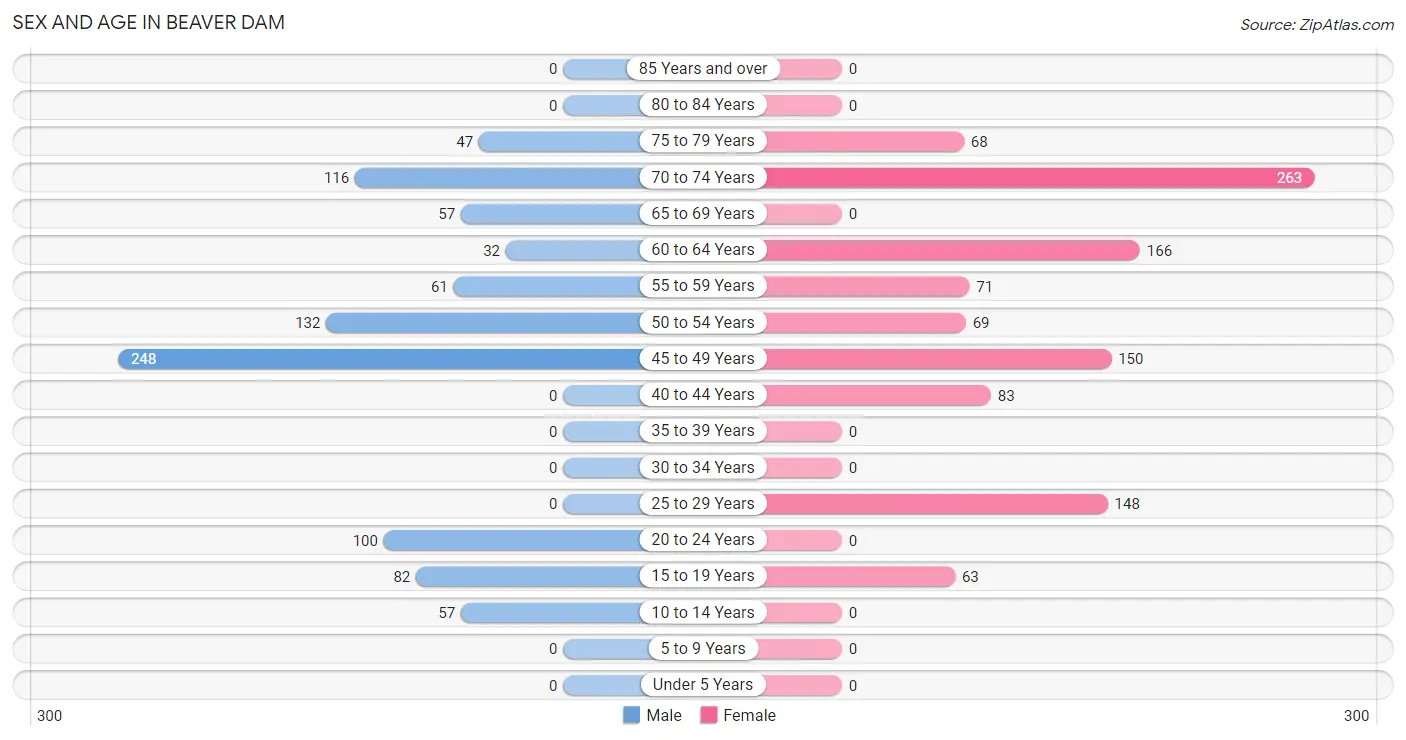
| Age Bracket | Male | Female |
| Under 5 Years | 0 (0.0%) | 0 (0.0%) |
| 5 to 9 Years | 0 (0.0%) | 0 (0.0%) |
| 10 to 14 Years | 57 (6.1%) | 0 (0.0%) |
| 15 to 19 Years | 82 (8.8%) | 63 (5.8%) |
| 20 to 24 Years | 100 (10.7%) | 0 (0.0%) |
| 25 to 29 Years | 0 (0.0%) | 148 (13.7%) |
| 30 to 34 Years | 0 (0.0%) | 0 (0.0%) |
| 35 to 39 Years | 0 (0.0%) | 0 (0.0%) |
| 40 to 44 Years | 0 (0.0%) | 83 (7.7%) |
| 45 to 49 Years | 248 (26.6%) | 150 (13.9%) |
| 50 to 54 Years | 132 (14.2%) | 69 (6.4%) |
| 55 to 59 Years | 61 (6.6%) | 71 (6.6%) |
| 60 to 64 Years | 32 (3.4%) | 166 (15.4%) |
| 65 to 69 Years | 57 (6.1%) | 0 (0.0%) |
| 70 to 74 Years | 116 (12.4%) | 263 (24.3%) |
| 75 to 79 Years | 47 (5.0%) | 68 (6.3%) |
| 80 to 84 Years | 0 (0.0%) | 0 (0.0%) |
| 85 Years and over | 0 (0.0%) | 0 (0.0%) |
| Total | 932 (100.0%) | 1,081 (100.0%) |
Families and Households in Beaver Dam
Median Family Size in Beaver Dam
The median family size in Beaver Dam is 2.43 persons per family, with single male/father families (32 | 4.7%) accounting for the largest median family size of 5.34 persons per family. On the other hand, married-couple families (570 | 83.2%) represent the smallest median family size with 2.19 persons per family.
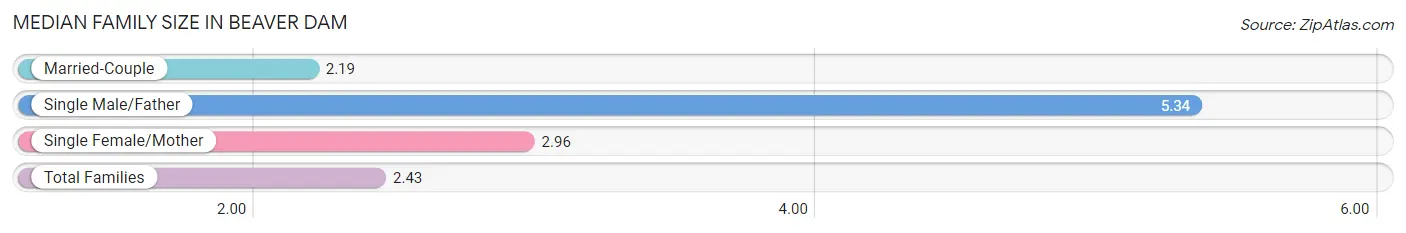
| Family Type | # Families | Family Size |
| Married-Couple | 570 (83.2%) | 2.19 |
| Single Male/Father | 32 (4.7%) | 5.34 |
| Single Female/Mother | 83 (12.1%) | 2.96 |
| Total Families | 685 (100.0%) | 2.43 |
Median Household Size in Beaver Dam
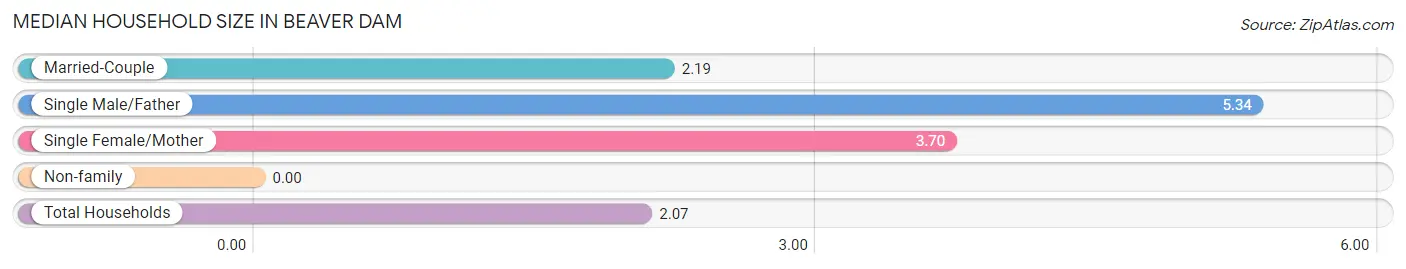
| Household Type | # Households | Household Size |
| Married-Couple | 570 (58.7%) | 2.19 |
| Single Male/Father | 32 (3.3%) | 5.34 |
| Single Female/Mother | 83 (8.6%) | 3.70 |
| Non-family | 286 (29.4%) | - |
| Total Households | 971 (100.0%) | 2.07 |
Household Size by Marriage Status in Beaver Dam
Out of a total of 971 households in Beaver Dam, 685 (70.6%) are family households, while 286 (29.4%) are nonfamily households. The most numerous type of family households are 2-person households, comprising 366, and the most common type of nonfamily households are 1-person households, comprising 286.
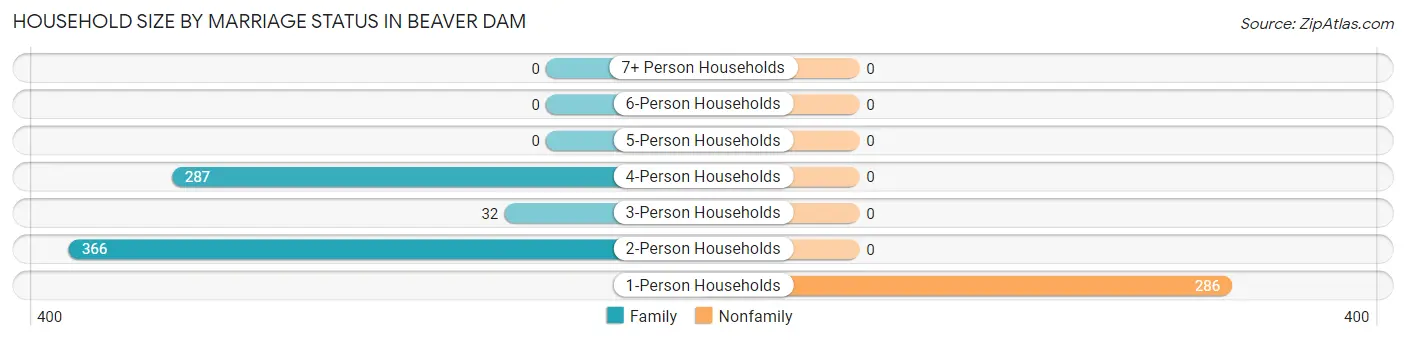
| Household Size | Family Households | Nonfamily Households |
| 1-Person Households | - | 286 (29.4%) |
| 2-Person Households | 366 (37.7%) | 0 (0.0%) |
| 3-Person Households | 32 (3.3%) | 0 (0.0%) |
| 4-Person Households | 287 (29.6%) | 0 (0.0%) |
| 5-Person Households | 0 (0.0%) | 0 (0.0%) |
| 6-Person Households | 0 (0.0%) | 0 (0.0%) |
| 7+ Person Households | 0 (0.0%) | 0 (0.0%) |
| Total | 685 (70.6%) | 286 (29.4%) |
Female Fertility in Beaver Dam
Fertility by Age in Beaver Dam
Average fertility rate in Beaver Dam is 123.0 births per 1,000 women. Women in the age bracket of 15 to 19 years have the highest fertility rate with 1,000.0 births per 1,000 women. Women in the age bracket of 15 to 19 years acount for 100.0% of all women with births.
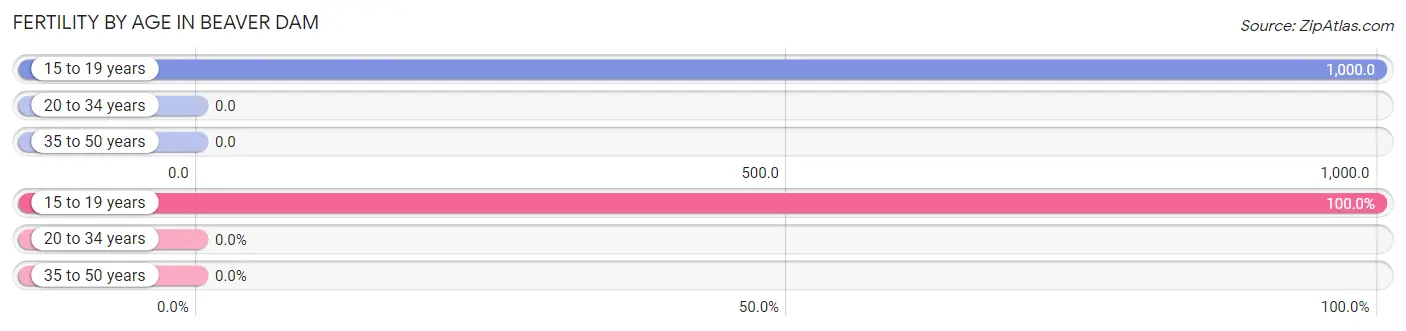
| Age Bracket | Women with Births | Births / 1,000 Women |
| 15 to 19 years | 63 (100.0%) | 1,000.0 |
| 20 to 34 years | 0 (0.0%) | 0.0 |
| 35 to 50 years | 0 (0.0%) | 0.0 |
| Total | 63 (100.0%) | 123.0 |
Fertility by Age by Marriage Status in Beaver Dam
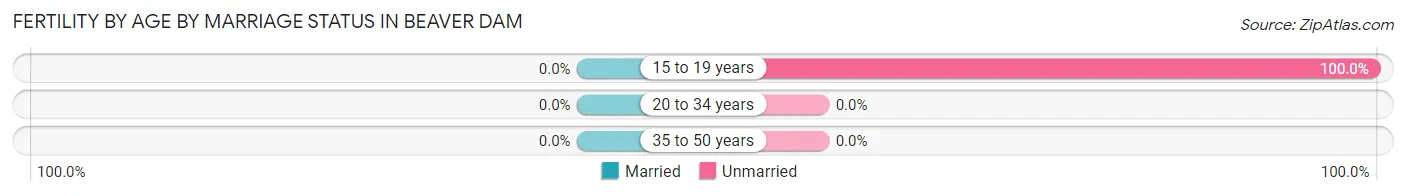
| Age Bracket | Married | Unmarried |
| 15 to 19 years | 0 (0.0%) | 63 (100.0%) |
| 20 to 34 years | 0 (0.0%) | 0 (0.0%) |
| 35 to 50 years | 0 (0.0%) | 0 (0.0%) |
| Total | 0 (0.0%) | 63 (100.0%) |
Fertility by Education in Beaver Dam
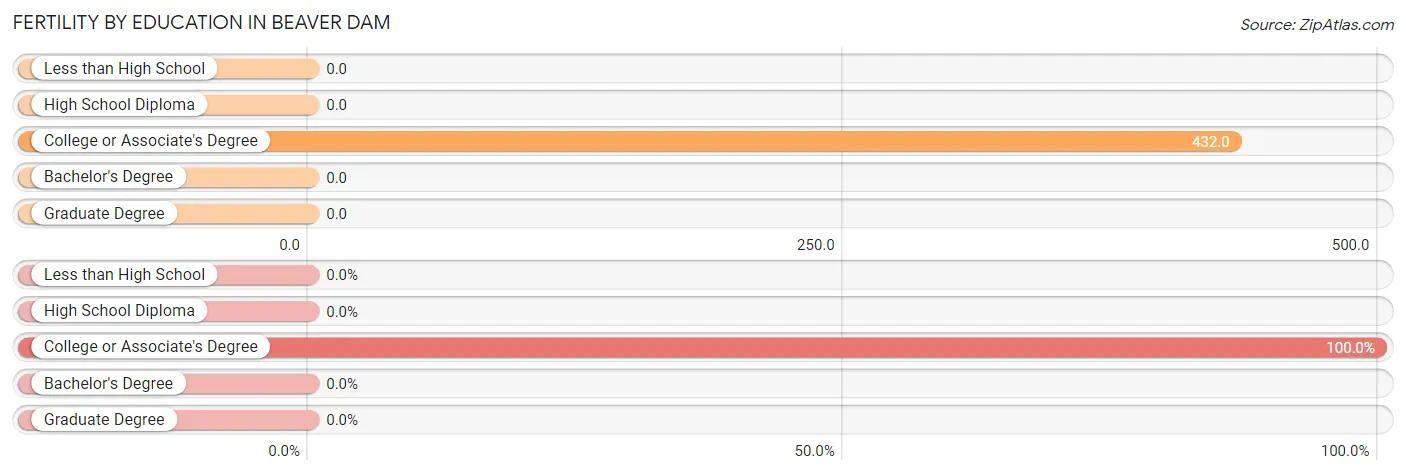
| Educational Attainment | Women with Births | Births / 1,000 Women |
| Less than High School | 0 (0.0%) | 0.0 |
| High School Diploma | 0 (0.0%) | 0.0 |
| College or Associate's Degree | 63 (100.0%) | 432.0 |
| Bachelor's Degree | 0 (0.0%) | 0.0 |
| Graduate Degree | 0 (0.0%) | 0.0 |
| Total | 63 (100.0%) | 123.0 |
Fertility by Education by Marriage Status in Beaver Dam
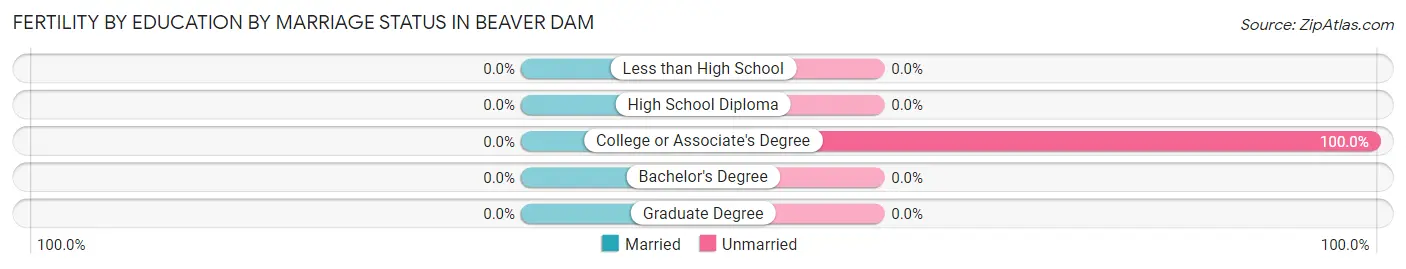
| Educational Attainment | Married | Unmarried |
| Less than High School | 0 (0.0%) | 0 (0.0%) |
| High School Diploma | 0 (0.0%) | 0 (0.0%) |
| College or Associate's Degree | 0 (0.0%) | 63 (100.0%) |
| Bachelor's Degree | 0 (0.0%) | 0 (0.0%) |
| Graduate Degree | 0 (0.0%) | 0 (0.0%) |
| Total | 0 (0.0%) | 63 (100.0%) |
Employment Characteristics in Beaver Dam
Employment by Class of Employer in Beaver Dam
Among the 928 employed individuals in Beaver Dam, private company employees (828 | 89.2%), and self-employed (not incorporated) (100 | 10.8%) make up the most common classes of employment.
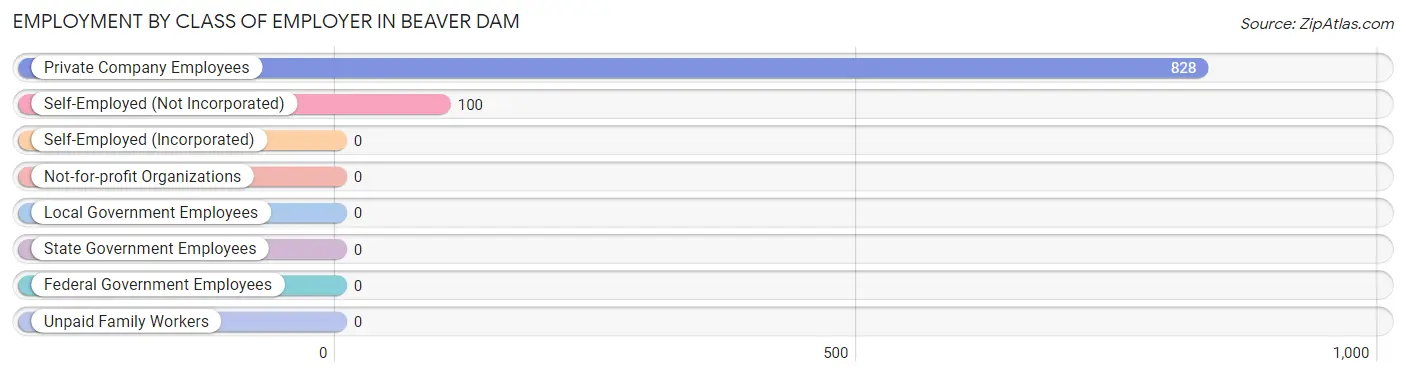
| Employer Class | # Employees | % Employees |
| Private Company Employees | 828 | 89.2% |
| Self-Employed (Incorporated) | 0 | 0.0% |
| Self-Employed (Not Incorporated) | 100 | 10.8% |
| Not-for-profit Organizations | 0 | 0.0% |
| Local Government Employees | 0 | 0.0% |
| State Government Employees | 0 | 0.0% |
| Federal Government Employees | 0 | 0.0% |
| Unpaid Family Workers | 0 | 0.0% |
| Total | 928 | 100.0% |
Employment Status by Age in Beaver Dam
According to the labor force statistics for Beaver Dam, out of the total population over 16 years of age (1,956), 54.2% or 1,060 individuals are in the labor force, with 7.7% or 82 of them unemployed. The age group with the highest labor force participation rate is 20 to 24 years, with 100.0% or 100 individuals in the labor force. Within the labor force, the 16 to 19 years age range has the highest percentage of unemployed individuals, with 100.0% or 82 of them being unemployed.
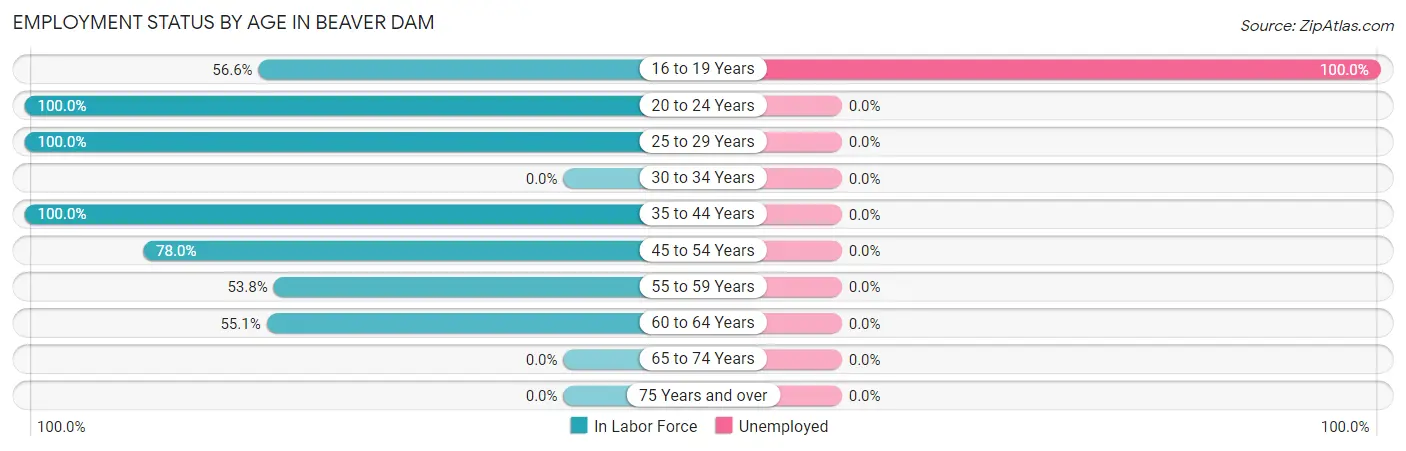
| Age Bracket | In Labor Force | Unemployed |
| 16 to 19 Years | 82 (56.6%) | 82 (100.0%) |
| 20 to 24 Years | 100 (100.0%) | 0 (0.0%) |
| 25 to 29 Years | 148 (100.0%) | 0 (0.0%) |
| 30 to 34 Years | 0 (0.0%) | 0 (0.0%) |
| 35 to 44 Years | 83 (100.0%) | 0 (0.0%) |
| 45 to 54 Years | 467 (78.0%) | 0 (0.0%) |
| 55 to 59 Years | 71 (53.8%) | 0 (0.0%) |
| 60 to 64 Years | 109 (55.1%) | 0 (0.0%) |
| 65 to 74 Years | 0 (0.0%) | 0 (0.0%) |
| 75 Years and over | 0 (0.0%) | 0 (0.0%) |
| Total | 1,060 (54.2%) | 82 (7.7%) |
Employment Status by Educational Attainment in Beaver Dam
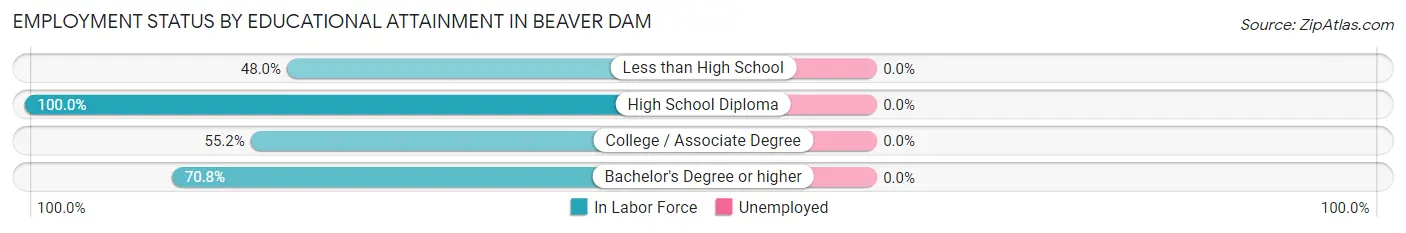
| Educational Attainment | In Labor Force | Unemployed |
| Less than High School | 109 (48.0%) | 0 (0.0%) |
| High School Diploma | 494 (100.0%) | 0 (0.0%) |
| College / Associate Degree | 127 (55.2%) | 0 (0.0%) |
| Bachelor's Degree or higher | 148 (70.8%) | 0 (0.0%) |
| Total | 878 (75.7%) | 0 (0.0%) |
Employment Occupations by Sex in Beaver Dam
Management, Business, Science and Arts Occupations
Management, Business, Science and Arts Occupations by Sex
| Occupation | Male | Female |
| Management | 0 (0.0%) | 0 (0.0%) |
| Business & Financial | 0 (0.0%) | 0 (0.0%) |
| Computers, Engineering & Science | 0 (0.0%) | 0 (0.0%) |
| Computers & Mathematics | 0 (0.0%) | 0 (0.0%) |
| Architecture & Engineering | 0 (0.0%) | 0 (0.0%) |
| Life, Physical & Social Science | 0 (0.0%) | 0 (0.0%) |
| Community & Social Service | 0 (0.0%) | 0 (0.0%) |
| Education, Arts & Media | 0 (0.0%) | 0 (0.0%) |
| Legal Services & Support | 0 (0.0%) | 0 (0.0%) |
| Education Instruction & Library | 0 (0.0%) | 0 (0.0%) |
| Arts, Media & Entertainment | 0 (0.0%) | 0 (0.0%) |
| Health Diagnosing & Treating | 0 (0.0%) | 0 (0.0%) |
| Health Technologists | 0 (0.0%) | 0 (0.0%) |
| Total (Category) | 0 (0.0%) | 0 (0.0%) |
| Total (Overall) | 348 (35.6%) | 630 (64.4%) |
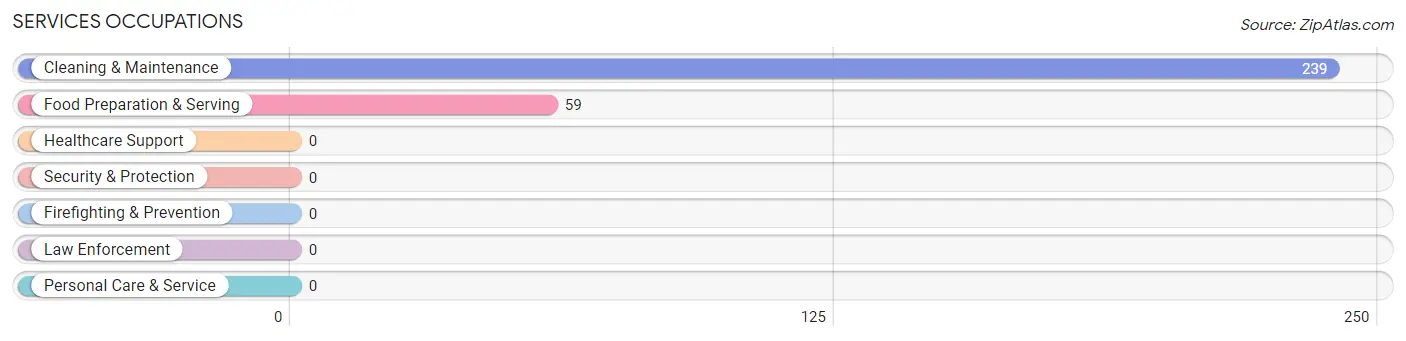
Services Occupations
The most common Services occupations in Beaver Dam are Cleaning & Maintenance (239 | 24.4%), and Food Preparation & Serving (59 | 6.0%).
Services Occupations by Sex
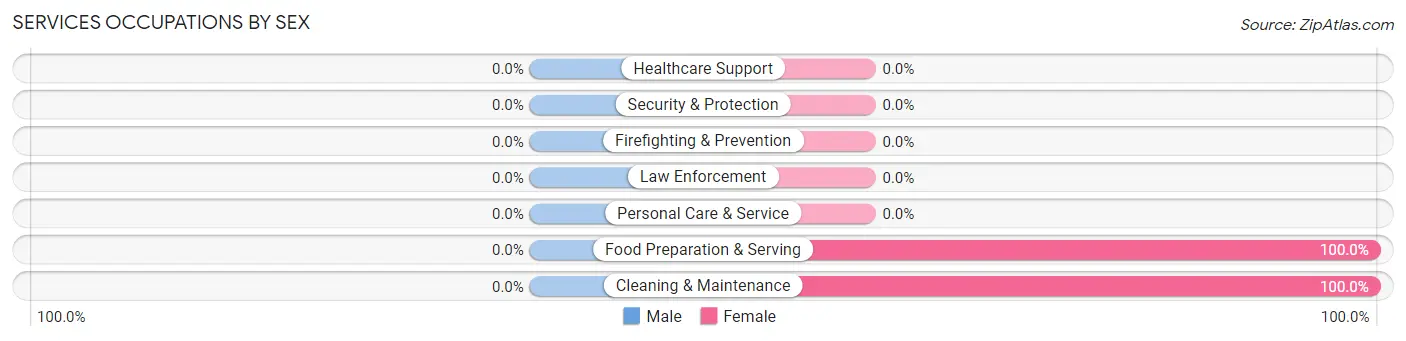
| Occupation | Male | Female |
| Healthcare Support | 0 (0.0%) | 0 (0.0%) |
| Security & Protection | 0 (0.0%) | 0 (0.0%) |
| Firefighting & Prevention | 0 (0.0%) | 0 (0.0%) |
| Law Enforcement | 0 (0.0%) | 0 (0.0%) |
| Food Preparation & Serving | 0 (0.0%) | 59 (100.0%) |
| Cleaning & Maintenance | 0 (0.0%) | 239 (100.0%) |
| Personal Care & Service | 0 (0.0%) | 0 (0.0%) |
| Total (Category) | 0 (0.0%) | 298 (100.0%) |
| Total (Overall) | 348 (35.6%) | 630 (64.4%) |
Sales and Office Occupations
The most common Sales and Office occupations in Beaver Dam are Office & Administration (231 | 23.6%), and Sales & Related (95 | 9.7%).
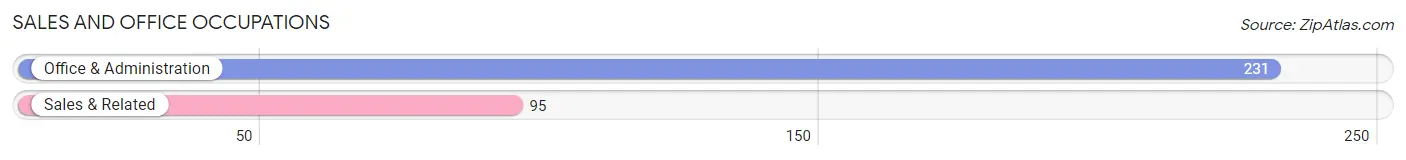
Sales and Office Occupations by Sex
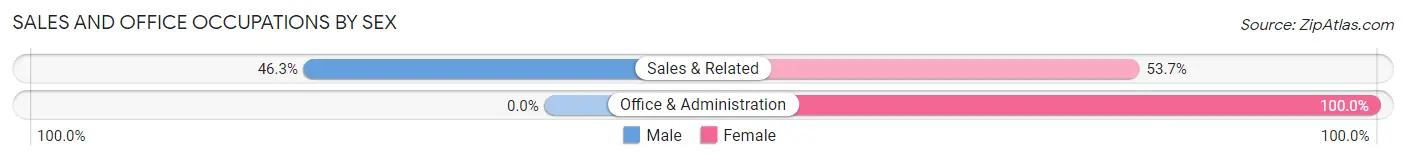
| Occupation | Male | Female |
| Sales & Related | 44 (46.3%) | 51 (53.7%) |
| Office & Administration | 0 (0.0%) | 231 (100.0%) |
| Total (Category) | 44 (13.5%) | 282 (86.5%) |
| Total (Overall) | 348 (35.6%) | 630 (64.4%) |
Natural Resources, Construction and Maintenance Occupations
The most common Natural Resources, Construction and Maintenance occupations in Beaver Dam are , and Construction & Extraction (304 | 31.1%).
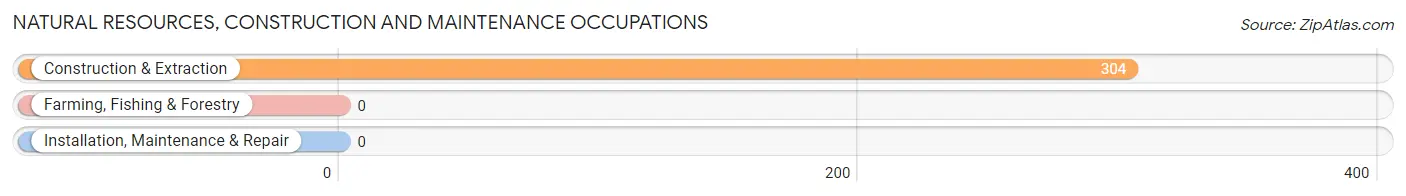
Natural Resources, Construction and Maintenance Occupations by Sex
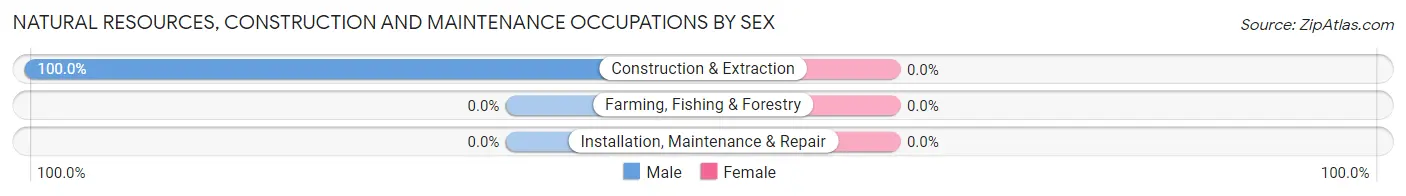
| Occupation | Male | Female |
| Farming, Fishing & Forestry | 0 (0.0%) | 0 (0.0%) |
| Construction & Extraction | 304 (100.0%) | 0 (0.0%) |
| Installation, Maintenance & Repair | 0 (0.0%) | 0 (0.0%) |
| Total (Category) | 304 (100.0%) | 0 (0.0%) |
| Total (Overall) | 348 (35.6%) | 630 (64.4%) |
Production, Transportation and Moving Occupations
The most common Production, Transportation and Moving occupations in Beaver Dam are , and Production (50 | 5.1%).
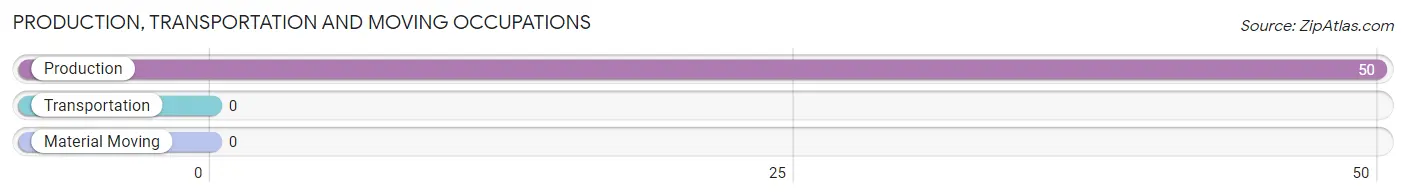
Production, Transportation and Moving Occupations by Sex
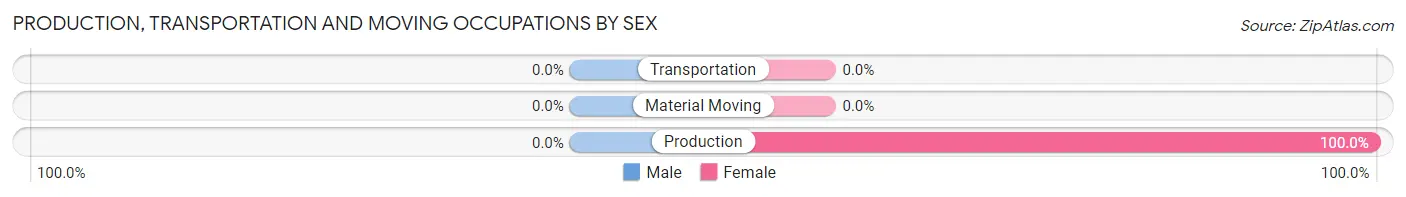
| Occupation | Male | Female |
| Production | 0 (0.0%) | 50 (100.0%) |
| Transportation | 0 (0.0%) | 0 (0.0%) |
| Material Moving | 0 (0.0%) | 0 (0.0%) |
| Total (Category) | 0 (0.0%) | 50 (100.0%) |
| Total (Overall) | 348 (35.6%) | 630 (64.4%) |
Employment Industries by Sex in Beaver Dam
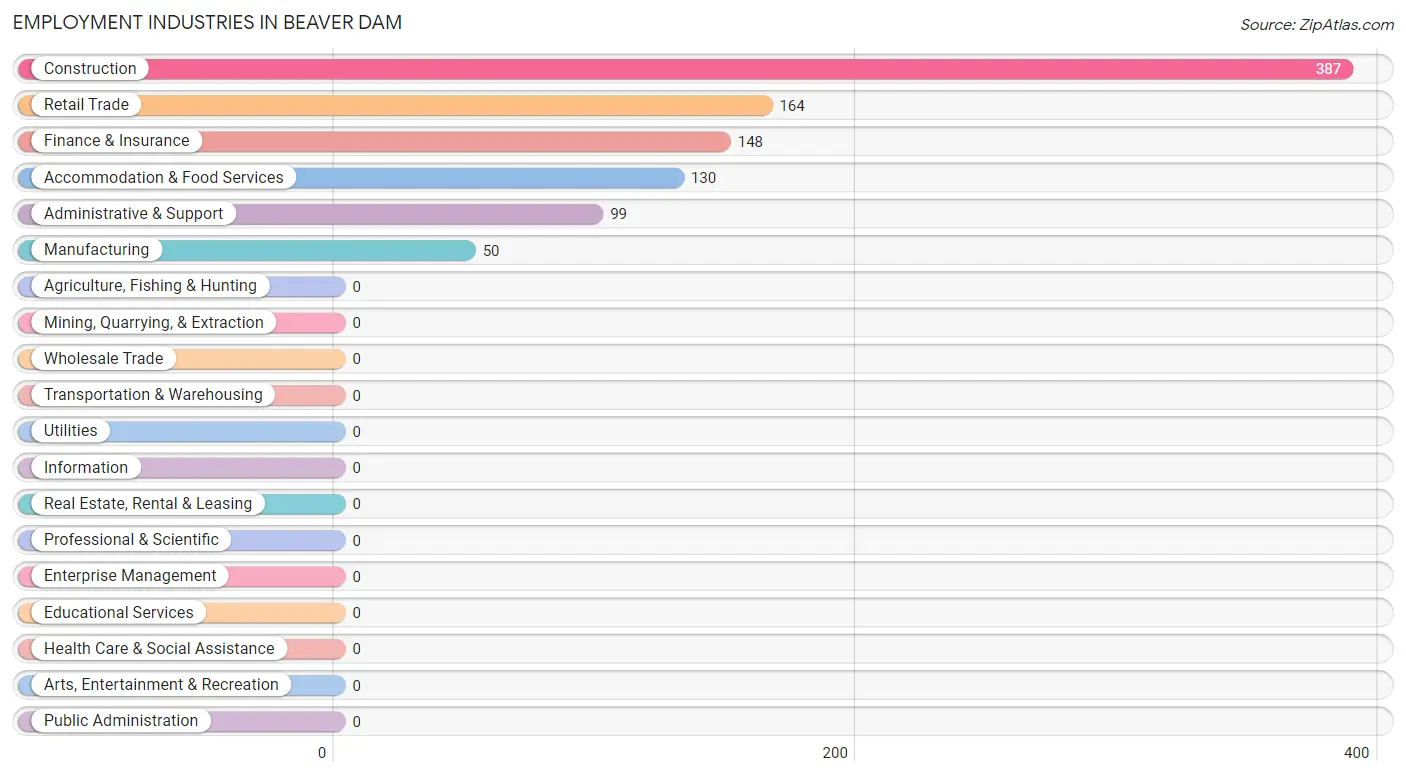
Employment Industries in Beaver Dam
The major employment industries in Beaver Dam include Construction (387 | 39.6%), Retail Trade (164 | 16.8%), Finance & Insurance (148 | 15.1%), Accommodation & Food Services (130 | 13.3%), and Administrative & Support (99 | 10.1%).
Employment Industries by Sex in Beaver Dam
The Beaver Dam industries that see more men than women are Construction (78.5%), and Retail Trade (26.8%), whereas the industries that tend to have a higher number of women are Manufacturing (100.0%), Finance & Insurance (100.0%), and Administrative & Support (100.0%).
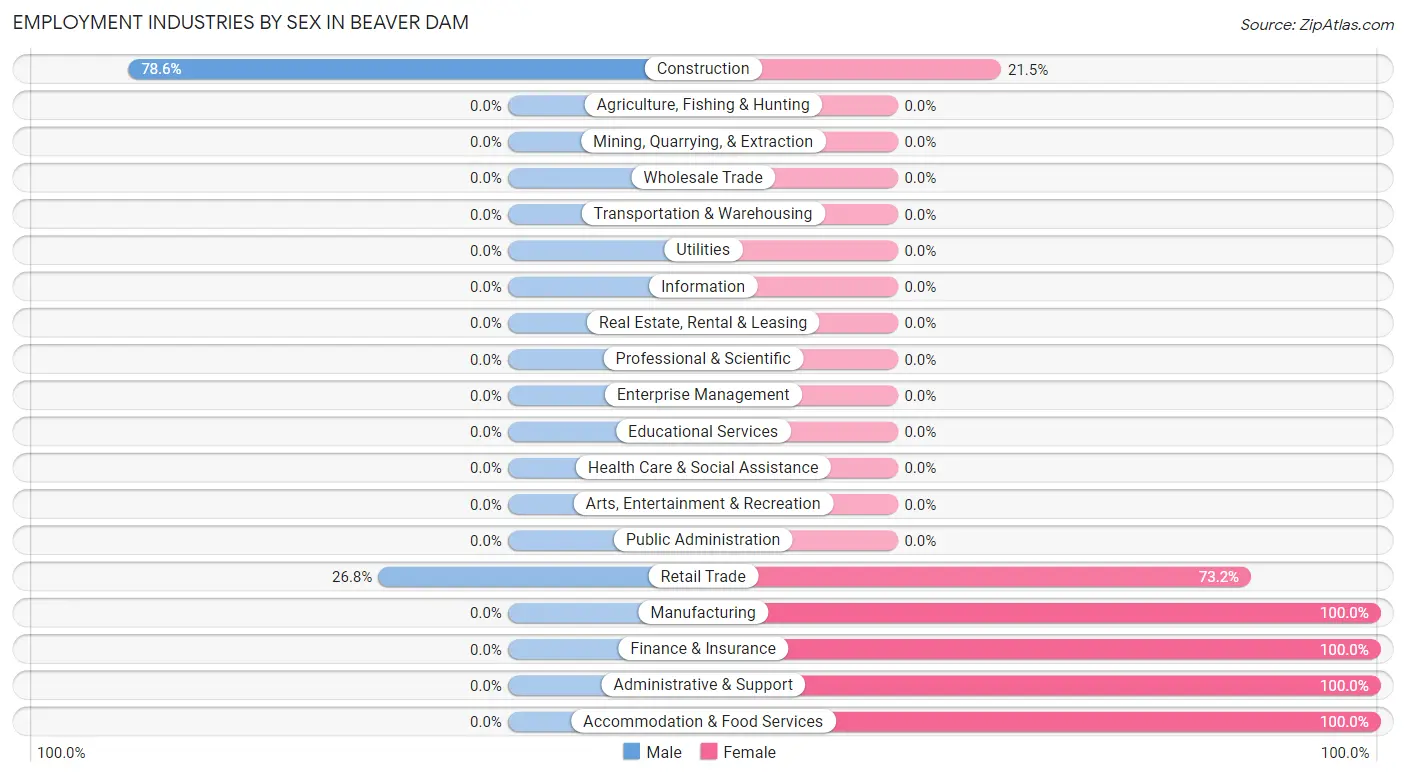
| Industry | Male | Female |
| Agriculture, Fishing & Hunting | 0 (0.0%) | 0 (0.0%) |
| Mining, Quarrying, & Extraction | 0 (0.0%) | 0 (0.0%) |
| Construction | 304 (78.5%) | 83 (21.4%) |
| Manufacturing | 0 (0.0%) | 50 (100.0%) |
| Wholesale Trade | 0 (0.0%) | 0 (0.0%) |
| Retail Trade | 44 (26.8%) | 120 (73.2%) |
| Transportation & Warehousing | 0 (0.0%) | 0 (0.0%) |
| Utilities | 0 (0.0%) | 0 (0.0%) |
| Information | 0 (0.0%) | 0 (0.0%) |
| Finance & Insurance | 0 (0.0%) | 148 (100.0%) |
| Real Estate, Rental & Leasing | 0 (0.0%) | 0 (0.0%) |
| Professional & Scientific | 0 (0.0%) | 0 (0.0%) |
| Enterprise Management | 0 (0.0%) | 0 (0.0%) |
| Administrative & Support | 0 (0.0%) | 99 (100.0%) |
| Educational Services | 0 (0.0%) | 0 (0.0%) |
| Health Care & Social Assistance | 0 (0.0%) | 0 (0.0%) |
| Arts, Entertainment & Recreation | 0 (0.0%) | 0 (0.0%) |
| Accommodation & Food Services | 0 (0.0%) | 130 (100.0%) |
| Public Administration | 0 (0.0%) | 0 (0.0%) |
| Total | 348 (35.6%) | 630 (64.4%) |
Education in Beaver Dam
School Enrollment in Beaver Dam
The most common levels of schooling among the 120 students in Beaver Dam are college / undergraduate (63 | 52.5%), and middle school (57 | 47.5%).
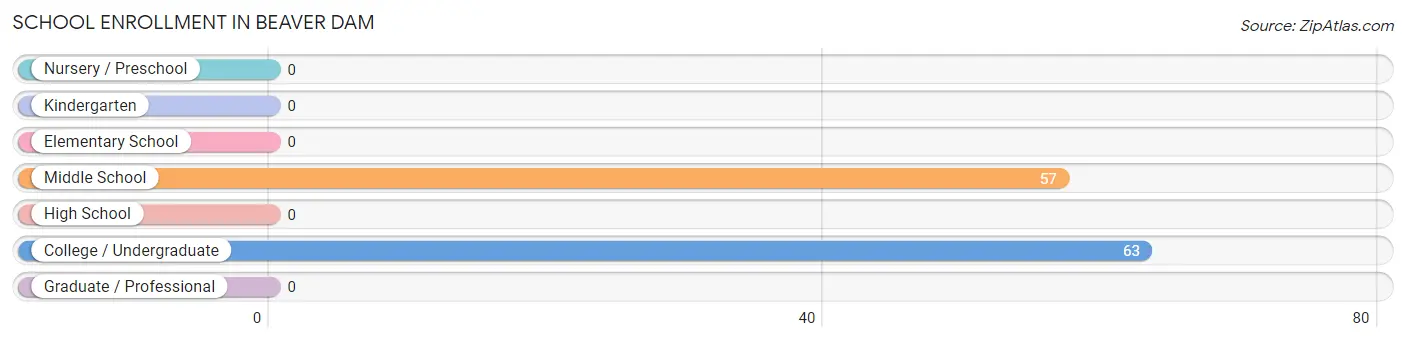
| School Level | # Students | % Students |
| Nursery / Preschool | 0 | 0.0% |
| Kindergarten | 0 | 0.0% |
| Elementary School | 0 | 0.0% |
| Middle School | 57 | 47.5% |
| High School | 0 | 0.0% |
| College / Undergraduate | 63 | 52.5% |
| Graduate / Professional | 0 | 0.0% |
| Total | 120 | 100.0% |
School Enrollment by Age by Funding Source in Beaver Dam
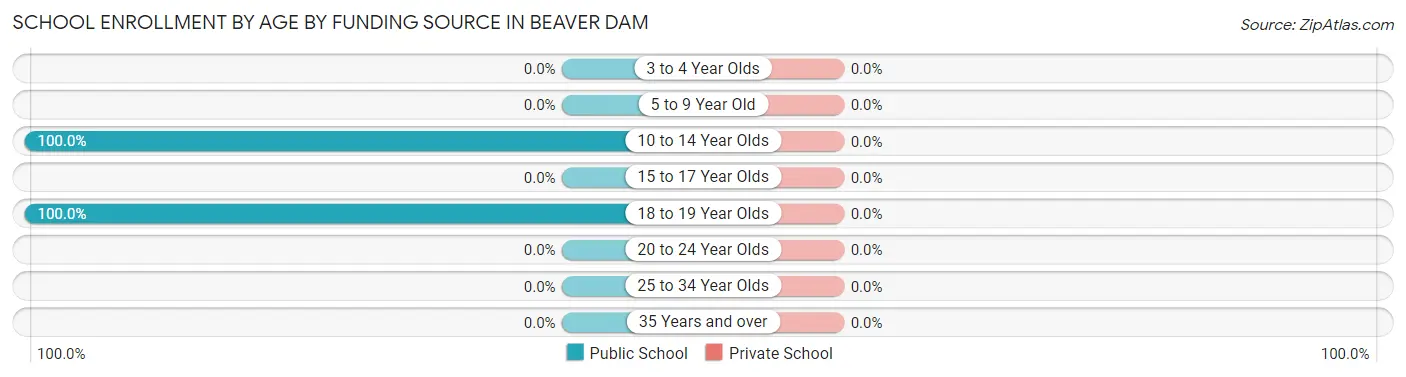
| Age Bracket | Public School | Private School |
| 3 to 4 Year Olds | 0 (0.0%) | 0 (0.0%) |
| 5 to 9 Year Old | 0 (0.0%) | 0 (0.0%) |
| 10 to 14 Year Olds | 57 (100.0%) | 0 (0.0%) |
| 15 to 17 Year Olds | 0 (0.0%) | 0 (0.0%) |
| 18 to 19 Year Olds | 63 (100.0%) | 0 (0.0%) |
| 20 to 24 Year Olds | 0 (0.0%) | 0 (0.0%) |
| 25 to 34 Year Olds | 0 (0.0%) | 0 (0.0%) |
| 35 Years and over | 0 (0.0%) | 0 (0.0%) |
| Total | 120 (100.0%) | 0 (0.0%) |
Educational Attainment by Field of Study in Beaver Dam
Multidisciplinary studies (148 | 57.8%), education (61 | 23.8%), and visual & performing arts (47 | 18.4%) are the most common fields of study among 256 individuals in Beaver Dam who have obtained a bachelor's degree or higher.
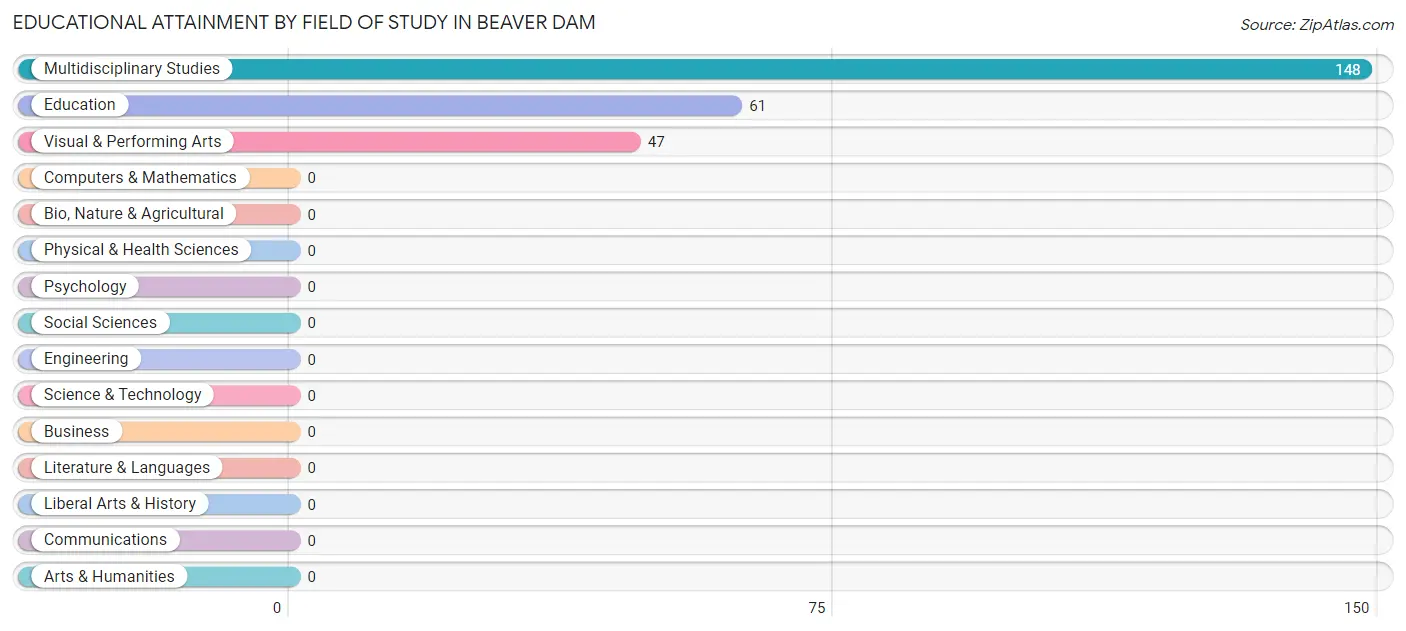
| Field of Study | # Graduates | % Graduates |
| Computers & Mathematics | 0 | 0.0% |
| Bio, Nature & Agricultural | 0 | 0.0% |
| Physical & Health Sciences | 0 | 0.0% |
| Psychology | 0 | 0.0% |
| Social Sciences | 0 | 0.0% |
| Engineering | 0 | 0.0% |
| Multidisciplinary Studies | 148 | 57.8% |
| Science & Technology | 0 | 0.0% |
| Business | 0 | 0.0% |
| Education | 61 | 23.8% |
| Literature & Languages | 0 | 0.0% |
| Liberal Arts & History | 0 | 0.0% |
| Visual & Performing Arts | 47 | 18.4% |
| Communications | 0 | 0.0% |
| Arts & Humanities | 0 | 0.0% |
| Total | 256 | 100.0% |
Transportation & Commute in Beaver Dam
Vehicle Availability by Sex in Beaver Dam
The most prevalent vehicle ownership categories in Beaver Dam are males with 4 vehicles (304, accounting for 87.4%) and females with 4 vehicles (330, making up 52.4%).
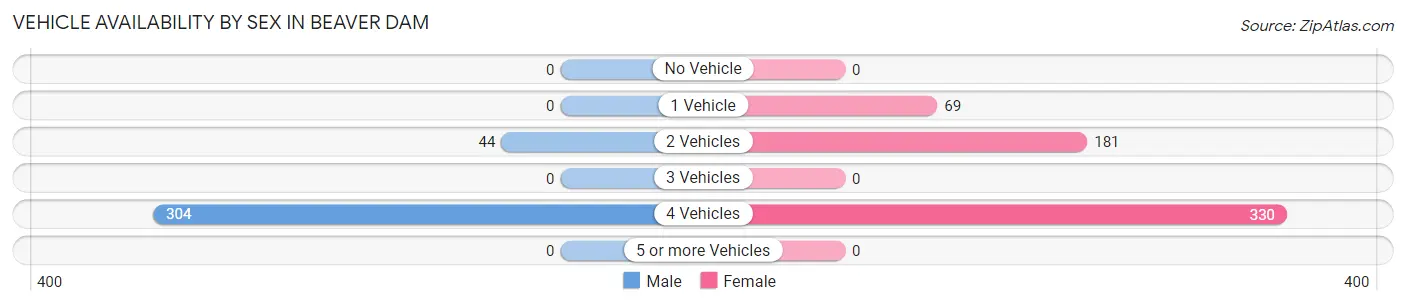
| Vehicles Available | Male | Female |
| No Vehicle | 0 (0.0%) | 0 (0.0%) |
| 1 Vehicle | 0 (0.0%) | 69 (11.9%) |
| 2 Vehicles | 44 (12.6%) | 181 (31.2%) |
| 3 Vehicles | 0 (0.0%) | 0 (0.0%) |
| 4 Vehicles | 304 (87.4%) | 330 (56.9%) |
| 5 or more Vehicles | 0 (0.0%) | 0 (0.0%) |
| Total | 348 (100.0%) | 580 (100.0%) |
Commute Time in Beaver Dam
The most frequently occuring commute durations in Beaver Dam are 45 to 59 minutes (247 commuters, 26.6%), 15 to 19 minutes (235 commuters, 25.3%), and 20 to 24 minutes (204 commuters, 22.0%).
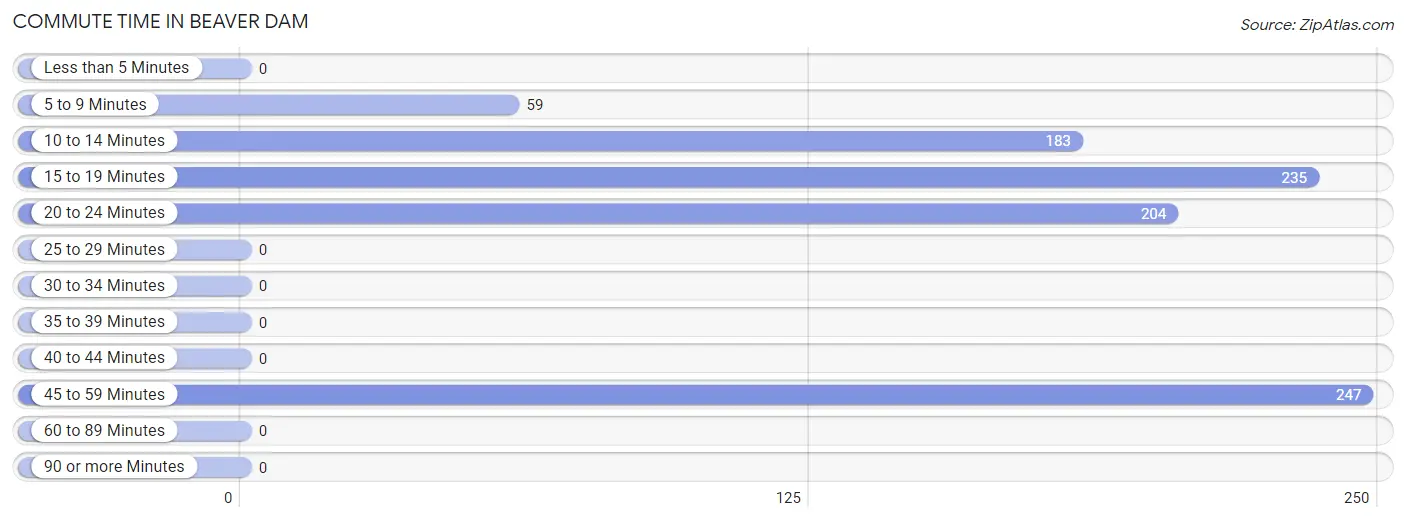
| Commute Time | # Commuters | % Commuters |
| Less than 5 Minutes | 0 | 0.0% |
| 5 to 9 Minutes | 59 | 6.4% |
| 10 to 14 Minutes | 183 | 19.7% |
| 15 to 19 Minutes | 235 | 25.3% |
| 20 to 24 Minutes | 204 | 22.0% |
| 25 to 29 Minutes | 0 | 0.0% |
| 30 to 34 Minutes | 0 | 0.0% |
| 35 to 39 Minutes | 0 | 0.0% |
| 40 to 44 Minutes | 0 | 0.0% |
| 45 to 59 Minutes | 247 | 26.6% |
| 60 to 89 Minutes | 0 | 0.0% |
| 90 or more Minutes | 0 | 0.0% |
Commute Time by Sex in Beaver Dam
The most common commute times in Beaver Dam are 20 to 24 minutes (204 commuters, 58.6%) for males and 45 to 59 minutes (247 commuters, 42.6%) for females.
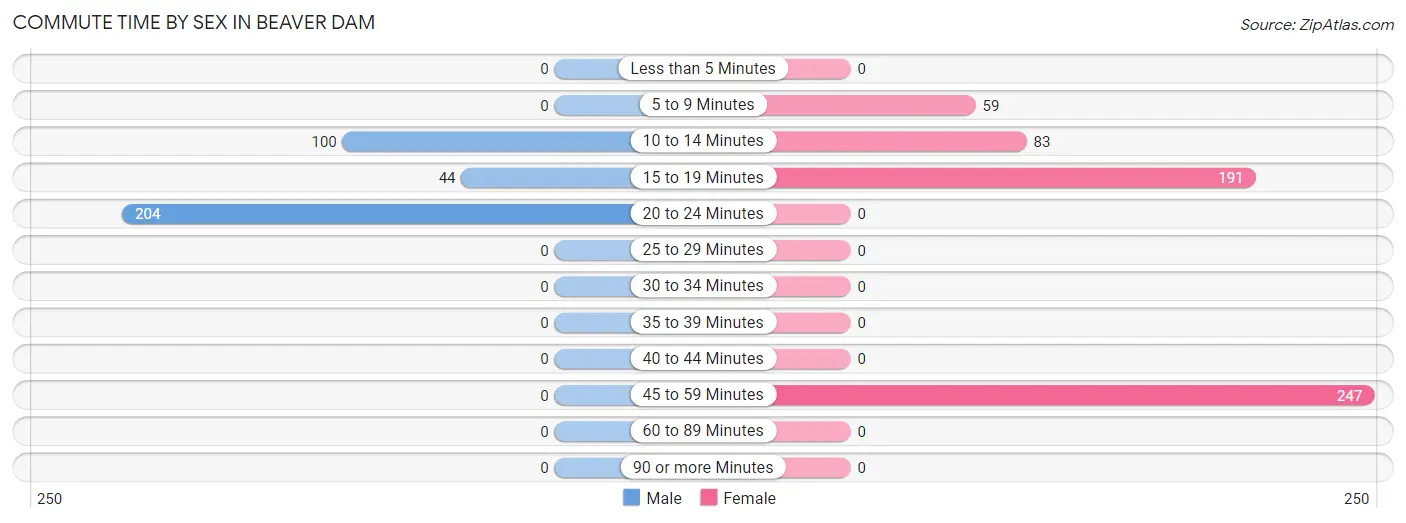
| Commute Time | Male | Female |
| Less than 5 Minutes | 0 (0.0%) | 0 (0.0%) |
| 5 to 9 Minutes | 0 (0.0%) | 59 (10.2%) |
| 10 to 14 Minutes | 100 (28.7%) | 83 (14.3%) |
| 15 to 19 Minutes | 44 (12.6%) | 191 (32.9%) |
| 20 to 24 Minutes | 204 (58.6%) | 0 (0.0%) |
| 25 to 29 Minutes | 0 (0.0%) | 0 (0.0%) |
| 30 to 34 Minutes | 0 (0.0%) | 0 (0.0%) |
| 35 to 39 Minutes | 0 (0.0%) | 0 (0.0%) |
| 40 to 44 Minutes | 0 (0.0%) | 0 (0.0%) |
| 45 to 59 Minutes | 0 (0.0%) | 247 (42.6%) |
| 60 to 89 Minutes | 0 (0.0%) | 0 (0.0%) |
| 90 or more Minutes | 0 (0.0%) | 0 (0.0%) |
Time of Departure to Work by Sex in Beaver Dam
The most frequent times of departure to work in Beaver Dam are 5:00 AM to 5:29 AM (204, 58.6%) for males and 7:00 AM to 7:29 AM (318, 54.8%) for females.
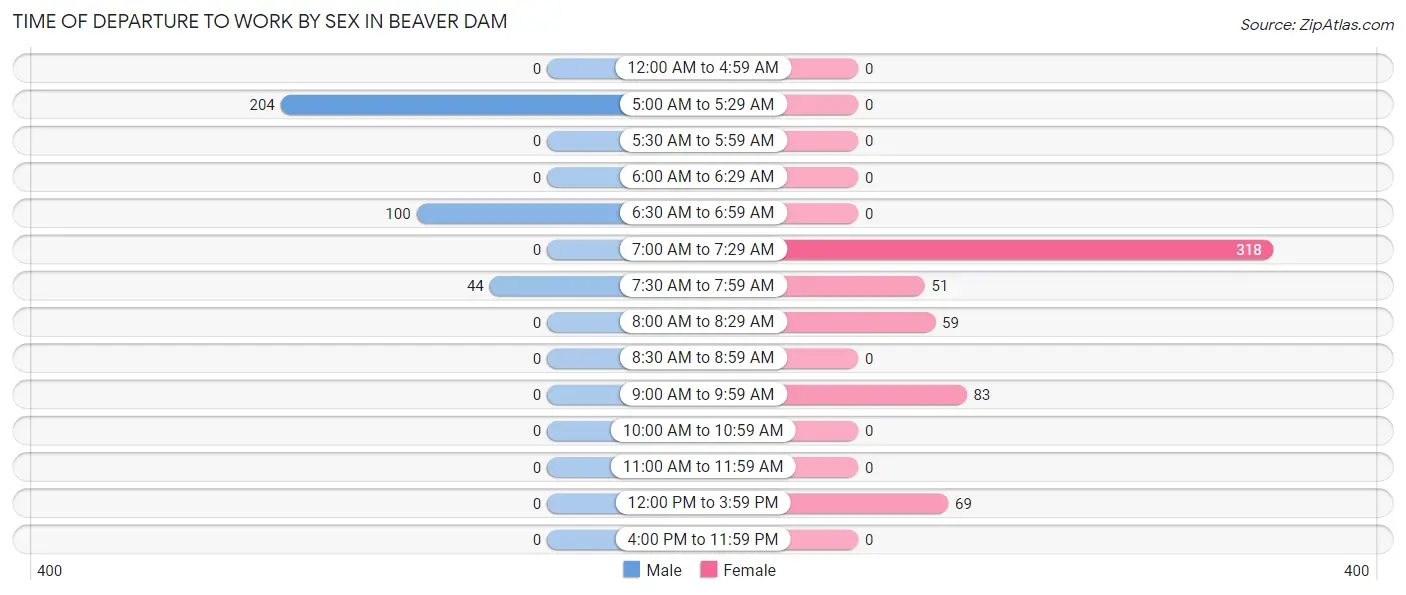
| Time of Departure | Male | Female |
| 12:00 AM to 4:59 AM | 0 (0.0%) | 0 (0.0%) |
| 5:00 AM to 5:29 AM | 204 (58.6%) | 0 (0.0%) |
| 5:30 AM to 5:59 AM | 0 (0.0%) | 0 (0.0%) |
| 6:00 AM to 6:29 AM | 0 (0.0%) | 0 (0.0%) |
| 6:30 AM to 6:59 AM | 100 (28.7%) | 0 (0.0%) |
| 7:00 AM to 7:29 AM | 0 (0.0%) | 318 (54.8%) |
| 7:30 AM to 7:59 AM | 44 (12.6%) | 51 (8.8%) |
| 8:00 AM to 8:29 AM | 0 (0.0%) | 59 (10.2%) |
| 8:30 AM to 8:59 AM | 0 (0.0%) | 0 (0.0%) |
| 9:00 AM to 9:59 AM | 0 (0.0%) | 83 (14.3%) |
| 10:00 AM to 10:59 AM | 0 (0.0%) | 0 (0.0%) |
| 11:00 AM to 11:59 AM | 0 (0.0%) | 0 (0.0%) |
| 12:00 PM to 3:59 PM | 0 (0.0%) | 69 (11.9%) |
| 4:00 PM to 11:59 PM | 0 (0.0%) | 0 (0.0%) |
| Total | 348 (100.0%) | 580 (100.0%) |
Housing Occupancy in Beaver Dam
Occupancy by Ownership in Beaver Dam
Of the total 971 dwellings in Beaver Dam, owner-occupied units account for 683 (70.3%), while renter-occupied units make up 288 (29.7%).
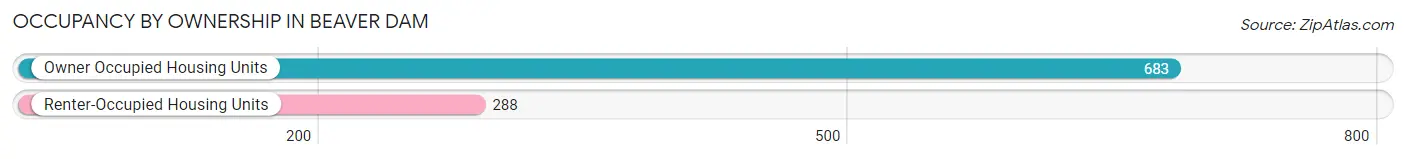
| Occupancy | # Housing Units | % Housing Units |
| Owner Occupied Housing Units | 683 | 70.3% |
| Renter-Occupied Housing Units | 288 | 29.7% |
| Total Occupied Housing Units | 971 | 100.0% |
Occupancy by Household Size in Beaver Dam
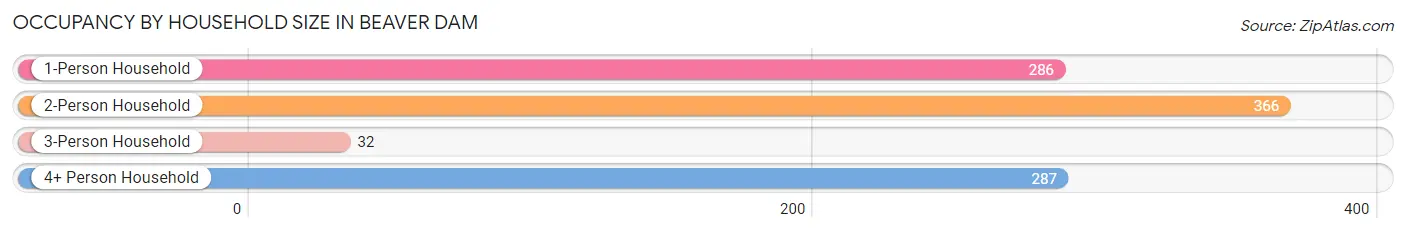
| Household Size | # Housing Units | % Housing Units |
| 1-Person Household | 286 | 29.4% |
| 2-Person Household | 366 | 37.7% |
| 3-Person Household | 32 | 3.3% |
| 4+ Person Household | 287 | 29.6% |
| Total Housing Units | 971 | 100.0% |
Occupancy by Ownership by Household Size in Beaver Dam
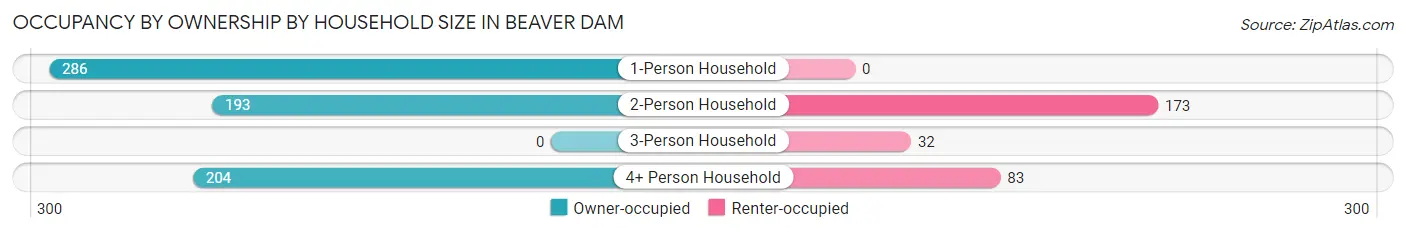
| Household Size | Owner-occupied | Renter-occupied |
| 1-Person Household | 286 (100.0%) | 0 (0.0%) |
| 2-Person Household | 193 (52.7%) | 173 (47.3%) |
| 3-Person Household | 0 (0.0%) | 32 (100.0%) |
| 4+ Person Household | 204 (71.1%) | 83 (28.9%) |
| Total Housing Units | 683 (70.3%) | 288 (29.7%) |
Occupancy by Educational Attainment in Beaver Dam
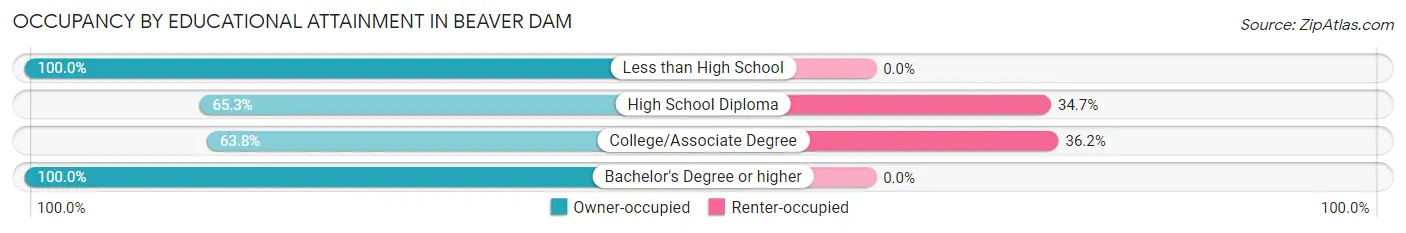
| Household Size | Owner-occupied | Renter-occupied |
| Less than High School | 107 (100.0%) | 0 (0.0%) |
| High School Diploma | 326 (65.3%) | 173 (34.7%) |
| College/Associate Degree | 203 (63.8%) | 115 (36.2%) |
| Bachelor's Degree or higher | 47 (100.0%) | 0 (0.0%) |
Occupancy by Age of Householder in Beaver Dam
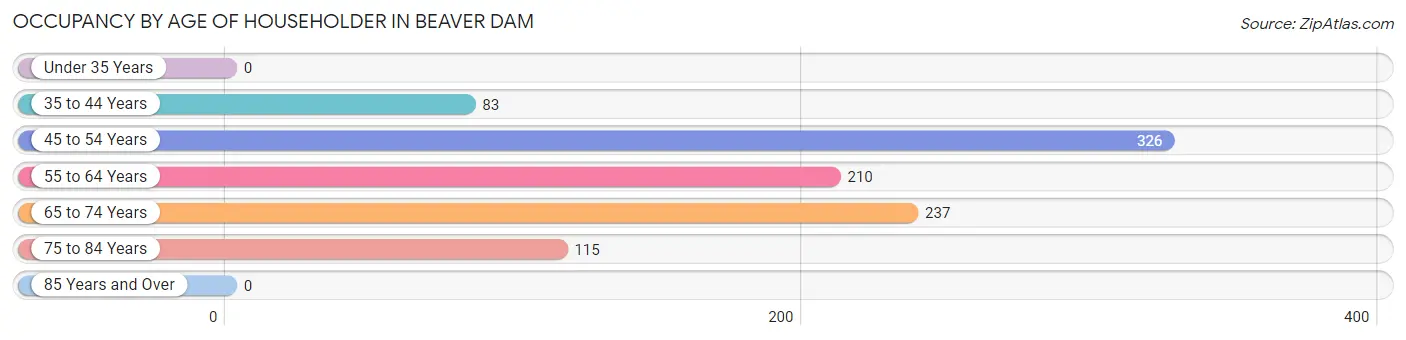
| Age Bracket | # Households | % Households |
| Under 35 Years | 0 | 0.0% |
| 35 to 44 Years | 83 | 8.6% |
| 45 to 54 Years | 326 | 33.6% |
| 55 to 64 Years | 210 | 21.6% |
| 65 to 74 Years | 237 | 24.4% |
| 75 to 84 Years | 115 | 11.8% |
| 85 Years and Over | 0 | 0.0% |
| Total | 971 | 100.0% |
Housing Finances in Beaver Dam
Median Income by Occupancy in Beaver Dam
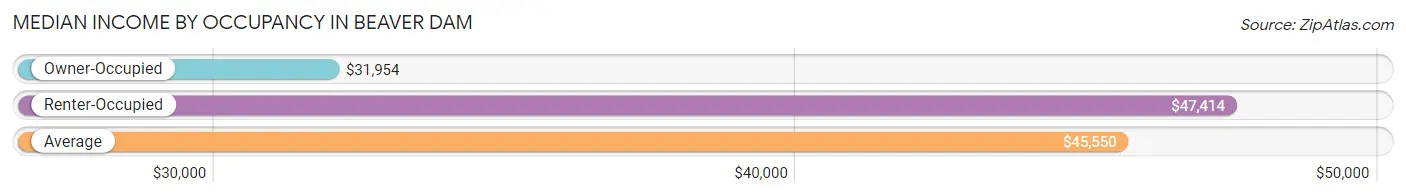
| Occupancy Type | # Households | Median Income |
| Owner-Occupied | 683 (70.3%) | $31,954 |
| Renter-Occupied | 288 (29.7%) | $47,414 |
| Average | 971 (100.0%) | $45,550 |
Occupancy by Householder Income Bracket in Beaver Dam
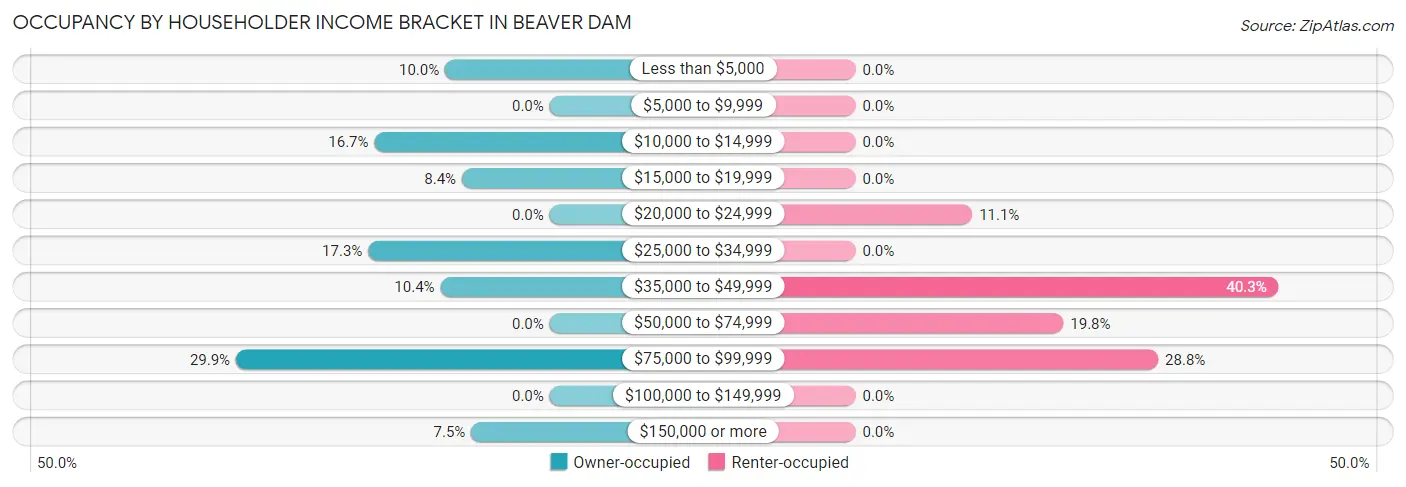
| Income Bracket | Owner-occupied | Renter-occupied |
| Less than $5,000 | 68 (10.0%) | 0 (0.0%) |
| $5,000 to $9,999 | 0 (0.0%) | 0 (0.0%) |
| $10,000 to $14,999 | 114 (16.7%) | 0 (0.0%) |
| $15,000 to $19,999 | 57 (8.4%) | 0 (0.0%) |
| $20,000 to $24,999 | 0 (0.0%) | 32 (11.1%) |
| $25,000 to $34,999 | 118 (17.3%) | 0 (0.0%) |
| $35,000 to $49,999 | 71 (10.4%) | 116 (40.3%) |
| $50,000 to $74,999 | 0 (0.0%) | 57 (19.8%) |
| $75,000 to $99,999 | 204 (29.9%) | 83 (28.8%) |
| $100,000 to $149,999 | 0 (0.0%) | 0 (0.0%) |
| $150,000 or more | 51 (7.5%) | 0 (0.0%) |
| Total | 683 (100.0%) | 288 (100.0%) |
Monthly Housing Cost Tiers in Beaver Dam
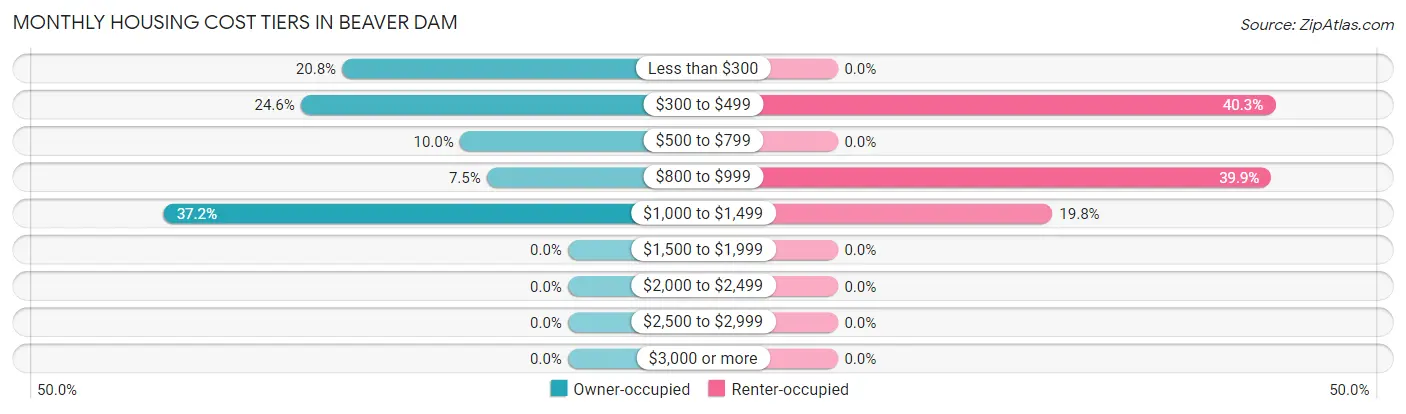
| Monthly Cost | Owner-occupied | Renter-occupied |
| Less than $300 | 142 (20.8%) | 0 (0.0%) |
| $300 to $499 | 168 (24.6%) | 116 (40.3%) |
| $500 to $799 | 68 (10.0%) | 0 (0.0%) |
| $800 to $999 | 51 (7.5%) | 115 (39.9%) |
| $1,000 to $1,499 | 254 (37.2%) | 57 (19.8%) |
| $1,500 to $1,999 | 0 (0.0%) | 0 (0.0%) |
| $2,000 to $2,499 | 0 (0.0%) | 0 (0.0%) |
| $2,500 to $2,999 | 0 (0.0%) | 0 (0.0%) |
| $3,000 or more | 0 (0.0%) | 0 (0.0%) |
| Total | 683 (100.0%) | 288 (100.0%) |
Physical Housing Characteristics in Beaver Dam
Housing Structures in Beaver Dam
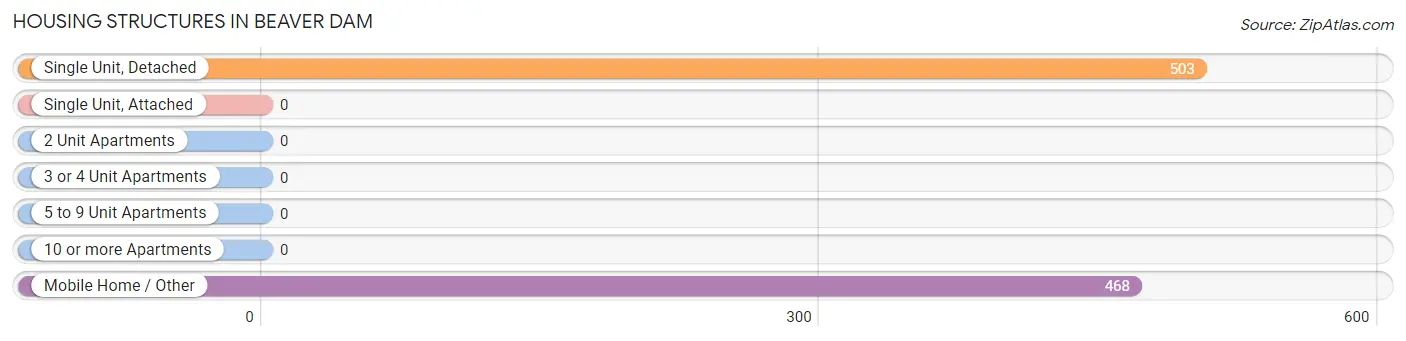
| Structure Type | # Housing Units | % Housing Units |
| Single Unit, Detached | 503 | 51.8% |
| Single Unit, Attached | 0 | 0.0% |
| 2 Unit Apartments | 0 | 0.0% |
| 3 or 4 Unit Apartments | 0 | 0.0% |
| 5 to 9 Unit Apartments | 0 | 0.0% |
| 10 or more Apartments | 0 | 0.0% |
| Mobile Home / Other | 468 | 48.2% |
| Total | 971 | 100.0% |
Housing Structures by Occupancy in Beaver Dam
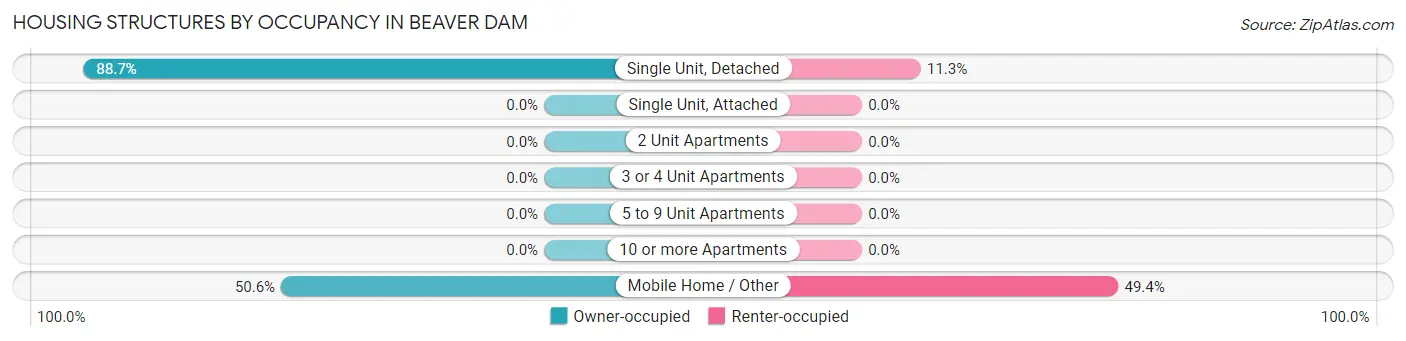
| Structure Type | Owner-occupied | Renter-occupied |
| Single Unit, Detached | 446 (88.7%) | 57 (11.3%) |
| Single Unit, Attached | 0 (0.0%) | 0 (0.0%) |
| 2 Unit Apartments | 0 (0.0%) | 0 (0.0%) |
| 3 or 4 Unit Apartments | 0 (0.0%) | 0 (0.0%) |
| 5 to 9 Unit Apartments | 0 (0.0%) | 0 (0.0%) |
| 10 or more Apartments | 0 (0.0%) | 0 (0.0%) |
| Mobile Home / Other | 237 (50.6%) | 231 (49.4%) |
| Total | 683 (70.3%) | 288 (29.7%) |
Housing Structures by Number of Rooms in Beaver Dam
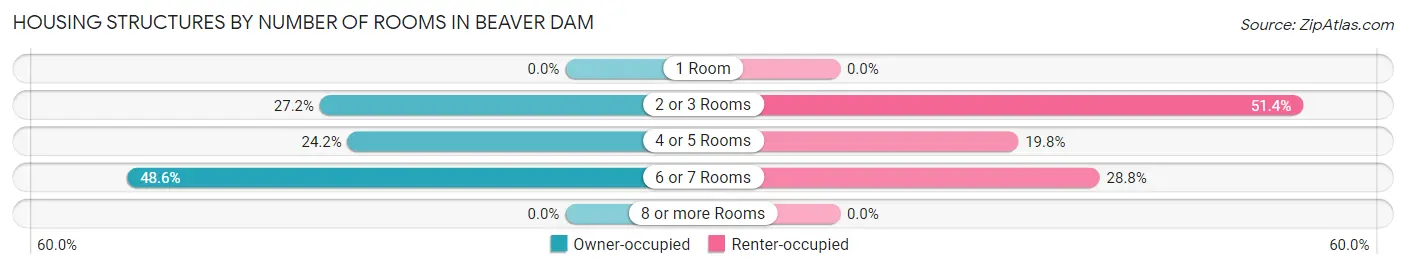
| Number of Rooms | Owner-occupied | Renter-occupied |
| 1 Room | 0 (0.0%) | 0 (0.0%) |
| 2 or 3 Rooms | 186 (27.2%) | 148 (51.4%) |
| 4 or 5 Rooms | 165 (24.2%) | 57 (19.8%) |
| 6 or 7 Rooms | 332 (48.6%) | 83 (28.8%) |
| 8 or more Rooms | 0 (0.0%) | 0 (0.0%) |
| Total | 683 (100.0%) | 288 (100.0%) |
Housing Structure by Heating Type in Beaver Dam
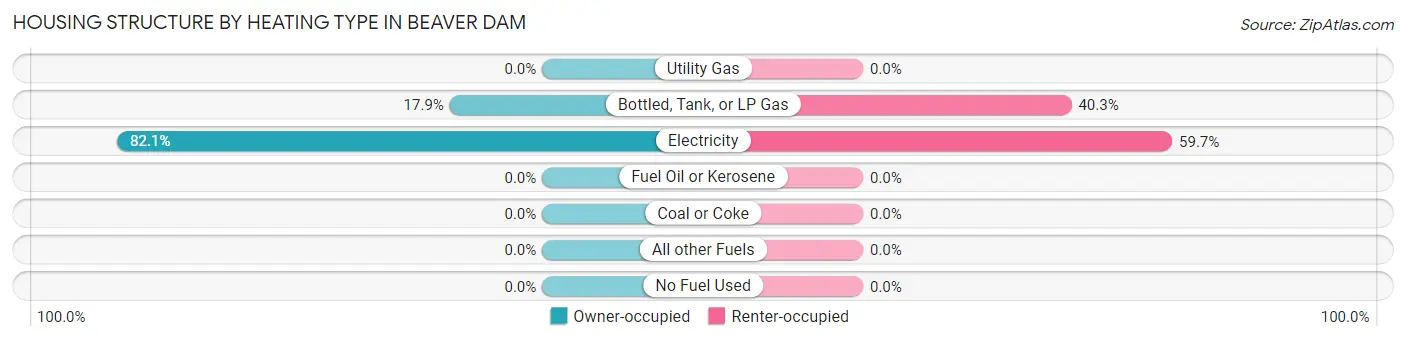
| Heating Type | Owner-occupied | Renter-occupied |
| Utility Gas | 0 (0.0%) | 0 (0.0%) |
| Bottled, Tank, or LP Gas | 122 (17.9%) | 116 (40.3%) |
| Electricity | 561 (82.1%) | 172 (59.7%) |
| Fuel Oil or Kerosene | 0 (0.0%) | 0 (0.0%) |
| Coal or Coke | 0 (0.0%) | 0 (0.0%) |
| All other Fuels | 0 (0.0%) | 0 (0.0%) |
| No Fuel Used | 0 (0.0%) | 0 (0.0%) |
| Total | 683 (100.0%) | 288 (100.0%) |
Household Vehicle Usage in Beaver Dam
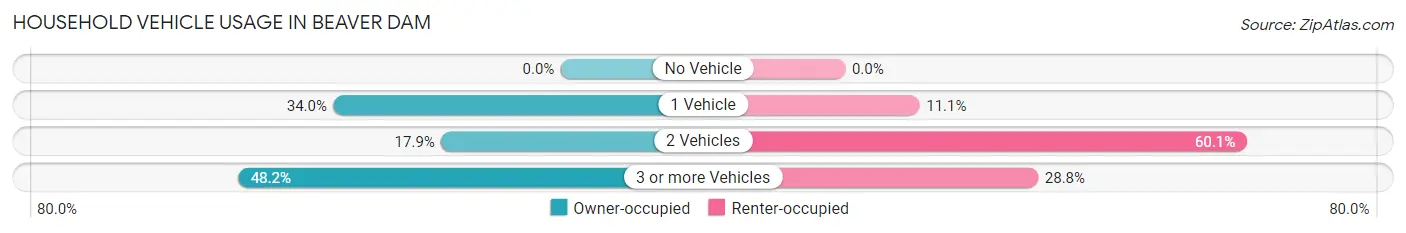
| Vehicles per Household | Owner-occupied | Renter-occupied |
| No Vehicle | 0 (0.0%) | 0 (0.0%) |
| 1 Vehicle | 232 (34.0%) | 32 (11.1%) |
| 2 Vehicles | 122 (17.9%) | 173 (60.1%) |
| 3 or more Vehicles | 329 (48.2%) | 83 (28.8%) |
| Total | 683 (100.0%) | 288 (100.0%) |
Real Estate & Mortgages in Beaver Dam
Real Estate and Mortgage Overview in Beaver Dam
| Characteristic | Without Mortgage | With Mortgage |
| Housing Units | 582 | 101 |
| Median Property Value | - | - |
| Median Household Income | $31,937 | $51 |
| Monthly Housing Costs | $460 | $0 |
| Real Estate Taxes | $1,137 | $51 |
Property Value by Mortgage Status in Beaver Dam
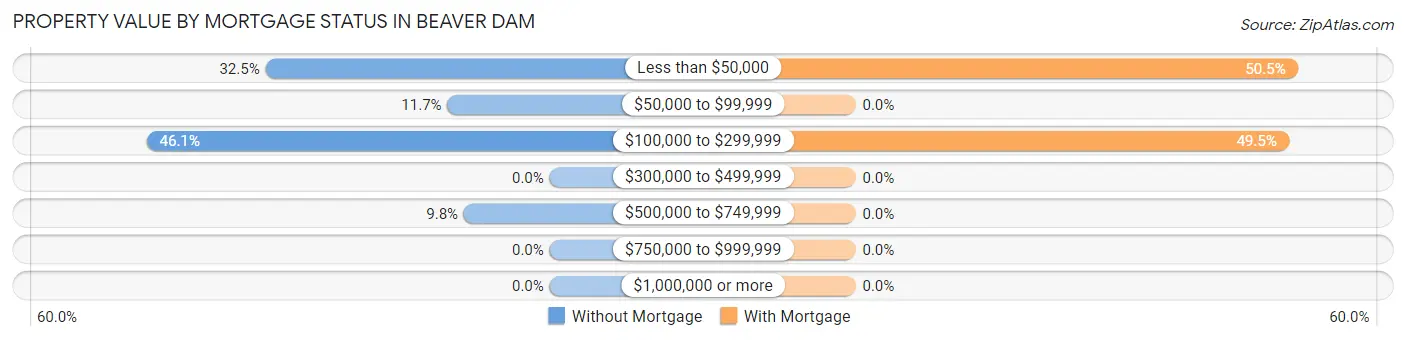
| Property Value | Without Mortgage | With Mortgage |
| Less than $50,000 | 189 (32.5%) | 51 (50.5%) |
| $50,000 to $99,999 | 68 (11.7%) | 0 (0.0%) |
| $100,000 to $299,999 | 268 (46.1%) | 50 (49.5%) |
| $300,000 to $499,999 | 0 (0.0%) | 0 (0.0%) |
| $500,000 to $749,999 | 57 (9.8%) | 0 (0.0%) |
| $750,000 to $999,999 | 0 (0.0%) | 0 (0.0%) |
| $1,000,000 or more | 0 (0.0%) | 0 (0.0%) |
| Total | 582 (100.0%) | 101 (100.0%) |
Household Income by Mortgage Status in Beaver Dam
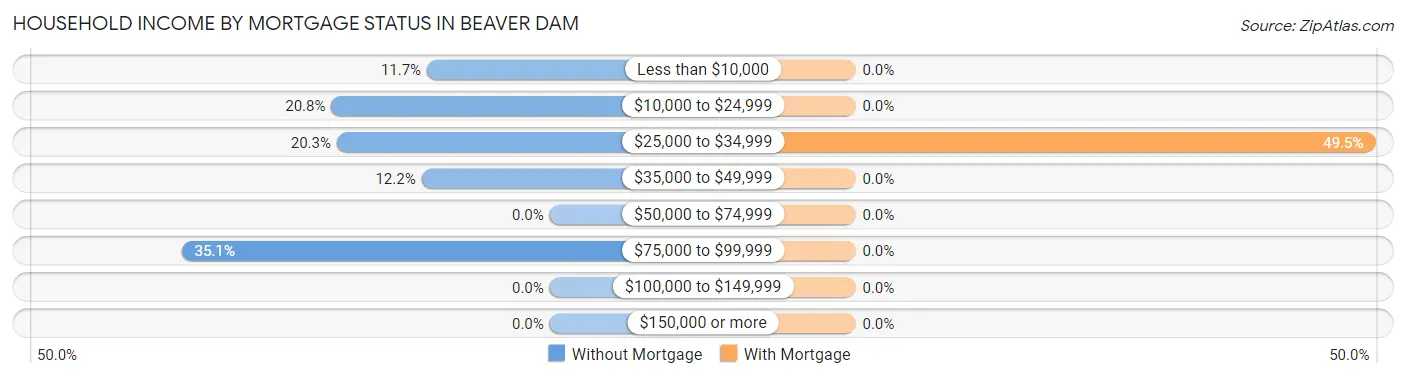
| Household Income | Without Mortgage | With Mortgage |
| Less than $10,000 | 68 (11.7%) | 0 (0.0%) |
| $10,000 to $24,999 | 121 (20.8%) | 0 (0.0%) |
| $25,000 to $34,999 | 118 (20.3%) | 50 (49.5%) |
| $35,000 to $49,999 | 71 (12.2%) | 0 (0.0%) |
| $50,000 to $74,999 | 0 (0.0%) | 0 (0.0%) |
| $75,000 to $99,999 | 204 (35.0%) | 0 (0.0%) |
| $100,000 to $149,999 | 0 (0.0%) | 0 (0.0%) |
| $150,000 or more | 0 (0.0%) | 0 (0.0%) |
| Total | 582 (100.0%) | 101 (100.0%) |
Property Value to Household Income Ratio in Beaver Dam
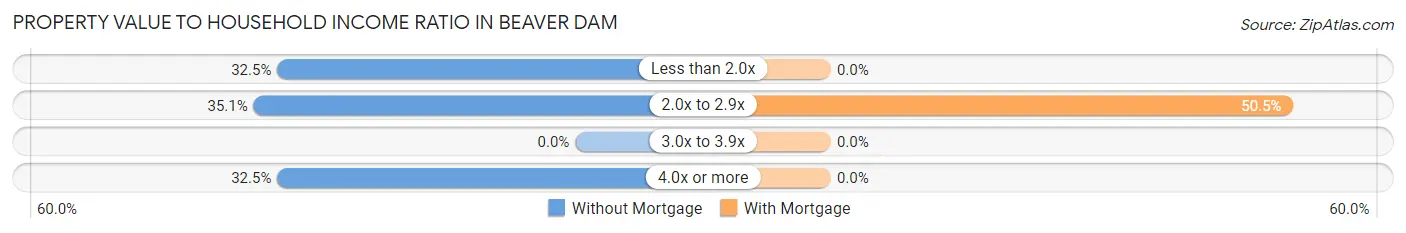
| Value-to-Income Ratio | Without Mortgage | With Mortgage |
| Less than 2.0x | 189 (32.5%) | 0 (0.0%) |
| 2.0x to 2.9x | 204 (35.0%) | 51 (50.5%) |
| 3.0x to 3.9x | 0 (0.0%) | 0 (0.0%) |
| 4.0x or more | 189 (32.5%) | 0 (0.0%) |
| Total | 582 (100.0%) | 101 (100.0%) |
Real Estate Taxes by Mortgage Status in Beaver Dam
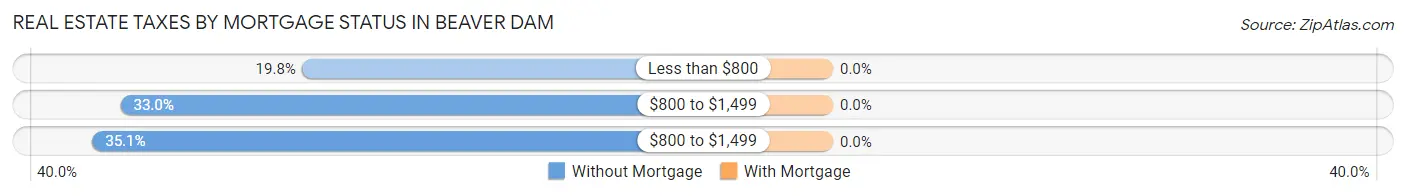
| Property Taxes | Without Mortgage | With Mortgage |
| Less than $800 | 115 (19.8%) | 0 (0.0%) |
| $800 to $1,499 | 192 (33.0%) | 0 (0.0%) |
| $800 to $1,499 | 204 (35.0%) | 0 (0.0%) |
| Total | 582 (100.0%) | 101 (100.0%) |
Health & Disability in Beaver Dam
Health Insurance Coverage by Age in Beaver Dam
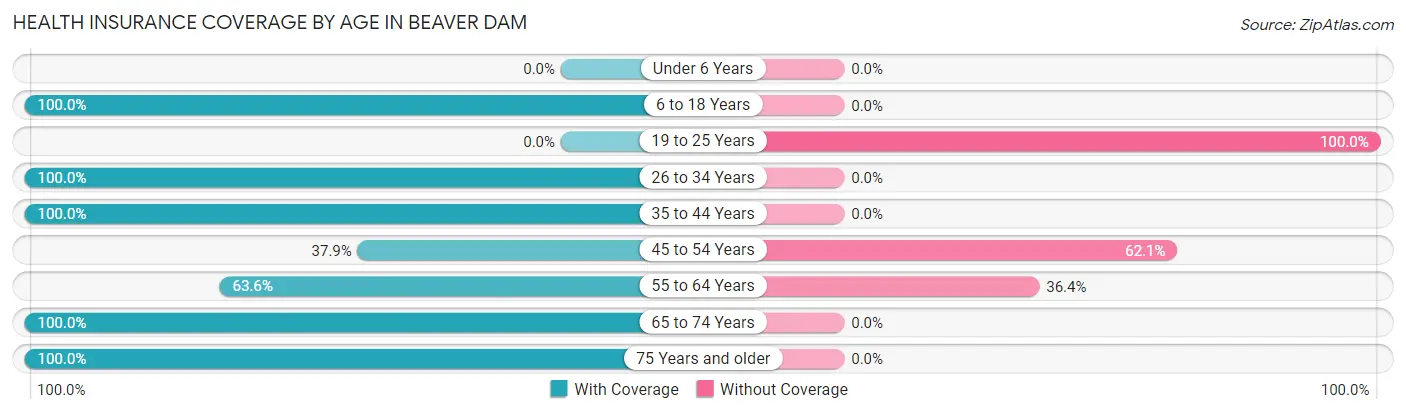
| Age Bracket | With Coverage | Without Coverage |
| Under 6 Years | 0 (0.0%) | 0 (0.0%) |
| 6 to 18 Years | 139 (100.0%) | 0 (0.0%) |
| 19 to 25 Years | 0 (0.0%) | 163 (100.0%) |
| 26 to 34 Years | 148 (100.0%) | 0 (0.0%) |
| 35 to 44 Years | 83 (100.0%) | 0 (0.0%) |
| 45 to 54 Years | 227 (37.9%) | 372 (62.1%) |
| 55 to 64 Years | 210 (63.6%) | 120 (36.4%) |
| 65 to 74 Years | 436 (100.0%) | 0 (0.0%) |
| 75 Years and older | 115 (100.0%) | 0 (0.0%) |
| Total | 1,358 (67.5%) | 655 (32.5%) |
Health Insurance Coverage by Citizenship Status in Beaver Dam
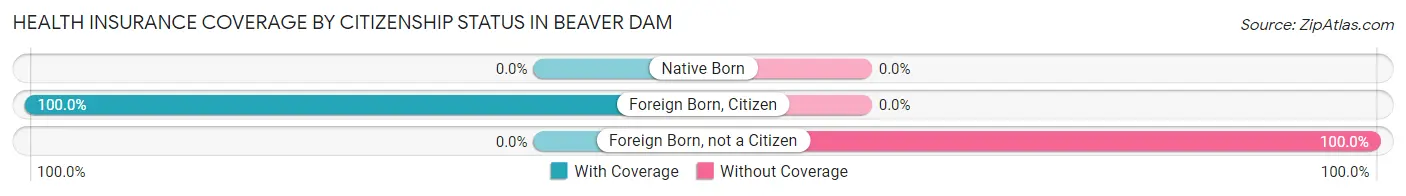
| Citizenship Status | With Coverage | Without Coverage |
| Native Born | 0 (0.0%) | 0 (0.0%) |
| Foreign Born, Citizen | 139 (100.0%) | 0 (0.0%) |
| Foreign Born, not a Citizen | 0 (0.0%) | 163 (100.0%) |
Health Insurance Coverage by Household Income in Beaver Dam
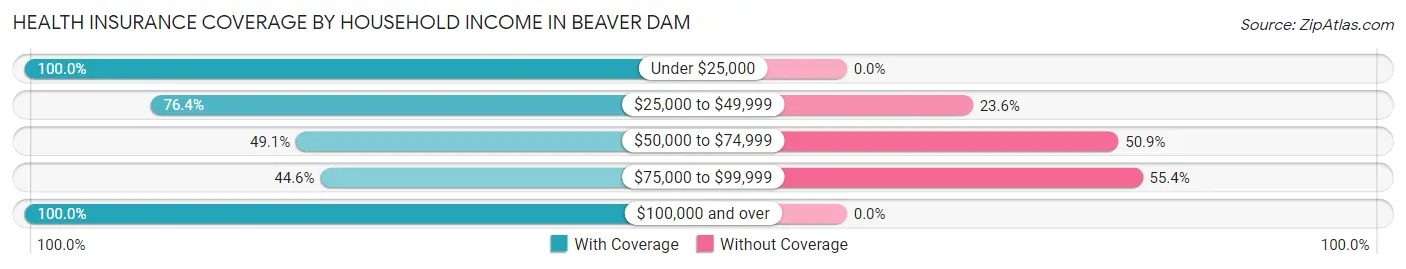
| Household Income | With Coverage | Without Coverage |
| Under $25,000 | 410 (100.0%) | 0 (0.0%) |
| $25,000 to $49,999 | 421 (76.4%) | 130 (23.6%) |
| $50,000 to $74,999 | 57 (49.1%) | 59 (50.9%) |
| $75,000 to $99,999 | 375 (44.6%) | 466 (55.4%) |
| $100,000 and over | 95 (100.0%) | 0 (0.0%) |
Public vs Private Health Insurance Coverage by Age in Beaver Dam
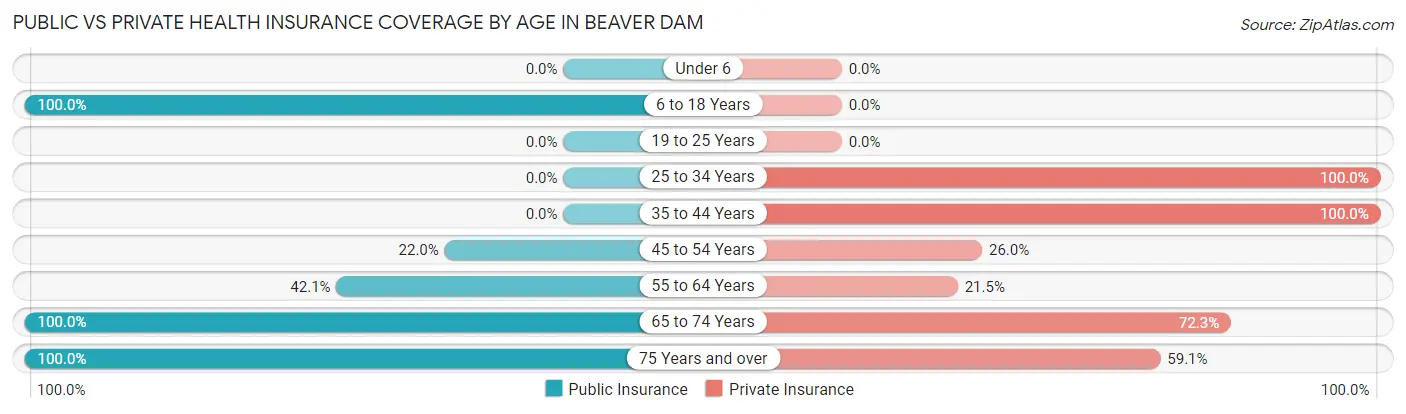
| Age Bracket | Public Insurance | Private Insurance |
| Under 6 | 0 (0.0%) | 0 (0.0%) |
| 6 to 18 Years | 139 (100.0%) | 0 (0.0%) |
| 19 to 25 Years | 0 (0.0%) | 0 (0.0%) |
| 25 to 34 Years | 0 (0.0%) | 148 (100.0%) |
| 35 to 44 Years | 0 (0.0%) | 83 (100.0%) |
| 45 to 54 Years | 132 (22.0%) | 156 (26.0%) |
| 55 to 64 Years | 139 (42.1%) | 71 (21.5%) |
| 65 to 74 Years | 436 (100.0%) | 315 (72.3%) |
| 75 Years and over | 115 (100.0%) | 68 (59.1%) |
| Total | 961 (47.7%) | 841 (41.8%) |
Disability Status by Sex by Age in Beaver Dam
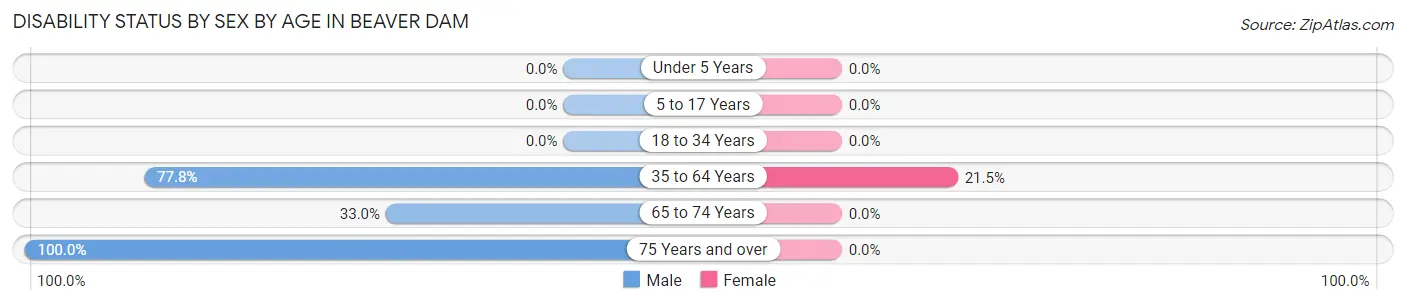
| Age Bracket | Male | Female |
| Under 5 Years | 0 (0.0%) | 0 (0.0%) |
| 5 to 17 Years | 0 (0.0%) | 0 (0.0%) |
| 18 to 34 Years | 0 (0.0%) | 0 (0.0%) |
| 35 to 64 Years | 368 (77.8%) | 116 (21.5%) |
| 65 to 74 Years | 57 (33.0%) | 0 (0.0%) |
| 75 Years and over | 47 (100.0%) | 0 (0.0%) |
Disability Class by Sex by Age in Beaver Dam
Disability Class: Hearing Difficulty
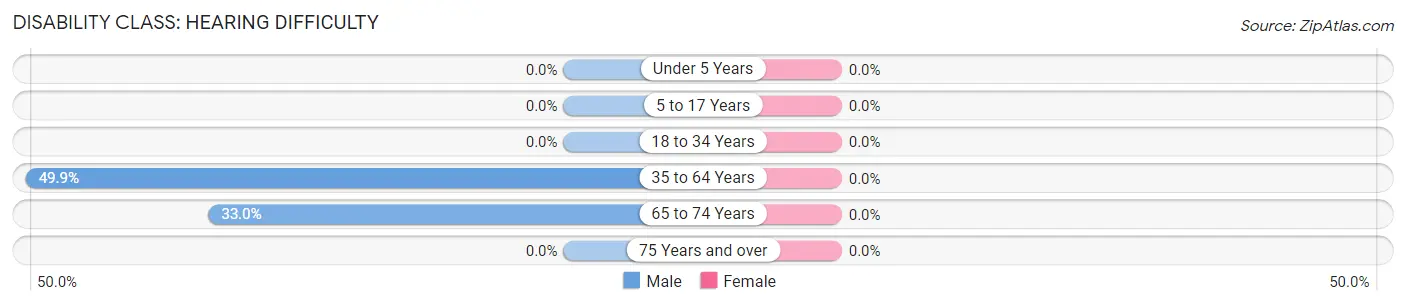
| Age Bracket | Male | Female |
| Under 5 Years | 0 (0.0%) | 0 (0.0%) |
| 5 to 17 Years | 0 (0.0%) | 0 (0.0%) |
| 18 to 34 Years | 0 (0.0%) | 0 (0.0%) |
| 35 to 64 Years | 236 (49.9%) | 0 (0.0%) |
| 65 to 74 Years | 57 (33.0%) | 0 (0.0%) |
| 75 Years and over | 0 (0.0%) | 0 (0.0%) |
Disability Class: Vision Difficulty
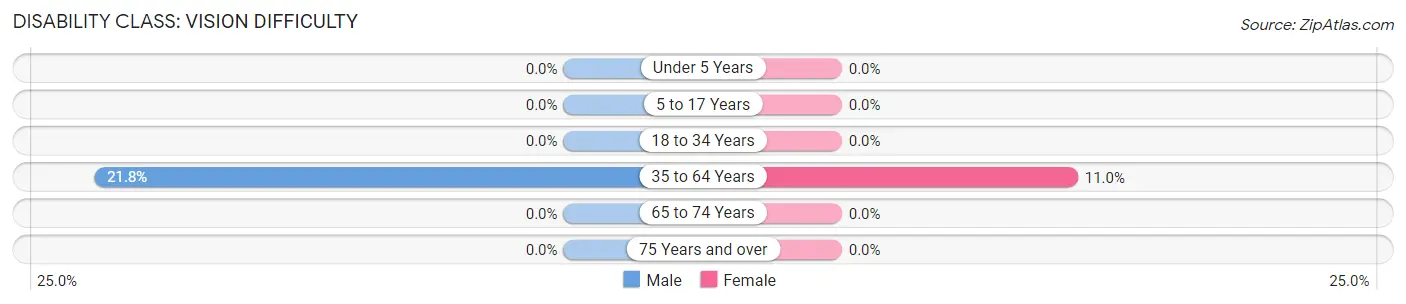
| Age Bracket | Male | Female |
| Under 5 Years | 0 (0.0%) | 0 (0.0%) |
| 5 to 17 Years | 0 (0.0%) | 0 (0.0%) |
| 18 to 34 Years | 0 (0.0%) | 0 (0.0%) |
| 35 to 64 Years | 103 (21.8%) | 59 (11.0%) |
| 65 to 74 Years | 0 (0.0%) | 0 (0.0%) |
| 75 Years and over | 0 (0.0%) | 0 (0.0%) |
Disability Class: Cognitive Difficulty
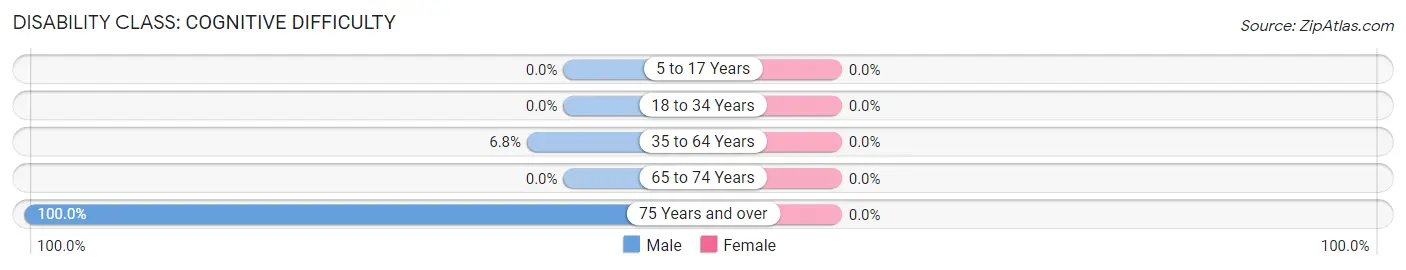
| Age Bracket | Male | Female |
| 5 to 17 Years | 0 (0.0%) | 0 (0.0%) |
| 18 to 34 Years | 0 (0.0%) | 0 (0.0%) |
| 35 to 64 Years | 32 (6.8%) | 0 (0.0%) |
| 65 to 74 Years | 0 (0.0%) | 0 (0.0%) |
| 75 Years and over | 47 (100.0%) | 0 (0.0%) |
Disability Class: Ambulatory Difficulty
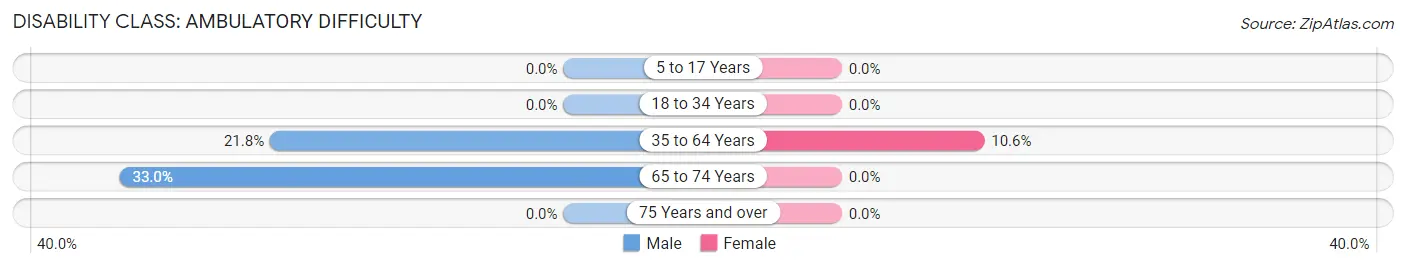
| Age Bracket | Male | Female |
| 5 to 17 Years | 0 (0.0%) | 0 (0.0%) |
| 18 to 34 Years | 0 (0.0%) | 0 (0.0%) |
| 35 to 64 Years | 103 (21.8%) | 57 (10.6%) |
| 65 to 74 Years | 57 (33.0%) | 0 (0.0%) |
| 75 Years and over | 0 (0.0%) | 0 (0.0%) |
Disability Class: Self-Care Difficulty
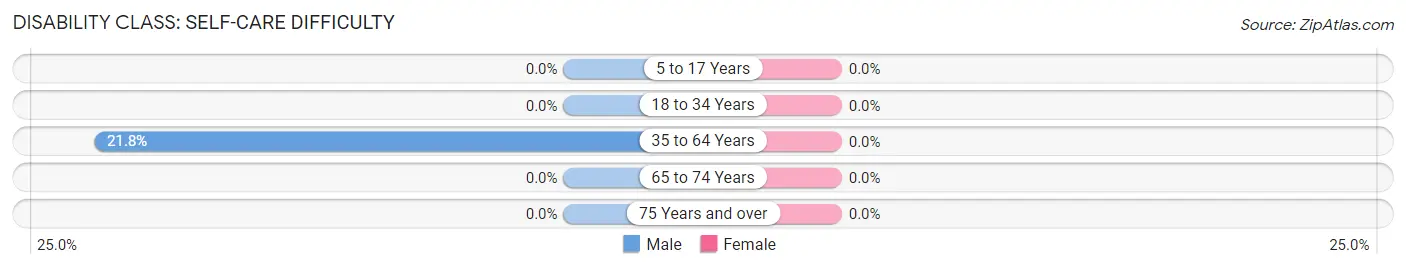
| Age Bracket | Male | Female |
| 5 to 17 Years | 0 (0.0%) | 0 (0.0%) |
| 18 to 34 Years | 0 (0.0%) | 0 (0.0%) |
| 35 to 64 Years | 103 (21.8%) | 0 (0.0%) |
| 65 to 74 Years | 0 (0.0%) | 0 (0.0%) |
| 75 Years and over | 0 (0.0%) | 0 (0.0%) |
Technology Access in Beaver Dam
Computing Device Access in Beaver Dam
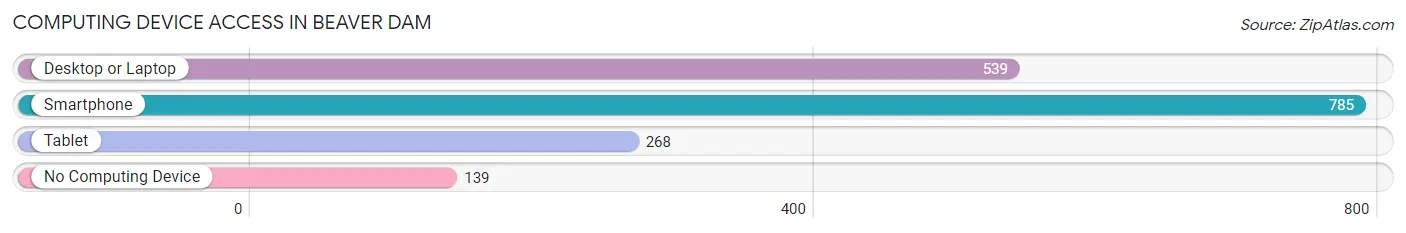
| Device Type | # Households | % Households |
| Desktop or Laptop | 539 | 55.5% |
| Smartphone | 785 | 80.8% |
| Tablet | 268 | 27.6% |
| No Computing Device | 139 | 14.3% |
| Total | 971 | 100.0% |
Internet Access in Beaver Dam
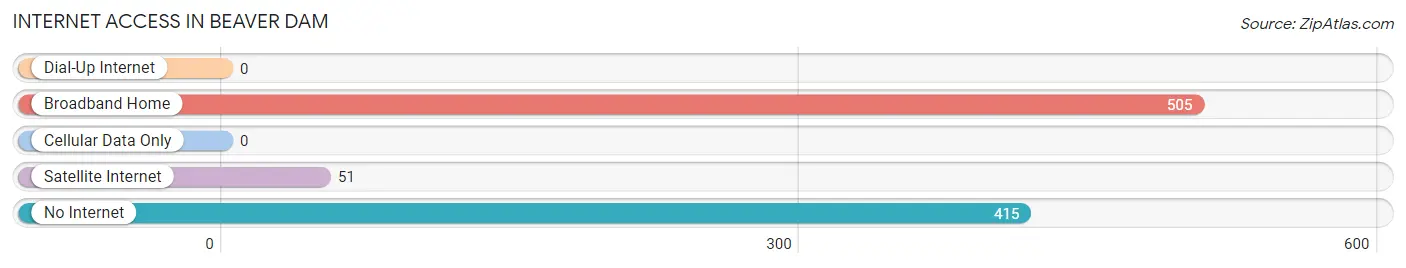
| Internet Type | # Households | % Households |
| Dial-Up Internet | 0 | 0.0% |
| Broadband Home | 505 | 52.0% |
| Cellular Data Only | 0 | 0.0% |
| Satellite Internet | 51 | 5.2% |
| No Internet | 415 | 42.7% |
| Total | 971 | 100.0% |
Beaver Dam Summary
Beaver Dam, Arizona is a small unincorporated community located in Mohave County, Arizona. It is situated in the extreme northwest corner of the state, near the border of Nevada and Utah. The town is located in the Arizona Strip, a remote region of the state that is separated from the rest of Arizona by the Grand Canyon. The town is located on the Arizona side of the Virgin River, which forms the border between Arizona and Nevada.
History
Beaver Dam was first settled in the late 1800s by Mormon pioneers. The town was originally known as Littlefield, but was later renamed Beaver Dam in honor of the beaver dams that were built in the area. The town was incorporated in 1909 and was home to a variety of businesses, including a hotel, a general store, a post office, and a school.
Geography
Beaver Dam is located in the extreme northwest corner of Arizona, near the border of Nevada and Utah. The town is situated in the Arizona Strip, a remote region of the state that is separated from the rest of Arizona by the Grand Canyon. The town is located on the Arizona side of the Virgin River, which forms the border between Arizona and Nevada. The town is surrounded by the Beaver Dam Mountains, which are part of the larger Colorado Plateau. The area is characterized by its rugged terrain and sparse vegetation.
Economy
Beaver Dam is a small, rural community with a population of just over 500 people. The town is home to a variety of businesses, including a general store, a post office, and a school. The town is also home to a number of small farms and ranches, which provide the town with a steady source of income. The town is also home to a number of tourist attractions, including the Beaver Dam State Park and the nearby Grand Canyon.
Demographics
As of the 2010 census, Beaver Dam had a population of 517 people. The racial makeup of the town was 95.3% White, 0.6% Native American, 0.2% Asian, 0.2% Pacific Islander, 0.2% from other races, and 3.7% from two or more races. The median household income in Beaver Dam was $37,500, and the median family income was $41,250. The per capita income in Beaver Dam was $17,857. The town has a poverty rate of 16.3%.
Conclusion
Beaver Dam, Arizona is a small, rural community located in the extreme northwest corner of the state. The town was first settled in the late 1800s by Mormon pioneers and was later incorporated in 1909. The town is home to a variety of businesses, including a general store, a post office, and a school. The town is also home to a number of small farms and ranches, which provide the town with a steady source of income. The town has a population of just over 500 people, and the median household income is $37,500.
Common Questions
What is Per Capita Income in Beaver Dam?
Per Capita income in Beaver Dam is $24,765.
What is the Median Family Income in Beaver Dam?
Median Family Income in Beaver Dam is $64,803.
What is the Median Household income in Beaver Dam?
Median Household Income in Beaver Dam is $45,550.
What is Income or Wage Gap in Beaver Dam?
Income or Wage Gap in Beaver Dam is 25.8%.
Women in Beaver Dam earn 74.2 cents for every dollar earned by a man.
What is Inequality or Gini Index in Beaver Dam?
Inequality or Gini Index in Beaver Dam is 0.42.
What is the Total Population of Beaver Dam?
Total Population of Beaver Dam is 2,013.
What is the Total Male Population of Beaver Dam?
Total Male Population of Beaver Dam is 932.
What is the Total Female Population of Beaver Dam?
Total Female Population of Beaver Dam is 1,081.
What is the Ratio of Males per 100 Females in Beaver Dam?
There are 86.22 Males per 100 Females in Beaver Dam.
What is the Ratio of Females per 100 Males in Beaver Dam?
There are 115.99 Females per 100 Males in Beaver Dam.
What is the Median Population Age in Beaver Dam?
Median Population Age in Beaver Dam is 50.5 Years.
What is the Average Family Size in Beaver Dam
Average Family Size in Beaver Dam is 2.4 People.
What is the Average Household Size in Beaver Dam
Average Household Size in Beaver Dam is 2.1 People.
How Large is the Labor Force in Beaver Dam?
There are 1,060 People in the Labor Forcein in Beaver Dam.
What is the Percentage of People in the Labor Force in Beaver Dam?
54.2% of People are in the Labor Force in Beaver Dam.
What is the Unemployment Rate in Beaver Dam?
Unemployment Rate in Beaver Dam is 7.7%.