Gold Canyon, AZ Map & Demographics
Gold Canyon Map
Gold Canyon Overview
$56,313
PER CAPITA INCOME
$100,104
AVG FAMILY INCOME
$83,654
AVG HOUSEHOLD INCOME
42.4%
WAGE / INCOME GAP [ % ]
57.6¢/ $1
WAGE / INCOME GAP [ $ ]
0.42
INEQUALITY / GINI INDEX
11,565
TOTAL POPULATION
5,349
MALE POPULATION
6,216
FEMALE POPULATION
86.05
MALES / 100 FEMALES
116.21
FEMALES / 100 MALES
66.6
MEDIAN AGE
2.3
AVG FAMILY SIZE
2.0
AVG HOUSEHOLD SIZE
3,368
LABOR FORCE [ PEOPLE ]
30.6%
PERCENT IN LABOR FORCE
4.1%
UNEMPLOYMENT RATE
Gold Canyon Zip Codes
Income in Gold Canyon
Income Overview in Gold Canyon
Per Capita Income in Gold Canyon is $56,313, while median incomes of families and households are $100,104 and $83,654 respectively.
| Characteristic | Number | Measure |
| Per Capita Income | 11,565 | $56,313 |
| Median Family Income | 4,139 | $100,104 |
| Mean Family Income | 4,139 | $123,010 |
| Median Household Income | 5,814 | $83,654 |
| Mean Household Income | 5,814 | $111,968 |
| Income Deficit | 4,139 | $0 |
| Wage / Income Gap (%) | 11,565 | 42.39% |
| Wage / Income Gap ($) | 11,565 | 57.61¢ per $1 |
| Gini / Inequality Index | 11,565 | 0.42 |
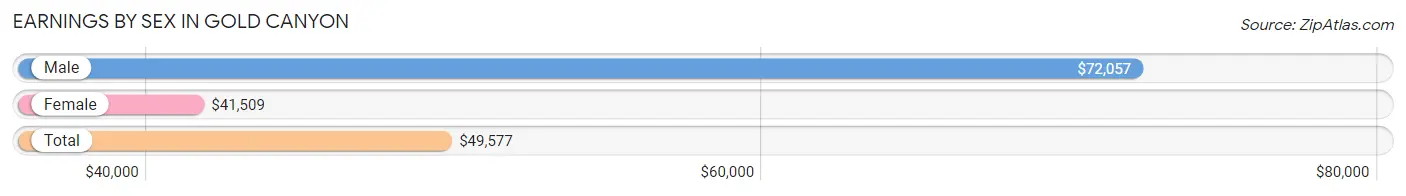
Earnings by Sex in Gold Canyon
Average Earnings in Gold Canyon are $49,577, $72,057 for men and $41,509 for women, a difference of 42.4%.
| Sex | Number | Average Earnings |
| Male | 1,709 (44.9%) | $72,057 |
| Female | 2,100 (55.1%) | $41,509 |
| Total | 3,809 (100.0%) | $49,577 |
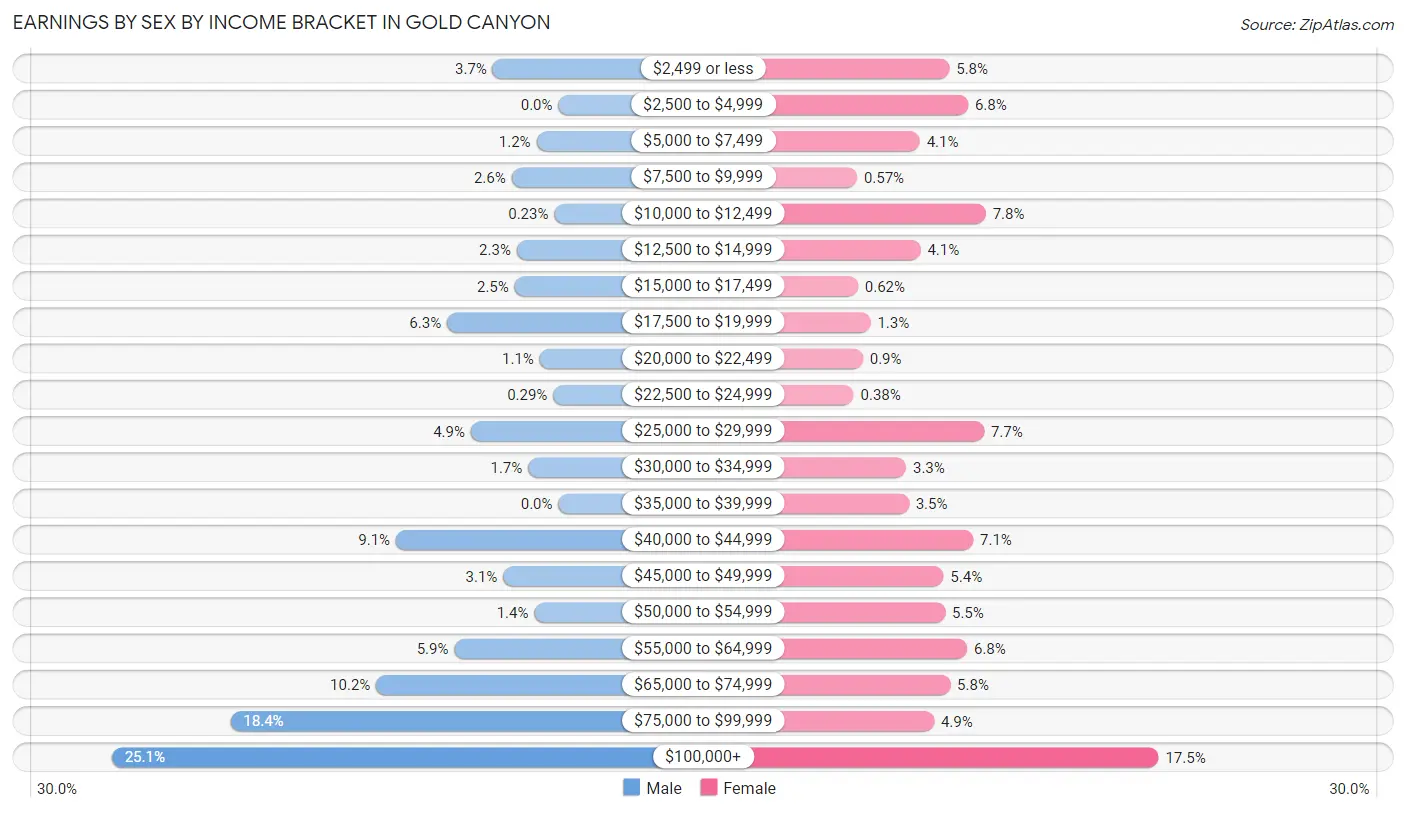
Earnings by Sex by Income Bracket in Gold Canyon
The most common earnings brackets in Gold Canyon are $100,000+ for men (429 | 25.1%) and $100,000+ for women (368 | 17.5%).
| Income | Male | Female |
| $2,499 or less | 63 (3.7%) | 121 (5.8%) |
| $2,500 to $4,999 | 0 (0.0%) | 143 (6.8%) |
| $5,000 to $7,499 | 21 (1.2%) | 86 (4.1%) |
| $7,500 to $9,999 | 45 (2.6%) | 12 (0.6%) |
| $10,000 to $12,499 | 4 (0.2%) | 164 (7.8%) |
| $12,500 to $14,999 | 40 (2.3%) | 87 (4.1%) |
| $15,000 to $17,499 | 42 (2.5%) | 13 (0.6%) |
| $17,500 to $19,999 | 107 (6.3%) | 28 (1.3%) |
| $20,000 to $22,499 | 18 (1.1%) | 19 (0.9%) |
| $22,500 to $24,999 | 5 (0.3%) | 8 (0.4%) |
| $25,000 to $29,999 | 84 (4.9%) | 162 (7.7%) |
| $30,000 to $34,999 | 29 (1.7%) | 70 (3.3%) |
| $35,000 to $39,999 | 0 (0.0%) | 73 (3.5%) |
| $40,000 to $44,999 | 156 (9.1%) | 149 (7.1%) |
| $45,000 to $49,999 | 53 (3.1%) | 114 (5.4%) |
| $50,000 to $54,999 | 23 (1.3%) | 116 (5.5%) |
| $55,000 to $64,999 | 100 (5.9%) | 142 (6.8%) |
| $65,000 to $74,999 | 175 (10.2%) | 122 (5.8%) |
| $75,000 to $99,999 | 315 (18.4%) | 103 (4.9%) |
| $100,000+ | 429 (25.1%) | 368 (17.5%) |
| Total | 1,709 (100.0%) | 2,100 (100.0%) |
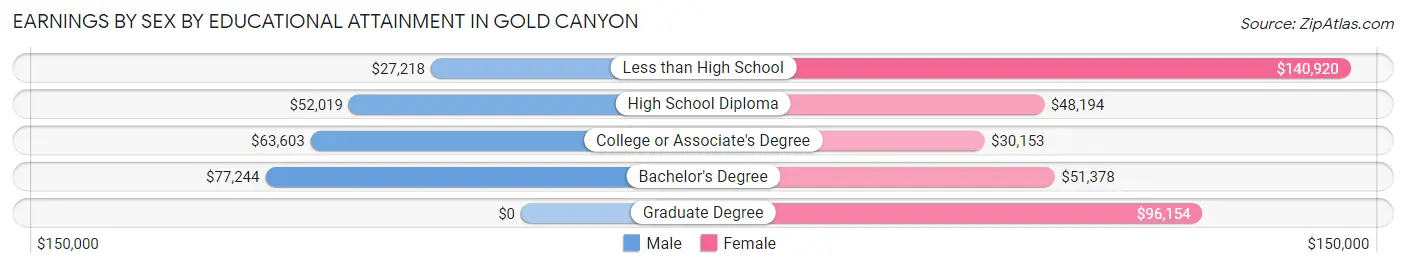
Earnings by Sex by Educational Attainment in Gold Canyon
Average earnings in Gold Canyon are $72,966 for men and $46,549 for women, a difference of 36.2%. Men with an educational attainment of bachelor's degree enjoy the highest average annual earnings of $77,244, while those with less than high school education earn the least with $27,218. Women with an educational attainment of less than high school earn the most with the average annual earnings of $140,920, while those with college or associate's degree education have the smallest earnings of $30,153.
| Educational Attainment | Male Income | Female Income |
| Less than High School | $27,218 | $140,920 |
| High School Diploma | $52,019 | $48,194 |
| College or Associate's Degree | $63,603 | $30,153 |
| Bachelor's Degree | $77,244 | $51,378 |
| Graduate Degree | - | - |
| Total | $72,966 | $46,549 |
Family Income in Gold Canyon
Family Income Brackets in Gold Canyon
According to the Gold Canyon family income data, there are 1,080 families falling into the $100,000 to $149,999 income range, which is the most common income bracket and makes up 26.1% of all families. Conversely, the $10,000 to $14,999 income bracket is the least frequent group with only 12 families (0.3%) belonging to this category.
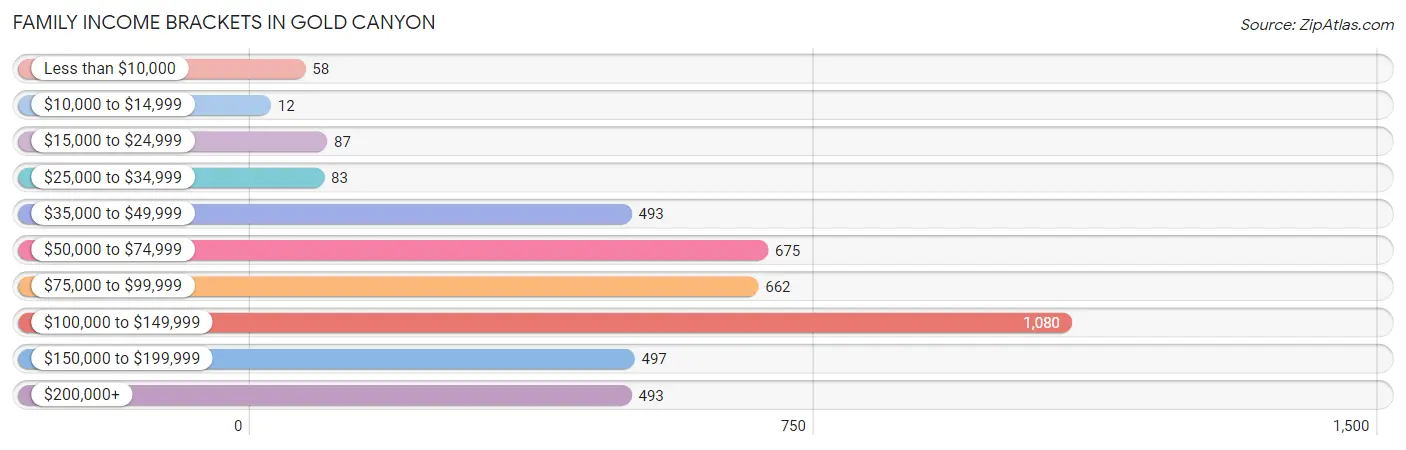
| Income Bracket | # Families | % Families |
| Less than $10,000 | 58 | 1.4% |
| $10,000 to $14,999 | 12 | 0.3% |
| $15,000 to $24,999 | 87 | 2.1% |
| $25,000 to $34,999 | 83 | 2.0% |
| $35,000 to $49,999 | 493 | 11.9% |
| $50,000 to $74,999 | 675 | 16.3% |
| $75,000 to $99,999 | 662 | 16.0% |
| $100,000 to $149,999 | 1,080 | 26.1% |
| $150,000 to $199,999 | 497 | 12.0% |
| $200,000+ | 493 | 11.9% |
Family Income by Famaliy Size in Gold Canyon
5-person families (89 | 2.1%) account for the highest median family income in Gold Canyon with $247,279 per family, while 2-person families (3,539 | 85.5%) have the highest median income of $49,888 per family member.
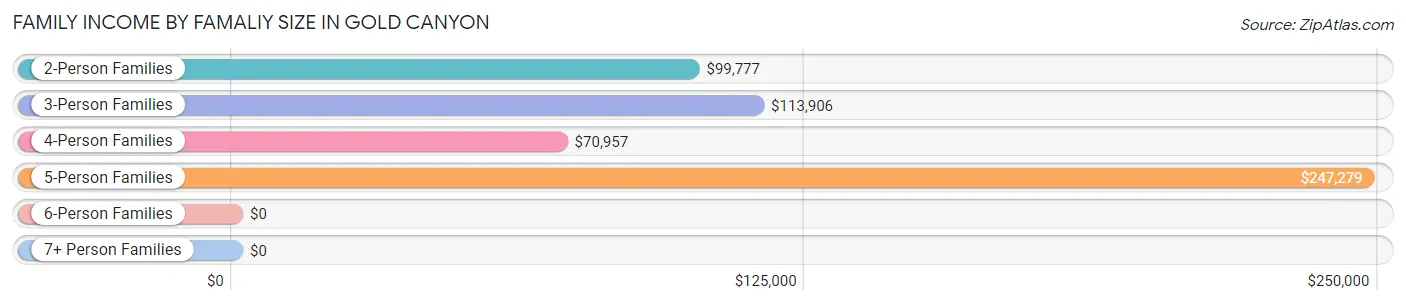
| Income Bracket | # Families | Median Income |
| 2-Person Families | 3,539 (85.5%) | $99,777 |
| 3-Person Families | 312 (7.5%) | $113,906 |
| 4-Person Families | 149 (3.6%) | $70,957 |
| 5-Person Families | 89 (2.1%) | $247,279 |
| 6-Person Families | 25 (0.6%) | $0 |
| 7+ Person Families | 25 (0.6%) | $0 |
| Total | 4,139 (100.0%) | $100,104 |
Family Income by Number of Earners in Gold Canyon
The median family income in Gold Canyon is $100,104, with families comprising 2 earners (826) having the highest median family income of $136,141, while families with 3+ earners (100) have the lowest median family income of $79,100, accounting for 20.0% and 2.4% of families, respectively.
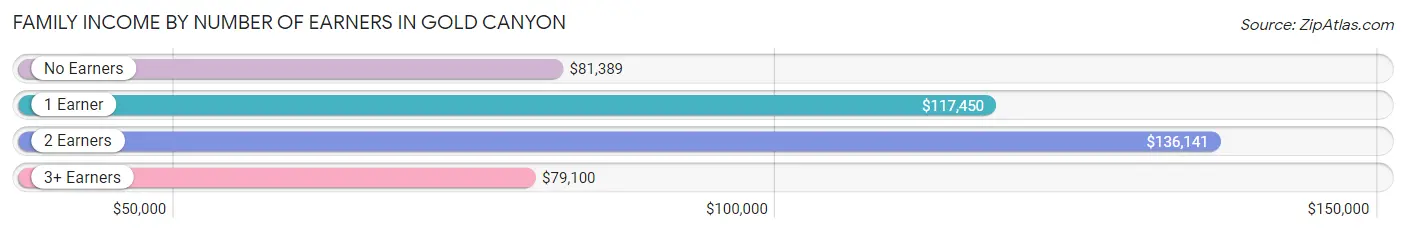
| Number of Earners | # Families | Median Income |
| No Earners | 2,184 (52.8%) | $81,389 |
| 1 Earner | 1,029 (24.9%) | $117,450 |
| 2 Earners | 826 (20.0%) | $136,141 |
| 3+ Earners | 100 (2.4%) | $79,100 |
| Total | 4,139 (100.0%) | $100,104 |
Household Income in Gold Canyon
Household Income Brackets in Gold Canyon
With 1,215 households falling in the category, the $100,000 to $149,999 income range is the most frequent in Gold Canyon, accounting for 20.9% of all households. In contrast, only 81 households (1.4%) fall into the $10,000 to $14,999 income bracket, making it the least populous group.
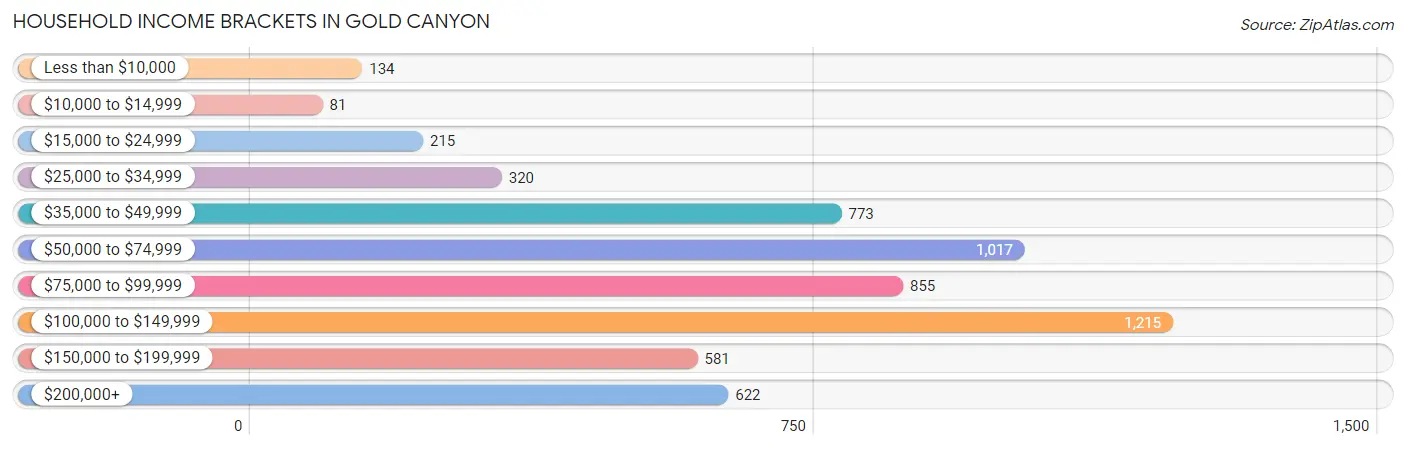
| Income Bracket | # Households | % Households |
| Less than $10,000 | 134 | 2.3% |
| $10,000 to $14,999 | 81 | 1.4% |
| $15,000 to $24,999 | 215 | 3.7% |
| $25,000 to $34,999 | 320 | 5.5% |
| $35,000 to $49,999 | 773 | 13.3% |
| $50,000 to $74,999 | 1,017 | 17.5% |
| $75,000 to $99,999 | 855 | 14.7% |
| $100,000 to $149,999 | 1,215 | 20.9% |
| $150,000 to $199,999 | 581 | 10.0% |
| $200,000+ | 622 | 10.7% |
Household Income by Householder Age in Gold Canyon
The median household income in Gold Canyon is $83,654, with the highest median household income of $119,672 found in the 25 to 44 years age bracket for the primary householder. A total of 390 households (6.7%) fall into this category. Meanwhile, the 15 to 24 years age bracket for the primary householder has the lowest median household income of $0, with 42 households (0.7%) in this group.
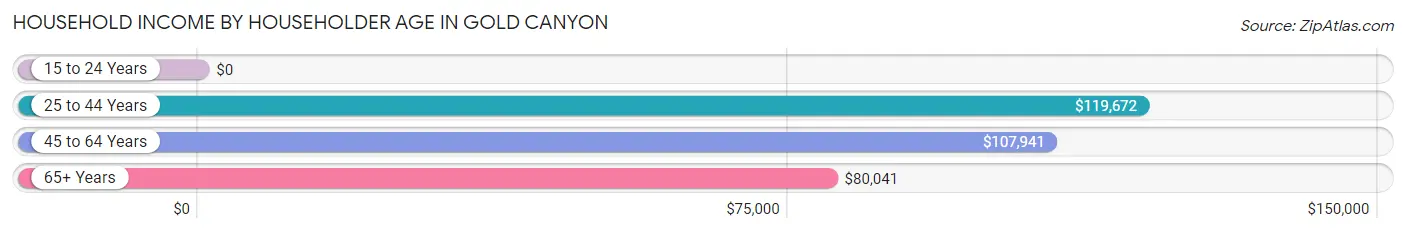
| Income Bracket | # Households | Median Income |
| 15 to 24 Years | 42 (0.7%) | $0 |
| 25 to 44 Years | 390 (6.7%) | $119,672 |
| 45 to 64 Years | 1,662 (28.6%) | $107,941 |
| 65+ Years | 3,720 (64.0%) | $80,041 |
| Total | 5,814 (100.0%) | $83,654 |
Poverty in Gold Canyon
Income Below Poverty by Sex and Age in Gold Canyon
With 6.3% poverty level for males and 8.3% for females among the residents of Gold Canyon, 25 to 34 year old males and 6 to 11 year old females are the most vulnerable to poverty, with 65 males (34.0%) and 93 females (89.4%) in their respective age groups living below the poverty level.
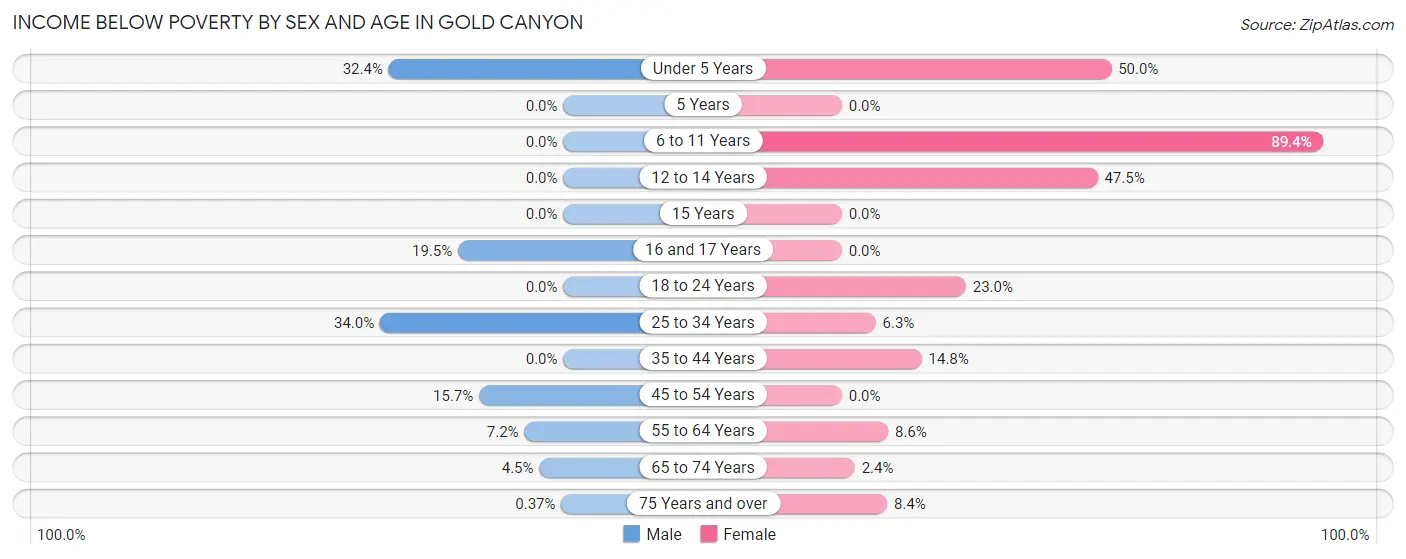
| Age Bracket | Male | Female |
| Under 5 Years | 35 (32.4%) | 27 (50.0%) |
| 5 Years | 0 (0.0%) | 0 (0.0%) |
| 6 to 11 Years | 0 (0.0%) | 93 (89.4%) |
| 12 to 14 Years | 0 (0.0%) | 28 (47.5%) |
| 15 Years | 0 (0.0%) | 0 (0.0%) |
| 16 and 17 Years | 17 (19.5%) | 0 (0.0%) |
| 18 to 24 Years | 0 (0.0%) | 61 (23.0%) |
| 25 to 34 Years | 65 (34.0%) | 17 (6.3%) |
| 35 to 44 Years | 0 (0.0%) | 40 (14.8%) |
| 45 to 54 Years | 69 (15.7%) | 0 (0.0%) |
| 55 to 64 Years | 64 (7.2%) | 100 (8.6%) |
| 65 to 74 Years | 80 (4.4%) | 47 (2.4%) |
| 75 Years and over | 5 (0.4%) | 104 (8.4%) |
| Total | 335 (6.3%) | 517 (8.3%) |
Income Above Poverty by Sex and Age in Gold Canyon
According to the poverty statistics in Gold Canyon, males aged 5 years and females aged 5 years are the age groups that are most secure financially, with 100.0% of males and 100.0% of females in these age groups living above the poverty line.
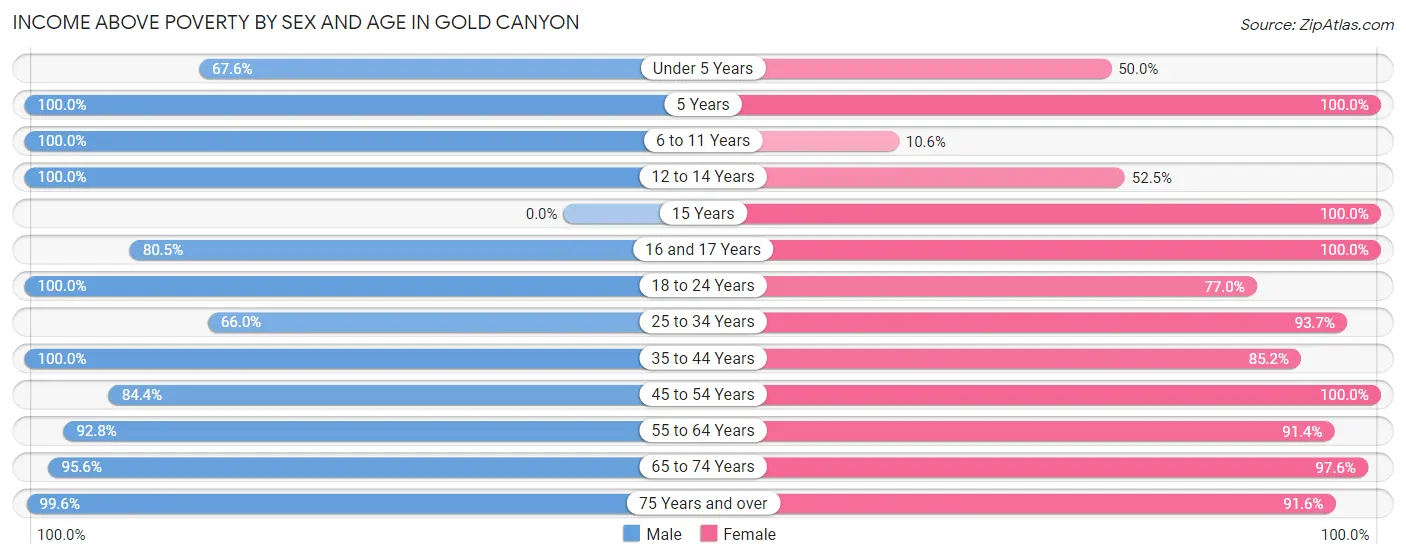
| Age Bracket | Male | Female |
| Under 5 Years | 73 (67.6%) | 27 (50.0%) |
| 5 Years | 30 (100.0%) | 15 (100.0%) |
| 6 to 11 Years | 81 (100.0%) | 11 (10.6%) |
| 12 to 14 Years | 31 (100.0%) | 31 (52.5%) |
| 15 Years | 0 (0.0%) | 52 (100.0%) |
| 16 and 17 Years | 70 (80.5%) | 115 (100.0%) |
| 18 to 24 Years | 100 (100.0%) | 204 (77.0%) |
| 25 to 34 Years | 126 (66.0%) | 254 (93.7%) |
| 35 to 44 Years | 214 (100.0%) | 230 (85.2%) |
| 45 to 54 Years | 372 (84.4%) | 652 (100.0%) |
| 55 to 64 Years | 823 (92.8%) | 1,065 (91.4%) |
| 65 to 74 Years | 1,719 (95.6%) | 1,908 (97.6%) |
| 75 Years and over | 1,349 (99.6%) | 1,135 (91.6%) |
| Total | 4,988 (93.7%) | 5,699 (91.7%) |
Income Below Poverty Among Married-Couple Families in Gold Canyon
The poverty statistics for married-couple families in Gold Canyon show that 3.4% or 127 of the total 3,751 families live below the poverty line. Families with 5 or more children have the highest poverty rate of 100.0%, comprising of 25 families. On the other hand, families with 3 or 4 children have the lowest poverty rate of 0.0%, which includes 0 families.
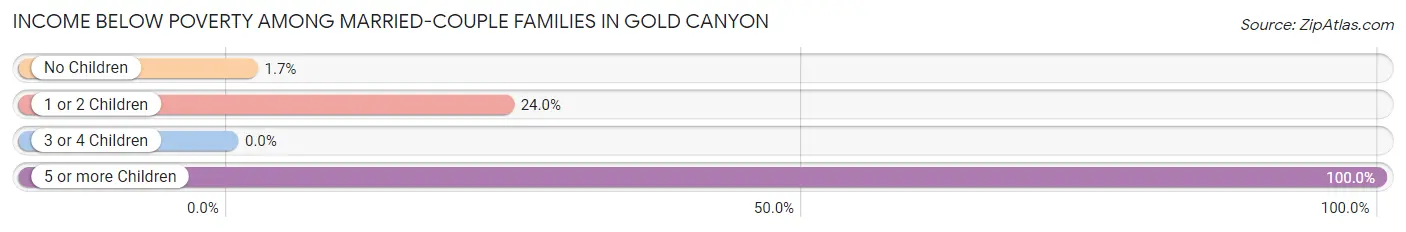
| Children | Above Poverty | Below Poverty |
| No Children | 3,461 (98.3%) | 60 (1.7%) |
| 1 or 2 Children | 133 (76.0%) | 42 (24.0%) |
| 3 or 4 Children | 30 (100.0%) | 0 (0.0%) |
| 5 or more Children | 0 (0.0%) | 25 (100.0%) |
| Total | 3,624 (96.6%) | 127 (3.4%) |
Income Below Poverty Among Single-Parent Households in Gold Canyon
According to the poverty data in Gold Canyon, 4.4% or 8 single-father households and 3.4% or 7 single-mother households are living below the poverty line. Among single-father households, those with 1 or 2 children have the highest poverty rate, with 8 households (9.3%) experiencing poverty. Likewise, among single-mother households, those with no children have the highest poverty rate, with 7 households (6.2%) falling below the poverty line.
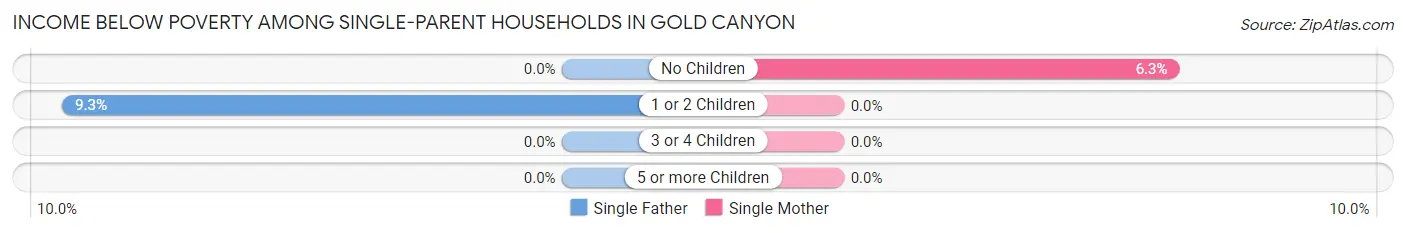
| Children | Single Father | Single Mother |
| No Children | 0 (0.0%) | 7 (6.2%) |
| 1 or 2 Children | 8 (9.3%) | 0 (0.0%) |
| 3 or 4 Children | 0 (0.0%) | 0 (0.0%) |
| 5 or more Children | 0 (0.0%) | 0 (0.0%) |
| Total | 8 (4.4%) | 7 (3.4%) |
Income Below Poverty Among Married-Couple vs Single-Parent Households in Gold Canyon
The poverty data for Gold Canyon shows that 127 of the married-couple family households (3.4%) and 15 of the single-parent households (3.9%) are living below the poverty level. Within the married-couple family households, those with 5 or more children have the highest poverty rate, with 25 households (100.0%) falling below the poverty line. Among the single-parent households, those with 1 or 2 children have the highest poverty rate, with 8 household (4.4%) living below poverty.
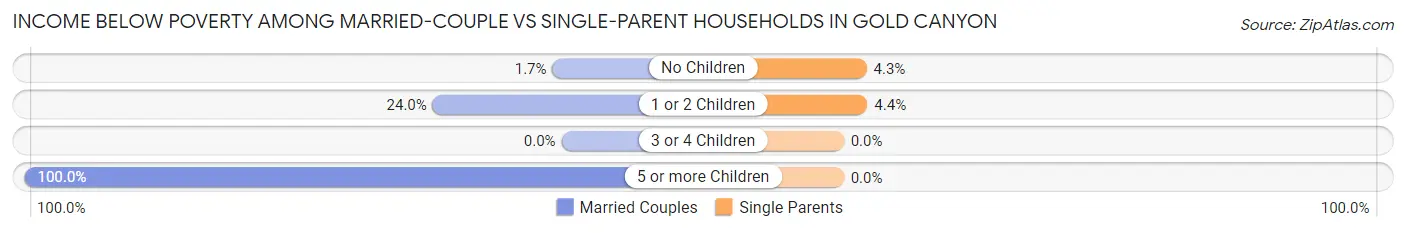
| Children | Married-Couple Families | Single-Parent Households |
| No Children | 60 (1.7%) | 7 (4.3%) |
| 1 or 2 Children | 42 (24.0%) | 8 (4.4%) |
| 3 or 4 Children | 0 (0.0%) | 0 (0.0%) |
| 5 or more Children | 25 (100.0%) | 0 (0.0%) |
| Total | 127 (3.4%) | 15 (3.9%) |
Race in Gold Canyon
The most populous races in Gold Canyon are White / Caucasian (10,643 | 92.0%), Hispanic or Latino (941 | 8.1%), and Two or more Races (558 | 4.8%).
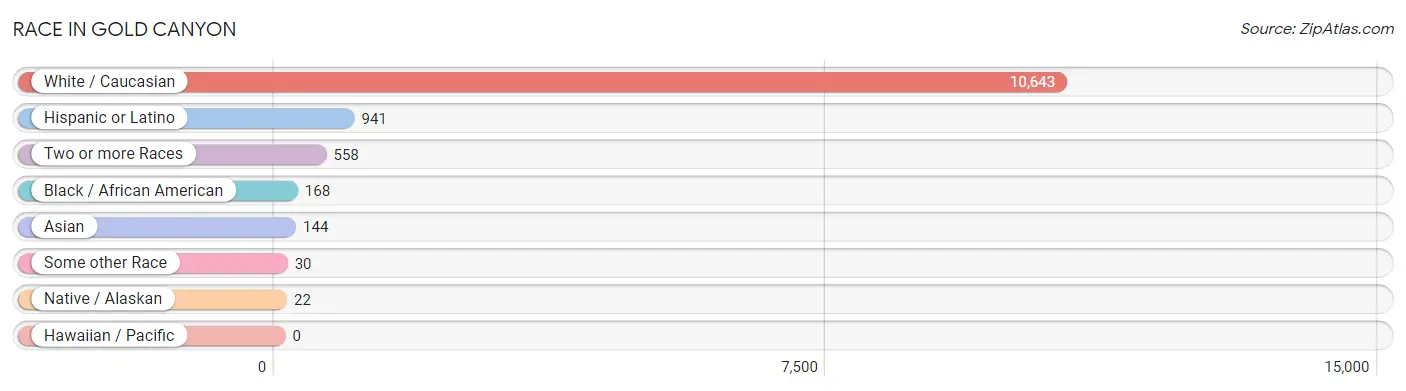
| Race | # Population | % Population |
| Asian | 144 | 1.3% |
| Black / African American | 168 | 1.5% |
| Hawaiian / Pacific | 0 | 0.0% |
| Hispanic or Latino | 941 | 8.1% |
| Native / Alaskan | 22 | 0.2% |
| White / Caucasian | 10,643 | 92.0% |
| Two or more Races | 558 | 4.8% |
| Some other Race | 30 | 0.3% |
| Total | 11,565 | 100.0% |
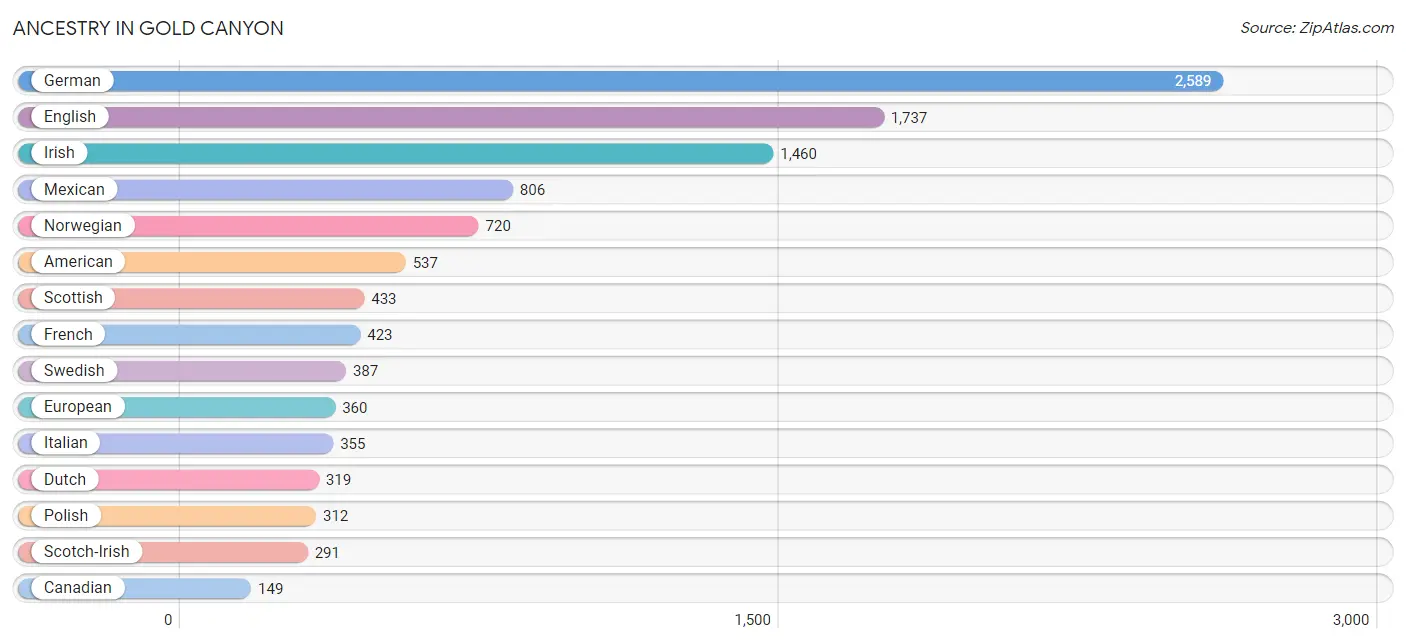
Ancestry in Gold Canyon
The most populous ancestries reported in Gold Canyon are German (2,589 | 22.4%), English (1,737 | 15.0%), Irish (1,460 | 12.6%), Mexican (806 | 7.0%), and Norwegian (720 | 6.2%), together accounting for 63.2% of all Gold Canyon residents.
| Ancestry | # Population | % Population |
| Albanian | 13 | 0.1% |
| Alsatian | 4 | 0.0% |
| American | 537 | 4.6% |
| Arab | 15 | 0.1% |
| Australian | 19 | 0.2% |
| Austrian | 89 | 0.8% |
| Belgian | 33 | 0.3% |
| Brazilian | 63 | 0.5% |
| British | 131 | 1.1% |
| Burmese | 24 | 0.2% |
| Canadian | 149 | 1.3% |
| Celtic | 12 | 0.1% |
| Central American | 16 | 0.1% |
| Cherokee | 68 | 0.6% |
| Choctaw | 76 | 0.7% |
| Croatian | 27 | 0.2% |
| Cuban | 6 | 0.1% |
| Czech | 31 | 0.3% |
| Czechoslovakian | 36 | 0.3% |
| Danish | 116 | 1.0% |
| Dutch | 319 | 2.8% |
| Eastern European | 107 | 0.9% |
| English | 1,737 | 15.0% |
| European | 360 | 3.1% |
| Filipino | 36 | 0.3% |
| Finnish | 77 | 0.7% |
| French | 423 | 3.7% |
| French Canadian | 91 | 0.8% |
| German | 2,589 | 22.4% |
| Greek | 6 | 0.1% |
| Hungarian | 68 | 0.6% |
| Indian (Asian) | 13 | 0.1% |
| Inupiat | 22 | 0.2% |
| Irish | 1,460 | 12.6% |
| Italian | 355 | 3.1% |
| Japanese | 12 | 0.1% |
| Korean | 54 | 0.5% |
| Lebanese | 15 | 0.1% |
| Lithuanian | 24 | 0.2% |
| Macedonian | 17 | 0.2% |
| Mexican | 806 | 7.0% |
| Northern European | 4 | 0.0% |
| Norwegian | 720 | 6.2% |
| Peruvian | 47 | 0.4% |
| Polish | 312 | 2.7% |
| Portuguese | 17 | 0.2% |
| Puerto Rican | 18 | 0.2% |
| Romanian | 31 | 0.3% |
| Russian | 20 | 0.2% |
| Salvadoran | 16 | 0.1% |
| Scandinavian | 91 | 0.8% |
| Scotch-Irish | 291 | 2.5% |
| Scottish | 433 | 3.7% |
| Serbian | 5 | 0.0% |
| Slovak | 18 | 0.2% |
| Slovene | 13 | 0.1% |
| South American | 47 | 0.4% |
| Spaniard | 14 | 0.1% |
| Spanish | 16 | 0.1% |
| Swedish | 387 | 3.4% |
| Swiss | 8 | 0.1% |
| Thai | 5 | 0.0% |
| Tongan | 9 | 0.1% |
| Ukrainian | 44 | 0.4% |
| Welsh | 146 | 1.3% | View All 65 Rows |
Immigrants in Gold Canyon
The most numerous immigrant groups reported in Gold Canyon came from Canada (305 | 2.6%), Europe (120 | 1.0%), Asia (118 | 1.0%), Latin America (77 | 0.7%), and South Eastern Asia (67 | 0.6%), together accounting for 5.9% of all Gold Canyon residents.
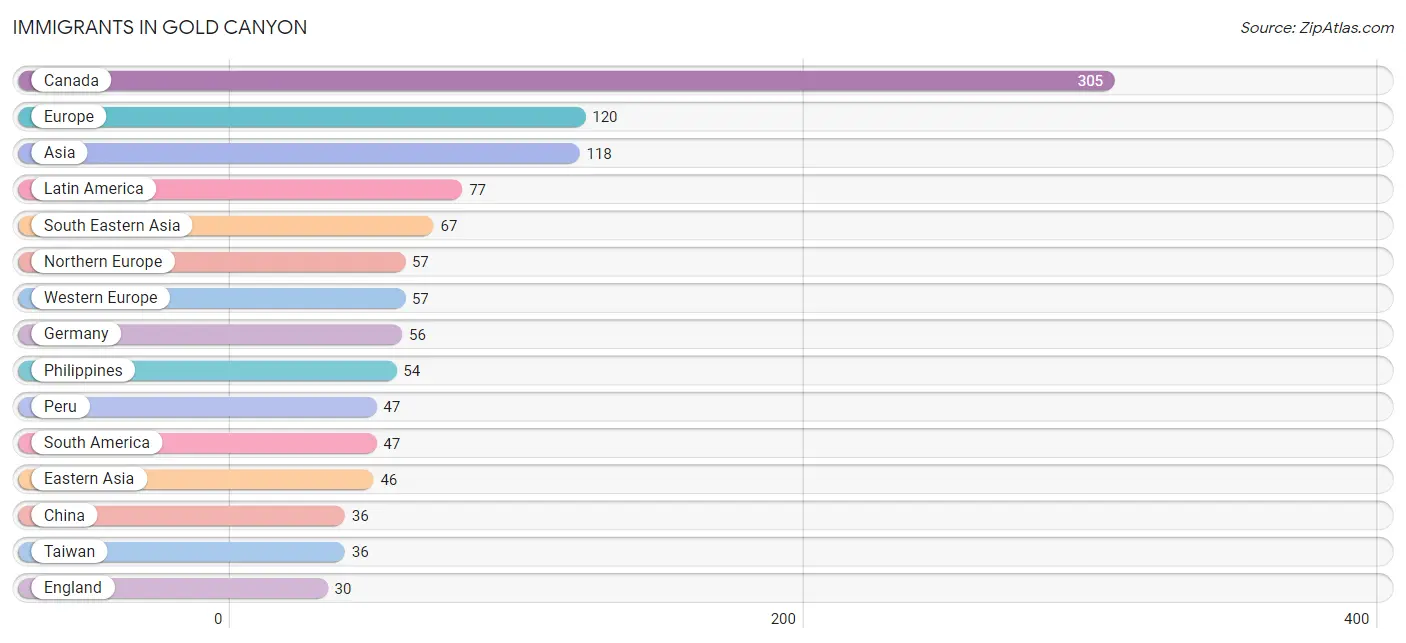
| Immigration Origin | # Population | % Population |
| Asia | 118 | 1.0% |
| Canada | 305 | 2.6% |
| Caribbean | 6 | 0.1% |
| Central America | 24 | 0.2% |
| China | 36 | 0.3% |
| Cuba | 6 | 0.1% |
| Eastern Asia | 46 | 0.4% |
| England | 30 | 0.3% |
| Europe | 120 | 1.0% |
| France | 1 | 0.0% |
| Germany | 56 | 0.5% |
| Greece | 6 | 0.1% |
| India | 5 | 0.0% |
| Korea | 10 | 0.1% |
| Latin America | 77 | 0.7% |
| Mexico | 24 | 0.2% |
| Northern Europe | 57 | 0.5% |
| Peru | 47 | 0.4% |
| Philippines | 54 | 0.5% |
| South America | 47 | 0.4% |
| South Central Asia | 5 | 0.0% |
| South Eastern Asia | 67 | 0.6% |
| Southern Europe | 6 | 0.1% |
| Taiwan | 36 | 0.3% |
| Vietnam | 13 | 0.1% |
| Western Europe | 57 | 0.5% | View All 26 Rows |
Sex and Age in Gold Canyon
Sex and Age in Gold Canyon
The most populous age groups in Gold Canyon are 70 to 74 Years (1,042 | 19.5%) for men and 70 to 74 Years (1,107 | 17.8%) for women.
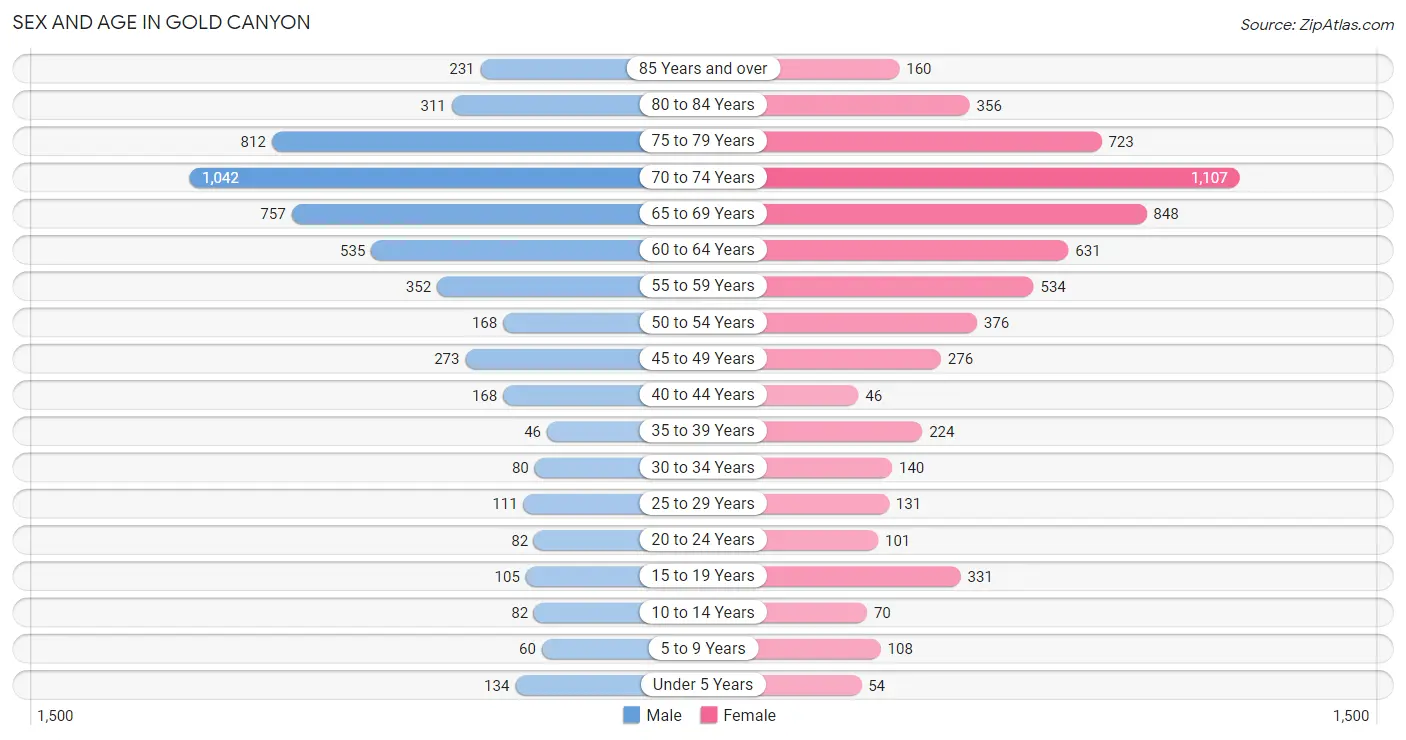
| Age Bracket | Male | Female |
| Under 5 Years | 134 (2.5%) | 54 (0.9%) |
| 5 to 9 Years | 60 (1.1%) | 108 (1.7%) |
| 10 to 14 Years | 82 (1.5%) | 70 (1.1%) |
| 15 to 19 Years | 105 (2.0%) | 331 (5.3%) |
| 20 to 24 Years | 82 (1.5%) | 101 (1.6%) |
| 25 to 29 Years | 111 (2.1%) | 131 (2.1%) |
| 30 to 34 Years | 80 (1.5%) | 140 (2.2%) |
| 35 to 39 Years | 46 (0.9%) | 224 (3.6%) |
| 40 to 44 Years | 168 (3.1%) | 46 (0.7%) |
| 45 to 49 Years | 273 (5.1%) | 276 (4.4%) |
| 50 to 54 Years | 168 (3.1%) | 376 (6.0%) |
| 55 to 59 Years | 352 (6.6%) | 534 (8.6%) |
| 60 to 64 Years | 535 (10.0%) | 631 (10.2%) |
| 65 to 69 Years | 757 (14.1%) | 848 (13.6%) |
| 70 to 74 Years | 1,042 (19.5%) | 1,107 (17.8%) |
| 75 to 79 Years | 812 (15.2%) | 723 (11.6%) |
| 80 to 84 Years | 311 (5.8%) | 356 (5.7%) |
| 85 Years and over | 231 (4.3%) | 160 (2.6%) |
| Total | 5,349 (100.0%) | 6,216 (100.0%) |
Families and Households in Gold Canyon
Median Family Size in Gold Canyon
The median family size in Gold Canyon is 2.29 persons per family, with single female/mother families (207 | 5.0%) accounting for the largest median family size of 2.91 persons per family. On the other hand, married-couple families (3,751 | 90.6%) represent the smallest median family size with 2.23 persons per family.
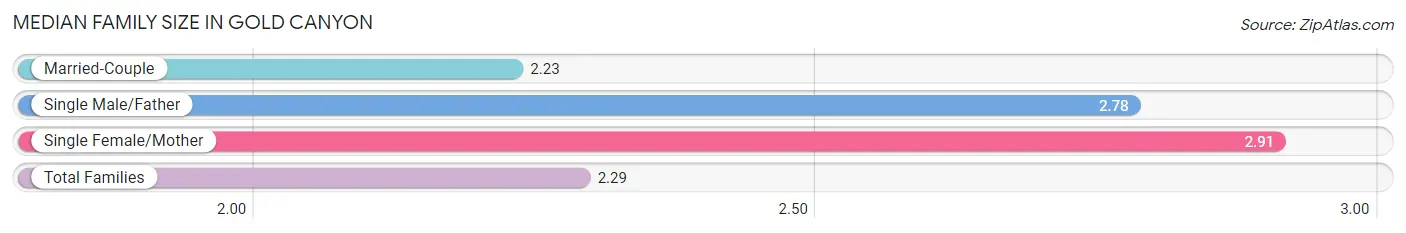
| Family Type | # Families | Family Size |
| Married-Couple | 3,751 (90.6%) | 2.23 |
| Single Male/Father | 181 (4.4%) | 2.78 |
| Single Female/Mother | 207 (5.0%) | 2.91 |
| Total Families | 4,139 (100.0%) | 2.29 |
Median Household Size in Gold Canyon
The median household size in Gold Canyon is 1.99 persons per household, with single female/mother households (207 | 3.6%) accounting for the largest median household size of 3.25 persons per household. non-family households (1,675 | 28.8%) represent the smallest median household size with 1.17 persons per household.
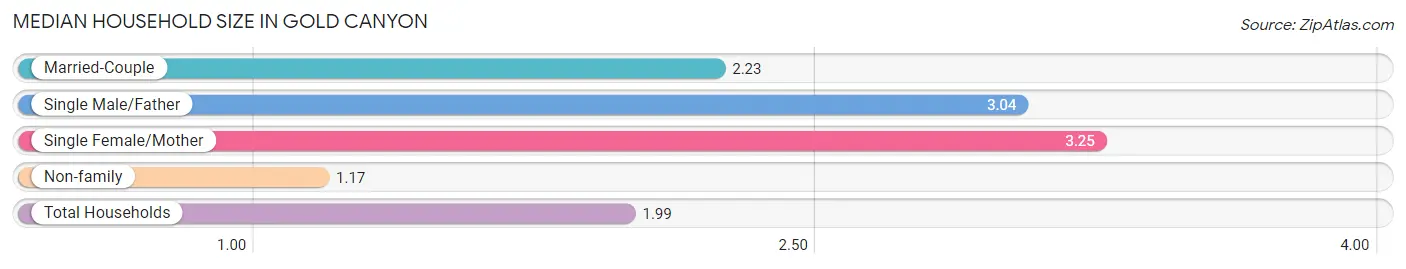
| Household Type | # Households | Household Size |
| Married-Couple | 3,751 (64.5%) | 2.23 |
| Single Male/Father | 181 (3.1%) | 3.04 |
| Single Female/Mother | 207 (3.6%) | 3.25 |
| Non-family | 1,675 (28.8%) | 1.17 |
| Total Households | 5,814 (100.0%) | 1.99 |
Household Size by Marriage Status in Gold Canyon
Out of a total of 5,814 households in Gold Canyon, 4,139 (71.2%) are family households, while 1,675 (28.8%) are nonfamily households. The most numerous type of family households are 2-person households, comprising 3,539, and the most common type of nonfamily households are 1-person households, comprising 1,359.
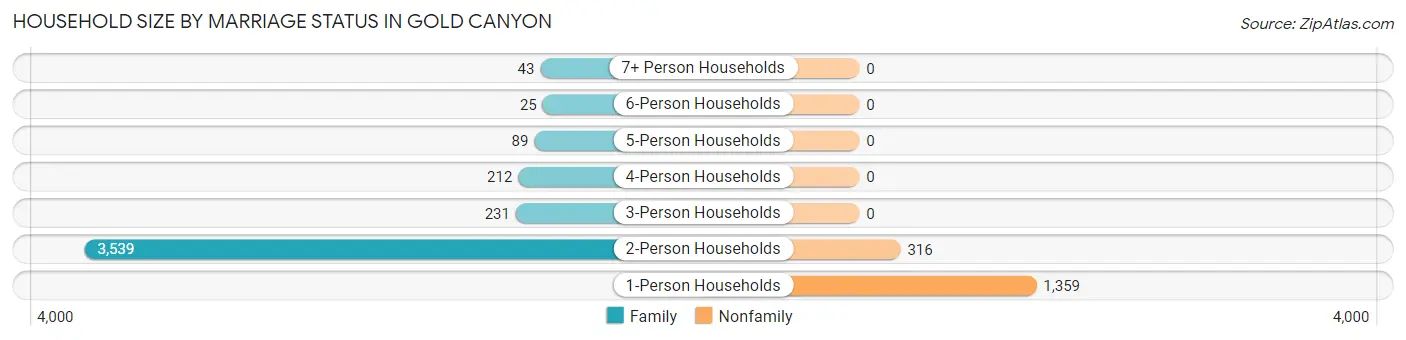
| Household Size | Family Households | Nonfamily Households |
| 1-Person Households | - | 1,359 (23.4%) |
| 2-Person Households | 3,539 (60.9%) | 316 (5.4%) |
| 3-Person Households | 231 (4.0%) | 0 (0.0%) |
| 4-Person Households | 212 (3.6%) | 0 (0.0%) |
| 5-Person Households | 89 (1.5%) | 0 (0.0%) |
| 6-Person Households | 25 (0.4%) | 0 (0.0%) |
| 7+ Person Households | 43 (0.7%) | 0 (0.0%) |
| Total | 4,139 (71.2%) | 1,675 (28.8%) |
Female Fertility in Gold Canyon
Fertility by Age in Gold Canyon
Average fertility rate in Gold Canyon is 16.0 births per 1,000 women. Women in the age bracket of 35 to 50 years have the highest fertility rate with 34.0 births per 1,000 women. Women in the age bracket of 35 to 50 years acount for 100.0% of all women with births.
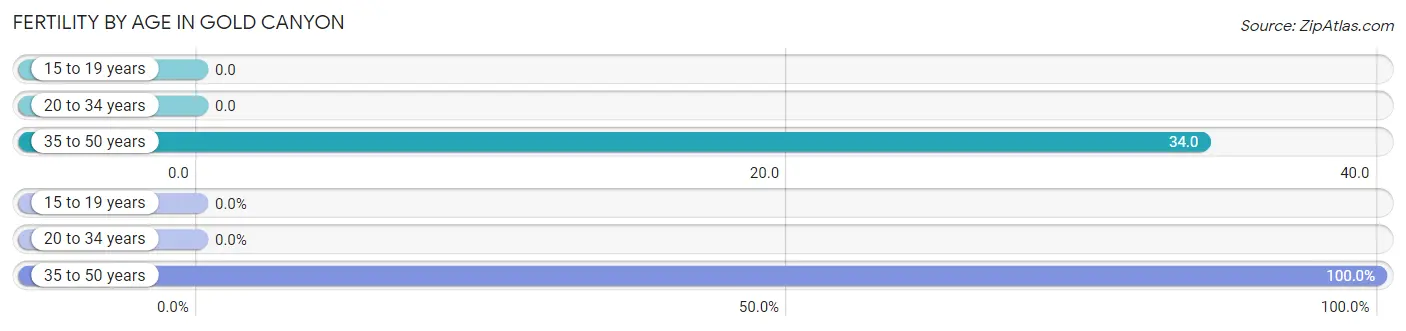
| Age Bracket | Women with Births | Births / 1,000 Women |
| 15 to 19 years | 0 (0.0%) | 0.0 |
| 20 to 34 years | 0 (0.0%) | 0.0 |
| 35 to 50 years | 21 (100.0%) | 34.0 |
| Total | 21 (100.0%) | 16.0 |
Fertility by Age by Marriage Status in Gold Canyon
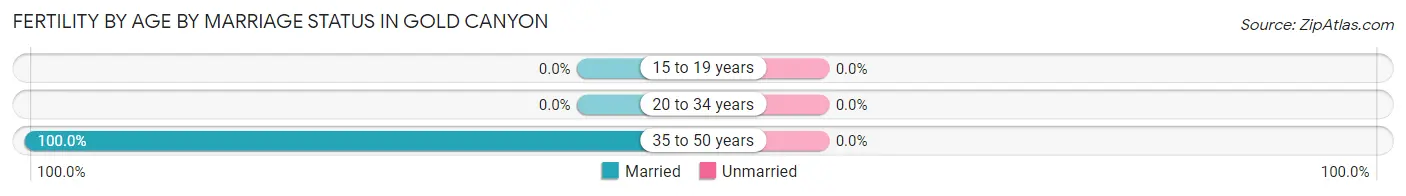
| Age Bracket | Married | Unmarried |
| 15 to 19 years | 0 (0.0%) | 0 (0.0%) |
| 20 to 34 years | 0 (0.0%) | 0 (0.0%) |
| 35 to 50 years | 21 (100.0%) | 0 (0.0%) |
| Total | 21 (100.0%) | 0 (0.0%) |
Fertility by Education in Gold Canyon
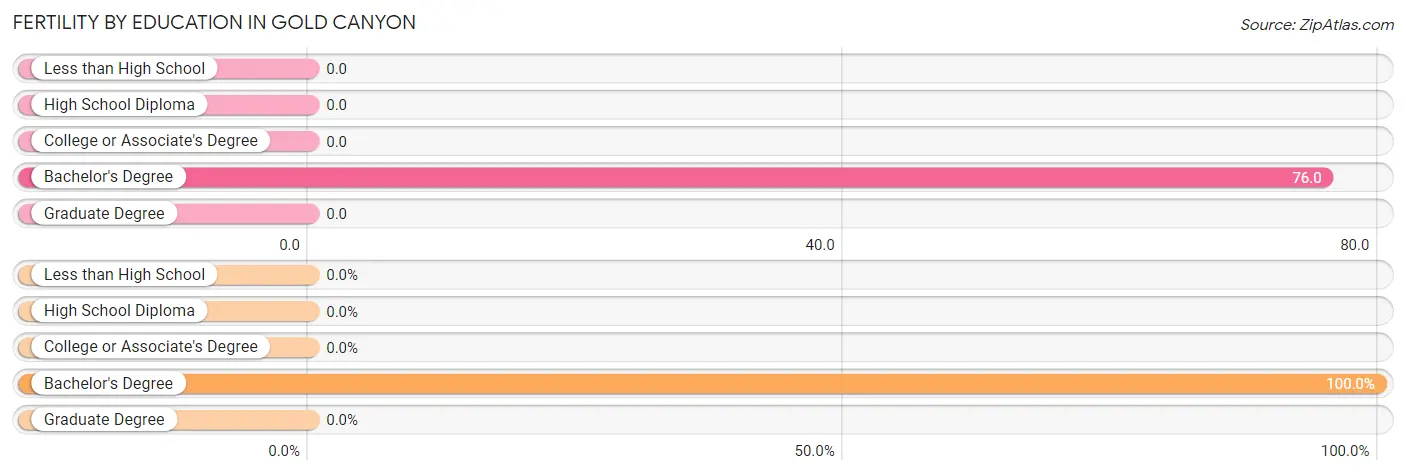
| Educational Attainment | Women with Births | Births / 1,000 Women |
| Less than High School | 0 (0.0%) | 0.0 |
| High School Diploma | 0 (0.0%) | 0.0 |
| College or Associate's Degree | 0 (0.0%) | 0.0 |
| Bachelor's Degree | 21 (100.0%) | 76.0 |
| Graduate Degree | 0 (0.0%) | 0.0 |
| Total | 21 (100.0%) | 16.0 |
Fertility by Education by Marriage Status in Gold Canyon
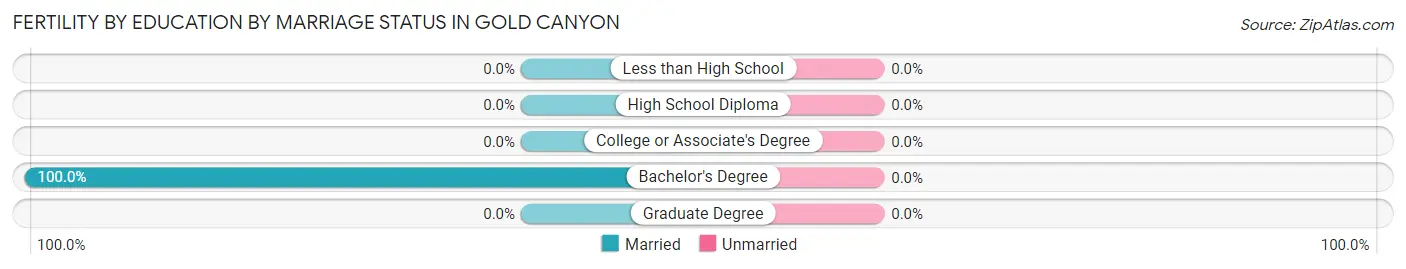
| Educational Attainment | Married | Unmarried |
| Less than High School | 0 (0.0%) | 0 (0.0%) |
| High School Diploma | 0 (0.0%) | 0 (0.0%) |
| College or Associate's Degree | 0 (0.0%) | 0 (0.0%) |
| Bachelor's Degree | 21 (100.0%) | 0 (0.0%) |
| Graduate Degree | 0 (0.0%) | 0 (0.0%) |
| Total | 21 (100.0%) | 0 (0.0%) |
Employment Characteristics in Gold Canyon
Employment by Class of Employer in Gold Canyon
Among the 3,144 employed individuals in Gold Canyon, private company employees (1,956 | 62.2%), self-employed (incorporated) (389 | 12.4%), and not-for-profit organizations (312 | 9.9%) make up the most common classes of employment.
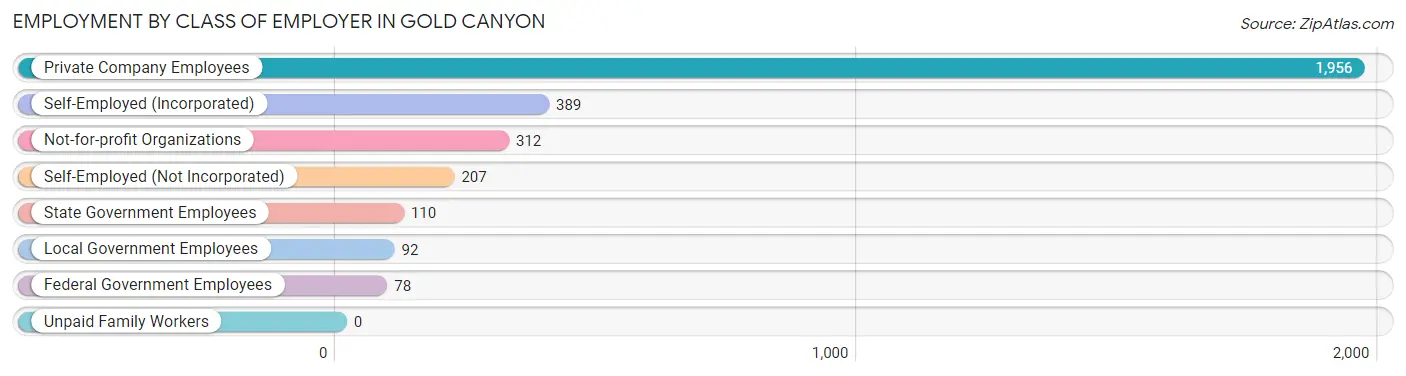
| Employer Class | # Employees | % Employees |
| Private Company Employees | 1,956 | 62.2% |
| Self-Employed (Incorporated) | 389 | 12.4% |
| Self-Employed (Not Incorporated) | 207 | 6.6% |
| Not-for-profit Organizations | 312 | 9.9% |
| Local Government Employees | 92 | 2.9% |
| State Government Employees | 110 | 3.5% |
| Federal Government Employees | 78 | 2.5% |
| Unpaid Family Workers | 0 | 0.0% |
| Total | 3,144 | 100.0% |
Employment Status by Age in Gold Canyon
According to the labor force statistics for Gold Canyon, out of the total population over 16 years of age (11,005), 30.6% or 3,368 individuals are in the labor force, with 4.1% or 138 of them unemployed. The age group with the highest labor force participation rate is 25 to 29 years, with 83.5% or 202 individuals in the labor force. Within the labor force, the 20 to 24 years age range has the highest percentage of unemployed individuals, with 40.6% or 56 of them being unemployed.
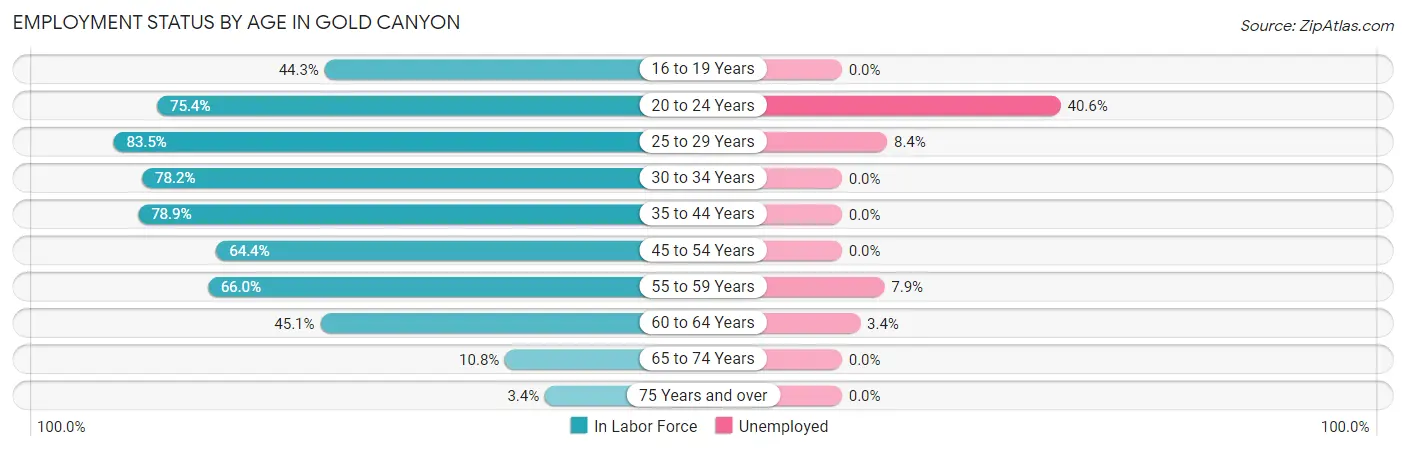
| Age Bracket | In Labor Force | Unemployed |
| 16 to 19 Years | 170 (44.3%) | 0 (0.0%) |
| 20 to 24 Years | 138 (75.4%) | 56 (40.6%) |
| 25 to 29 Years | 202 (83.5%) | 17 (8.4%) |
| 30 to 34 Years | 172 (78.2%) | 0 (0.0%) |
| 35 to 44 Years | 382 (78.9%) | 0 (0.0%) |
| 45 to 54 Years | 704 (64.4%) | 0 (0.0%) |
| 55 to 59 Years | 585 (66.0%) | 46 (7.9%) |
| 60 to 64 Years | 526 (45.1%) | 18 (3.4%) |
| 65 to 74 Years | 405 (10.8%) | 0 (0.0%) |
| 75 Years and over | 88 (3.4%) | 0 (0.0%) |
| Total | 3,368 (30.6%) | 138 (4.1%) |
Employment Status by Educational Attainment in Gold Canyon
According to labor force statistics for Gold Canyon, 62.8% of individuals (2,569) out of the total population between 25 and 64 years of age (4,091) are in the labor force, with 3.2% or 82 of them being unemployed. The group with the highest labor force participation rate are those with the educational attainment of bachelor's degree or higher, with 67.0% or 935 individuals in the labor force. Within the labor force, individuals with high school diploma education have the highest percentage of unemployment, with 8.9% or 40 of them being unemployed.
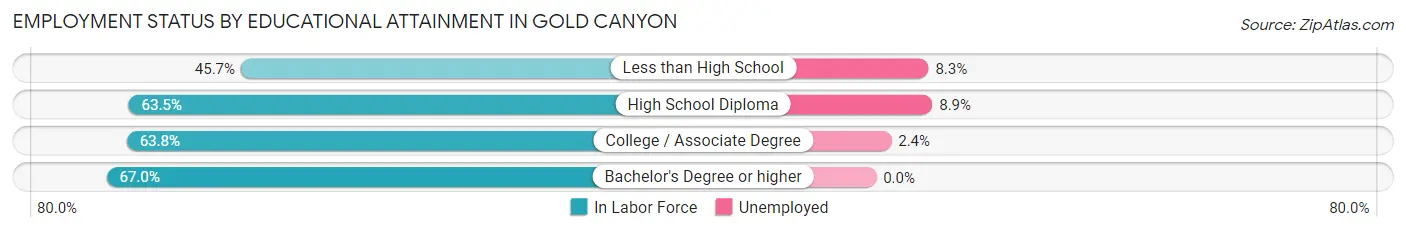
| Educational Attainment | In Labor Force | Unemployed |
| Less than High School | 204 (45.7%) | 37 (8.3%) |
| High School Diploma | 448 (63.5%) | 63 (8.9%) |
| College / Associate Degree | 986 (63.8%) | 37 (2.4%) |
| Bachelor's Degree or higher | 935 (67.0%) | 0 (0.0%) |
| Total | 2,569 (62.8%) | 131 (3.2%) |
Employment Occupations by Sex in Gold Canyon
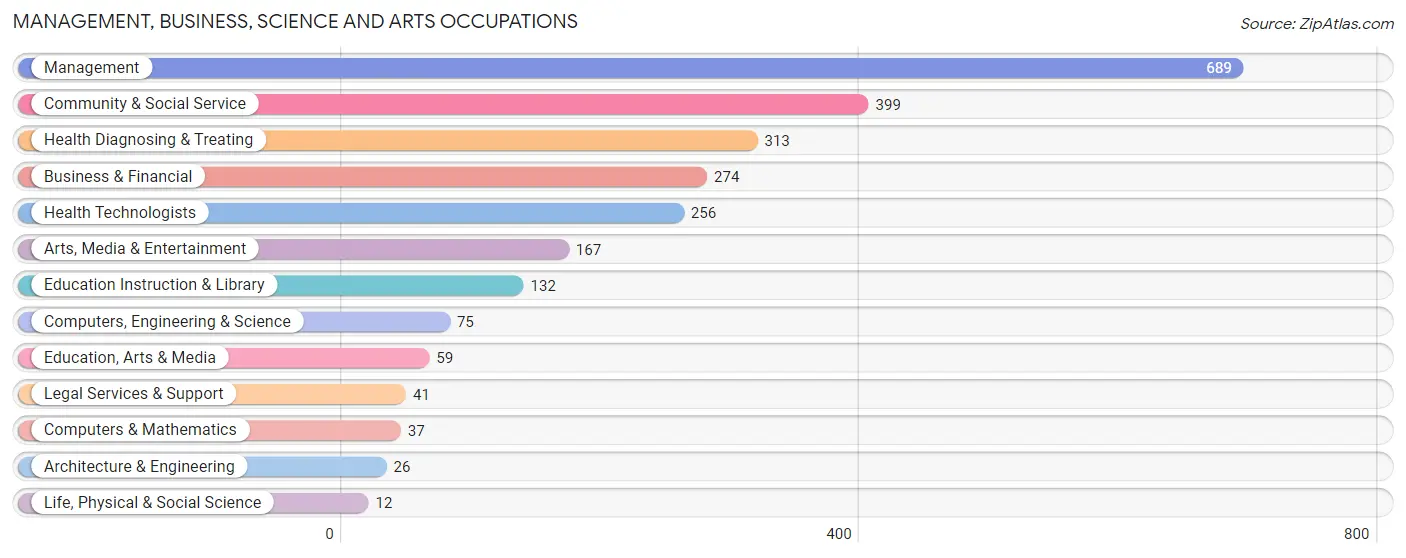
Management, Business, Science and Arts Occupations
The most common Management, Business, Science and Arts occupations in Gold Canyon are Management (689 | 21.3%), Community & Social Service (399 | 12.3%), Health Diagnosing & Treating (313 | 9.7%), Business & Financial (274 | 8.5%), and Health Technologists (256 | 7.9%).
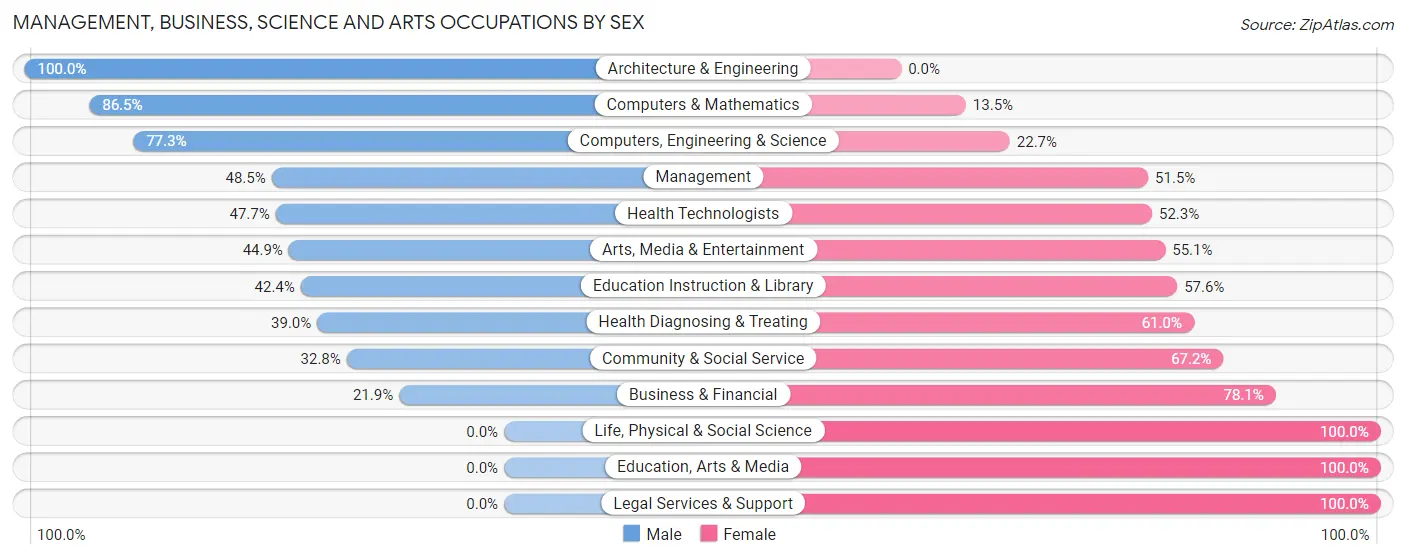
Management, Business, Science and Arts Occupations by Sex
Within the Management, Business, Science and Arts occupations in Gold Canyon, the most male-oriented occupations are Architecture & Engineering (100.0%), Computers & Mathematics (86.5%), and Computers, Engineering & Science (77.3%), while the most female-oriented occupations are Life, Physical & Social Science (100.0%), Education, Arts & Media (100.0%), and Legal Services & Support (100.0%).
| Occupation | Male | Female |
| Management | 334 (48.5%) | 355 (51.5%) |
| Business & Financial | 60 (21.9%) | 214 (78.1%) |
| Computers, Engineering & Science | 58 (77.3%) | 17 (22.7%) |
| Computers & Mathematics | 32 (86.5%) | 5 (13.5%) |
| Architecture & Engineering | 26 (100.0%) | 0 (0.0%) |
| Life, Physical & Social Science | 0 (0.0%) | 12 (100.0%) |
| Community & Social Service | 131 (32.8%) | 268 (67.2%) |
| Education, Arts & Media | 0 (0.0%) | 59 (100.0%) |
| Legal Services & Support | 0 (0.0%) | 41 (100.0%) |
| Education Instruction & Library | 56 (42.4%) | 76 (57.6%) |
| Arts, Media & Entertainment | 75 (44.9%) | 92 (55.1%) |
| Health Diagnosing & Treating | 122 (39.0%) | 191 (61.0%) |
| Health Technologists | 122 (47.7%) | 134 (52.3%) |
| Total (Category) | 705 (40.3%) | 1,045 (59.7%) |
| Total (Overall) | 1,473 (45.5%) | 1,762 (54.5%) |
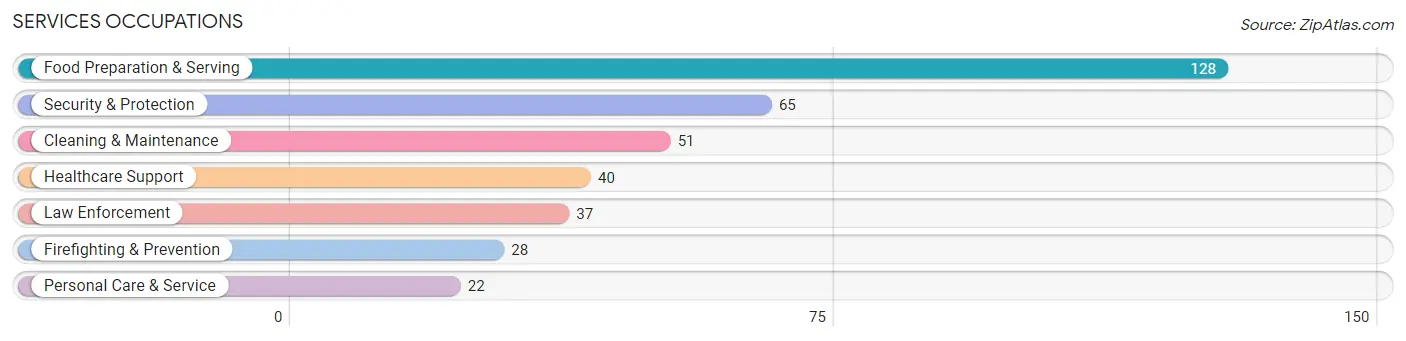
Services Occupations
The most common Services occupations in Gold Canyon are Food Preparation & Serving (128 | 4.0%), Security & Protection (65 | 2.0%), Cleaning & Maintenance (51 | 1.6%), Healthcare Support (40 | 1.2%), and Law Enforcement (37 | 1.1%).
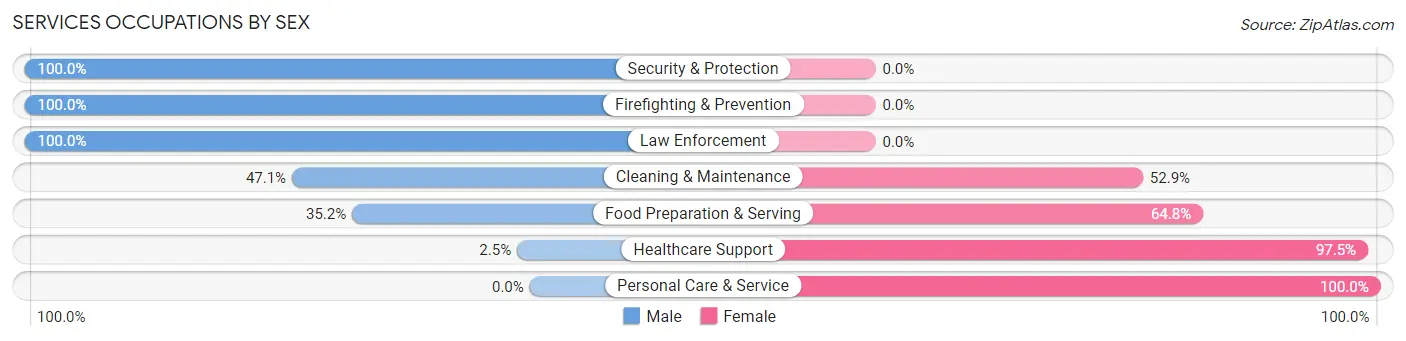
Services Occupations by Sex
Within the Services occupations in Gold Canyon, the most male-oriented occupations are Security & Protection (100.0%), Firefighting & Prevention (100.0%), and Law Enforcement (100.0%), while the most female-oriented occupations are Personal Care & Service (100.0%), Healthcare Support (97.5%), and Food Preparation & Serving (64.8%).
| Occupation | Male | Female |
| Healthcare Support | 1 (2.5%) | 39 (97.5%) |
| Security & Protection | 65 (100.0%) | 0 (0.0%) |
| Firefighting & Prevention | 28 (100.0%) | 0 (0.0%) |
| Law Enforcement | 37 (100.0%) | 0 (0.0%) |
| Food Preparation & Serving | 45 (35.2%) | 83 (64.8%) |
| Cleaning & Maintenance | 24 (47.1%) | 27 (52.9%) |
| Personal Care & Service | 0 (0.0%) | 22 (100.0%) |
| Total (Category) | 135 (44.1%) | 171 (55.9%) |
| Total (Overall) | 1,473 (45.5%) | 1,762 (54.5%) |
Sales and Office Occupations
The most common Sales and Office occupations in Gold Canyon are Office & Administration (394 | 12.2%), and Sales & Related (362 | 11.2%).
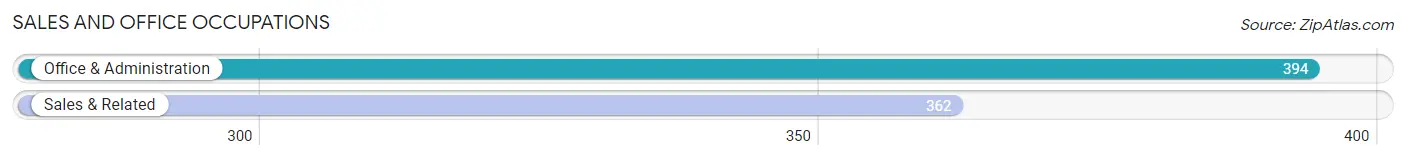
Sales and Office Occupations by Sex
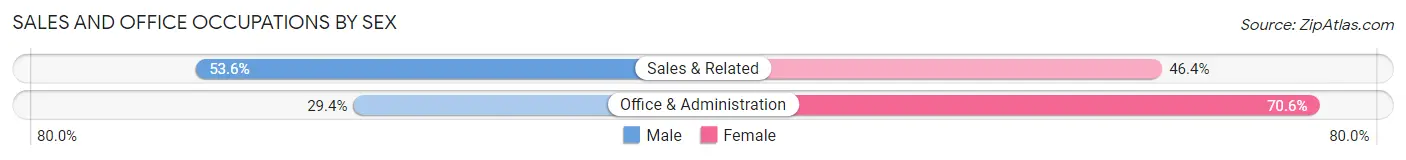
| Occupation | Male | Female |
| Sales & Related | 194 (53.6%) | 168 (46.4%) |
| Office & Administration | 116 (29.4%) | 278 (70.6%) |
| Total (Category) | 310 (41.0%) | 446 (59.0%) |
| Total (Overall) | 1,473 (45.5%) | 1,762 (54.5%) |
Natural Resources, Construction and Maintenance Occupations
The most common Natural Resources, Construction and Maintenance occupations in Gold Canyon are Construction & Extraction (101 | 3.1%), and Installation, Maintenance & Repair (73 | 2.3%).
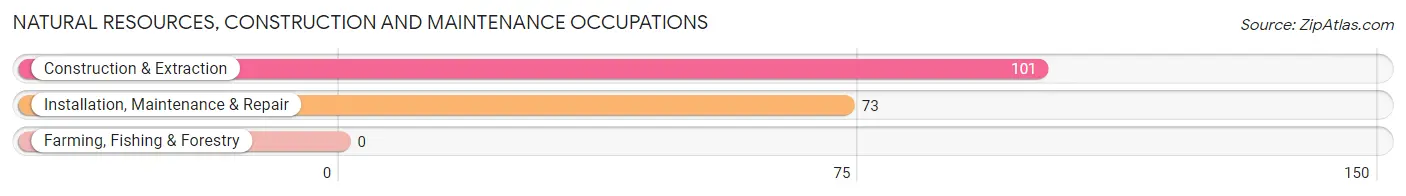
Natural Resources, Construction and Maintenance Occupations by Sex
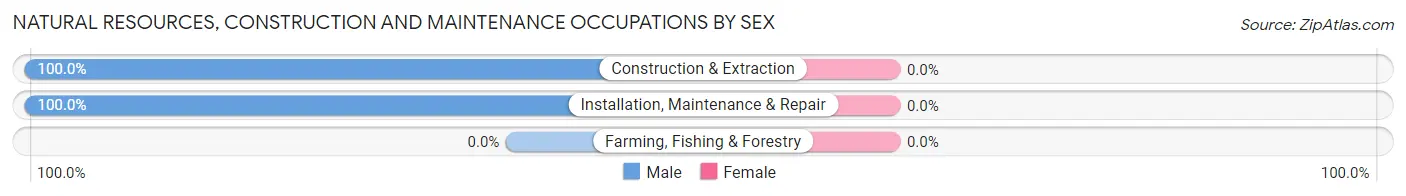
| Occupation | Male | Female |
| Farming, Fishing & Forestry | 0 (0.0%) | 0 (0.0%) |
| Construction & Extraction | 101 (100.0%) | 0 (0.0%) |
| Installation, Maintenance & Repair | 73 (100.0%) | 0 (0.0%) |
| Total (Category) | 174 (100.0%) | 0 (0.0%) |
| Total (Overall) | 1,473 (45.5%) | 1,762 (54.5%) |
Production, Transportation and Moving Occupations
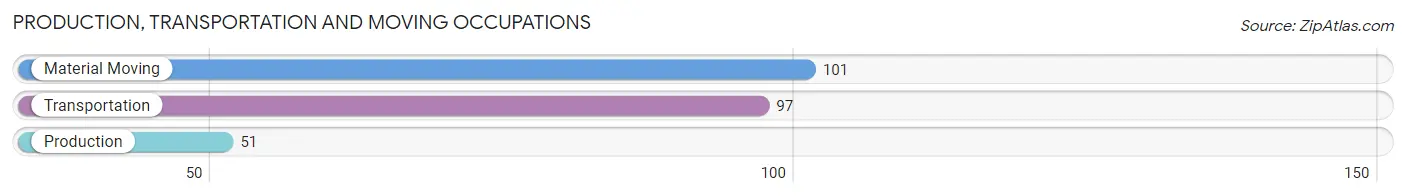
The most common Production, Transportation and Moving occupations in Gold Canyon are Material Moving (101 | 3.1%), Transportation (97 | 3.0%), and Production (51 | 1.6%).
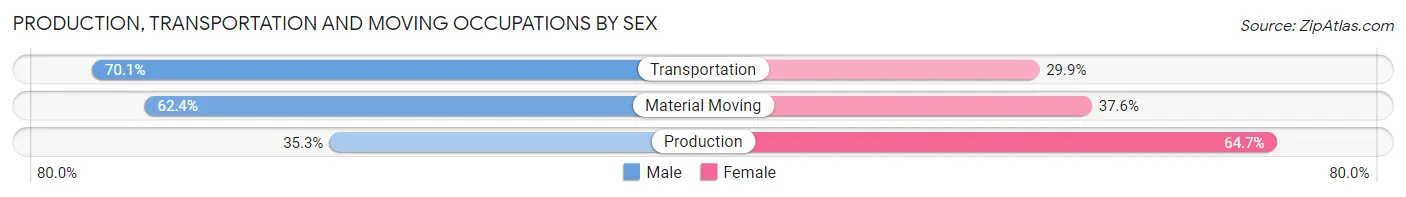
Production, Transportation and Moving Occupations by Sex
| Occupation | Male | Female |
| Production | 18 (35.3%) | 33 (64.7%) |
| Transportation | 68 (70.1%) | 29 (29.9%) |
| Material Moving | 63 (62.4%) | 38 (37.6%) |
| Total (Category) | 149 (59.8%) | 100 (40.2%) |
| Total (Overall) | 1,473 (45.5%) | 1,762 (54.5%) |
Employment Industries by Sex in Gold Canyon
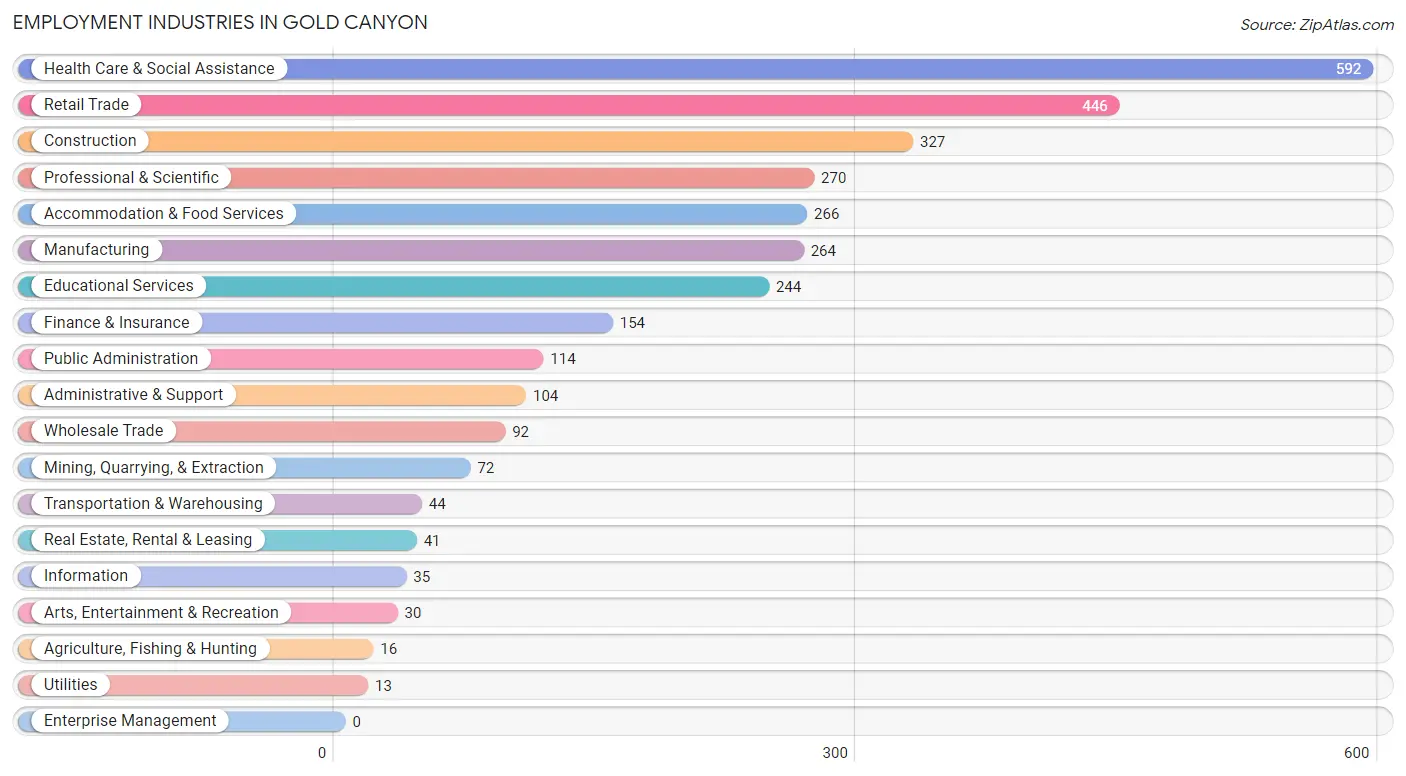
Employment Industries in Gold Canyon
The major employment industries in Gold Canyon include Health Care & Social Assistance (592 | 18.3%), Retail Trade (446 | 13.8%), Construction (327 | 10.1%), Professional & Scientific (270 | 8.4%), and Accommodation & Food Services (266 | 8.2%).
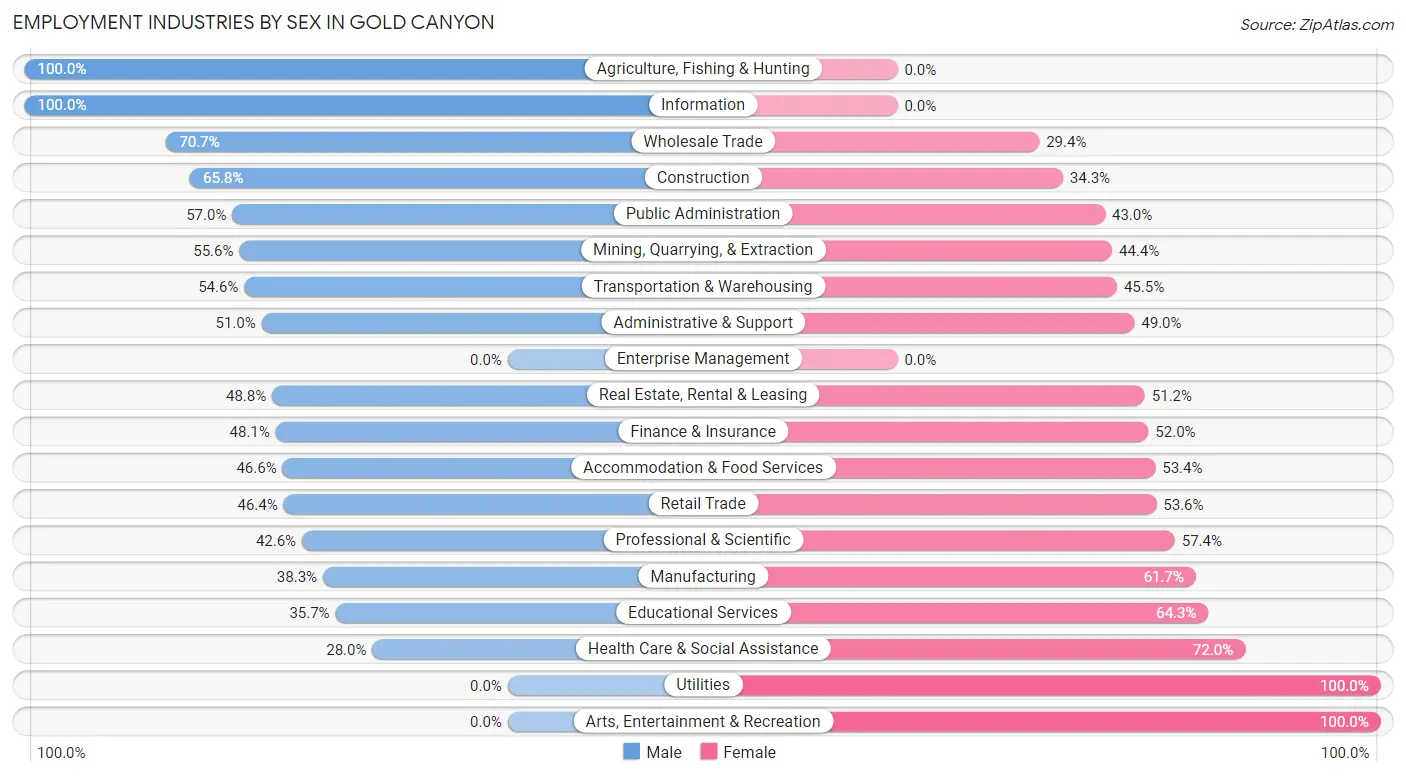
Employment Industries by Sex in Gold Canyon
The Gold Canyon industries that see more men than women are Agriculture, Fishing & Hunting (100.0%), Information (100.0%), and Wholesale Trade (70.7%), whereas the industries that tend to have a higher number of women are Utilities (100.0%), Arts, Entertainment & Recreation (100.0%), and Health Care & Social Assistance (72.0%).
| Industry | Male | Female |
| Agriculture, Fishing & Hunting | 16 (100.0%) | 0 (0.0%) |
| Mining, Quarrying, & Extraction | 40 (55.6%) | 32 (44.4%) |
| Construction | 215 (65.7%) | 112 (34.3%) |
| Manufacturing | 101 (38.3%) | 163 (61.7%) |
| Wholesale Trade | 65 (70.7%) | 27 (29.3%) |
| Retail Trade | 207 (46.4%) | 239 (53.6%) |
| Transportation & Warehousing | 24 (54.5%) | 20 (45.5%) |
| Utilities | 0 (0.0%) | 13 (100.0%) |
| Information | 35 (100.0%) | 0 (0.0%) |
| Finance & Insurance | 74 (48.0%) | 80 (51.9%) |
| Real Estate, Rental & Leasing | 20 (48.8%) | 21 (51.2%) |
| Professional & Scientific | 115 (42.6%) | 155 (57.4%) |
| Enterprise Management | 0 (0.0%) | 0 (0.0%) |
| Administrative & Support | 53 (51.0%) | 51 (49.0%) |
| Educational Services | 87 (35.7%) | 157 (64.3%) |
| Health Care & Social Assistance | 166 (28.0%) | 426 (72.0%) |
| Arts, Entertainment & Recreation | 0 (0.0%) | 30 (100.0%) |
| Accommodation & Food Services | 124 (46.6%) | 142 (53.4%) |
| Public Administration | 65 (57.0%) | 49 (43.0%) |
| Total | 1,473 (45.5%) | 1,762 (54.5%) |
Education in Gold Canyon
School Enrollment in Gold Canyon
The most common levels of schooling among the 876 students in Gold Canyon are high school (282 | 32.2%), college / undergraduate (256 | 29.2%), and middle school (141 | 16.1%).
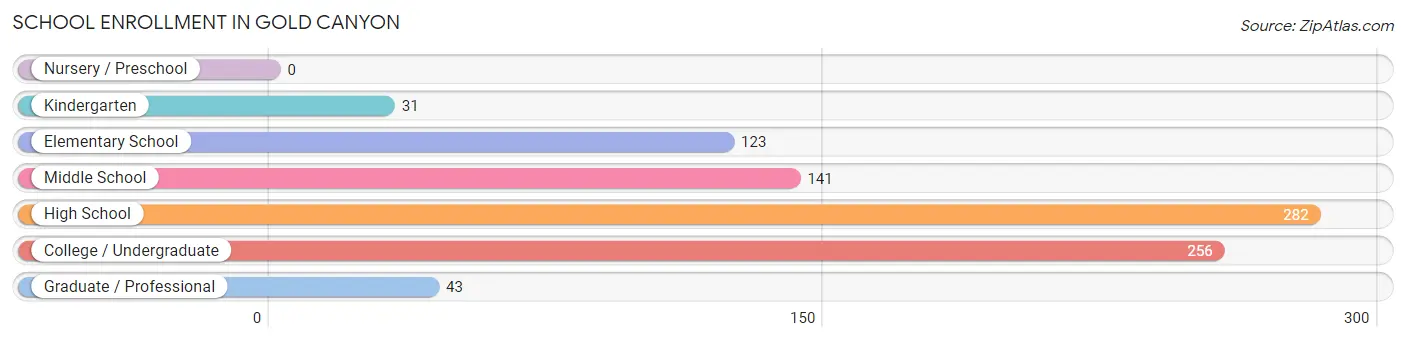
| School Level | # Students | % Students |
| Nursery / Preschool | 0 | 0.0% |
| Kindergarten | 31 | 3.5% |
| Elementary School | 123 | 14.0% |
| Middle School | 141 | 16.1% |
| High School | 282 | 32.2% |
| College / Undergraduate | 256 | 29.2% |
| Graduate / Professional | 43 | 4.9% |
| Total | 876 | 100.0% |
School Enrollment by Age by Funding Source in Gold Canyon
Out of a total of 876 students who are enrolled in schools in Gold Canyon, 150 (17.1%) attend a private institution, while the remaining 726 (82.9%) are enrolled in public schools. The age group of 35 years and over has the highest likelihood of being enrolled in private schools, with 78 (51.0% in the age bracket) enrolled. Conversely, the age group of 5 to 9 year old has the lowest likelihood of being enrolled in a private school, with 154 (100.0% in the age bracket) attending a public institution.
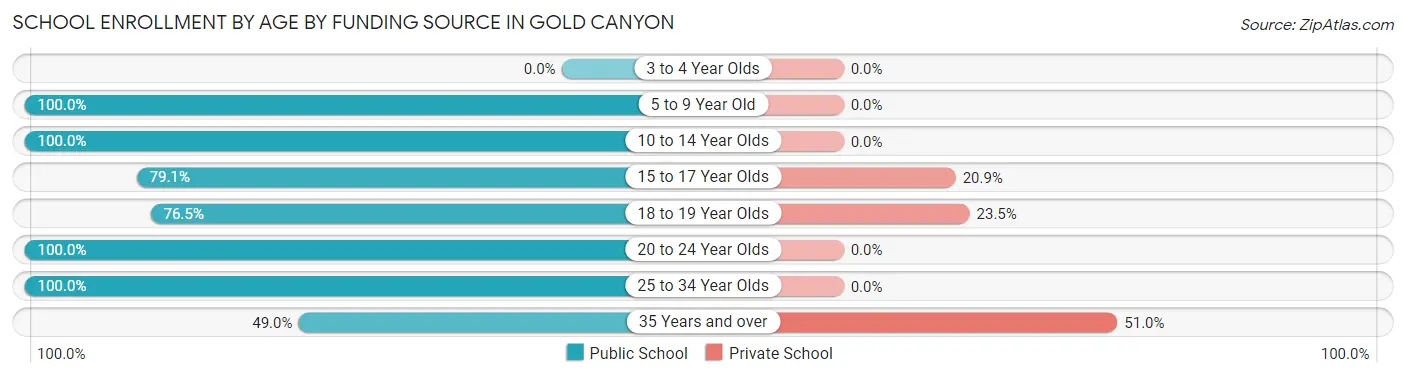
| Age Bracket | Public School | Private School |
| 3 to 4 Year Olds | 0 (0.0%) | 0 (0.0%) |
| 5 to 9 Year Old | 154 (100.0%) | 0 (0.0%) |
| 10 to 14 Year Olds | 152 (100.0%) | 0 (0.0%) |
| 15 to 17 Year Olds | 201 (79.1%) | 53 (20.9%) |
| 18 to 19 Year Olds | 62 (76.5%) | 19 (23.5%) |
| 20 to 24 Year Olds | 23 (100.0%) | 0 (0.0%) |
| 25 to 34 Year Olds | 59 (100.0%) | 0 (0.0%) |
| 35 Years and over | 75 (49.0%) | 78 (51.0%) |
| Total | 726 (82.9%) | 150 (17.1%) |
Educational Attainment by Field of Study in Gold Canyon
Business (1,050 | 24.4%), education (696 | 16.2%), science & technology (585 | 13.6%), engineering (400 | 9.3%), and social sciences (276 | 6.4%) are the most common fields of study among 4,303 individuals in Gold Canyon who have obtained a bachelor's degree or higher.
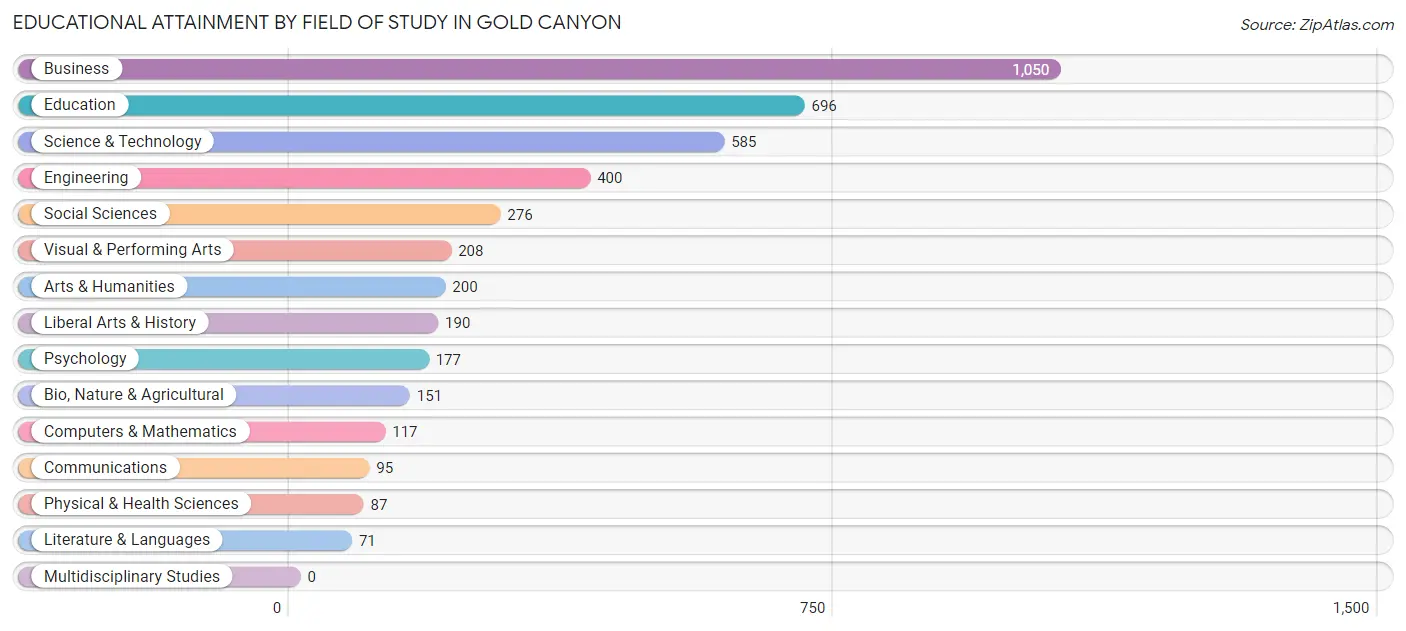
| Field of Study | # Graduates | % Graduates |
| Computers & Mathematics | 117 | 2.7% |
| Bio, Nature & Agricultural | 151 | 3.5% |
| Physical & Health Sciences | 87 | 2.0% |
| Psychology | 177 | 4.1% |
| Social Sciences | 276 | 6.4% |
| Engineering | 400 | 9.3% |
| Multidisciplinary Studies | 0 | 0.0% |
| Science & Technology | 585 | 13.6% |
| Business | 1,050 | 24.4% |
| Education | 696 | 16.2% |
| Literature & Languages | 71 | 1.7% |
| Liberal Arts & History | 190 | 4.4% |
| Visual & Performing Arts | 208 | 4.8% |
| Communications | 95 | 2.2% |
| Arts & Humanities | 200 | 4.6% |
| Total | 4,303 | 100.0% |
Transportation & Commute in Gold Canyon
Vehicle Availability by Sex in Gold Canyon
The most prevalent vehicle ownership categories in Gold Canyon are males with 2 vehicles (689, accounting for 48.3%) and females with 2 vehicles (644, making up 40.2%).
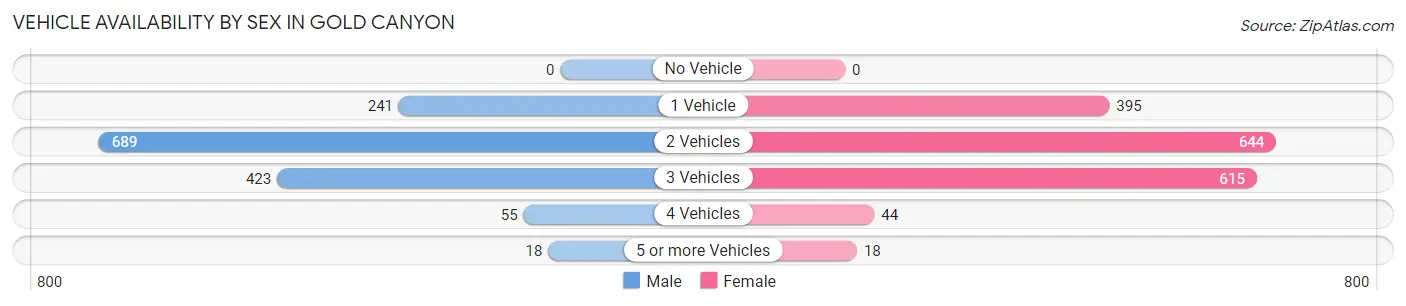
| Vehicles Available | Male | Female |
| No Vehicle | 0 (0.0%) | 0 (0.0%) |
| 1 Vehicle | 241 (16.9%) | 395 (23.0%) |
| 2 Vehicles | 689 (48.3%) | 644 (37.5%) |
| 3 Vehicles | 423 (29.7%) | 615 (35.8%) |
| 4 Vehicles | 55 (3.9%) | 44 (2.6%) |
| 5 or more Vehicles | 18 (1.3%) | 18 (1.1%) |
| Total | 1,426 (100.0%) | 1,716 (100.0%) |
Commute Time in Gold Canyon
The most frequently occuring commute durations in Gold Canyon are 30 to 34 minutes (406 commuters, 16.4%), 45 to 59 minutes (372 commuters, 15.0%), and 5 to 9 minutes (301 commuters, 12.1%).
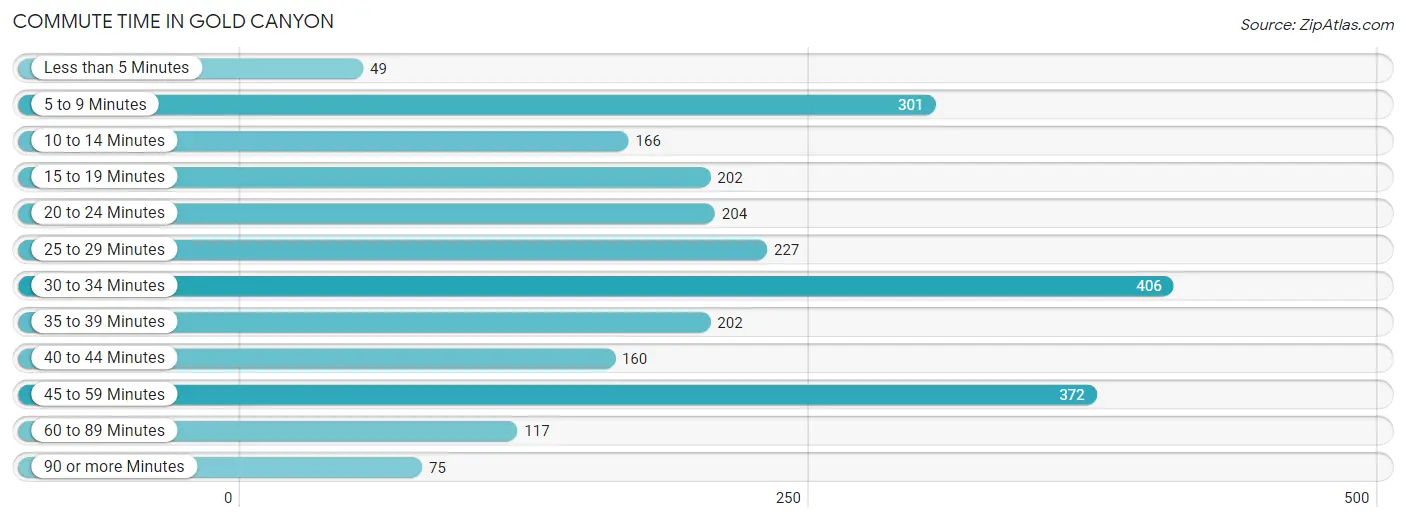
| Commute Time | # Commuters | % Commuters |
| Less than 5 Minutes | 49 | 2.0% |
| 5 to 9 Minutes | 301 | 12.1% |
| 10 to 14 Minutes | 166 | 6.7% |
| 15 to 19 Minutes | 202 | 8.1% |
| 20 to 24 Minutes | 204 | 8.2% |
| 25 to 29 Minutes | 227 | 9.1% |
| 30 to 34 Minutes | 406 | 16.4% |
| 35 to 39 Minutes | 202 | 8.1% |
| 40 to 44 Minutes | 160 | 6.5% |
| 45 to 59 Minutes | 372 | 15.0% |
| 60 to 89 Minutes | 117 | 4.7% |
| 90 or more Minutes | 75 | 3.0% |
Commute Time by Sex in Gold Canyon
The most common commute times in Gold Canyon are 45 to 59 minutes (273 commuters, 22.3%) for males and 30 to 34 minutes (235 commuters, 18.7%) for females.
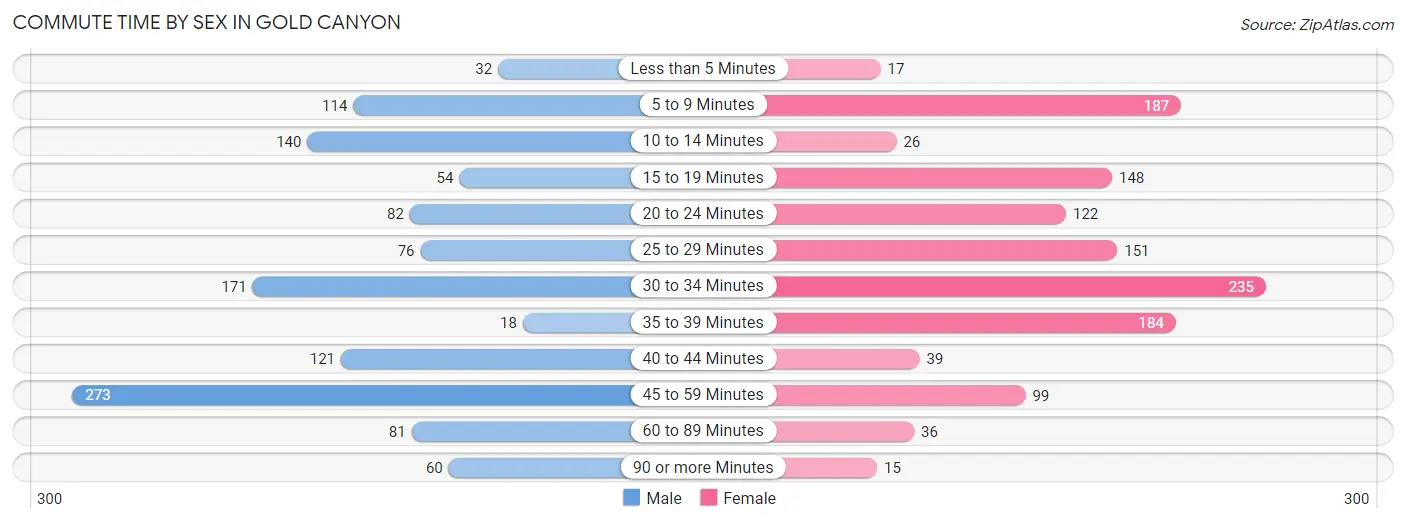
| Commute Time | Male | Female |
| Less than 5 Minutes | 32 (2.6%) | 17 (1.3%) |
| 5 to 9 Minutes | 114 (9.3%) | 187 (14.8%) |
| 10 to 14 Minutes | 140 (11.5%) | 26 (2.1%) |
| 15 to 19 Minutes | 54 (4.4%) | 148 (11.8%) |
| 20 to 24 Minutes | 82 (6.7%) | 122 (9.7%) |
| 25 to 29 Minutes | 76 (6.2%) | 151 (12.0%) |
| 30 to 34 Minutes | 171 (14.0%) | 235 (18.7%) |
| 35 to 39 Minutes | 18 (1.5%) | 184 (14.6%) |
| 40 to 44 Minutes | 121 (9.9%) | 39 (3.1%) |
| 45 to 59 Minutes | 273 (22.3%) | 99 (7.9%) |
| 60 to 89 Minutes | 81 (6.6%) | 36 (2.9%) |
| 90 or more Minutes | 60 (4.9%) | 15 (1.2%) |
Time of Departure to Work by Sex in Gold Canyon
The most frequent times of departure to work in Gold Canyon are 6:30 AM to 6:59 AM (159, 13.0%) for males and 7:00 AM to 7:29 AM (235, 18.7%) for females.
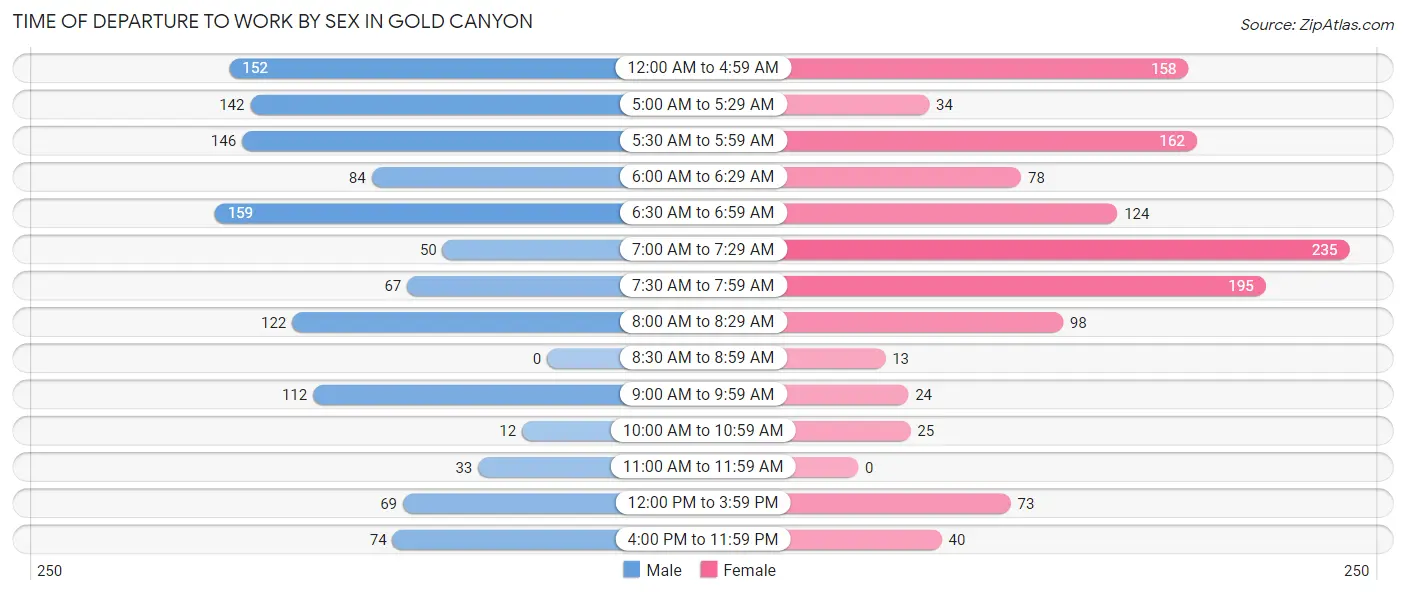
| Time of Departure | Male | Female |
| 12:00 AM to 4:59 AM | 152 (12.4%) | 158 (12.6%) |
| 5:00 AM to 5:29 AM | 142 (11.6%) | 34 (2.7%) |
| 5:30 AM to 5:59 AM | 146 (11.9%) | 162 (12.9%) |
| 6:00 AM to 6:29 AM | 84 (6.9%) | 78 (6.2%) |
| 6:30 AM to 6:59 AM | 159 (13.0%) | 124 (9.9%) |
| 7:00 AM to 7:29 AM | 50 (4.1%) | 235 (18.7%) |
| 7:30 AM to 7:59 AM | 67 (5.5%) | 195 (15.5%) |
| 8:00 AM to 8:29 AM | 122 (10.0%) | 98 (7.8%) |
| 8:30 AM to 8:59 AM | 0 (0.0%) | 13 (1.0%) |
| 9:00 AM to 9:59 AM | 112 (9.2%) | 24 (1.9%) |
| 10:00 AM to 10:59 AM | 12 (1.0%) | 25 (2.0%) |
| 11:00 AM to 11:59 AM | 33 (2.7%) | 0 (0.0%) |
| 12:00 PM to 3:59 PM | 69 (5.7%) | 73 (5.8%) |
| 4:00 PM to 11:59 PM | 74 (6.1%) | 40 (3.2%) |
| Total | 1,222 (100.0%) | 1,259 (100.0%) |
Housing Occupancy in Gold Canyon
Occupancy by Ownership in Gold Canyon
Of the total 5,814 dwellings in Gold Canyon, owner-occupied units account for 5,491 (94.4%), while renter-occupied units make up 323 (5.6%).
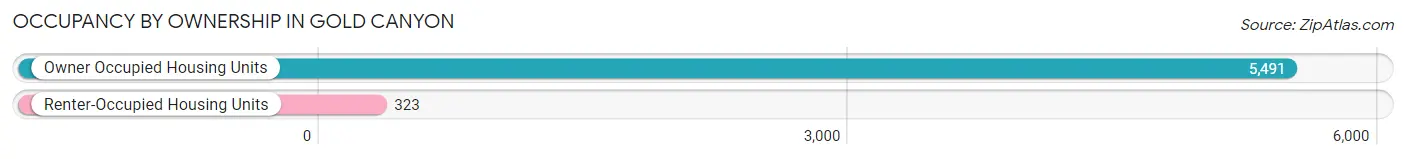
| Occupancy | # Housing Units | % Housing Units |
| Owner Occupied Housing Units | 5,491 | 94.4% |
| Renter-Occupied Housing Units | 323 | 5.6% |
| Total Occupied Housing Units | 5,814 | 100.0% |
Occupancy by Household Size in Gold Canyon
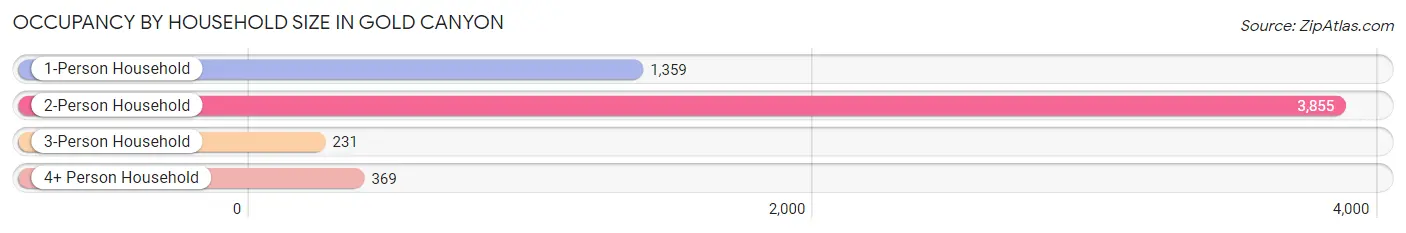
| Household Size | # Housing Units | % Housing Units |
| 1-Person Household | 1,359 | 23.4% |
| 2-Person Household | 3,855 | 66.3% |
| 3-Person Household | 231 | 4.0% |
| 4+ Person Household | 369 | 6.4% |
| Total Housing Units | 5,814 | 100.0% |
Occupancy by Ownership by Household Size in Gold Canyon
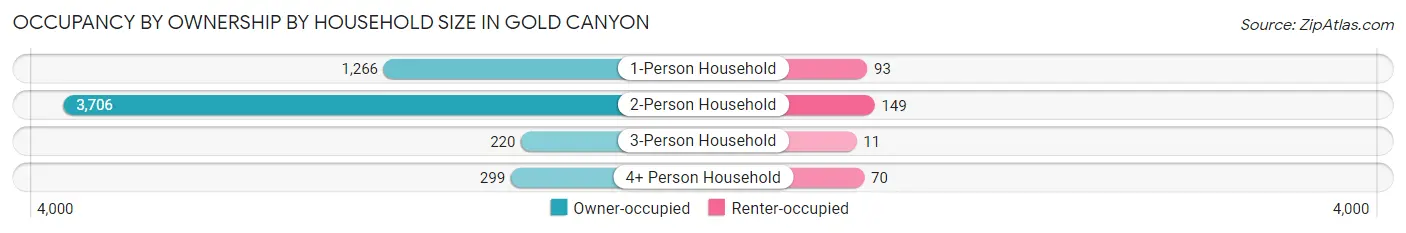
| Household Size | Owner-occupied | Renter-occupied |
| 1-Person Household | 1,266 (93.2%) | 93 (6.8%) |
| 2-Person Household | 3,706 (96.1%) | 149 (3.9%) |
| 3-Person Household | 220 (95.2%) | 11 (4.8%) |
| 4+ Person Household | 299 (81.0%) | 70 (19.0%) |
| Total Housing Units | 5,491 (94.4%) | 323 (5.6%) |
Occupancy by Educational Attainment in Gold Canyon
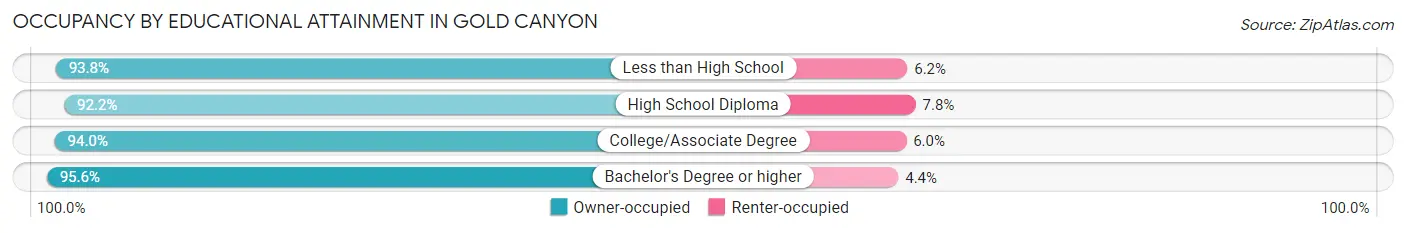
| Household Size | Owner-occupied | Renter-occupied |
| Less than High School | 228 (93.8%) | 15 (6.2%) |
| High School Diploma | 778 (92.2%) | 66 (7.8%) |
| College/Associate Degree | 2,067 (94.0%) | 131 (6.0%) |
| Bachelor's Degree or higher | 2,418 (95.6%) | 111 (4.4%) |
Occupancy by Age of Householder in Gold Canyon
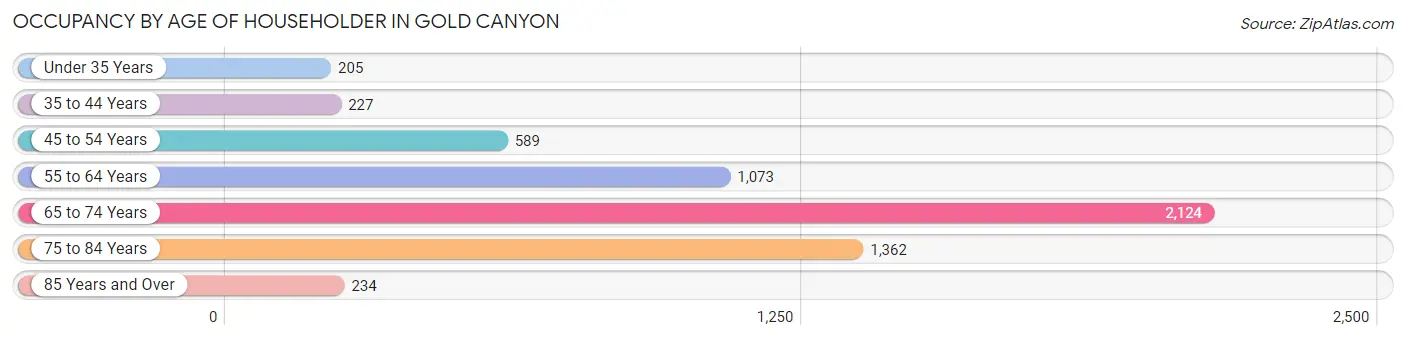
| Age Bracket | # Households | % Households |
| Under 35 Years | 205 | 3.5% |
| 35 to 44 Years | 227 | 3.9% |
| 45 to 54 Years | 589 | 10.1% |
| 55 to 64 Years | 1,073 | 18.5% |
| 65 to 74 Years | 2,124 | 36.5% |
| 75 to 84 Years | 1,362 | 23.4% |
| 85 Years and Over | 234 | 4.0% |
| Total | 5,814 | 100.0% |
Housing Finances in Gold Canyon
Median Income by Occupancy in Gold Canyon
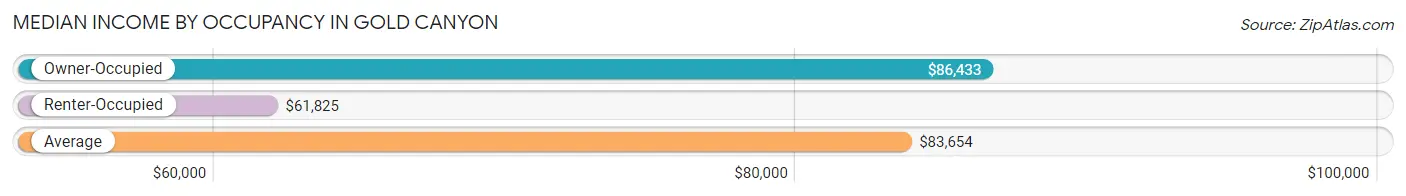
| Occupancy Type | # Households | Median Income |
| Owner-Occupied | 5,491 (94.4%) | $86,433 |
| Renter-Occupied | 323 (5.6%) | $61,825 |
| Average | 5,814 (100.0%) | $83,654 |
Occupancy by Householder Income Bracket in Gold Canyon
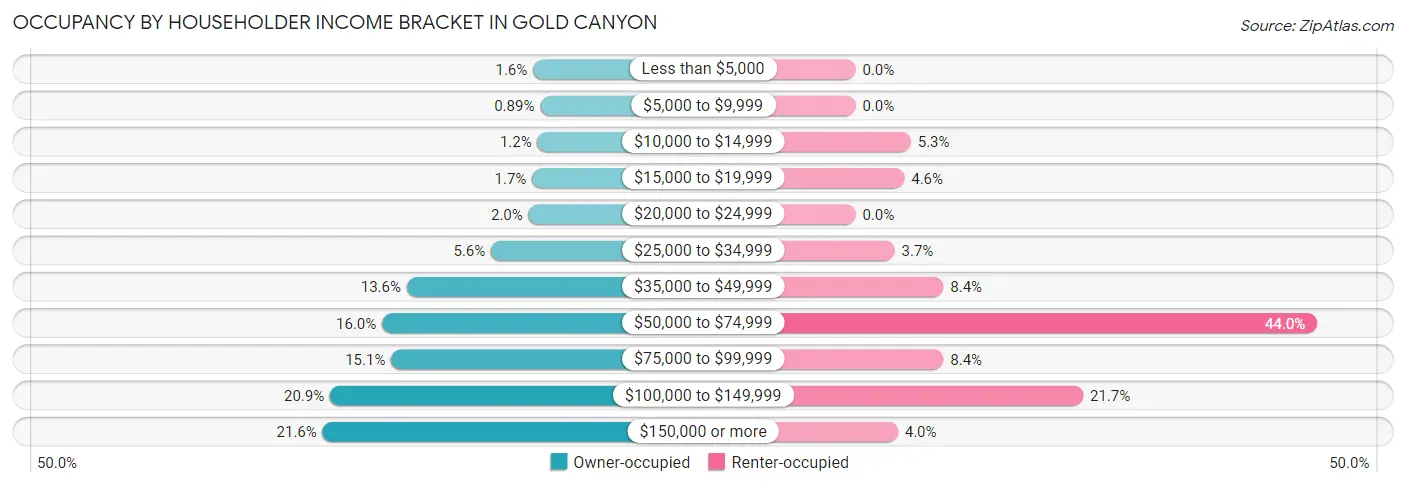
| Income Bracket | Owner-occupied | Renter-occupied |
| Less than $5,000 | 86 (1.6%) | 0 (0.0%) |
| $5,000 to $9,999 | 49 (0.9%) | 0 (0.0%) |
| $10,000 to $14,999 | 63 (1.1%) | 17 (5.3%) |
| $15,000 to $19,999 | 91 (1.7%) | 15 (4.6%) |
| $20,000 to $24,999 | 110 (2.0%) | 0 (0.0%) |
| $25,000 to $34,999 | 306 (5.6%) | 12 (3.7%) |
| $35,000 to $49,999 | 747 (13.6%) | 27 (8.4%) |
| $50,000 to $74,999 | 876 (16.0%) | 142 (44.0%) |
| $75,000 to $99,999 | 828 (15.1%) | 27 (8.4%) |
| $100,000 to $149,999 | 1,148 (20.9%) | 70 (21.7%) |
| $150,000 or more | 1,187 (21.6%) | 13 (4.0%) |
| Total | 5,491 (100.0%) | 323 (100.0%) |
Monthly Housing Cost Tiers in Gold Canyon
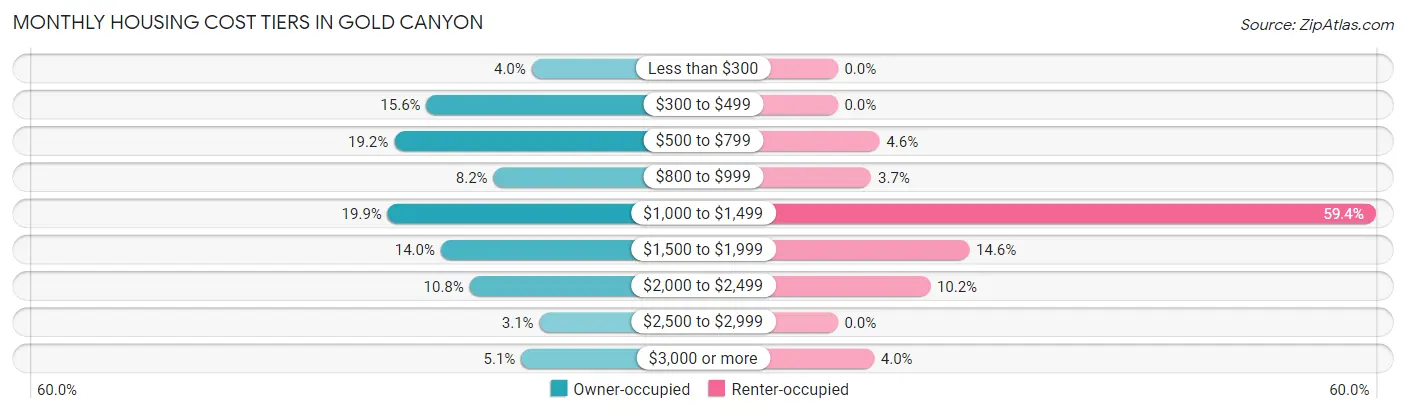
| Monthly Cost | Owner-occupied | Renter-occupied |
| Less than $300 | 219 (4.0%) | 0 (0.0%) |
| $300 to $499 | 857 (15.6%) | 0 (0.0%) |
| $500 to $799 | 1,053 (19.2%) | 15 (4.6%) |
| $800 to $999 | 451 (8.2%) | 12 (3.7%) |
| $1,000 to $1,499 | 1,092 (19.9%) | 192 (59.4%) |
| $1,500 to $1,999 | 770 (14.0%) | 47 (14.5%) |
| $2,000 to $2,499 | 595 (10.8%) | 33 (10.2%) |
| $2,500 to $2,999 | 172 (3.1%) | 0 (0.0%) |
| $3,000 or more | 282 (5.1%) | 13 (4.0%) |
| Total | 5,491 (100.0%) | 323 (100.0%) |
Physical Housing Characteristics in Gold Canyon
Housing Structures in Gold Canyon
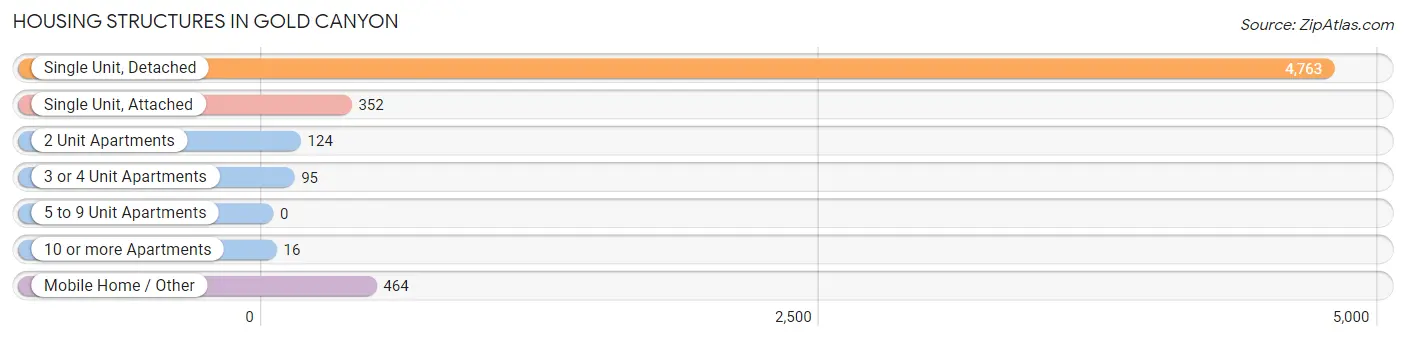
| Structure Type | # Housing Units | % Housing Units |
| Single Unit, Detached | 4,763 | 81.9% |
| Single Unit, Attached | 352 | 6.0% |
| 2 Unit Apartments | 124 | 2.1% |
| 3 or 4 Unit Apartments | 95 | 1.6% |
| 5 to 9 Unit Apartments | 0 | 0.0% |
| 10 or more Apartments | 16 | 0.3% |
| Mobile Home / Other | 464 | 8.0% |
| Total | 5,814 | 100.0% |
Housing Structures by Occupancy in Gold Canyon
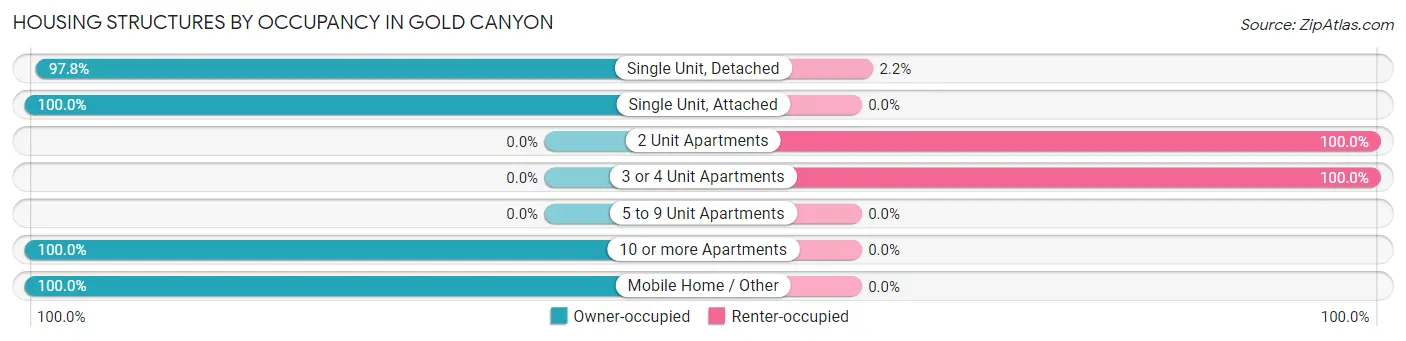
| Structure Type | Owner-occupied | Renter-occupied |
| Single Unit, Detached | 4,659 (97.8%) | 104 (2.2%) |
| Single Unit, Attached | 352 (100.0%) | 0 (0.0%) |
| 2 Unit Apartments | 0 (0.0%) | 124 (100.0%) |
| 3 or 4 Unit Apartments | 0 (0.0%) | 95 (100.0%) |
| 5 to 9 Unit Apartments | 0 (0.0%) | 0 (0.0%) |
| 10 or more Apartments | 16 (100.0%) | 0 (0.0%) |
| Mobile Home / Other | 464 (100.0%) | 0 (0.0%) |
| Total | 5,491 (94.4%) | 323 (5.6%) |
Housing Structures by Number of Rooms in Gold Canyon
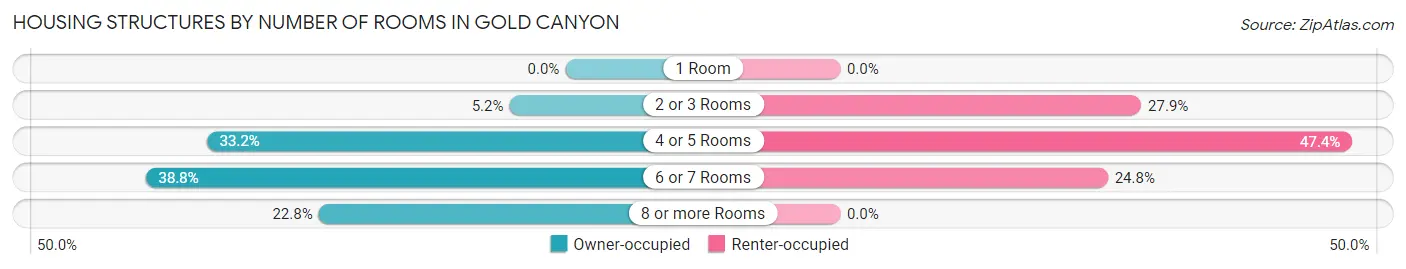
| Number of Rooms | Owner-occupied | Renter-occupied |
| 1 Room | 0 (0.0%) | 0 (0.0%) |
| 2 or 3 Rooms | 284 (5.2%) | 90 (27.9%) |
| 4 or 5 Rooms | 1,822 (33.2%) | 153 (47.4%) |
| 6 or 7 Rooms | 2,132 (38.8%) | 80 (24.8%) |
| 8 or more Rooms | 1,253 (22.8%) | 0 (0.0%) |
| Total | 5,491 (100.0%) | 323 (100.0%) |
Housing Structure by Heating Type in Gold Canyon
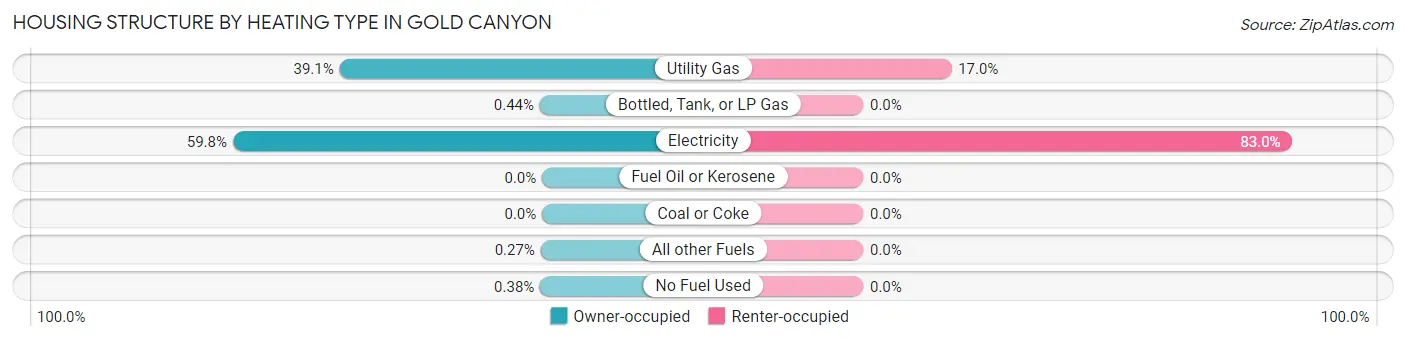
| Heating Type | Owner-occupied | Renter-occupied |
| Utility Gas | 2,149 (39.1%) | 55 (17.0%) |
| Bottled, Tank, or LP Gas | 24 (0.4%) | 0 (0.0%) |
| Electricity | 3,282 (59.8%) | 268 (83.0%) |
| Fuel Oil or Kerosene | 0 (0.0%) | 0 (0.0%) |
| Coal or Coke | 0 (0.0%) | 0 (0.0%) |
| All other Fuels | 15 (0.3%) | 0 (0.0%) |
| No Fuel Used | 21 (0.4%) | 0 (0.0%) |
| Total | 5,491 (100.0%) | 323 (100.0%) |
Household Vehicle Usage in Gold Canyon
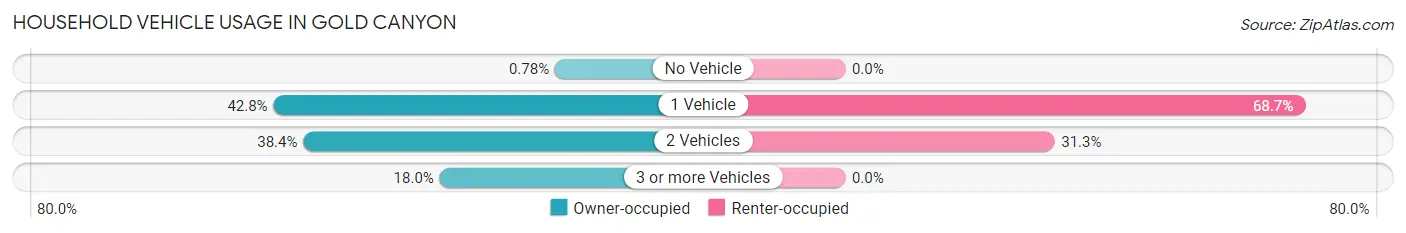
| Vehicles per Household | Owner-occupied | Renter-occupied |
| No Vehicle | 43 (0.8%) | 0 (0.0%) |
| 1 Vehicle | 2,352 (42.8%) | 222 (68.7%) |
| 2 Vehicles | 2,107 (38.4%) | 101 (31.3%) |
| 3 or more Vehicles | 989 (18.0%) | 0 (0.0%) |
| Total | 5,491 (100.0%) | 323 (100.0%) |
Real Estate & Mortgages in Gold Canyon
Real Estate and Mortgage Overview in Gold Canyon
| Characteristic | Without Mortgage | With Mortgage |
| Housing Units | 2,789 | 2,702 |
| Median Property Value | $403,500 | $401,600 |
| Median Household Income | $78,554 | $715 |
| Monthly Housing Costs | $562 | $277 |
| Real Estate Taxes | $2,735 | $68 |
Property Value by Mortgage Status in Gold Canyon
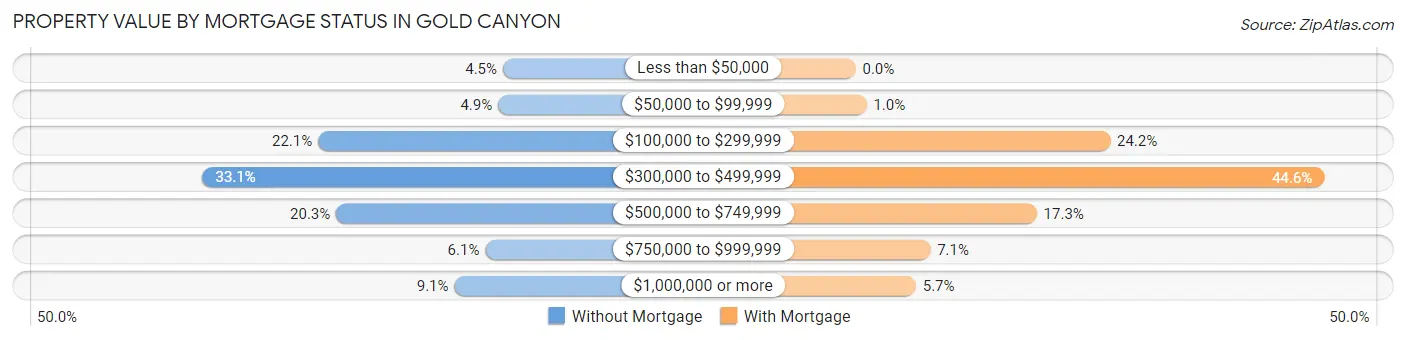
| Property Value | Without Mortgage | With Mortgage |
| Less than $50,000 | 124 (4.4%) | 0 (0.0%) |
| $50,000 to $99,999 | 137 (4.9%) | 28 (1.0%) |
| $100,000 to $299,999 | 615 (22.1%) | 655 (24.2%) |
| $300,000 to $499,999 | 922 (33.1%) | 1,206 (44.6%) |
| $500,000 to $749,999 | 567 (20.3%) | 466 (17.2%) |
| $750,000 to $999,999 | 171 (6.1%) | 192 (7.1%) |
| $1,000,000 or more | 253 (9.1%) | 155 (5.7%) |
| Total | 2,789 (100.0%) | 2,702 (100.0%) |
Household Income by Mortgage Status in Gold Canyon
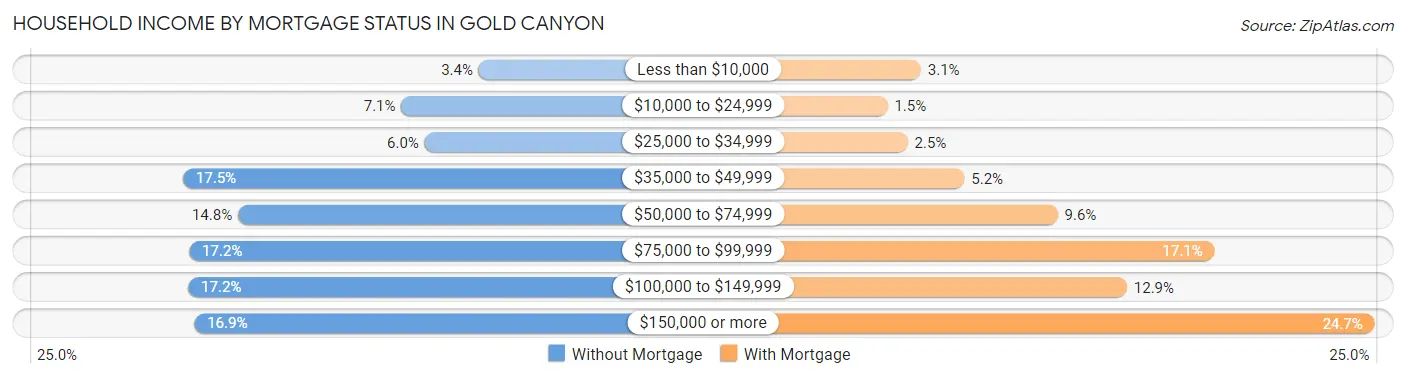
| Household Income | Without Mortgage | With Mortgage |
| Less than $10,000 | 94 (3.4%) | 84 (3.1%) |
| $10,000 to $24,999 | 197 (7.1%) | 41 (1.5%) |
| $25,000 to $34,999 | 166 (5.9%) | 67 (2.5%) |
| $35,000 to $49,999 | 487 (17.5%) | 140 (5.2%) |
| $50,000 to $74,999 | 414 (14.8%) | 260 (9.6%) |
| $75,000 to $99,999 | 479 (17.2%) | 462 (17.1%) |
| $100,000 to $149,999 | 480 (17.2%) | 349 (12.9%) |
| $150,000 or more | 472 (16.9%) | 668 (24.7%) |
| Total | 2,789 (100.0%) | 2,702 (100.0%) |
Property Value to Household Income Ratio in Gold Canyon
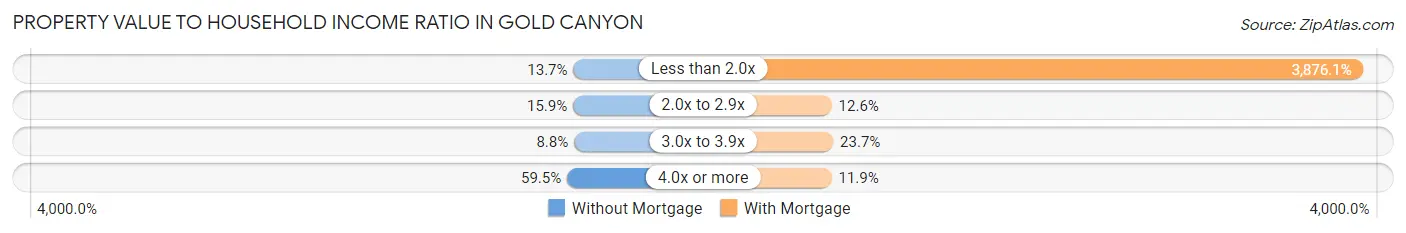
| Value-to-Income Ratio | Without Mortgage | With Mortgage |
| Less than 2.0x | 383 (13.7%) | 104,732 (3,876.1%) |
| 2.0x to 2.9x | 443 (15.9%) | 339 (12.6%) |
| 3.0x to 3.9x | 245 (8.8%) | 640 (23.7%) |
| 4.0x or more | 1,658 (59.5%) | 321 (11.9%) |
| Total | 2,789 (100.0%) | 2,702 (100.0%) |
Real Estate Taxes by Mortgage Status in Gold Canyon
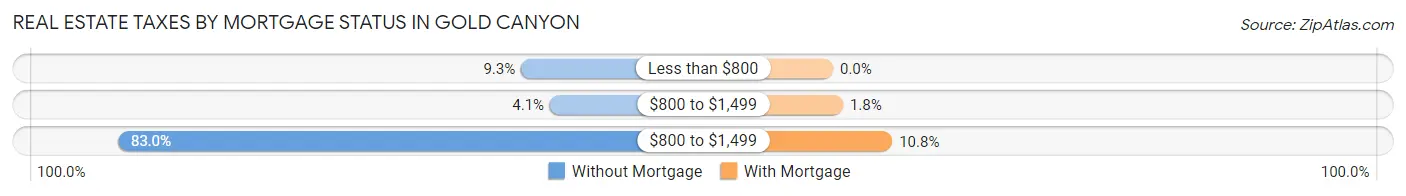
| Property Taxes | Without Mortgage | With Mortgage |
| Less than $800 | 260 (9.3%) | 0 (0.0%) |
| $800 to $1,499 | 113 (4.1%) | 49 (1.8%) |
| $800 to $1,499 | 2,314 (83.0%) | 292 (10.8%) |
| Total | 2,789 (100.0%) | 2,702 (100.0%) |
Health & Disability in Gold Canyon
Health Insurance Coverage by Age in Gold Canyon
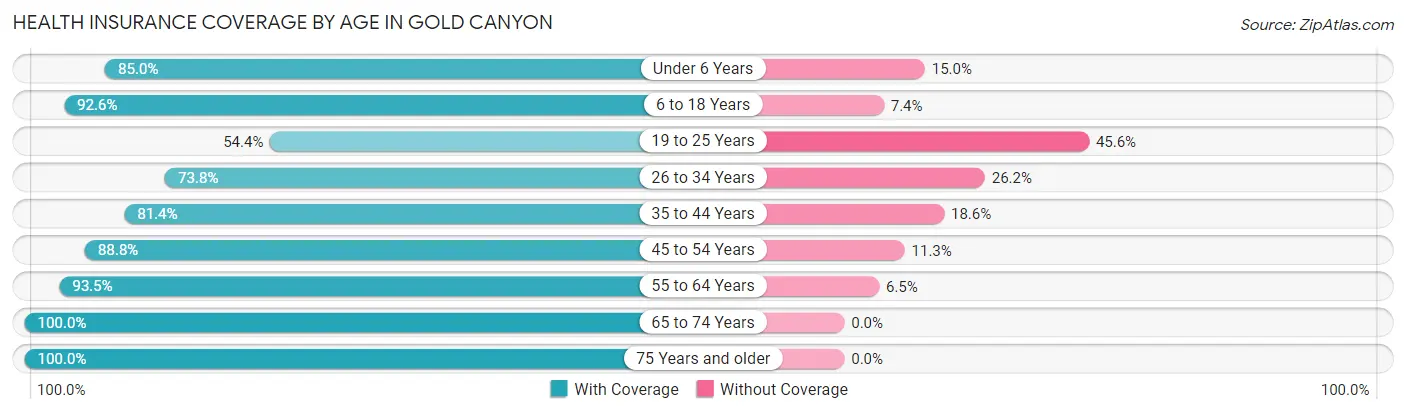
| Age Bracket | With Coverage | Without Coverage |
| Under 6 Years | 198 (85.0%) | 35 (15.0%) |
| 6 to 18 Years | 617 (92.6%) | 49 (7.4%) |
| 19 to 25 Years | 149 (54.4%) | 125 (45.6%) |
| 26 to 34 Years | 307 (73.8%) | 109 (26.2%) |
| 35 to 44 Years | 394 (81.4%) | 90 (18.6%) |
| 45 to 54 Years | 970 (88.7%) | 123 (11.3%) |
| 55 to 64 Years | 1,919 (93.5%) | 133 (6.5%) |
| 65 to 74 Years | 3,754 (100.0%) | 0 (0.0%) |
| 75 Years and older | 2,593 (100.0%) | 0 (0.0%) |
| Total | 10,901 (94.3%) | 664 (5.7%) |
Health Insurance Coverage by Citizenship Status in Gold Canyon
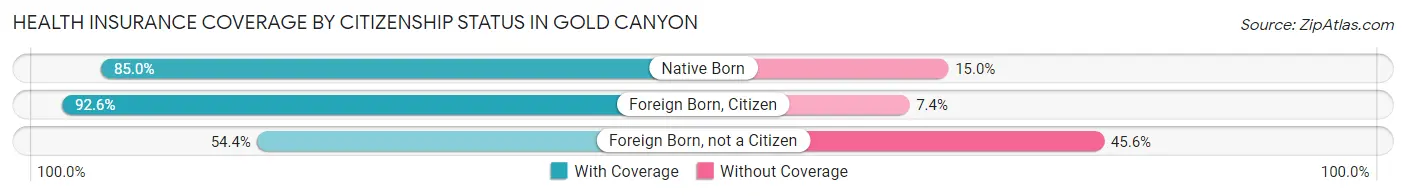
| Citizenship Status | With Coverage | Without Coverage |
| Native Born | 198 (85.0%) | 35 (15.0%) |
| Foreign Born, Citizen | 617 (92.6%) | 49 (7.4%) |
| Foreign Born, not a Citizen | 149 (54.4%) | 125 (45.6%) |
Health Insurance Coverage by Household Income in Gold Canyon
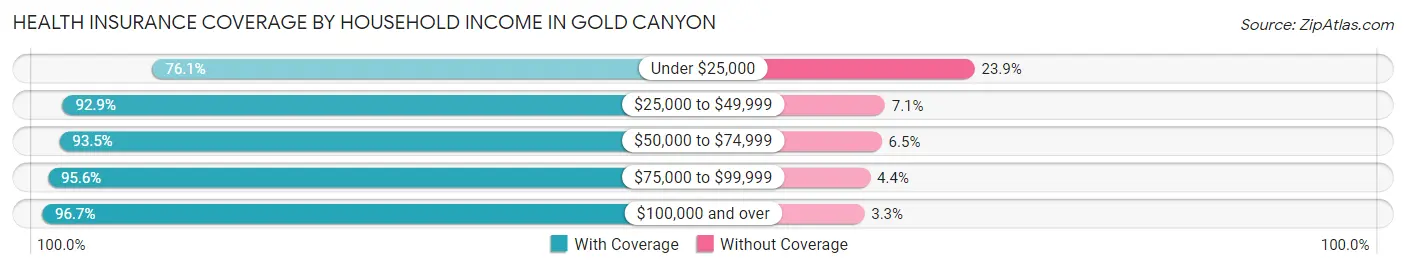
| Household Income | With Coverage | Without Coverage |
| Under $25,000 | 467 (76.1%) | 147 (23.9%) |
| $25,000 to $49,999 | 1,684 (92.9%) | 129 (7.1%) |
| $50,000 to $74,999 | 1,946 (93.5%) | 136 (6.5%) |
| $75,000 to $99,999 | 1,638 (95.6%) | 75 (4.4%) |
| $100,000 and over | 5,164 (96.7%) | 175 (3.3%) |
Public vs Private Health Insurance Coverage by Age in Gold Canyon
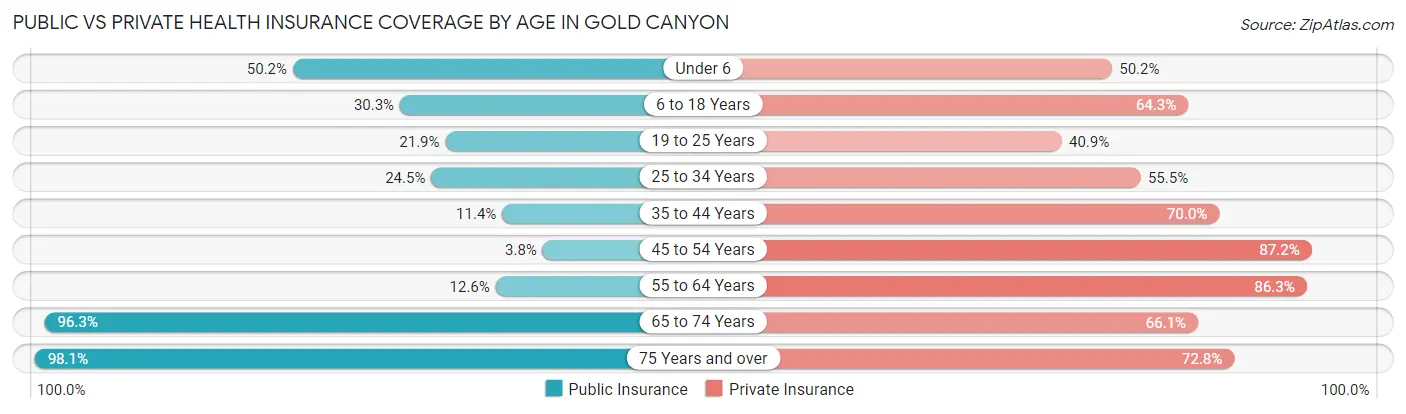
| Age Bracket | Public Insurance | Private Insurance |
| Under 6 | 117 (50.2%) | 117 (50.2%) |
| 6 to 18 Years | 202 (30.3%) | 428 (64.3%) |
| 19 to 25 Years | 60 (21.9%) | 112 (40.9%) |
| 25 to 34 Years | 102 (24.5%) | 231 (55.5%) |
| 35 to 44 Years | 55 (11.4%) | 339 (70.0%) |
| 45 to 54 Years | 42 (3.8%) | 953 (87.2%) |
| 55 to 64 Years | 258 (12.6%) | 1,770 (86.3%) |
| 65 to 74 Years | 3,615 (96.3%) | 2,481 (66.1%) |
| 75 Years and over | 2,544 (98.1%) | 1,888 (72.8%) |
| Total | 6,995 (60.5%) | 8,319 (71.9%) |
Disability Status by Sex by Age in Gold Canyon
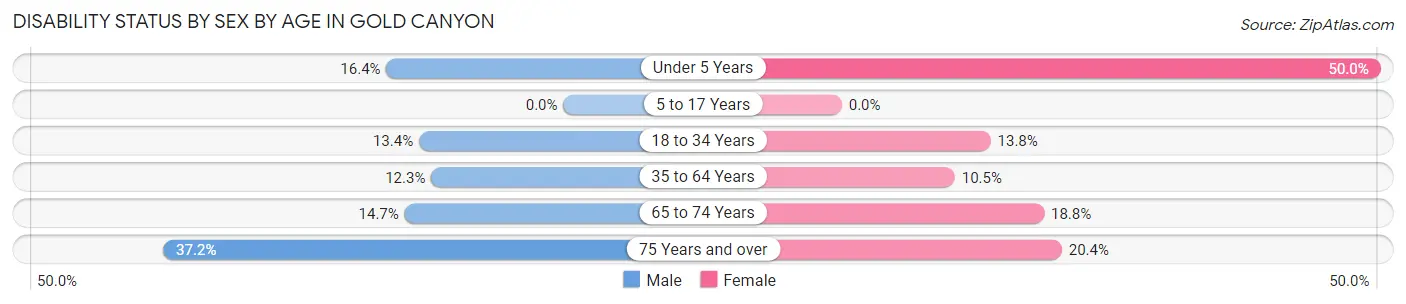
| Age Bracket | Male | Female |
| Under 5 Years | 22 (16.4%) | 27 (50.0%) |
| 5 to 17 Years | 0 (0.0%) | 0 (0.0%) |
| 18 to 34 Years | 39 (13.4%) | 74 (13.8%) |
| 35 to 64 Years | 189 (12.3%) | 219 (10.5%) |
| 65 to 74 Years | 265 (14.7%) | 367 (18.8%) |
| 75 Years and over | 503 (37.1%) | 253 (20.4%) |
Disability Class by Sex by Age in Gold Canyon
Disability Class: Hearing Difficulty
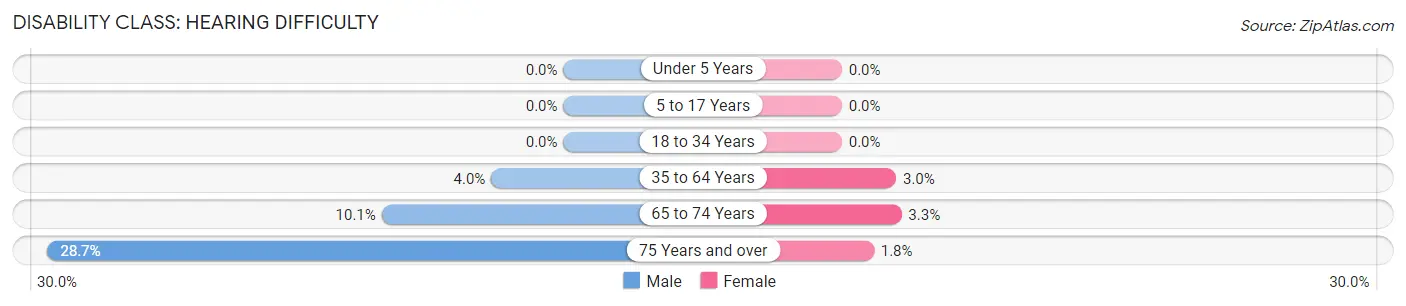
| Age Bracket | Male | Female |
| Under 5 Years | 0 (0.0%) | 0 (0.0%) |
| 5 to 17 Years | 0 (0.0%) | 0 (0.0%) |
| 18 to 34 Years | 0 (0.0%) | 0 (0.0%) |
| 35 to 64 Years | 62 (4.0%) | 63 (3.0%) |
| 65 to 74 Years | 182 (10.1%) | 65 (3.3%) |
| 75 Years and over | 389 (28.7%) | 22 (1.8%) |
Disability Class: Vision Difficulty
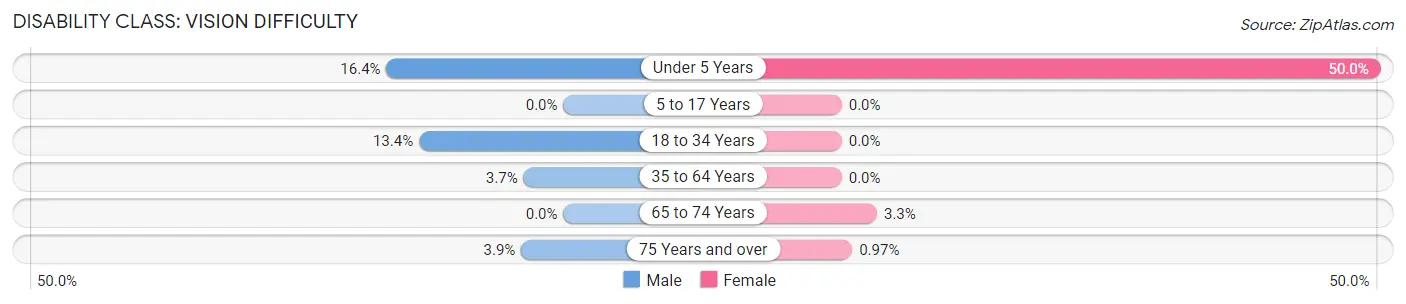
| Age Bracket | Male | Female |
| Under 5 Years | 22 (16.4%) | 27 (50.0%) |
| 5 to 17 Years | 0 (0.0%) | 0 (0.0%) |
| 18 to 34 Years | 39 (13.4%) | 0 (0.0%) |
| 35 to 64 Years | 57 (3.7%) | 0 (0.0%) |
| 65 to 74 Years | 0 (0.0%) | 64 (3.3%) |
| 75 Years and over | 53 (3.9%) | 12 (1.0%) |
Disability Class: Cognitive Difficulty
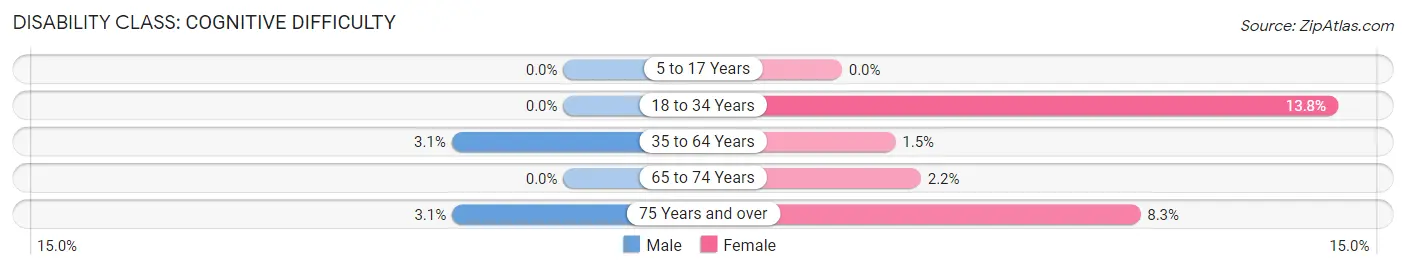
| Age Bracket | Male | Female |
| 5 to 17 Years | 0 (0.0%) | 0 (0.0%) |
| 18 to 34 Years | 0 (0.0%) | 74 (13.8%) |
| 35 to 64 Years | 48 (3.1%) | 31 (1.5%) |
| 65 to 74 Years | 0 (0.0%) | 43 (2.2%) |
| 75 Years and over | 42 (3.1%) | 103 (8.3%) |
Disability Class: Ambulatory Difficulty
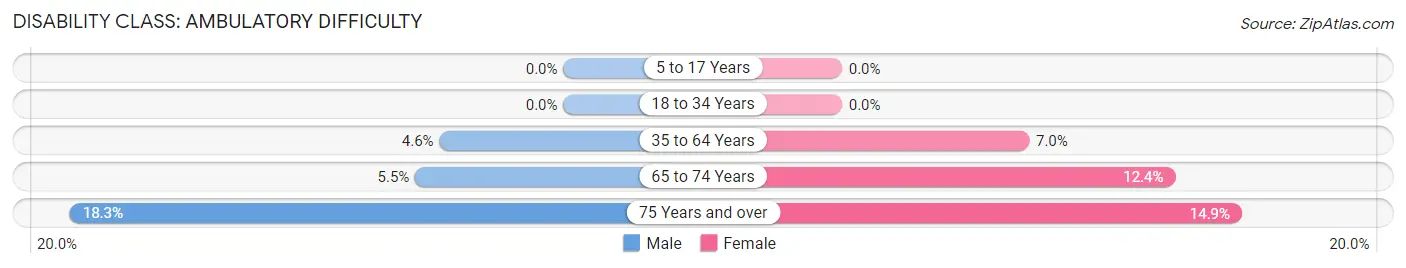
| Age Bracket | Male | Female |
| 5 to 17 Years | 0 (0.0%) | 0 (0.0%) |
| 18 to 34 Years | 0 (0.0%) | 0 (0.0%) |
| 35 to 64 Years | 71 (4.6%) | 145 (7.0%) |
| 65 to 74 Years | 99 (5.5%) | 242 (12.4%) |
| 75 Years and over | 248 (18.3%) | 184 (14.8%) |
Disability Class: Self-Care Difficulty
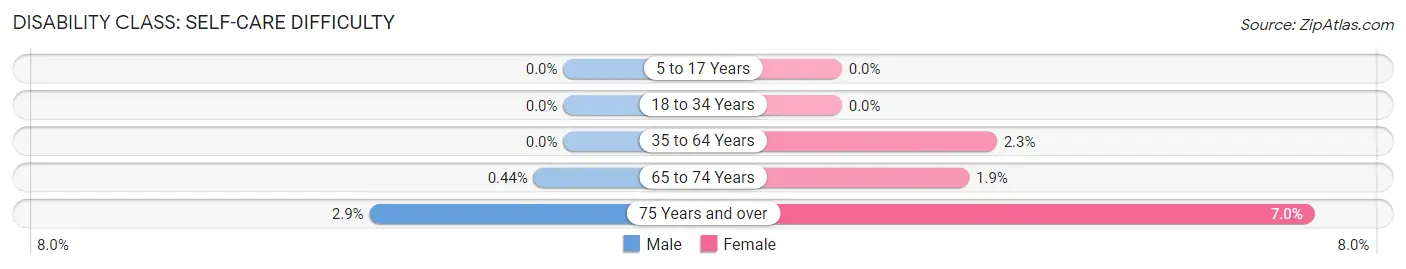
| Age Bracket | Male | Female |
| 5 to 17 Years | 0 (0.0%) | 0 (0.0%) |
| 18 to 34 Years | 0 (0.0%) | 0 (0.0%) |
| 35 to 64 Years | 0 (0.0%) | 48 (2.3%) |
| 65 to 74 Years | 8 (0.4%) | 37 (1.9%) |
| 75 Years and over | 39 (2.9%) | 87 (7.0%) |
Technology Access in Gold Canyon
Computing Device Access in Gold Canyon
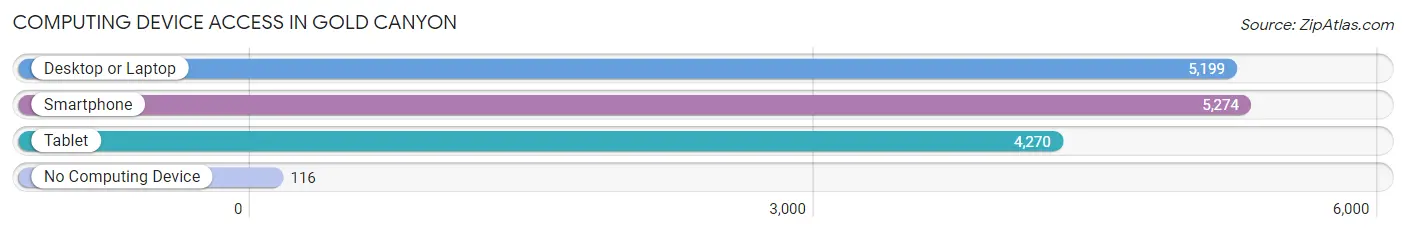
| Device Type | # Households | % Households |
| Desktop or Laptop | 5,199 | 89.4% |
| Smartphone | 5,274 | 90.7% |
| Tablet | 4,270 | 73.4% |
| No Computing Device | 116 | 2.0% |
| Total | 5,814 | 100.0% |
Internet Access in Gold Canyon
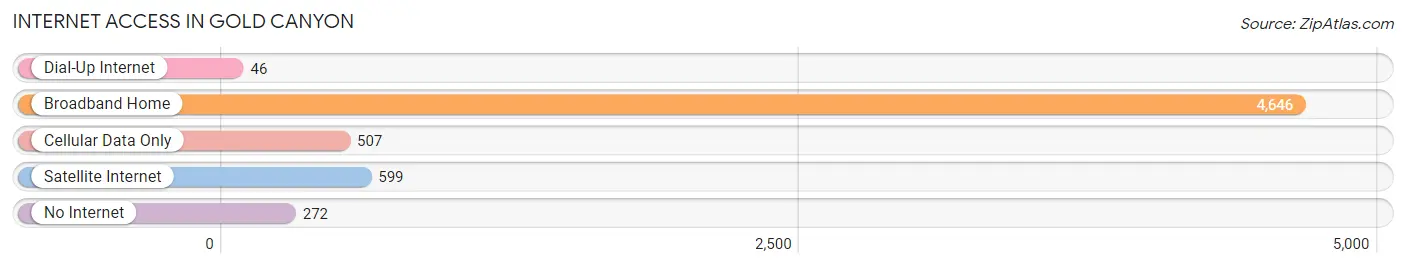
| Internet Type | # Households | % Households |
| Dial-Up Internet | 46 | 0.8% |
| Broadband Home | 4,646 | 79.9% |
| Cellular Data Only | 507 | 8.7% |
| Satellite Internet | 599 | 10.3% |
| No Internet | 272 | 4.7% |
| Total | 5,814 | 100.0% |
Gold Canyon Summary
History
Gold Canyon, Arizona is a census-designated place located in Pinal County, Arizona. It is located about 40 miles east of Phoenix and is part of the Phoenix metropolitan area. The area was first settled in the late 1800s by miners who were searching for gold. The area was originally known as “Gold Camp” and was later changed to Gold Canyon. The area was officially incorporated in 1986.
Geography
Gold Canyon is located in the Sonoran Desert in Pinal County, Arizona. It is located about 40 miles east of Phoenix and is part of the Phoenix metropolitan area. The area is known for its rugged terrain and is home to the Superstition Mountains. The area is also known for its mild winters and hot summers. The average temperature in the summer is around 90 degrees Fahrenheit and the average temperature in the winter is around 60 degrees Fahrenheit.
Economy
Gold Canyon’s economy is largely based on tourism and retirement. The area is home to several golf courses, resorts, and other recreational activities. The area is also home to several small businesses, including restaurants, retail stores, and other services. The area is also home to several large employers, including the Superstition Mountain Golf and Country Club, the Gold Canyon Golf Resort, and the Gold Canyon Casino.
Demographics
As of the 2010 census, the population of Gold Canyon was 7,812. The population is largely white (90.2%) and Hispanic (7.2%). The median household income is $60,938 and the median age is 48. The area is largely made up of married couples (63.2%) and families (71.2%).
Conclusion
Gold Canyon, Arizona is a census-designated place located in Pinal County, Arizona. It is located about 40 miles east of Phoenix and is part of the Phoenix metropolitan area. The area was first settled in the late 1800s by miners who were searching for gold. The area is known for its rugged terrain and is home to the Superstition Mountains. The area’s economy is largely based on tourism and retirement. The population of Gold Canyon is largely white (90.2%) and Hispanic (7.2%). The median household income is $60,938 and the median age is 48.
Common Questions
What is Per Capita Income in Gold Canyon?
Per Capita income in Gold Canyon is $56,313.
What is the Median Family Income in Gold Canyon?
Median Family Income in Gold Canyon is $100,104.
What is the Median Household income in Gold Canyon?
Median Household Income in Gold Canyon is $83,654.
What is Income or Wage Gap in Gold Canyon?
Income or Wage Gap in Gold Canyon is 42.4%.
Women in Gold Canyon earn 57.6 cents for every dollar earned by a man.
What is Inequality or Gini Index in Gold Canyon?
Inequality or Gini Index in Gold Canyon is 0.42.
What is the Total Population of Gold Canyon?
Total Population of Gold Canyon is 11,565.
What is the Total Male Population of Gold Canyon?
Total Male Population of Gold Canyon is 5,349.
What is the Total Female Population of Gold Canyon?
Total Female Population of Gold Canyon is 6,216.
What is the Ratio of Males per 100 Females in Gold Canyon?
There are 86.05 Males per 100 Females in Gold Canyon.
What is the Ratio of Females per 100 Males in Gold Canyon?
There are 116.21 Females per 100 Males in Gold Canyon.
What is the Median Population Age in Gold Canyon?
Median Population Age in Gold Canyon is 66.6 Years.
What is the Average Family Size in Gold Canyon
Average Family Size in Gold Canyon is 2.3 People.
What is the Average Household Size in Gold Canyon
Average Household Size in Gold Canyon is 2.0 People.
How Large is the Labor Force in Gold Canyon?
There are 3,368 People in the Labor Forcein in Gold Canyon.
What is the Percentage of People in the Labor Force in Gold Canyon?
30.6% of People are in the Labor Force in Gold Canyon.
What is the Unemployment Rate in Gold Canyon?
Unemployment Rate in Gold Canyon is 4.1%.