San Simon, AZ Map & Demographics
San Simon Map
San Simon Overview
$18,457
PER CAPITA INCOME
$43,654
AVG FAMILY INCOME
$23,750
AVG HOUSEHOLD INCOME
0.42
INEQUALITY / GINI INDEX
221
TOTAL POPULATION
117
MALE POPULATION
104
FEMALE POPULATION
112.50
MALES / 100 FEMALES
88.89
FEMALES / 100 MALES
64.8
MEDIAN AGE
2.5
AVG FAMILY SIZE
1.9
AVG HOUSEHOLD SIZE
66
LABOR FORCE [ PEOPLE ]
33.5%
PERCENT IN LABOR FORCE
24.2%
UNEMPLOYMENT RATE
San Simon Zip Codes
San Simon Area Codes
Income in San Simon
Income Overview in San Simon
Per Capita Income in San Simon is $18,457, while median incomes of families and households are $43,654 and $23,750 respectively.
| Characteristic | Number | Measure |
| Per Capita Income | 221 | $18,457 |
| Median Family Income | 66 | $43,654 |
| Mean Family Income | 66 | $43,091 |
| Median Household Income | 116 | $23,750 |
| Mean Household Income | 116 | $33,896 |
| Income Deficit | 66 | $0 |
| Wage / Income Gap (%) | 221 | 0.00% |
| Wage / Income Gap ($) | 221 | 100.00¢ per $1 |
| Gini / Inequality Index | 221 | 0.42 |
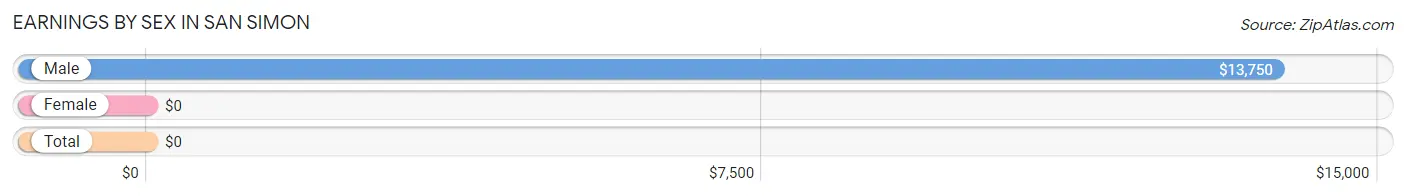
Earnings by Sex in San Simon
| Sex | Number | Average Earnings |
| Male | 52 (71.2%) | $13,750 |
| Female | 21 (28.8%) | $0 |
| Total | 73 (100.0%) | $0 |
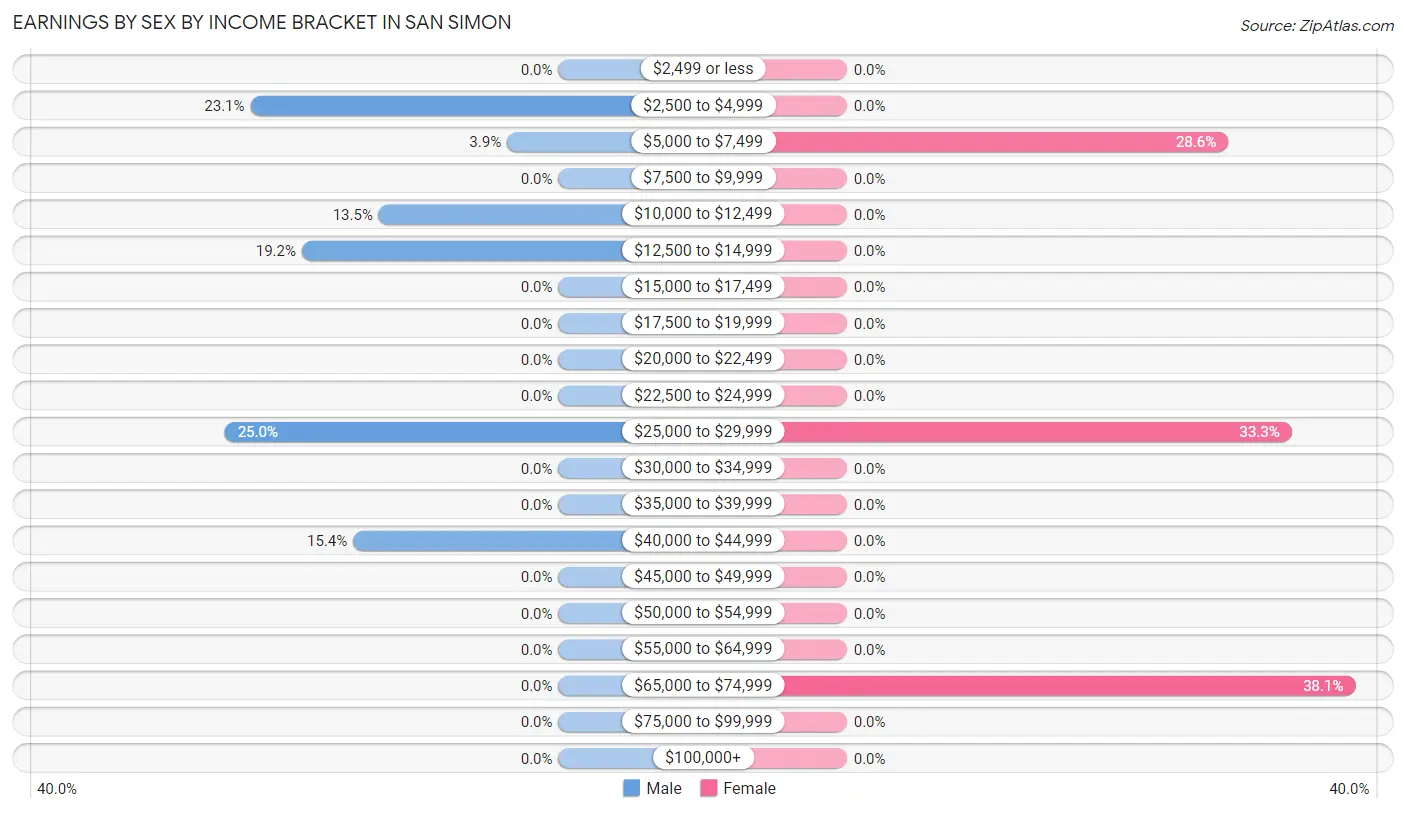
Earnings by Sex by Income Bracket in San Simon
The most common earnings brackets in San Simon are $25,000 to $29,999 for men (13 | 25.0%) and $65,000 to $74,999 for women (8 | 38.1%).
| Income | Male | Female |
| $2,499 or less | 0 (0.0%) | 0 (0.0%) |
| $2,500 to $4,999 | 12 (23.1%) | 0 (0.0%) |
| $5,000 to $7,499 | 2 (3.8%) | 6 (28.6%) |
| $7,500 to $9,999 | 0 (0.0%) | 0 (0.0%) |
| $10,000 to $12,499 | 7 (13.5%) | 0 (0.0%) |
| $12,500 to $14,999 | 10 (19.2%) | 0 (0.0%) |
| $15,000 to $17,499 | 0 (0.0%) | 0 (0.0%) |
| $17,500 to $19,999 | 0 (0.0%) | 0 (0.0%) |
| $20,000 to $22,499 | 0 (0.0%) | 0 (0.0%) |
| $22,500 to $24,999 | 0 (0.0%) | 0 (0.0%) |
| $25,000 to $29,999 | 13 (25.0%) | 7 (33.3%) |
| $30,000 to $34,999 | 0 (0.0%) | 0 (0.0%) |
| $35,000 to $39,999 | 0 (0.0%) | 0 (0.0%) |
| $40,000 to $44,999 | 8 (15.4%) | 0 (0.0%) |
| $45,000 to $49,999 | 0 (0.0%) | 0 (0.0%) |
| $50,000 to $54,999 | 0 (0.0%) | 0 (0.0%) |
| $55,000 to $64,999 | 0 (0.0%) | 0 (0.0%) |
| $65,000 to $74,999 | 0 (0.0%) | 8 (38.1%) |
| $75,000 to $99,999 | 0 (0.0%) | 0 (0.0%) |
| $100,000+ | 0 (0.0%) | 0 (0.0%) |
| Total | 52 (100.0%) | 21 (100.0%) |
Earnings by Sex by Educational Attainment in San Simon
| Educational Attainment | Male Income | Female Income |
| Less than High School | - | - |
| High School Diploma | - | - |
| College or Associate's Degree | - | - |
| Bachelor's Degree | - | - |
| Graduate Degree | - | - |
| Total | $28,654 | $0 |
Family Income in San Simon
Family Income Brackets in San Simon
According to the San Simon family income data, there are 22 families falling into the $35,000 to $49,999 income range, which is the most common income bracket and makes up 33.3% of all families.
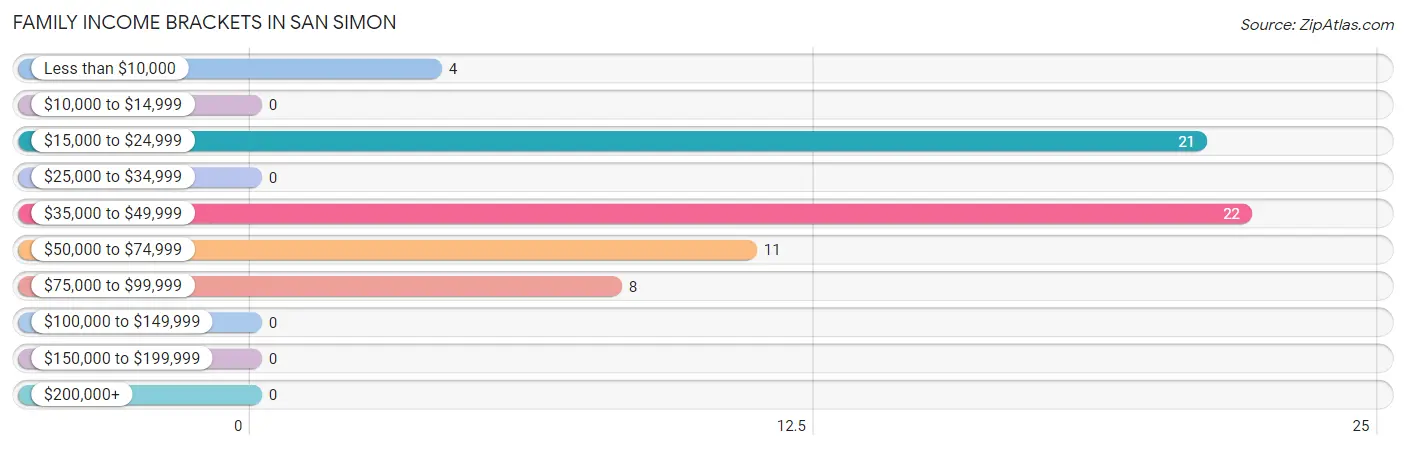
| Income Bracket | # Families | % Families |
| Less than $10,000 | 4 | 6.1% |
| $10,000 to $14,999 | 0 | 0.0% |
| $15,000 to $24,999 | 21 | 31.8% |
| $25,000 to $34,999 | 0 | 0.0% |
| $35,000 to $49,999 | 22 | 33.3% |
| $50,000 to $74,999 | 11 | 16.7% |
| $75,000 to $99,999 | 8 | 12.1% |
| $100,000 to $149,999 | 0 | 0.0% |
| $150,000 to $199,999 | 0 | 0.0% |
| $200,000+ | 0 | 0.0% |
Family Income by Famaliy Size in San Simon
3-person families (22 | 33.3%) account for the highest median family income in San Simon with $48,929 per family, while 2-person families (44 | 66.7%) have the highest median income of $21,442 per family member.
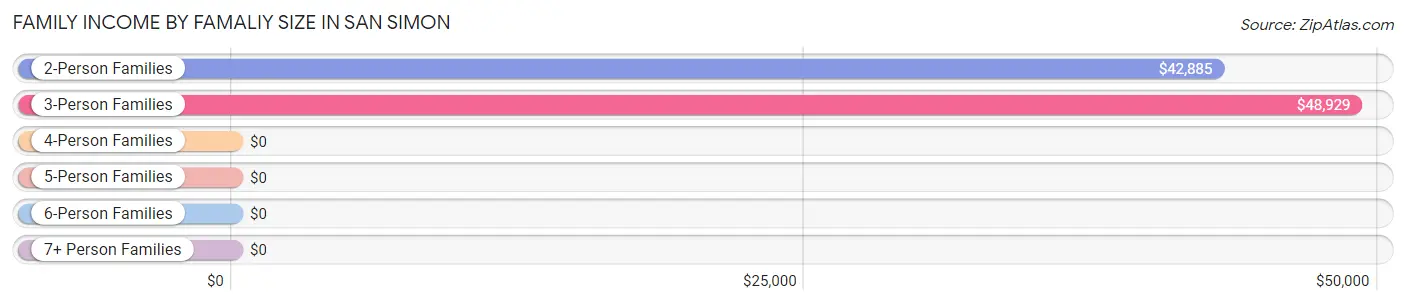
| Income Bracket | # Families | Median Income |
| 2-Person Families | 44 (66.7%) | $42,885 |
| 3-Person Families | 22 (33.3%) | $48,929 |
| 4-Person Families | 0 (0.0%) | $0 |
| 5-Person Families | 0 (0.0%) | $0 |
| 6-Person Families | 0 (0.0%) | $0 |
| 7+ Person Families | 0 (0.0%) | $0 |
| Total | 66 (100.0%) | $43,654 |
Family Income by Number of Earners in San Simon
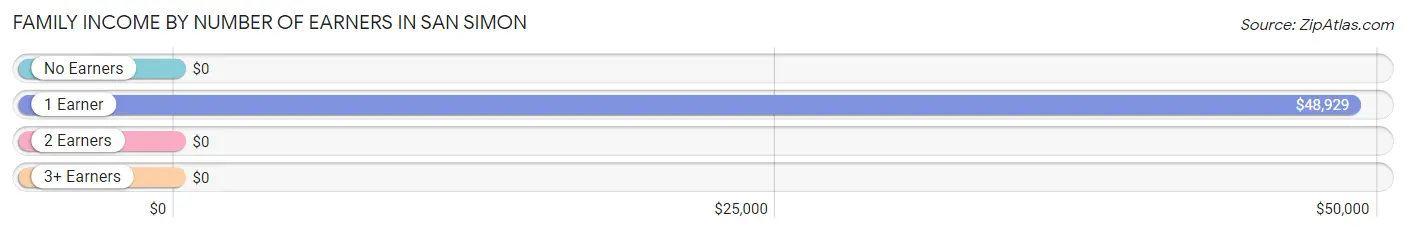
| Number of Earners | # Families | Median Income |
| No Earners | 26 (39.4%) | $0 |
| 1 Earner | 28 (42.4%) | $48,929 |
| 2 Earners | 12 (18.2%) | $0 |
| 3+ Earners | 0 (0.0%) | $0 |
| Total | 66 (100.0%) | $43,654 |
Household Income in San Simon
Household Income Brackets in San Simon
With 40 households falling in the category, the $15,000 to $24,999 income range is the most frequent in San Simon, accounting for 34.5% of all households.
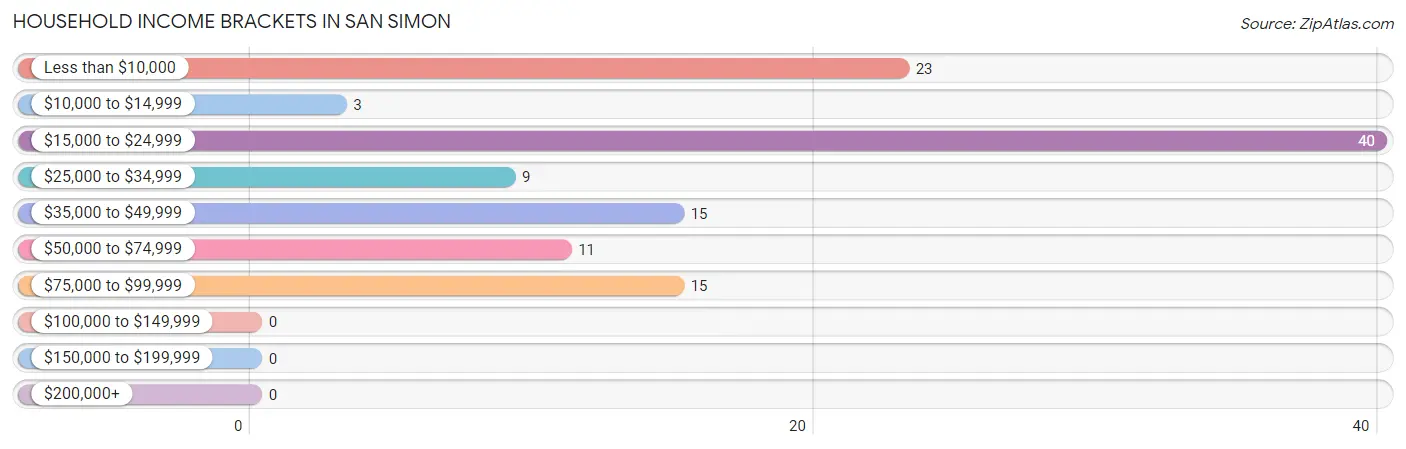
| Income Bracket | # Households | % Households |
| Less than $10,000 | 23 | 19.8% |
| $10,000 to $14,999 | 3 | 2.6% |
| $15,000 to $24,999 | 40 | 34.5% |
| $25,000 to $34,999 | 9 | 7.8% |
| $35,000 to $49,999 | 15 | 12.9% |
| $50,000 to $74,999 | 11 | 9.5% |
| $75,000 to $99,999 | 15 | 12.9% |
| $100,000 to $149,999 | 0 | 0.0% |
| $150,000 to $199,999 | 0 | 0.0% |
| $200,000+ | 0 | 0.0% |
Household Income by Householder Age in San Simon
The median household income in San Simon is $23,750, with the highest median household income of $22,734 found in the 65+ years age bracket for the primary householder. A total of 75 households (64.7%) fall into this category. Meanwhile, the 15 to 24 years age bracket for the primary householder has the lowest median household income of $0, with 1 households (0.9%) in this group.
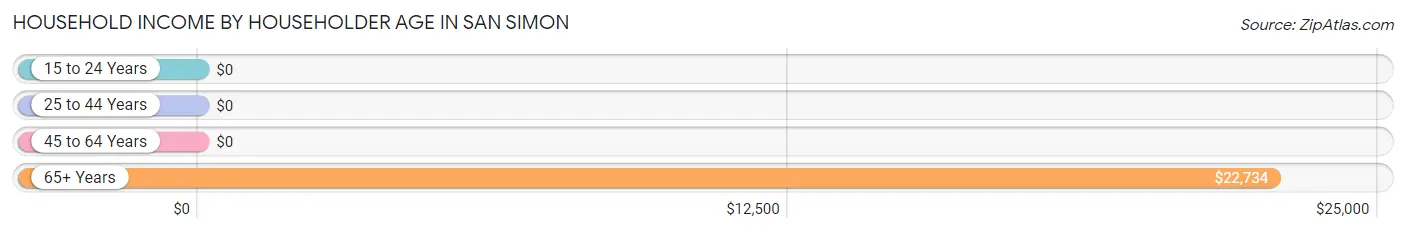
| Income Bracket | # Households | Median Income |
| 15 to 24 Years | 1 (0.9%) | $0 |
| 25 to 44 Years | 19 (16.4%) | $0 |
| 45 to 64 Years | 21 (18.1%) | $0 |
| 65+ Years | 75 (64.7%) | $22,734 |
| Total | 116 (100.0%) | $23,750 |
Poverty in San Simon
Income Below Poverty by Sex and Age in San Simon
With 18.8% poverty level for males and 30.8% for females among the residents of San Simon, 18 to 24 year old males and 25 to 34 year old females are the most vulnerable to poverty, with 12 males (37.5%) and 11 females (100.0%) in their respective age groups living below the poverty level.
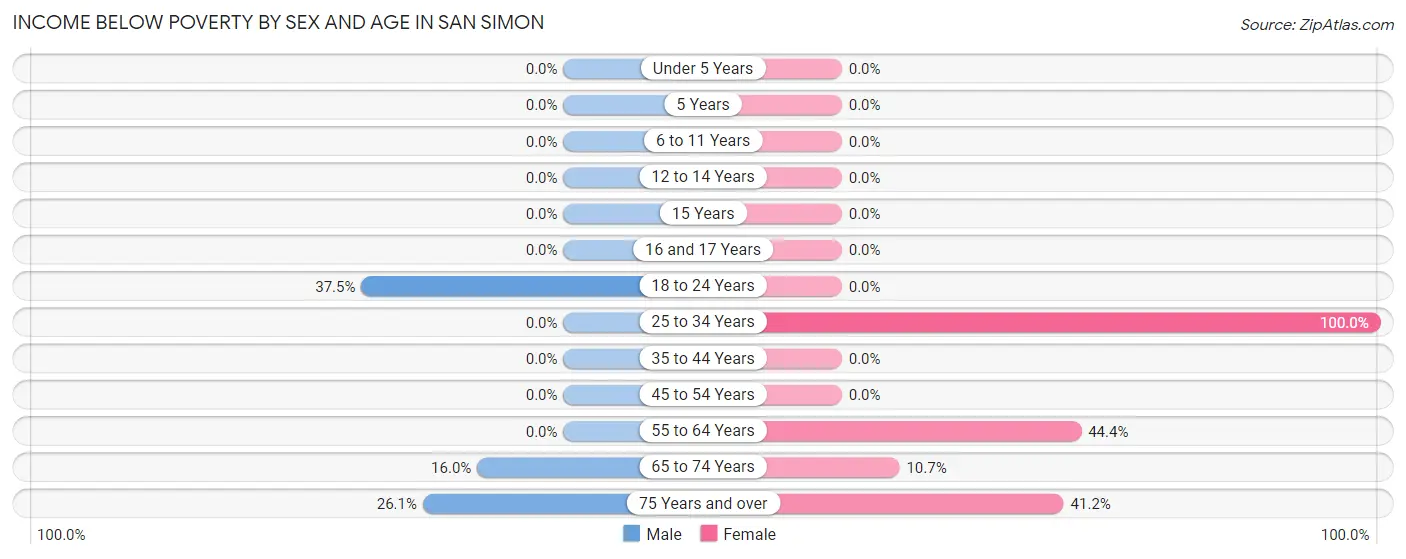
| Age Bracket | Male | Female |
| Under 5 Years | 0 (0.0%) | 0 (0.0%) |
| 5 Years | 0 (0.0%) | 0 (0.0%) |
| 6 to 11 Years | 0 (0.0%) | 0 (0.0%) |
| 12 to 14 Years | 0 (0.0%) | 0 (0.0%) |
| 15 Years | 0 (0.0%) | 0 (0.0%) |
| 16 and 17 Years | 0 (0.0%) | 0 (0.0%) |
| 18 to 24 Years | 12 (37.5%) | 0 (0.0%) |
| 25 to 34 Years | 0 (0.0%) | 11 (100.0%) |
| 35 to 44 Years | 0 (0.0%) | 0 (0.0%) |
| 45 to 54 Years | 0 (0.0%) | 0 (0.0%) |
| 55 to 64 Years | 0 (0.0%) | 4 (44.4%) |
| 65 to 74 Years | 4 (16.0%) | 3 (10.7%) |
| 75 Years and over | 6 (26.1%) | 14 (41.2%) |
| Total | 22 (18.8%) | 32 (30.8%) |
Income Above Poverty by Sex and Age in San Simon
According to the poverty statistics in San Simon, males aged 6 to 11 years and females aged 15 years are the age groups that are most secure financially, with 100.0% of males and 100.0% of females in these age groups living above the poverty line.
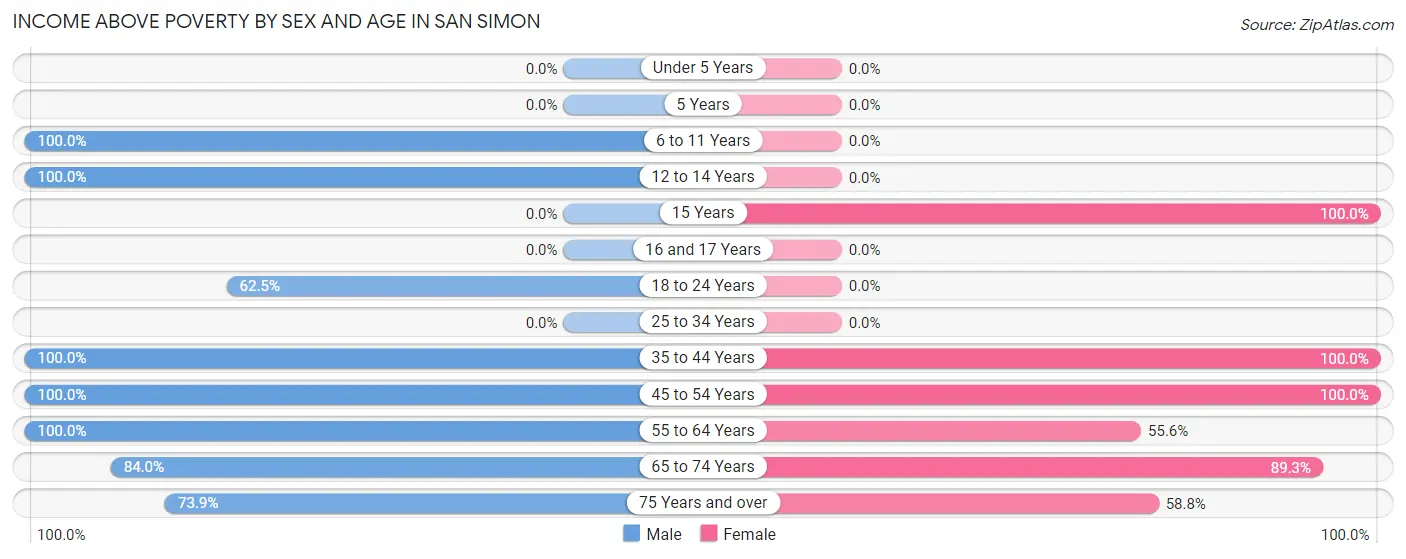
| Age Bracket | Male | Female |
| Under 5 Years | 0 (0.0%) | 0 (0.0%) |
| 5 Years | 0 (0.0%) | 0 (0.0%) |
| 6 to 11 Years | 9 (100.0%) | 0 (0.0%) |
| 12 to 14 Years | 8 (100.0%) | 0 (0.0%) |
| 15 Years | 0 (0.0%) | 7 (100.0%) |
| 16 and 17 Years | 0 (0.0%) | 0 (0.0%) |
| 18 to 24 Years | 20 (62.5%) | 0 (0.0%) |
| 25 to 34 Years | 0 (0.0%) | 0 (0.0%) |
| 35 to 44 Years | 8 (100.0%) | 8 (100.0%) |
| 45 to 54 Years | 10 (100.0%) | 7 (100.0%) |
| 55 to 64 Years | 2 (100.0%) | 5 (55.6%) |
| 65 to 74 Years | 21 (84.0%) | 25 (89.3%) |
| 75 Years and over | 17 (73.9%) | 20 (58.8%) |
| Total | 95 (81.2%) | 72 (69.2%) |
Income Below Poverty Among Married-Couple Families in San Simon
The poverty statistics for married-couple families in San Simon show that 31.4% or 11 of the total 35 families live below the poverty line. Families with no children have the highest poverty rate of 31.4%, comprising of 11 families. On the other hand, families with no children have the lowest poverty rate of 31.4%, which includes 11 families.
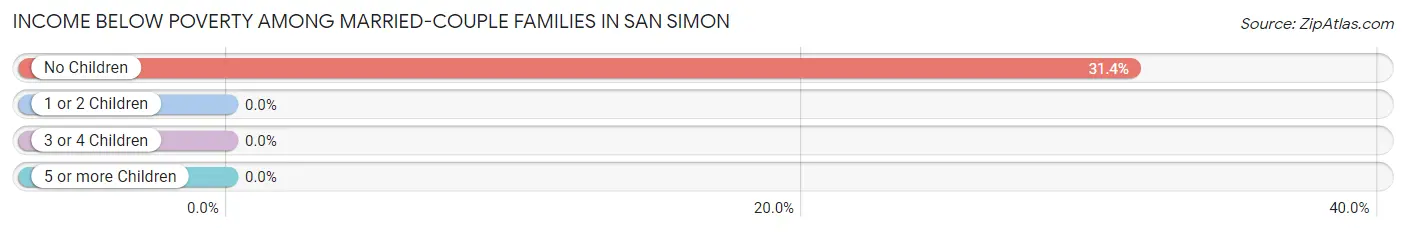
| Children | Above Poverty | Below Poverty |
| No Children | 24 (68.6%) | 11 (31.4%) |
| 1 or 2 Children | 0 (0.0%) | 0 (0.0%) |
| 3 or 4 Children | 0 (0.0%) | 0 (0.0%) |
| 5 or more Children | 0 (0.0%) | 0 (0.0%) |
| Total | 24 (68.6%) | 11 (31.4%) |
Income Below Poverty Among Single-Parent Households in San Simon
| Children | Single Father | Single Mother |
| No Children | 0 (0.0%) | 0 (0.0%) |
| 1 or 2 Children | 0 (0.0%) | 0 (0.0%) |
| 3 or 4 Children | 0 (0.0%) | 0 (0.0%) |
| 5 or more Children | 0 (0.0%) | 0 (0.0%) |
| Total | 0 (0.0%) | 0 (0.0%) |
Income Below Poverty Among Married-Couple vs Single-Parent Households in San Simon
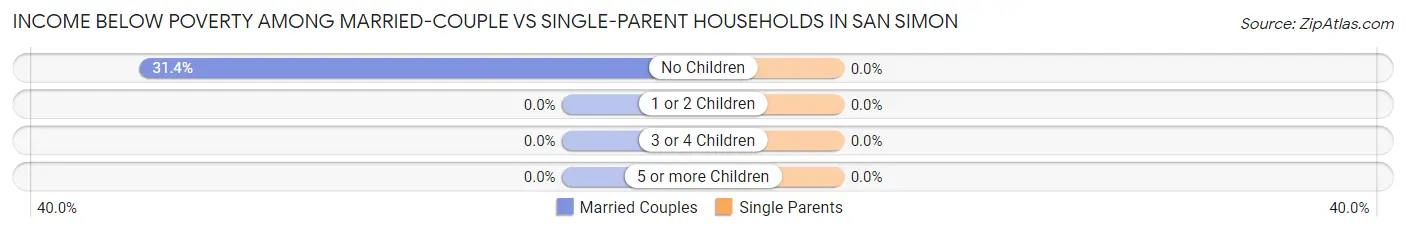
| Children | Married-Couple Families | Single-Parent Households |
| No Children | 11 (31.4%) | 0 (0.0%) |
| 1 or 2 Children | 0 (0.0%) | 0 (0.0%) |
| 3 or 4 Children | 0 (0.0%) | 0 (0.0%) |
| 5 or more Children | 0 (0.0%) | 0 (0.0%) |
| Total | 11 (31.4%) | 0 (0.0%) |
Race in San Simon
The most populous races in San Simon are White / Caucasian (151 | 68.3%), Hispanic or Latino (83 | 37.6%), and Some other Race (37 | 16.7%).
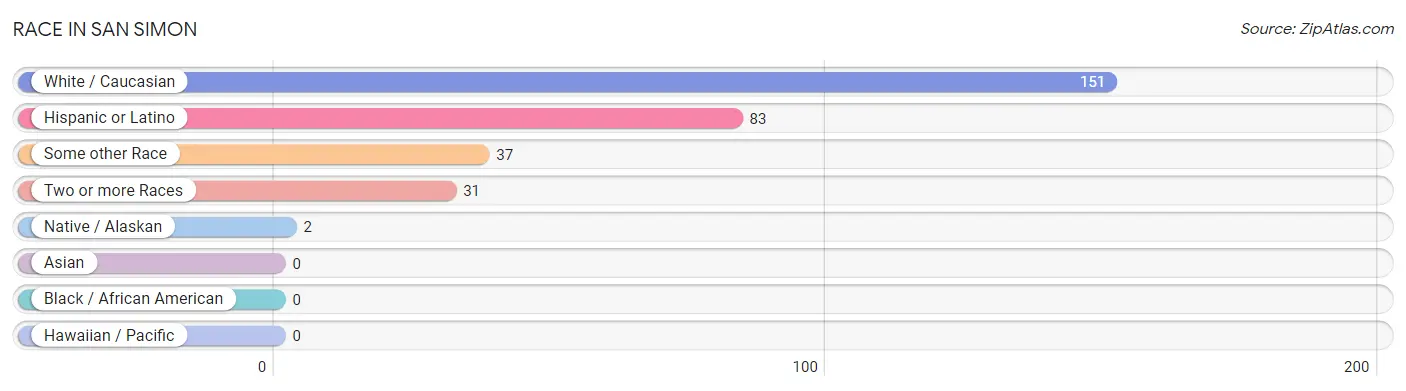
| Race | # Population | % Population |
| Asian | 0 | 0.0% |
| Black / African American | 0 | 0.0% |
| Hawaiian / Pacific | 0 | 0.0% |
| Hispanic or Latino | 83 | 37.6% |
| Native / Alaskan | 2 | 0.9% |
| White / Caucasian | 151 | 68.3% |
| Two or more Races | 31 | 14.0% |
| Some other Race | 37 | 16.7% |
| Total | 221 | 100.0% |
Ancestry in San Simon
The most populous ancestries reported in San Simon are Mexican (78 | 35.3%), English (38 | 17.2%), Irish (37 | 16.7%), German (26 | 11.8%), and Norwegian (24 | 10.9%), together accounting for 91.8% of all San Simon residents.
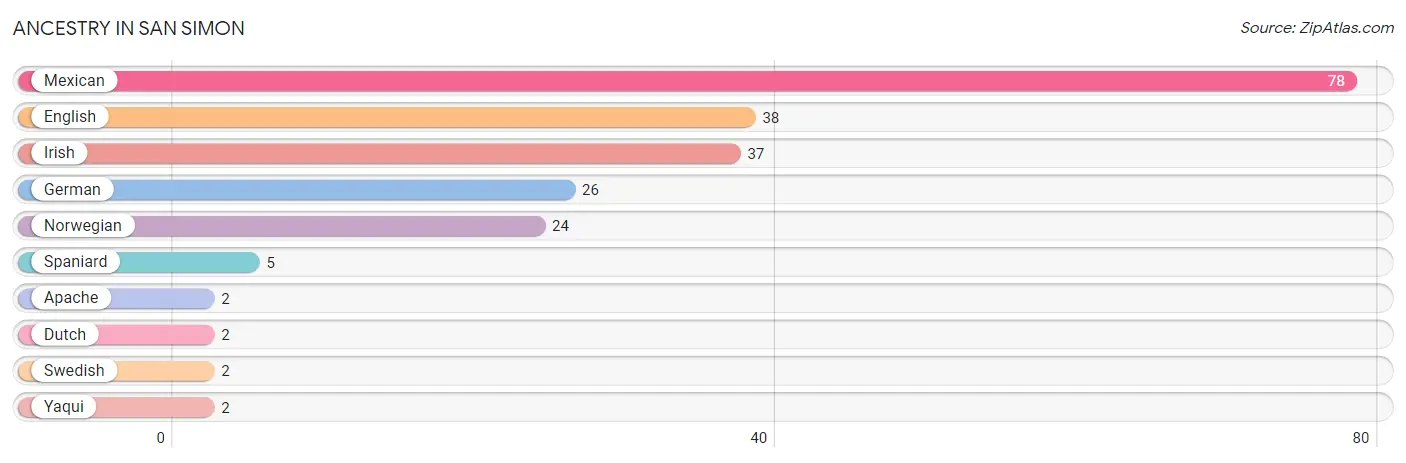
| Ancestry | # Population | % Population |
| Apache | 2 | 0.9% |
| Dutch | 2 | 0.9% |
| English | 38 | 17.2% |
| German | 26 | 11.8% |
| Irish | 37 | 16.7% |
| Mexican | 78 | 35.3% |
| Norwegian | 24 | 10.9% |
| Spaniard | 5 | 2.3% |
| Swedish | 2 | 0.9% |
| Yaqui | 2 | 0.9% | View All 10 Rows |
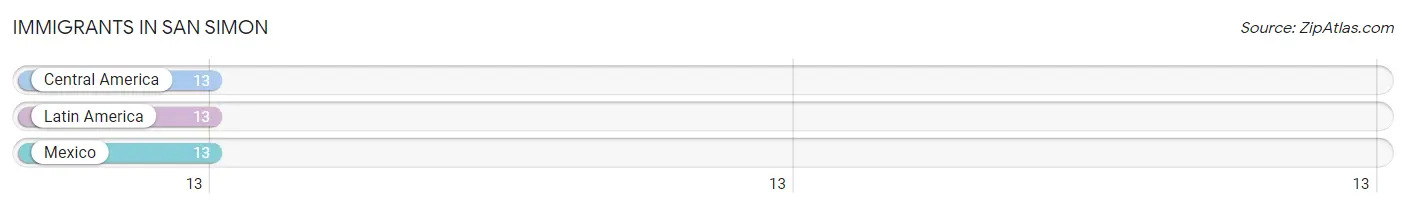
Immigrants in San Simon
The most numerous immigrant groups reported in San Simon came from Central America (13 | 5.9%), Latin America (13 | 5.9%), and Mexico (13 | 5.9%), together accounting for 17.6% of all San Simon residents.
| Immigration Origin | # Population | % Population |
| Central America | 13 | 5.9% |
| Latin America | 13 | 5.9% |
| Mexico | 13 | 5.9% | View All 3 Rows |
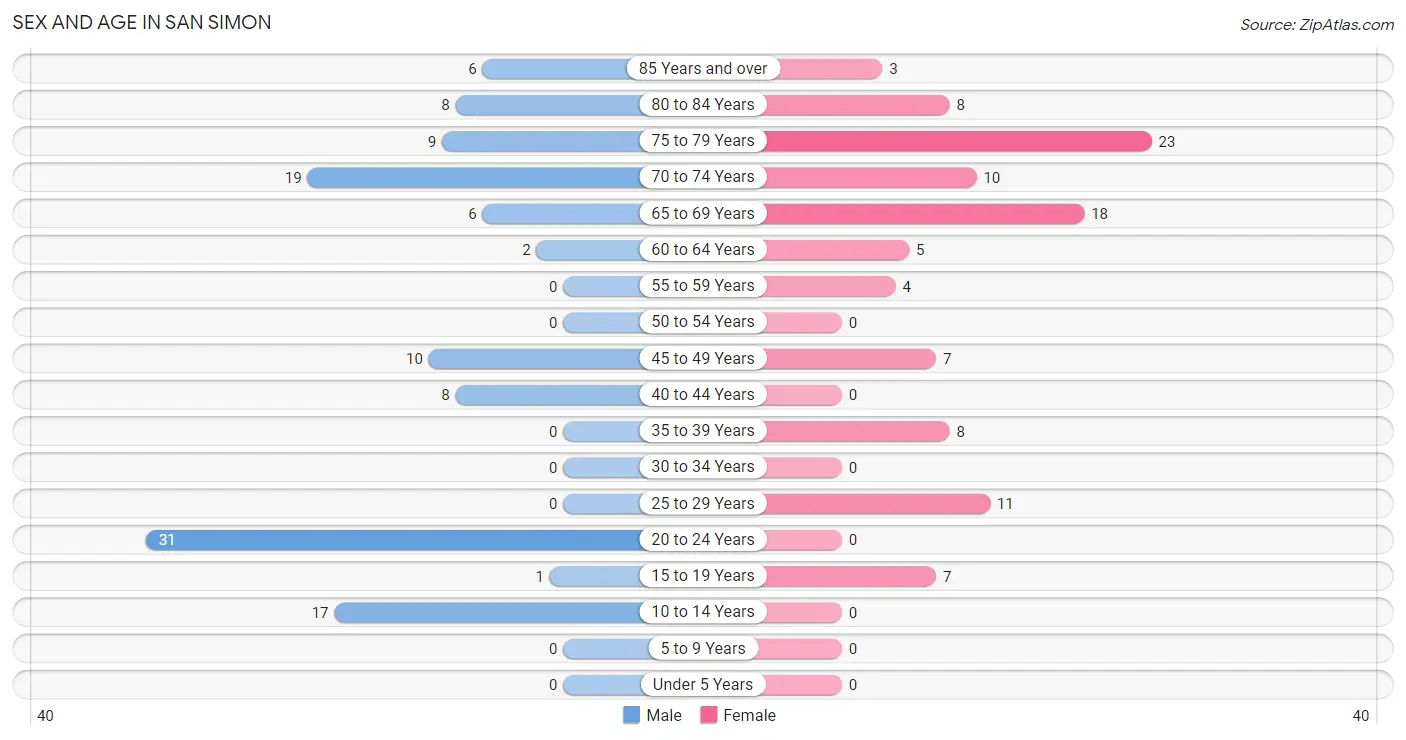
Sex and Age in San Simon
Sex and Age in San Simon
The most populous age groups in San Simon are 20 to 24 Years (31 | 26.5%) for men and 75 to 79 Years (23 | 22.1%) for women.
| Age Bracket | Male | Female |
| Under 5 Years | 0 (0.0%) | 0 (0.0%) |
| 5 to 9 Years | 0 (0.0%) | 0 (0.0%) |
| 10 to 14 Years | 17 (14.5%) | 0 (0.0%) |
| 15 to 19 Years | 1 (0.9%) | 7 (6.7%) |
| 20 to 24 Years | 31 (26.5%) | 0 (0.0%) |
| 25 to 29 Years | 0 (0.0%) | 11 (10.6%) |
| 30 to 34 Years | 0 (0.0%) | 0 (0.0%) |
| 35 to 39 Years | 0 (0.0%) | 8 (7.7%) |
| 40 to 44 Years | 8 (6.8%) | 0 (0.0%) |
| 45 to 49 Years | 10 (8.6%) | 7 (6.7%) |
| 50 to 54 Years | 0 (0.0%) | 0 (0.0%) |
| 55 to 59 Years | 0 (0.0%) | 4 (3.8%) |
| 60 to 64 Years | 2 (1.7%) | 5 (4.8%) |
| 65 to 69 Years | 6 (5.1%) | 18 (17.3%) |
| 70 to 74 Years | 19 (16.2%) | 10 (9.6%) |
| 75 to 79 Years | 9 (7.7%) | 23 (22.1%) |
| 80 to 84 Years | 8 (6.8%) | 8 (7.7%) |
| 85 Years and over | 6 (5.1%) | 3 (2.9%) |
| Total | 117 (100.0%) | 104 (100.0%) |
Families and Households in San Simon
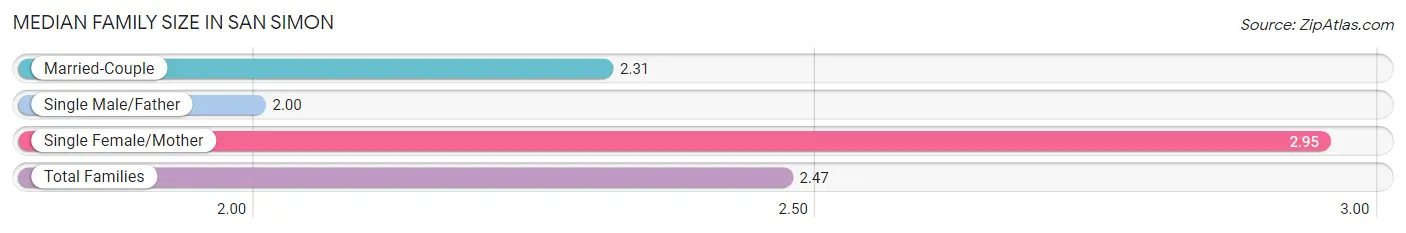
Median Family Size in San Simon
The median family size in San Simon is 2.47 persons per family, with single female/mother families (21 | 31.8%) accounting for the largest median family size of 2.95 persons per family. On the other hand, single male/father families (10 | 15.1%) represent the smallest median family size with 2.00 persons per family.
| Family Type | # Families | Family Size |
| Married-Couple | 35 (53.0%) | 2.31 |
| Single Male/Father | 10 (15.1%) | 2.00 |
| Single Female/Mother | 21 (31.8%) | 2.95 |
| Total Families | 66 (100.0%) | 2.47 |
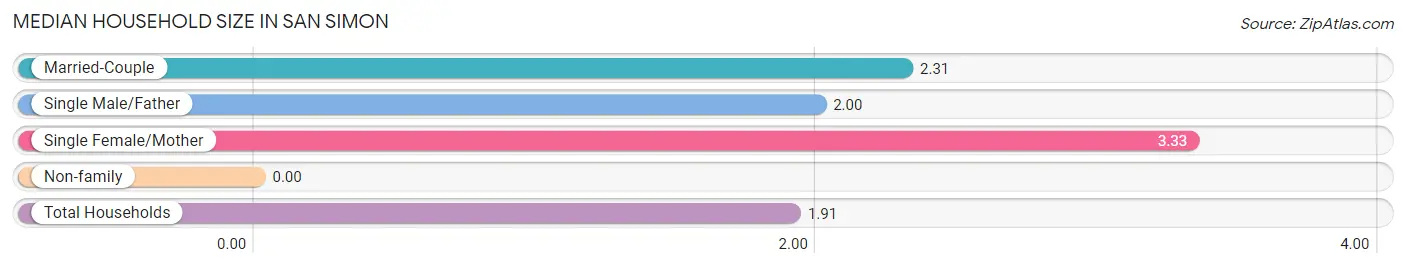
Median Household Size in San Simon
| Household Type | # Households | Household Size |
| Married-Couple | 35 (30.2%) | 2.31 |
| Single Male/Father | 10 (8.6%) | 2.00 |
| Single Female/Mother | 21 (18.1%) | 3.33 |
| Non-family | 50 (43.1%) | - |
| Total Households | 116 (100.0%) | 1.91 |
Household Size by Marriage Status in San Simon
Out of a total of 116 households in San Simon, 66 (56.9%) are family households, while 50 (43.1%) are nonfamily households. The most numerous type of family households are 2-person households, comprising 44, and the most common type of nonfamily households are 1-person households, comprising 50.
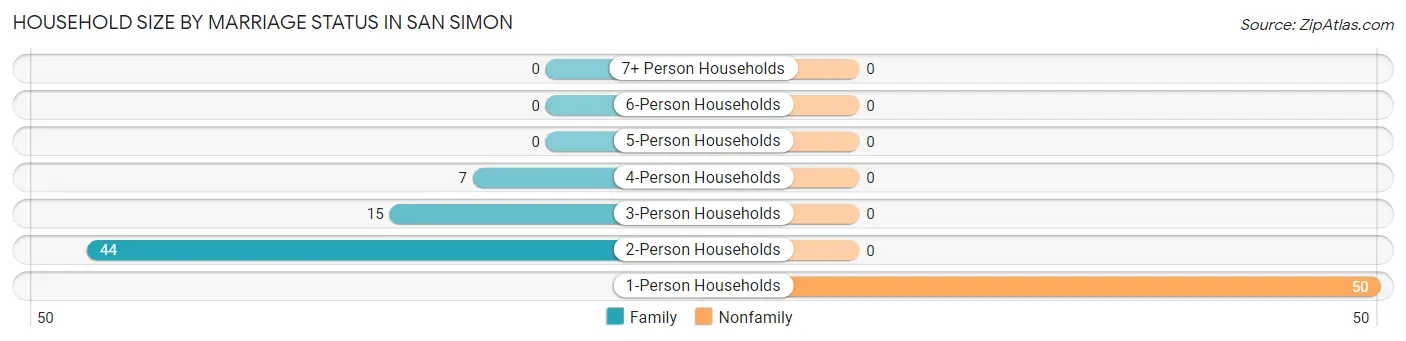
| Household Size | Family Households | Nonfamily Households |
| 1-Person Households | - | 50 (43.1%) |
| 2-Person Households | 44 (37.9%) | 0 (0.0%) |
| 3-Person Households | 15 (12.9%) | 0 (0.0%) |
| 4-Person Households | 7 (6.0%) | 0 (0.0%) |
| 5-Person Households | 0 (0.0%) | 0 (0.0%) |
| 6-Person Households | 0 (0.0%) | 0 (0.0%) |
| 7+ Person Households | 0 (0.0%) | 0 (0.0%) |
| Total | 66 (56.9%) | 50 (43.1%) |
Female Fertility in San Simon
Fertility by Age in San Simon
| Age Bracket | Women with Births | Births / 1,000 Women |
| 15 to 19 years | 0 (0.0%) | 0.0 |
| 20 to 34 years | 0 (0.0%) | 0.0 |
| 35 to 50 years | 0 (0.0%) | 0.0 |
| Total | 0 (0.0%) | 0.0 |
Fertility by Age by Marriage Status in San Simon
| Age Bracket | Married | Unmarried |
| 15 to 19 years | 0 (0.0%) | 0 (0.0%) |
| 20 to 34 years | 0 (0.0%) | 0 (0.0%) |
| 35 to 50 years | 0 (0.0%) | 0 (0.0%) |
| Total | 0 (0.0%) | 0 (0.0%) |
Fertility by Education in San Simon
| Educational Attainment | Women with Births | Births / 1,000 Women |
| Less than High School | 0 (0.0%) | 0.0 |
| High School Diploma | 0 (0.0%) | 0.0 |
| College or Associate's Degree | 0 (0.0%) | 0.0 |
| Bachelor's Degree | 0 (0.0%) | 0.0 |
| Graduate Degree | 0 (0.0%) | 0.0 |
| Total | 0 (0.0%) | 0.0 |
Fertility by Education by Marriage Status in San Simon
| Educational Attainment | Married | Unmarried |
| Less than High School | 0 (0.0%) | 0 (0.0%) |
| High School Diploma | 0 (0.0%) | 0 (0.0%) |
| College or Associate's Degree | 0 (0.0%) | 0 (0.0%) |
| Bachelor's Degree | 0 (0.0%) | 0 (0.0%) |
| Graduate Degree | 0 (0.0%) | 0 (0.0%) |
| Total | 0 (0.0%) | 0 (0.0%) |
Employment Characteristics in San Simon
Employment by Class of Employer in San Simon
Among the 39 employed individuals in San Simon, private company employees (19 | 48.7%), state government employees (10 | 25.6%), and federal government employees (7 | 17.9%) make up the most common classes of employment.
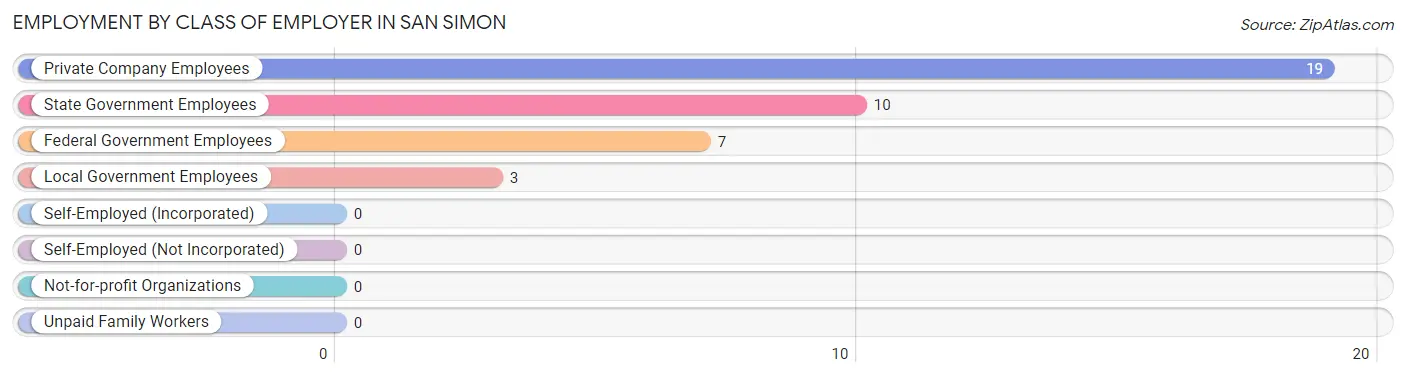
| Employer Class | # Employees | % Employees |
| Private Company Employees | 19 | 48.7% |
| Self-Employed (Incorporated) | 0 | 0.0% |
| Self-Employed (Not Incorporated) | 0 | 0.0% |
| Not-for-profit Organizations | 0 | 0.0% |
| Local Government Employees | 3 | 7.7% |
| State Government Employees | 10 | 25.6% |
| Federal Government Employees | 7 | 17.9% |
| Unpaid Family Workers | 0 | 0.0% |
| Total | 39 | 100.0% |
Employment Status by Age in San Simon
According to the labor force statistics for San Simon, out of the total population over 16 years of age (197), 33.5% or 66 individuals are in the labor force, with 24.2% or 16 of them unemployed. The age group with the highest labor force participation rate is 16 to 19 years, with 100.0% or 1 individuals in the labor force. Within the labor force, the 60 to 64 years age range has the highest percentage of unemployed individuals, with 100.0% or 5 of them being unemployed.
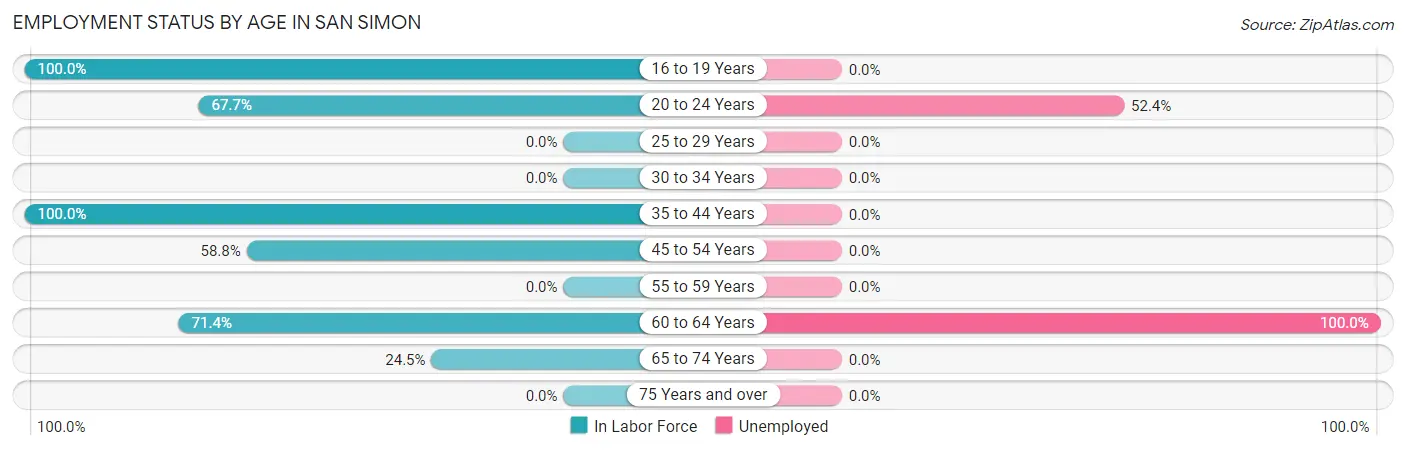
| Age Bracket | In Labor Force | Unemployed |
| 16 to 19 Years | 1 (100.0%) | 0 (0.0%) |
| 20 to 24 Years | 21 (67.7%) | 11 (52.4%) |
| 25 to 29 Years | 0 (0.0%) | 0 (0.0%) |
| 30 to 34 Years | 0 (0.0%) | 0 (0.0%) |
| 35 to 44 Years | 16 (100.0%) | 0 (0.0%) |
| 45 to 54 Years | 10 (58.8%) | 0 (0.0%) |
| 55 to 59 Years | 0 (0.0%) | 0 (0.0%) |
| 60 to 64 Years | 5 (71.4%) | 5 (100.0%) |
| 65 to 74 Years | 13 (24.5%) | 0 (0.0%) |
| 75 Years and over | 0 (0.0%) | 0 (0.0%) |
| Total | 66 (33.5%) | 16 (24.2%) |
Employment Status by Educational Attainment in San Simon
According to labor force statistics for San Simon, 56.4% of individuals (31) out of the total population between 25 and 64 years of age (55) are in the labor force, with 16.1% or 5 of them being unemployed. The group with the highest labor force participation rate are those with the educational attainment of less than high school, with 100.0% or 10 individuals in the labor force. Within the labor force, individuals with bachelor's degree or higher education have the highest percentage of unemployment, with 100.0% or 3 of them being unemployed.
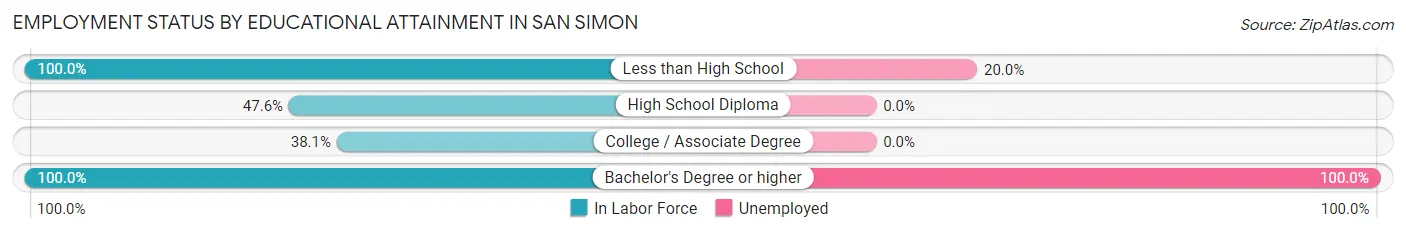
| Educational Attainment | In Labor Force | Unemployed |
| Less than High School | 10 (100.0%) | 2 (20.0%) |
| High School Diploma | 10 (47.6%) | 0 (0.0%) |
| College / Associate Degree | 8 (38.1%) | 0 (0.0%) |
| Bachelor's Degree or higher | 3 (100.0%) | 3 (100.0%) |
| Total | 31 (56.4%) | 9 (16.1%) |
Employment Occupations by Sex in San Simon
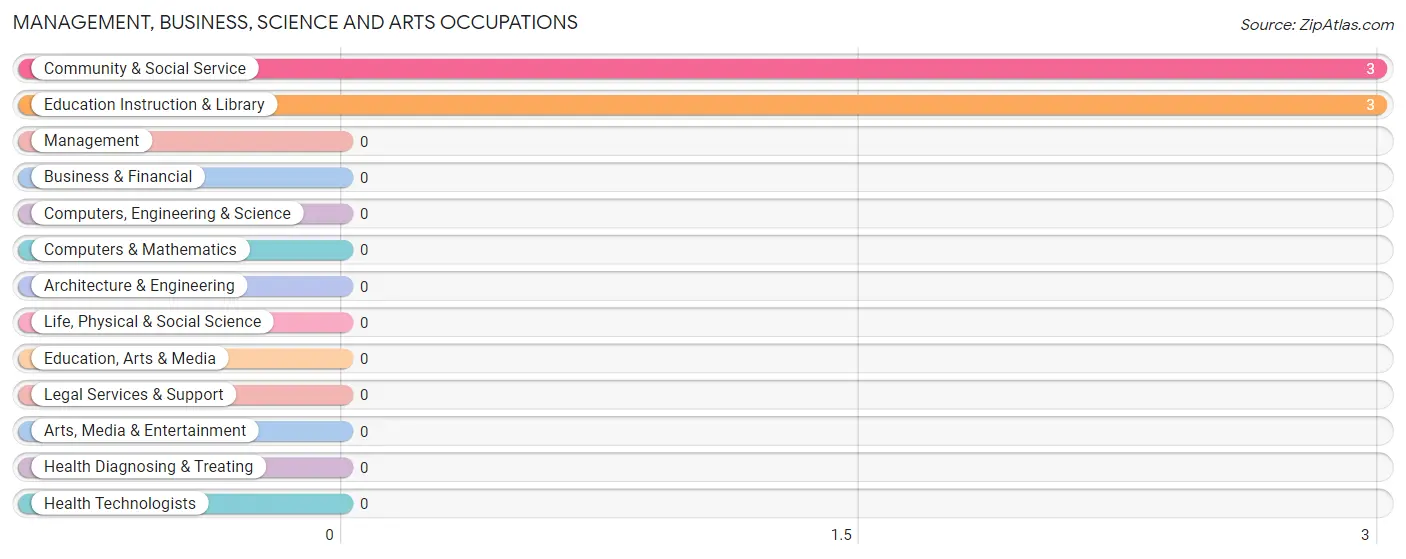
Management, Business, Science and Arts Occupations
The most common Management, Business, Science and Arts occupations in San Simon are Community & Social Service (3 | 6.0%), and Education Instruction & Library (3 | 6.0%).
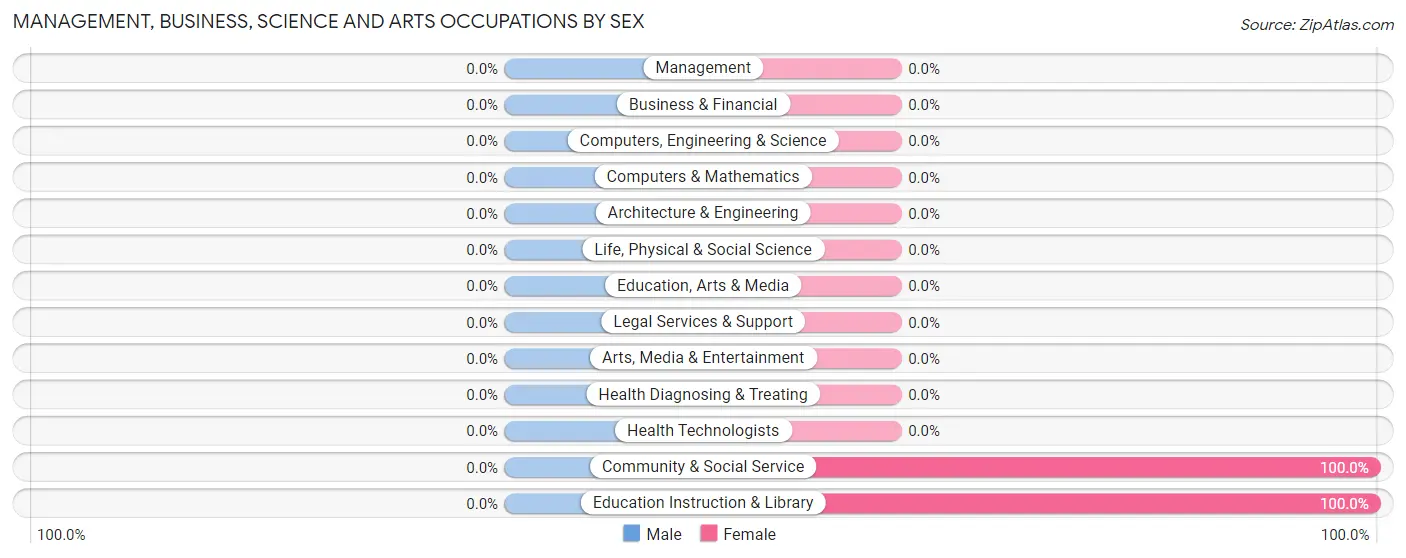
Management, Business, Science and Arts Occupations by Sex
| Occupation | Male | Female |
| Management | 0 (0.0%) | 0 (0.0%) |
| Business & Financial | 0 (0.0%) | 0 (0.0%) |
| Computers, Engineering & Science | 0 (0.0%) | 0 (0.0%) |
| Computers & Mathematics | 0 (0.0%) | 0 (0.0%) |
| Architecture & Engineering | 0 (0.0%) | 0 (0.0%) |
| Life, Physical & Social Science | 0 (0.0%) | 0 (0.0%) |
| Community & Social Service | 0 (0.0%) | 3 (100.0%) |
| Education, Arts & Media | 0 (0.0%) | 0 (0.0%) |
| Legal Services & Support | 0 (0.0%) | 0 (0.0%) |
| Education Instruction & Library | 0 (0.0%) | 3 (100.0%) |
| Arts, Media & Entertainment | 0 (0.0%) | 0 (0.0%) |
| Health Diagnosing & Treating | 0 (0.0%) | 0 (0.0%) |
| Health Technologists | 0 (0.0%) | 0 (0.0%) |
| Total (Category) | 0 (0.0%) | 3 (100.0%) |
| Total (Overall) | 39 (78.0%) | 11 (22.0%) |
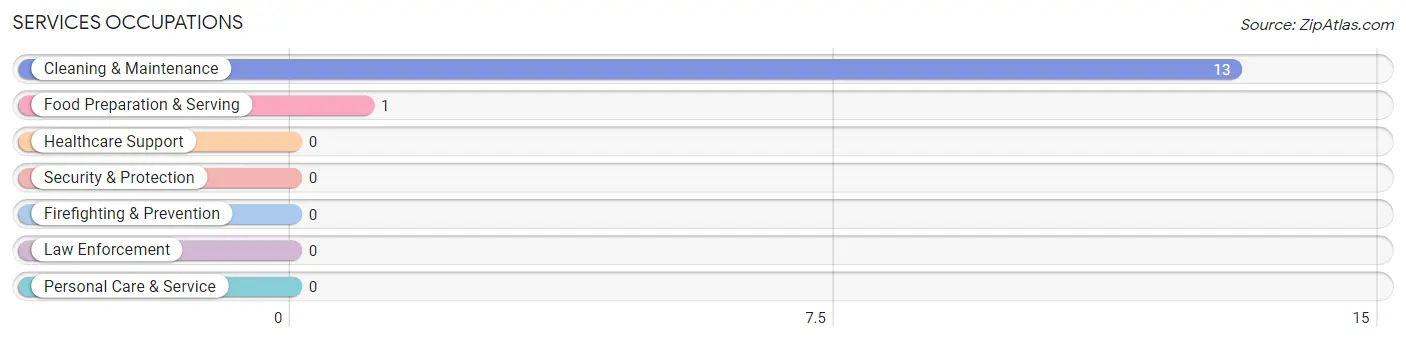
Services Occupations
The most common Services occupations in San Simon are Cleaning & Maintenance (13 | 26.0%), and Food Preparation & Serving (1 | 2.0%).
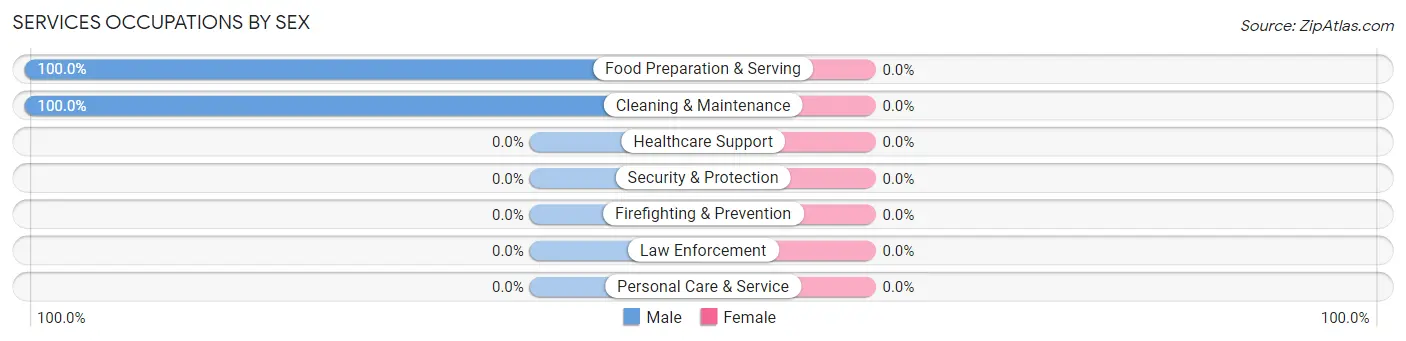
Services Occupations by Sex
| Occupation | Male | Female |
| Healthcare Support | 0 (0.0%) | 0 (0.0%) |
| Security & Protection | 0 (0.0%) | 0 (0.0%) |
| Firefighting & Prevention | 0 (0.0%) | 0 (0.0%) |
| Law Enforcement | 0 (0.0%) | 0 (0.0%) |
| Food Preparation & Serving | 1 (100.0%) | 0 (0.0%) |
| Cleaning & Maintenance | 13 (100.0%) | 0 (0.0%) |
| Personal Care & Service | 0 (0.0%) | 0 (0.0%) |
| Total (Category) | 14 (100.0%) | 0 (0.0%) |
| Total (Overall) | 39 (78.0%) | 11 (22.0%) |
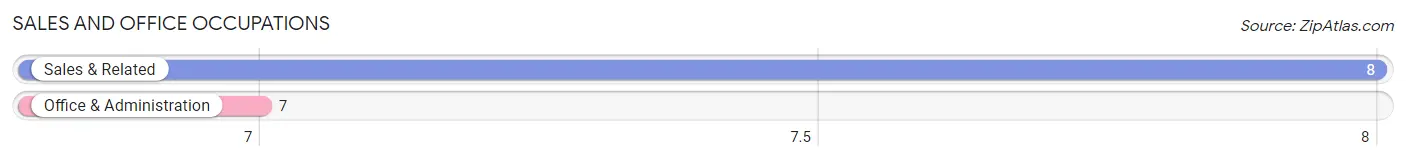
Sales and Office Occupations
The most common Sales and Office occupations in San Simon are Sales & Related (8 | 16.0%), and Office & Administration (7 | 14.0%).
Sales and Office Occupations by Sex
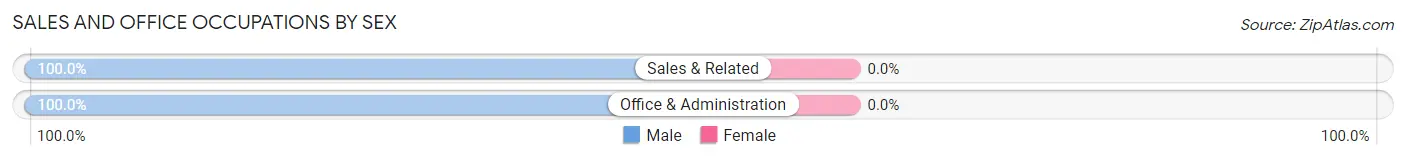
| Occupation | Male | Female |
| Sales & Related | 8 (100.0%) | 0 (0.0%) |
| Office & Administration | 7 (100.0%) | 0 (0.0%) |
| Total (Category) | 15 (100.0%) | 0 (0.0%) |
| Total (Overall) | 39 (78.0%) | 11 (22.0%) |
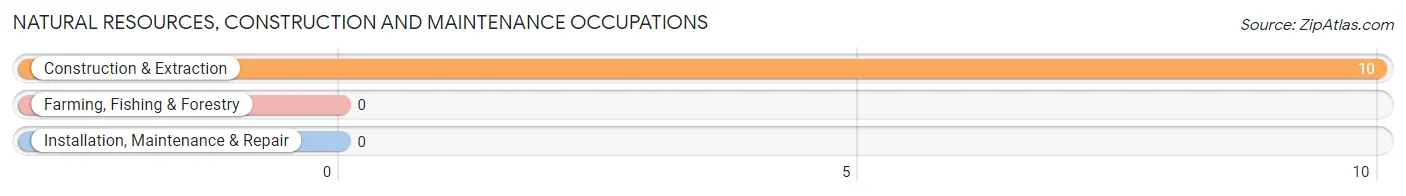
Natural Resources, Construction and Maintenance Occupations
The most common Natural Resources, Construction and Maintenance occupations in San Simon are , and Construction & Extraction (10 | 20.0%).
Natural Resources, Construction and Maintenance Occupations by Sex
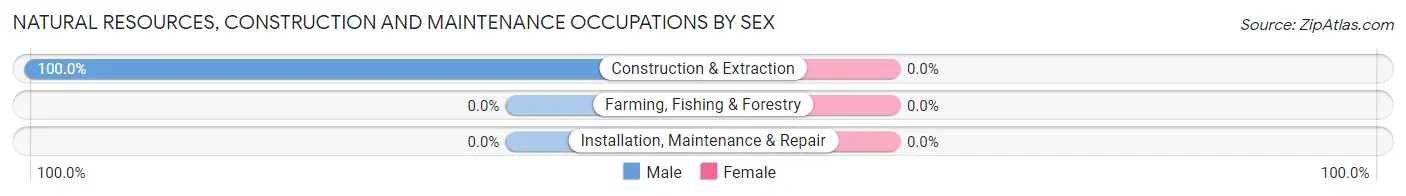
| Occupation | Male | Female |
| Farming, Fishing & Forestry | 0 (0.0%) | 0 (0.0%) |
| Construction & Extraction | 10 (100.0%) | 0 (0.0%) |
| Installation, Maintenance & Repair | 0 (0.0%) | 0 (0.0%) |
| Total (Category) | 10 (100.0%) | 0 (0.0%) |
| Total (Overall) | 39 (78.0%) | 11 (22.0%) |
Production, Transportation and Moving Occupations
The most common Production, Transportation and Moving occupations in San Simon are , and Transportation (8 | 16.0%).
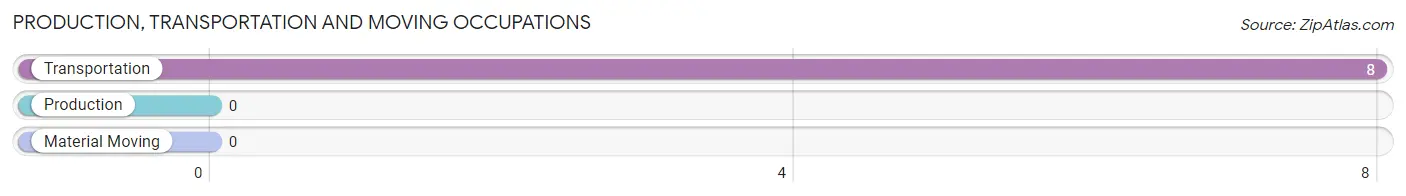
Production, Transportation and Moving Occupations by Sex
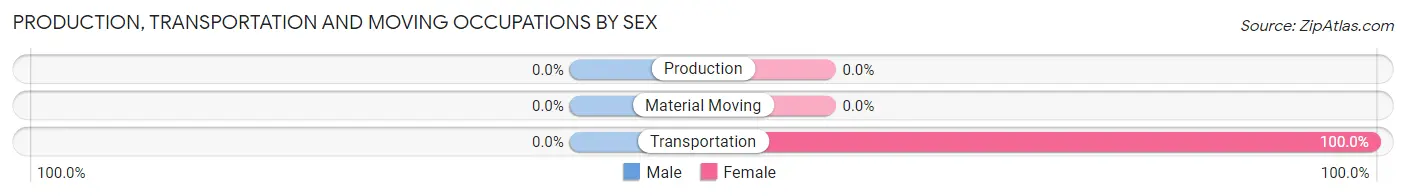
| Occupation | Male | Female |
| Production | 0 (0.0%) | 0 (0.0%) |
| Transportation | 0 (0.0%) | 8 (100.0%) |
| Material Moving | 0 (0.0%) | 0 (0.0%) |
| Total (Category) | 0 (0.0%) | 8 (100.0%) |
| Total (Overall) | 39 (78.0%) | 11 (22.0%) |
Employment Industries by Sex in San Simon
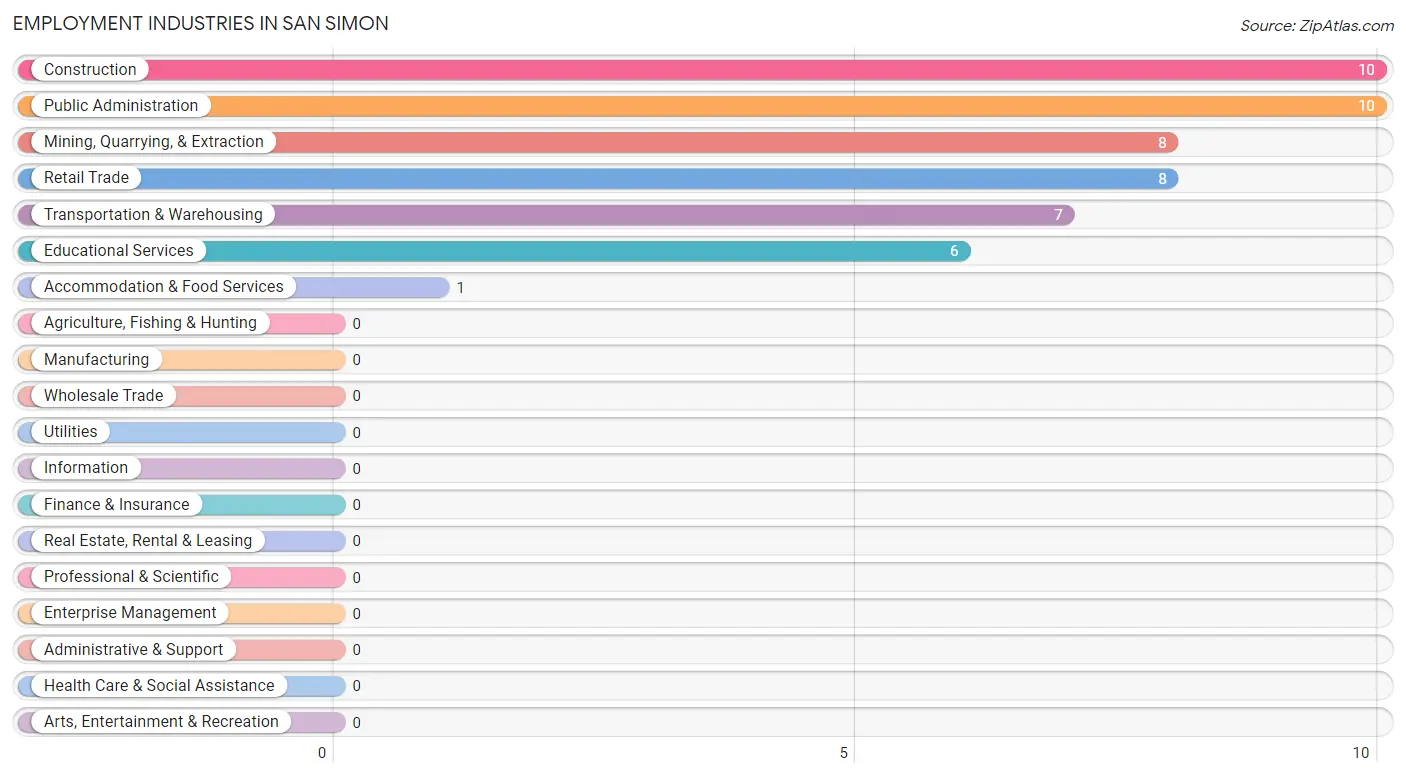
Employment Industries in San Simon
The major employment industries in San Simon include Construction (10 | 20.0%), Public Administration (10 | 20.0%), Mining, Quarrying, & Extraction (8 | 16.0%), Retail Trade (8 | 16.0%), and Transportation & Warehousing (7 | 14.0%).
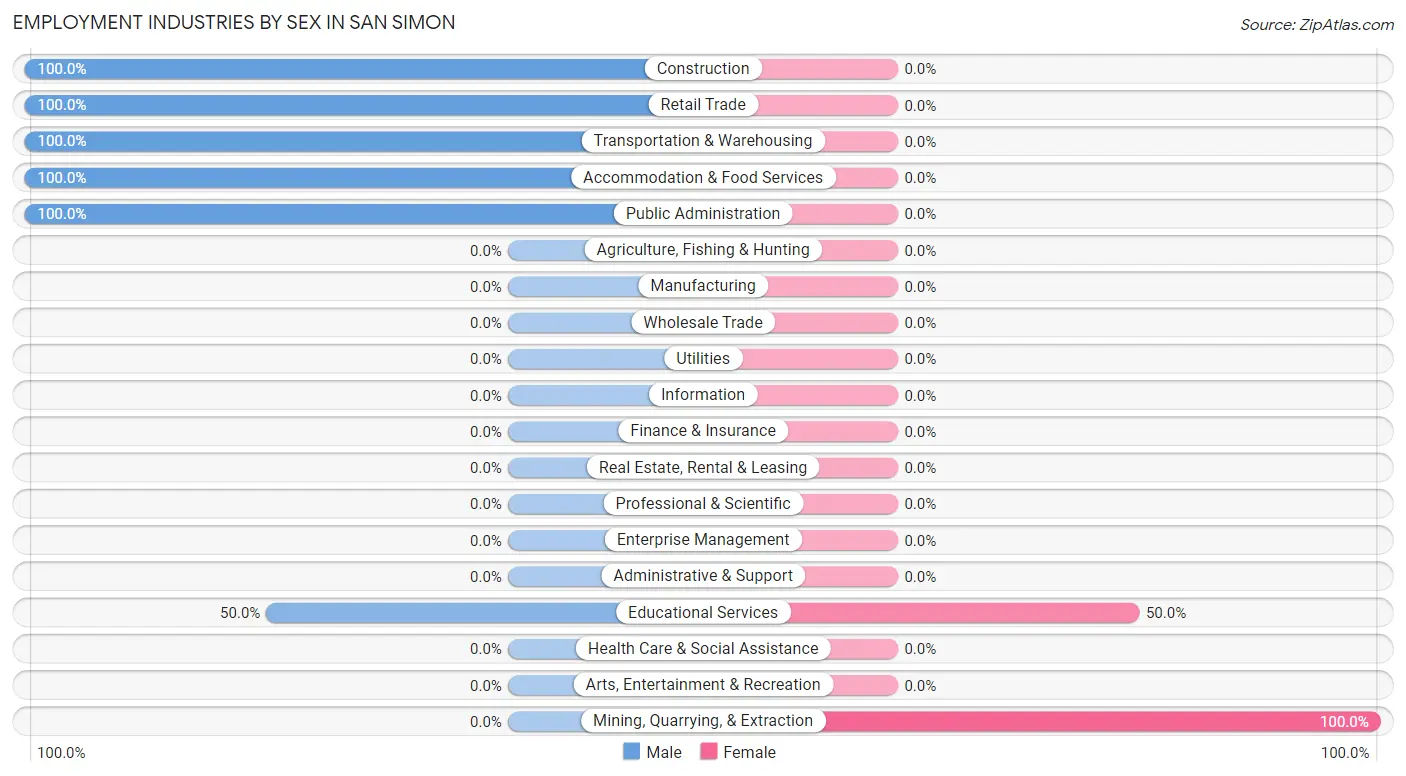
Employment Industries by Sex in San Simon
The San Simon industries that see more men than women are Construction (100.0%), Retail Trade (100.0%), and Transportation & Warehousing (100.0%), whereas the industries that tend to have a higher number of women are Mining, Quarrying, & Extraction (100.0%), and Educational Services (50.0%).
| Industry | Male | Female |
| Agriculture, Fishing & Hunting | 0 (0.0%) | 0 (0.0%) |
| Mining, Quarrying, & Extraction | 0 (0.0%) | 8 (100.0%) |
| Construction | 10 (100.0%) | 0 (0.0%) |
| Manufacturing | 0 (0.0%) | 0 (0.0%) |
| Wholesale Trade | 0 (0.0%) | 0 (0.0%) |
| Retail Trade | 8 (100.0%) | 0 (0.0%) |
| Transportation & Warehousing | 7 (100.0%) | 0 (0.0%) |
| Utilities | 0 (0.0%) | 0 (0.0%) |
| Information | 0 (0.0%) | 0 (0.0%) |
| Finance & Insurance | 0 (0.0%) | 0 (0.0%) |
| Real Estate, Rental & Leasing | 0 (0.0%) | 0 (0.0%) |
| Professional & Scientific | 0 (0.0%) | 0 (0.0%) |
| Enterprise Management | 0 (0.0%) | 0 (0.0%) |
| Administrative & Support | 0 (0.0%) | 0 (0.0%) |
| Educational Services | 3 (50.0%) | 3 (50.0%) |
| Health Care & Social Assistance | 0 (0.0%) | 0 (0.0%) |
| Arts, Entertainment & Recreation | 0 (0.0%) | 0 (0.0%) |
| Accommodation & Food Services | 1 (100.0%) | 0 (0.0%) |
| Public Administration | 10 (100.0%) | 0 (0.0%) |
| Total | 39 (78.0%) | 11 (22.0%) |
Education in San Simon
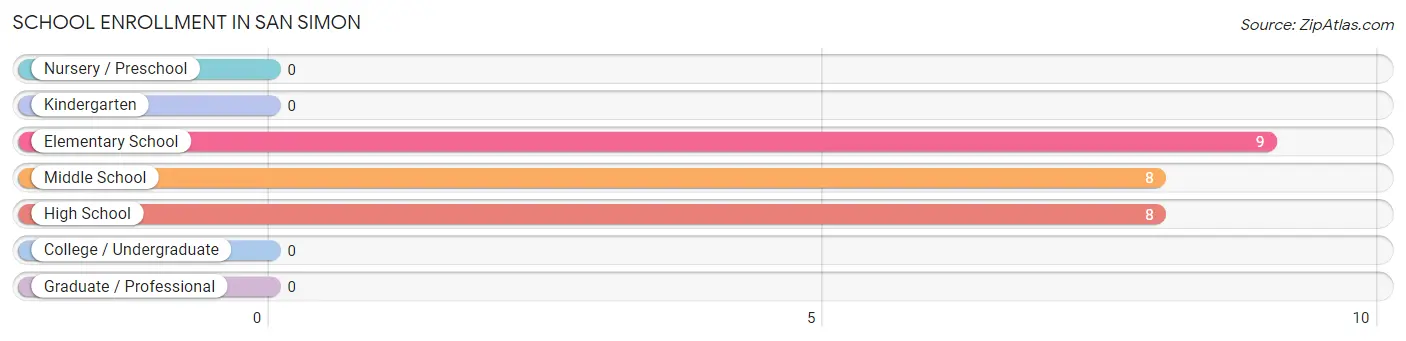
School Enrollment in San Simon
The most common levels of schooling among the 25 students in San Simon are elementary school (9 | 36.0%), middle school (8 | 32.0%), and high school (8 | 32.0%).
| School Level | # Students | % Students |
| Nursery / Preschool | 0 | 0.0% |
| Kindergarten | 0 | 0.0% |
| Elementary School | 9 | 36.0% |
| Middle School | 8 | 32.0% |
| High School | 8 | 32.0% |
| College / Undergraduate | 0 | 0.0% |
| Graduate / Professional | 0 | 0.0% |
| Total | 25 | 100.0% |
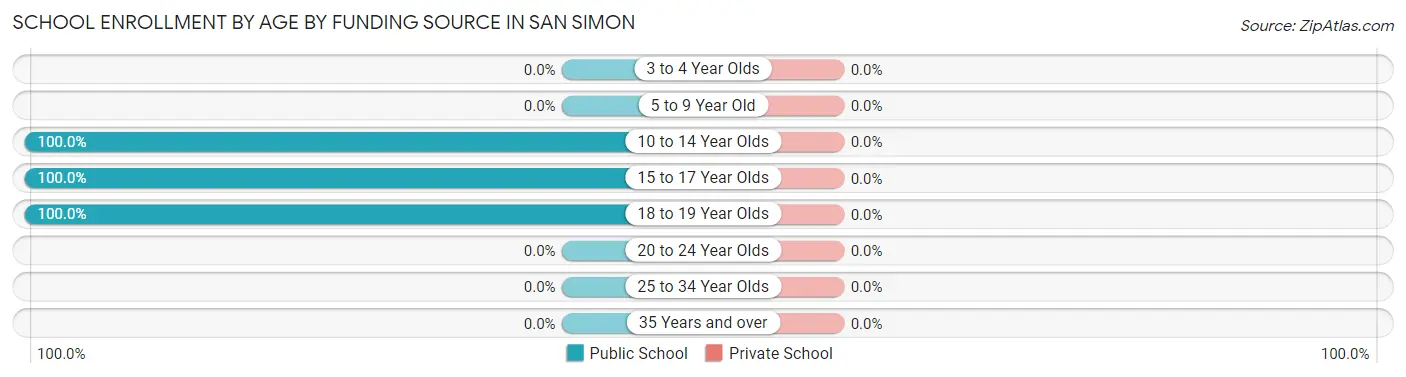
School Enrollment by Age by Funding Source in San Simon
| Age Bracket | Public School | Private School |
| 3 to 4 Year Olds | 0 (0.0%) | 0 (0.0%) |
| 5 to 9 Year Old | 0 (0.0%) | 0 (0.0%) |
| 10 to 14 Year Olds | 17 (100.0%) | 0 (0.0%) |
| 15 to 17 Year Olds | 7 (100.0%) | 0 (0.0%) |
| 18 to 19 Year Olds | 1 (100.0%) | 0 (0.0%) |
| 20 to 24 Year Olds | 0 (0.0%) | 0 (0.0%) |
| 25 to 34 Year Olds | 0 (0.0%) | 0 (0.0%) |
| 35 Years and over | 0 (0.0%) | 0 (0.0%) |
| Total | 25 (100.0%) | 0 (0.0%) |
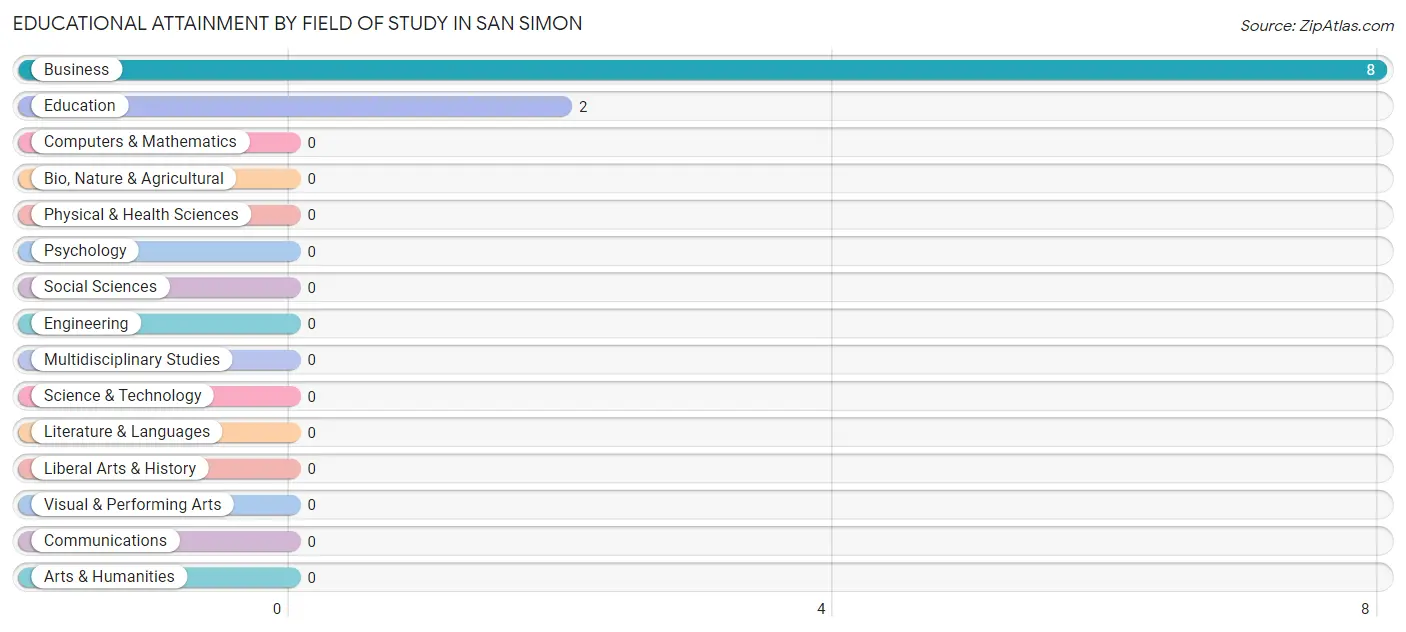
Educational Attainment by Field of Study in San Simon
Business (8 | 80.0%), and education (2 | 20.0%) are the most common fields of study among 10 individuals in San Simon who have obtained a bachelor's degree or higher.
| Field of Study | # Graduates | % Graduates |
| Computers & Mathematics | 0 | 0.0% |
| Bio, Nature & Agricultural | 0 | 0.0% |
| Physical & Health Sciences | 0 | 0.0% |
| Psychology | 0 | 0.0% |
| Social Sciences | 0 | 0.0% |
| Engineering | 0 | 0.0% |
| Multidisciplinary Studies | 0 | 0.0% |
| Science & Technology | 0 | 0.0% |
| Business | 8 | 80.0% |
| Education | 2 | 20.0% |
| Literature & Languages | 0 | 0.0% |
| Liberal Arts & History | 0 | 0.0% |
| Visual & Performing Arts | 0 | 0.0% |
| Communications | 0 | 0.0% |
| Arts & Humanities | 0 | 0.0% |
| Total | 10 | 100.0% |
Transportation & Commute in San Simon
Vehicle Availability by Sex in San Simon
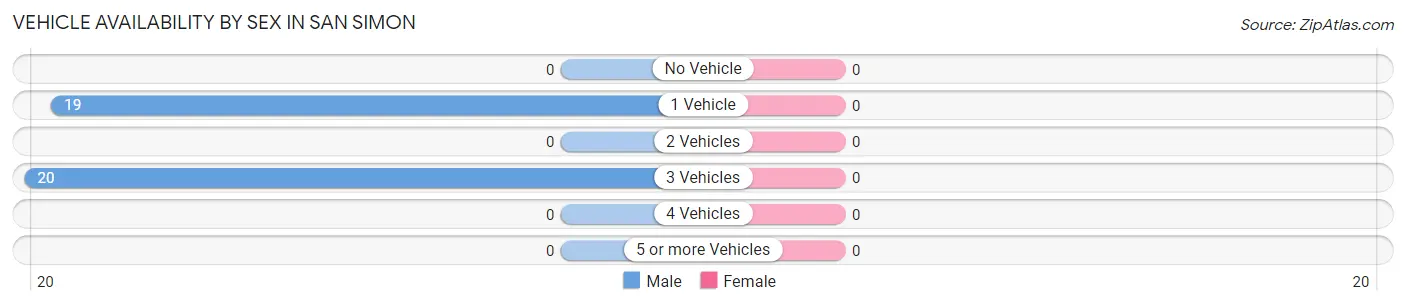
| Vehicles Available | Male | Female |
| No Vehicle | 0 (0.0%) | 0 (0.0%) |
| 1 Vehicle | 19 (48.7%) | 0 (0.0%) |
| 2 Vehicles | 0 (0.0%) | 0 (0.0%) |
| 3 Vehicles | 20 (51.3%) | 0 (0.0%) |
| 4 Vehicles | 0 (0.0%) | 0 (0.0%) |
| 5 or more Vehicles | 0 (0.0%) | 0 (0.0%) |
| Total | 39 (100.0%) | 0 (0.0%) |
Commute Time in San Simon
The most frequently occuring commute durations in San Simon are 20 to 24 minutes (11 commuters, 28.2%), 60 to 89 minutes (10 commuters, 25.6%), and 45 to 59 minutes (8 commuters, 20.5%).
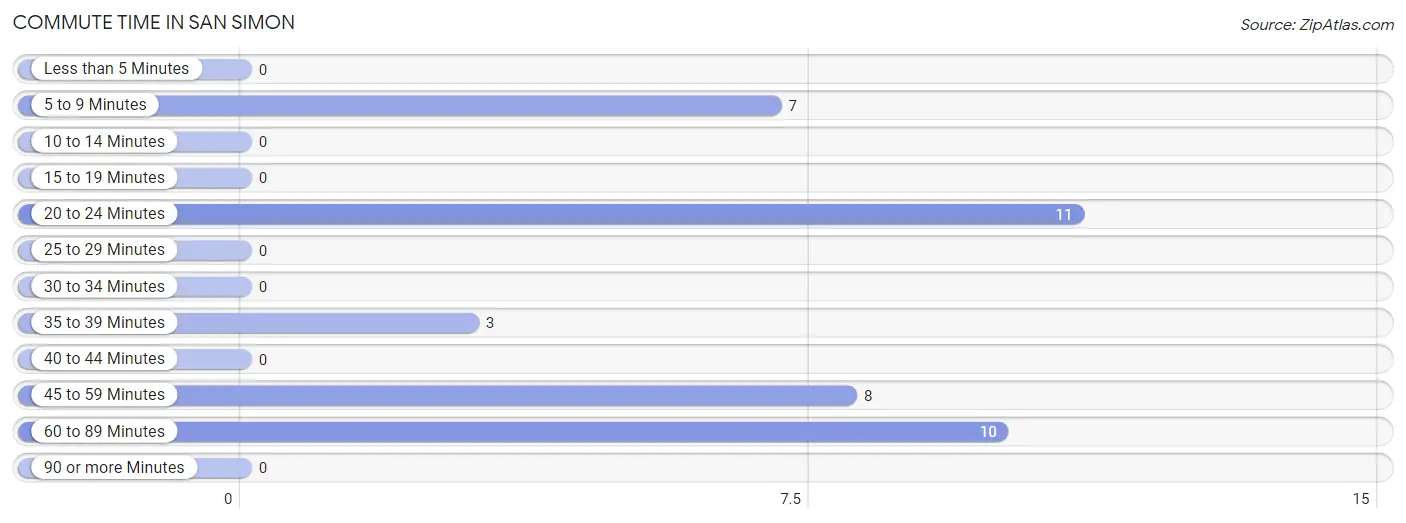
| Commute Time | # Commuters | % Commuters |
| Less than 5 Minutes | 0 | 0.0% |
| 5 to 9 Minutes | 7 | 17.9% |
| 10 to 14 Minutes | 0 | 0.0% |
| 15 to 19 Minutes | 0 | 0.0% |
| 20 to 24 Minutes | 11 | 28.2% |
| 25 to 29 Minutes | 0 | 0.0% |
| 30 to 34 Minutes | 0 | 0.0% |
| 35 to 39 Minutes | 3 | 7.7% |
| 40 to 44 Minutes | 0 | 0.0% |
| 45 to 59 Minutes | 8 | 20.5% |
| 60 to 89 Minutes | 10 | 25.6% |
| 90 or more Minutes | 0 | 0.0% |
Commute Time by Sex in San Simon
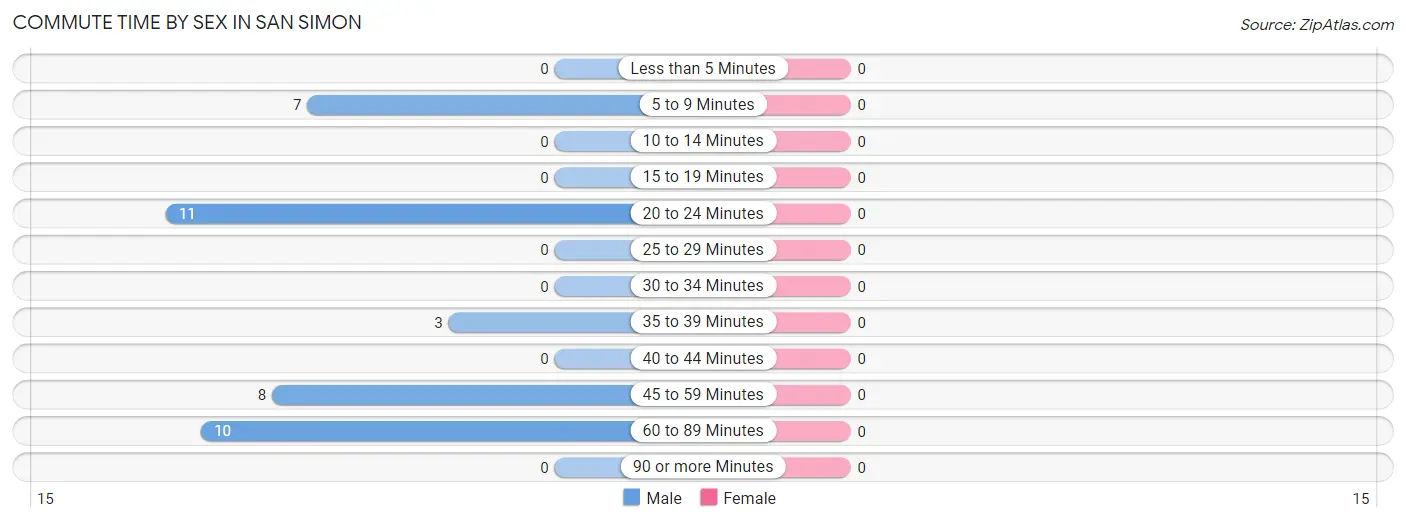
| Commute Time | Male | Female |
| Less than 5 Minutes | 0 (0.0%) | 0 (0.0%) |
| 5 to 9 Minutes | 7 (17.9%) | 0 (0.0%) |
| 10 to 14 Minutes | 0 (0.0%) | 0 (0.0%) |
| 15 to 19 Minutes | 0 (0.0%) | 0 (0.0%) |
| 20 to 24 Minutes | 11 (28.2%) | 0 (0.0%) |
| 25 to 29 Minutes | 0 (0.0%) | 0 (0.0%) |
| 30 to 34 Minutes | 0 (0.0%) | 0 (0.0%) |
| 35 to 39 Minutes | 3 (7.7%) | 0 (0.0%) |
| 40 to 44 Minutes | 0 (0.0%) | 0 (0.0%) |
| 45 to 59 Minutes | 8 (20.5%) | 0 (0.0%) |
| 60 to 89 Minutes | 10 (25.6%) | 0 (0.0%) |
| 90 or more Minutes | 0 (0.0%) | 0 (0.0%) |
Time of Departure to Work by Sex in San Simon
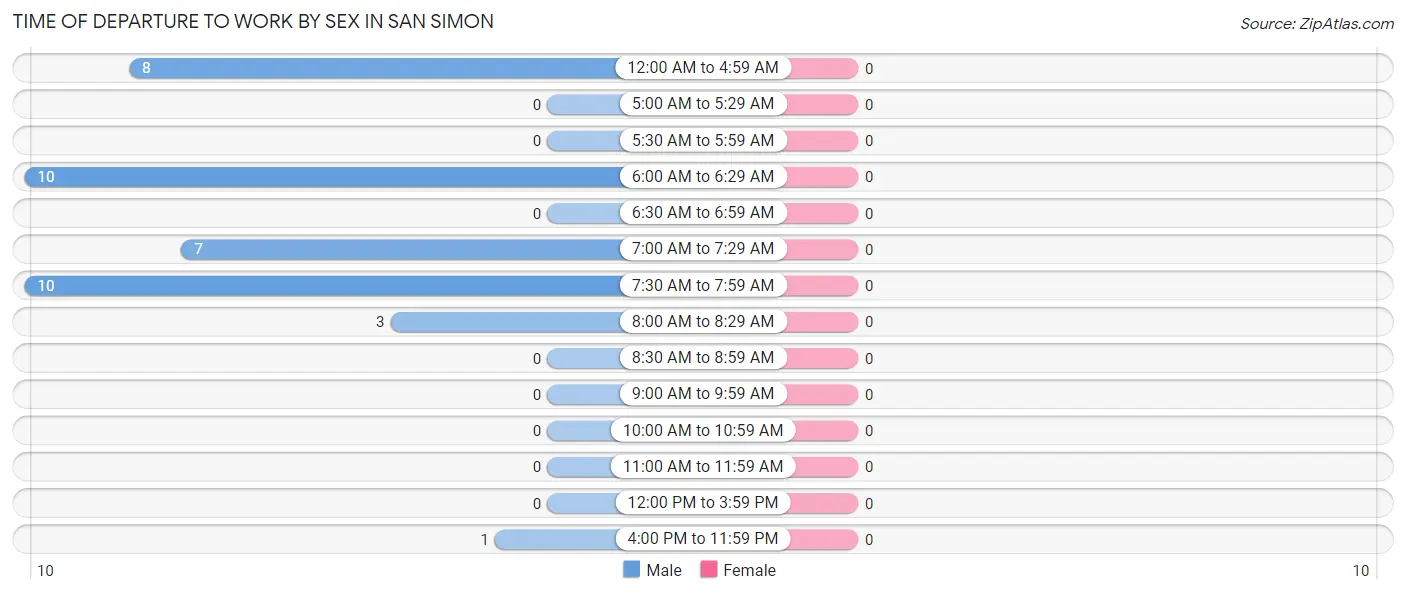
| Time of Departure | Male | Female |
| 12:00 AM to 4:59 AM | 8 (20.5%) | 0 (0.0%) |
| 5:00 AM to 5:29 AM | 0 (0.0%) | 0 (0.0%) |
| 5:30 AM to 5:59 AM | 0 (0.0%) | 0 (0.0%) |
| 6:00 AM to 6:29 AM | 10 (25.6%) | 0 (0.0%) |
| 6:30 AM to 6:59 AM | 0 (0.0%) | 0 (0.0%) |
| 7:00 AM to 7:29 AM | 7 (17.9%) | 0 (0.0%) |
| 7:30 AM to 7:59 AM | 10 (25.6%) | 0 (0.0%) |
| 8:00 AM to 8:29 AM | 3 (7.7%) | 0 (0.0%) |
| 8:30 AM to 8:59 AM | 0 (0.0%) | 0 (0.0%) |
| 9:00 AM to 9:59 AM | 0 (0.0%) | 0 (0.0%) |
| 10:00 AM to 10:59 AM | 0 (0.0%) | 0 (0.0%) |
| 11:00 AM to 11:59 AM | 0 (0.0%) | 0 (0.0%) |
| 12:00 PM to 3:59 PM | 0 (0.0%) | 0 (0.0%) |
| 4:00 PM to 11:59 PM | 1 (2.6%) | 0 (0.0%) |
| Total | 39 (100.0%) | 0 (0.0%) |
Housing Occupancy in San Simon
Occupancy by Ownership in San Simon
Of the total 116 dwellings in San Simon, owner-occupied units account for 81 (69.8%), while renter-occupied units make up 35 (30.2%).
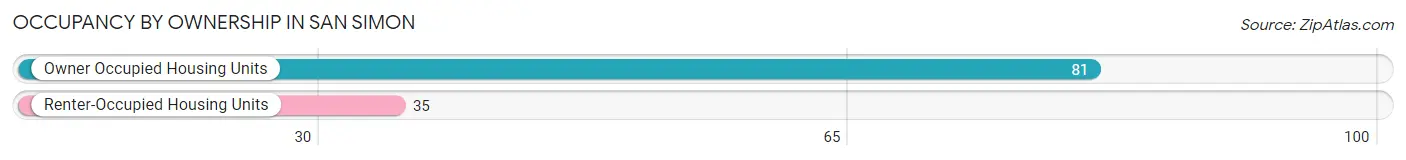
| Occupancy | # Housing Units | % Housing Units |
| Owner Occupied Housing Units | 81 | 69.8% |
| Renter-Occupied Housing Units | 35 | 30.2% |
| Total Occupied Housing Units | 116 | 100.0% |
Occupancy by Household Size in San Simon
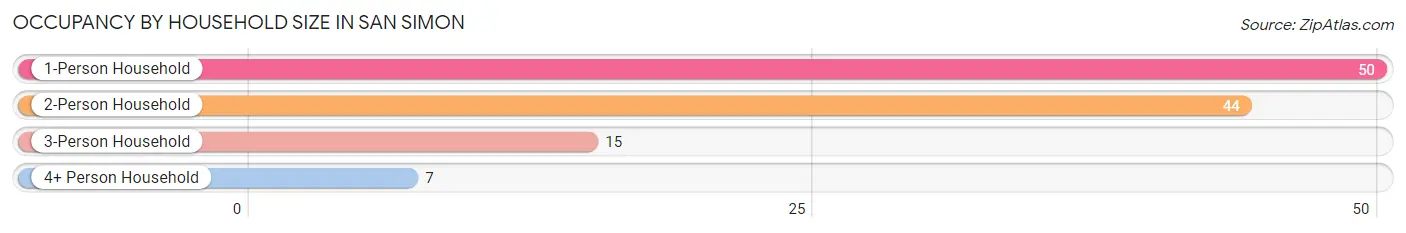
| Household Size | # Housing Units | % Housing Units |
| 1-Person Household | 50 | 43.1% |
| 2-Person Household | 44 | 37.9% |
| 3-Person Household | 15 | 12.9% |
| 4+ Person Household | 7 | 6.0% |
| Total Housing Units | 116 | 100.0% |
Occupancy by Ownership by Household Size in San Simon
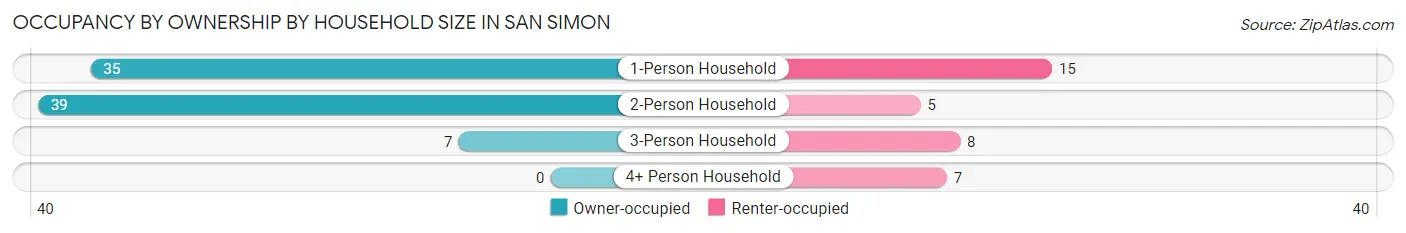
| Household Size | Owner-occupied | Renter-occupied |
| 1-Person Household | 35 (70.0%) | 15 (30.0%) |
| 2-Person Household | 39 (88.6%) | 5 (11.4%) |
| 3-Person Household | 7 (46.7%) | 8 (53.3%) |
| 4+ Person Household | 0 (0.0%) | 7 (100.0%) |
| Total Housing Units | 81 (69.8%) | 35 (30.2%) |
Occupancy by Educational Attainment in San Simon
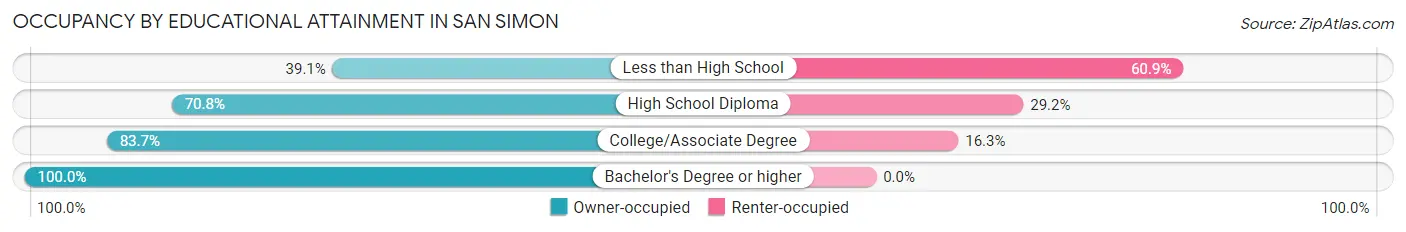
| Household Size | Owner-occupied | Renter-occupied |
| Less than High School | 9 (39.1%) | 14 (60.9%) |
| High School Diploma | 34 (70.8%) | 14 (29.2%) |
| College/Associate Degree | 36 (83.7%) | 7 (16.3%) |
| Bachelor's Degree or higher | 2 (100.0%) | 0 (0.0%) |
Occupancy by Age of Householder in San Simon
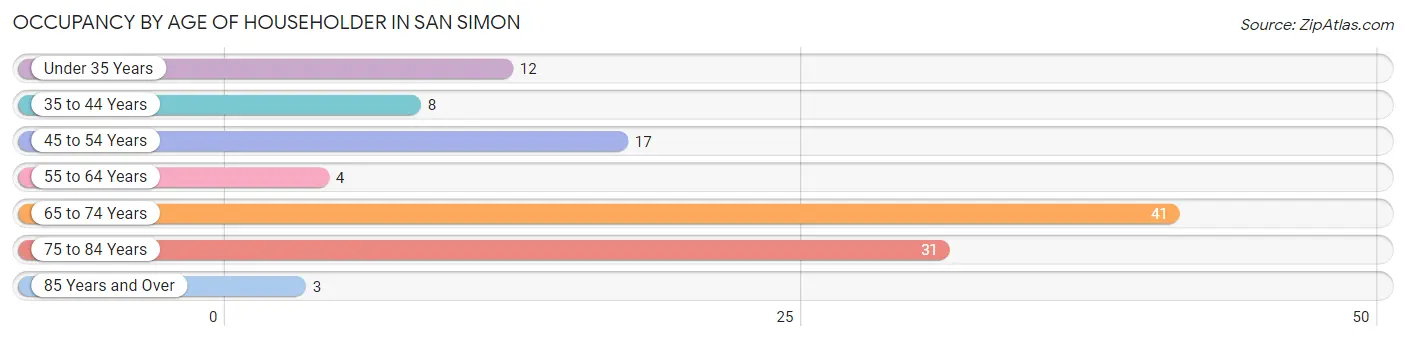
| Age Bracket | # Households | % Households |
| Under 35 Years | 12 | 10.3% |
| 35 to 44 Years | 8 | 6.9% |
| 45 to 54 Years | 17 | 14.7% |
| 55 to 64 Years | 4 | 3.5% |
| 65 to 74 Years | 41 | 35.3% |
| 75 to 84 Years | 31 | 26.7% |
| 85 Years and Over | 3 | 2.6% |
| Total | 116 | 100.0% |
Housing Finances in San Simon
Median Income by Occupancy in San Simon
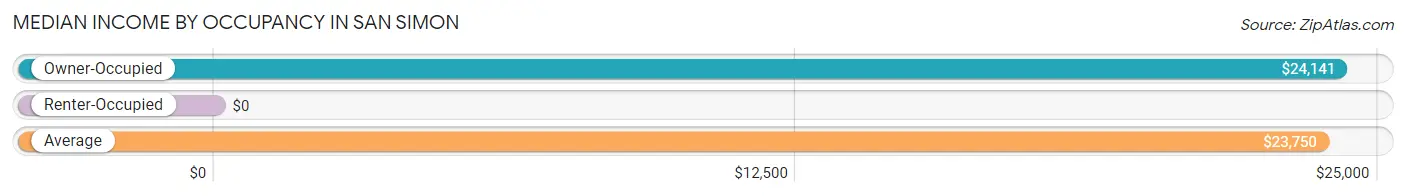
| Occupancy Type | # Households | Median Income |
| Owner-Occupied | 81 (69.8%) | $24,141 |
| Renter-Occupied | 35 (30.2%) | $0 |
| Average | 116 (100.0%) | $23,750 |
Occupancy by Householder Income Bracket in San Simon
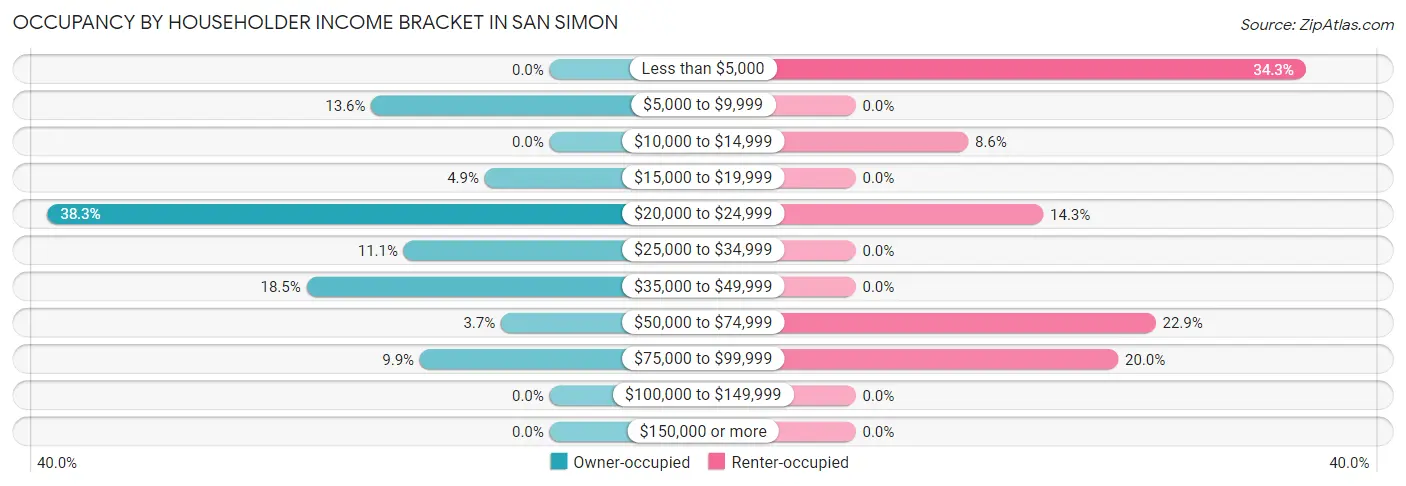
| Income Bracket | Owner-occupied | Renter-occupied |
| Less than $5,000 | 0 (0.0%) | 12 (34.3%) |
| $5,000 to $9,999 | 11 (13.6%) | 0 (0.0%) |
| $10,000 to $14,999 | 0 (0.0%) | 3 (8.6%) |
| $15,000 to $19,999 | 4 (4.9%) | 0 (0.0%) |
| $20,000 to $24,999 | 31 (38.3%) | 5 (14.3%) |
| $25,000 to $34,999 | 9 (11.1%) | 0 (0.0%) |
| $35,000 to $49,999 | 15 (18.5%) | 0 (0.0%) |
| $50,000 to $74,999 | 3 (3.7%) | 8 (22.9%) |
| $75,000 to $99,999 | 8 (9.9%) | 7 (20.0%) |
| $100,000 to $149,999 | 0 (0.0%) | 0 (0.0%) |
| $150,000 or more | 0 (0.0%) | 0 (0.0%) |
| Total | 81 (100.0%) | 35 (100.0%) |
Monthly Housing Cost Tiers in San Simon
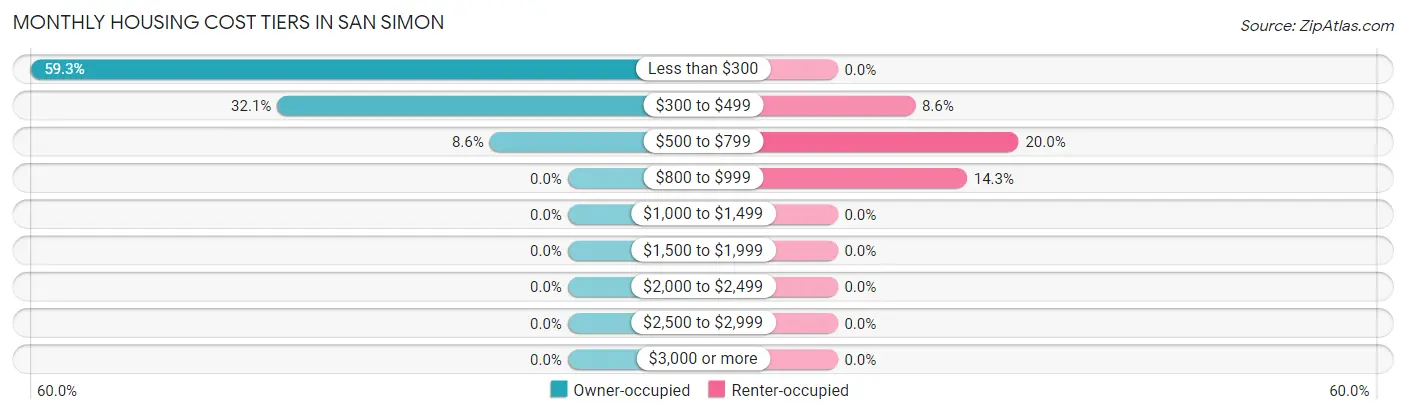
| Monthly Cost | Owner-occupied | Renter-occupied |
| Less than $300 | 48 (59.3%) | 0 (0.0%) |
| $300 to $499 | 26 (32.1%) | 3 (8.6%) |
| $500 to $799 | 7 (8.6%) | 7 (20.0%) |
| $800 to $999 | 0 (0.0%) | 5 (14.3%) |
| $1,000 to $1,499 | 0 (0.0%) | 0 (0.0%) |
| $1,500 to $1,999 | 0 (0.0%) | 0 (0.0%) |
| $2,000 to $2,499 | 0 (0.0%) | 0 (0.0%) |
| $2,500 to $2,999 | 0 (0.0%) | 0 (0.0%) |
| $3,000 or more | 0 (0.0%) | 0 (0.0%) |
| Total | 81 (100.0%) | 35 (100.0%) |
Physical Housing Characteristics in San Simon
Housing Structures in San Simon
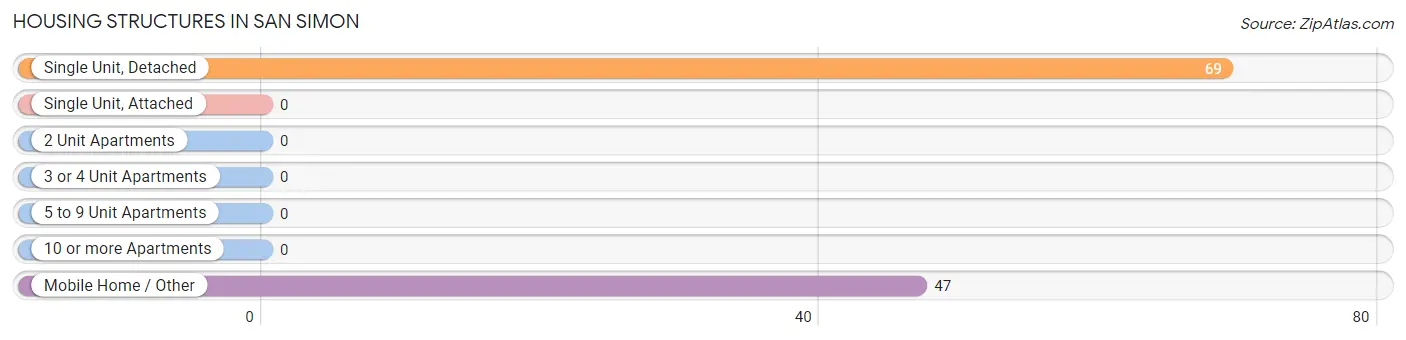
| Structure Type | # Housing Units | % Housing Units |
| Single Unit, Detached | 69 | 59.5% |
| Single Unit, Attached | 0 | 0.0% |
| 2 Unit Apartments | 0 | 0.0% |
| 3 or 4 Unit Apartments | 0 | 0.0% |
| 5 to 9 Unit Apartments | 0 | 0.0% |
| 10 or more Apartments | 0 | 0.0% |
| Mobile Home / Other | 47 | 40.5% |
| Total | 116 | 100.0% |
Housing Structures by Occupancy in San Simon
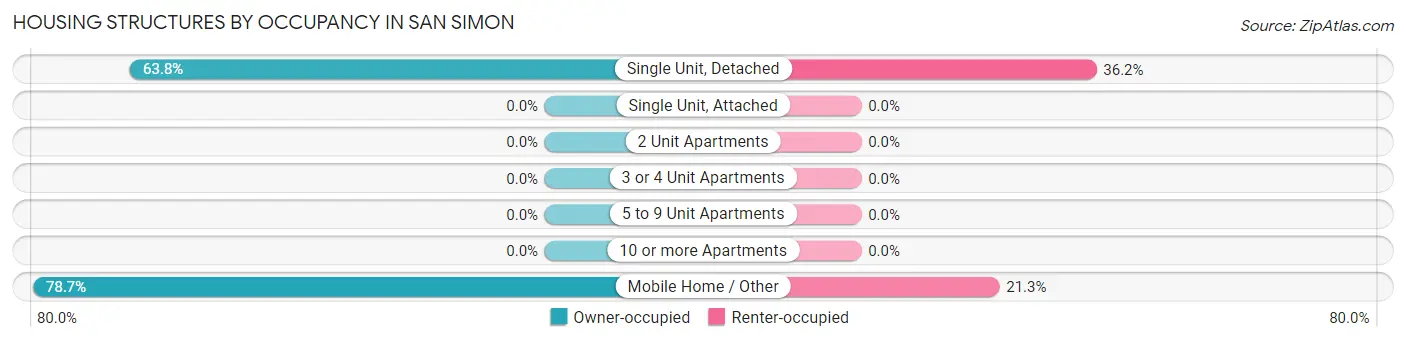
| Structure Type | Owner-occupied | Renter-occupied |
| Single Unit, Detached | 44 (63.8%) | 25 (36.2%) |
| Single Unit, Attached | 0 (0.0%) | 0 (0.0%) |
| 2 Unit Apartments | 0 (0.0%) | 0 (0.0%) |
| 3 or 4 Unit Apartments | 0 (0.0%) | 0 (0.0%) |
| 5 to 9 Unit Apartments | 0 (0.0%) | 0 (0.0%) |
| 10 or more Apartments | 0 (0.0%) | 0 (0.0%) |
| Mobile Home / Other | 37 (78.7%) | 10 (21.3%) |
| Total | 81 (69.8%) | 35 (30.2%) |
Housing Structures by Number of Rooms in San Simon
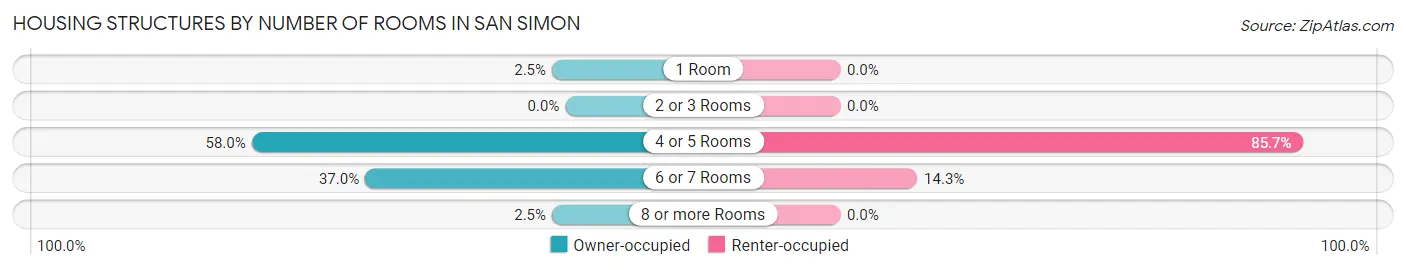
| Number of Rooms | Owner-occupied | Renter-occupied |
| 1 Room | 2 (2.5%) | 0 (0.0%) |
| 2 or 3 Rooms | 0 (0.0%) | 0 (0.0%) |
| 4 or 5 Rooms | 47 (58.0%) | 30 (85.7%) |
| 6 or 7 Rooms | 30 (37.0%) | 5 (14.3%) |
| 8 or more Rooms | 2 (2.5%) | 0 (0.0%) |
| Total | 81 (100.0%) | 35 (100.0%) |
Housing Structure by Heating Type in San Simon
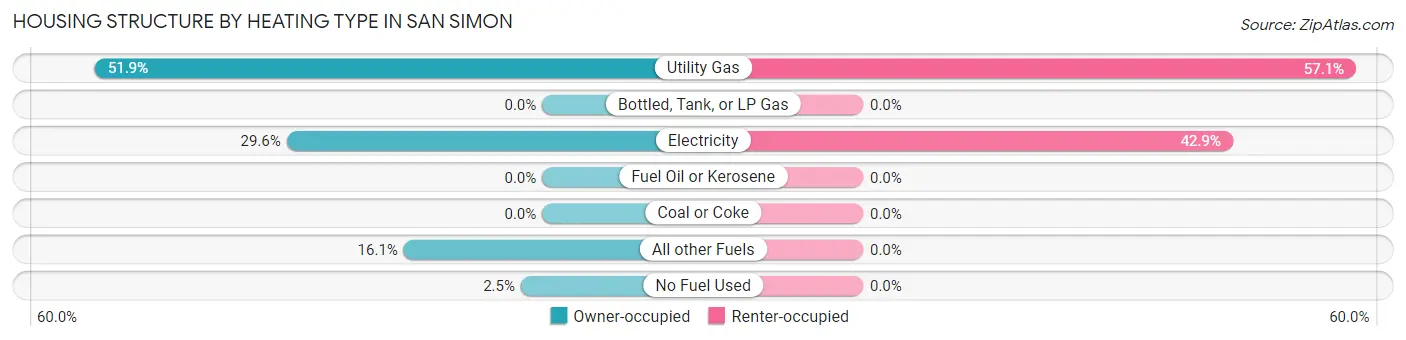
| Heating Type | Owner-occupied | Renter-occupied |
| Utility Gas | 42 (51.8%) | 20 (57.1%) |
| Bottled, Tank, or LP Gas | 0 (0.0%) | 0 (0.0%) |
| Electricity | 24 (29.6%) | 15 (42.9%) |
| Fuel Oil or Kerosene | 0 (0.0%) | 0 (0.0%) |
| Coal or Coke | 0 (0.0%) | 0 (0.0%) |
| All other Fuels | 13 (16.1%) | 0 (0.0%) |
| No Fuel Used | 2 (2.5%) | 0 (0.0%) |
| Total | 81 (100.0%) | 35 (100.0%) |
Household Vehicle Usage in San Simon
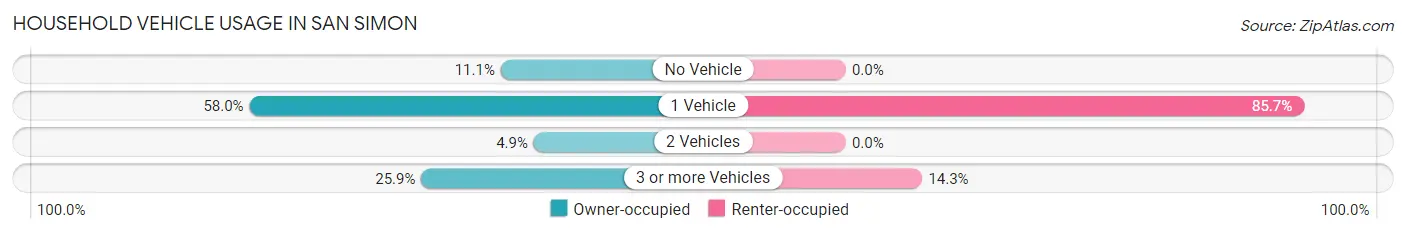
| Vehicles per Household | Owner-occupied | Renter-occupied |
| No Vehicle | 9 (11.1%) | 0 (0.0%) |
| 1 Vehicle | 47 (58.0%) | 30 (85.7%) |
| 2 Vehicles | 4 (4.9%) | 0 (0.0%) |
| 3 or more Vehicles | 21 (25.9%) | 5 (14.3%) |
| Total | 81 (100.0%) | 35 (100.0%) |
Real Estate & Mortgages in San Simon
Real Estate and Mortgage Overview in San Simon
| Characteristic | Without Mortgage | With Mortgage |
| Housing Units | 74 | 7 |
| Median Property Value | - | - |
| Median Household Income | $23,594 | $0 |
| Monthly Housing Costs | $268 | $0 |
| Real Estate Taxes | $283 | $0 |
Property Value by Mortgage Status in San Simon
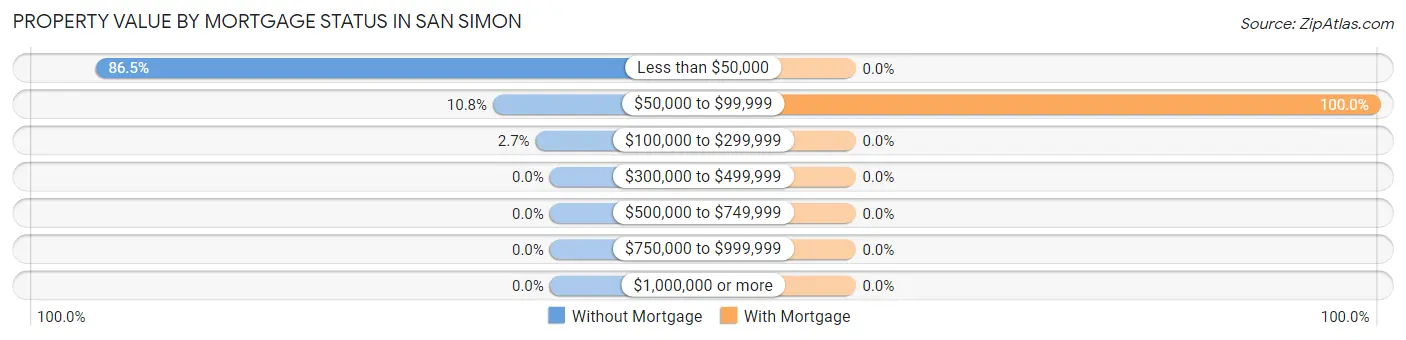
| Property Value | Without Mortgage | With Mortgage |
| Less than $50,000 | 64 (86.5%) | 0 (0.0%) |
| $50,000 to $99,999 | 8 (10.8%) | 7 (100.0%) |
| $100,000 to $299,999 | 2 (2.7%) | 0 (0.0%) |
| $300,000 to $499,999 | 0 (0.0%) | 0 (0.0%) |
| $500,000 to $749,999 | 0 (0.0%) | 0 (0.0%) |
| $750,000 to $999,999 | 0 (0.0%) | 0 (0.0%) |
| $1,000,000 or more | 0 (0.0%) | 0 (0.0%) |
| Total | 74 (100.0%) | 7 (100.0%) |
Household Income by Mortgage Status in San Simon
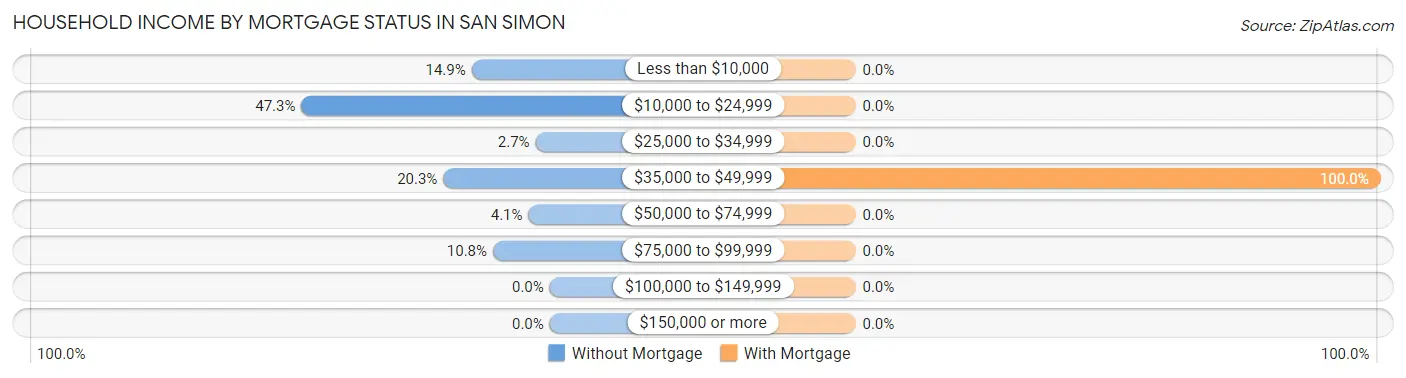
| Household Income | Without Mortgage | With Mortgage |
| Less than $10,000 | 11 (14.9%) | 0 (0.0%) |
| $10,000 to $24,999 | 35 (47.3%) | 0 (0.0%) |
| $25,000 to $34,999 | 2 (2.7%) | 0 (0.0%) |
| $35,000 to $49,999 | 15 (20.3%) | 7 (100.0%) |
| $50,000 to $74,999 | 3 (4.1%) | 0 (0.0%) |
| $75,000 to $99,999 | 8 (10.8%) | 0 (0.0%) |
| $100,000 to $149,999 | 0 (0.0%) | 0 (0.0%) |
| $150,000 or more | 0 (0.0%) | 0 (0.0%) |
| Total | 74 (100.0%) | 7 (100.0%) |
Property Value to Household Income Ratio in San Simon
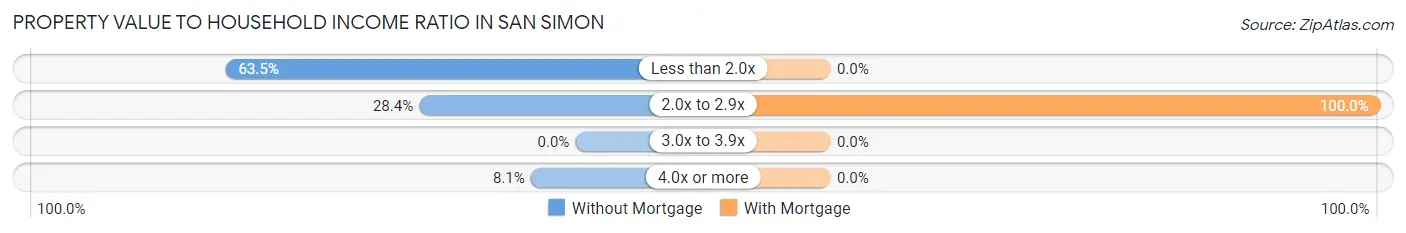
| Value-to-Income Ratio | Without Mortgage | With Mortgage |
| Less than 2.0x | 47 (63.5%) | 0 (0.0%) |
| 2.0x to 2.9x | 21 (28.4%) | 7 (100.0%) |
| 3.0x to 3.9x | 0 (0.0%) | 0 (0.0%) |
| 4.0x or more | 6 (8.1%) | 0 (0.0%) |
| Total | 74 (100.0%) | 7 (100.0%) |
Real Estate Taxes by Mortgage Status in San Simon
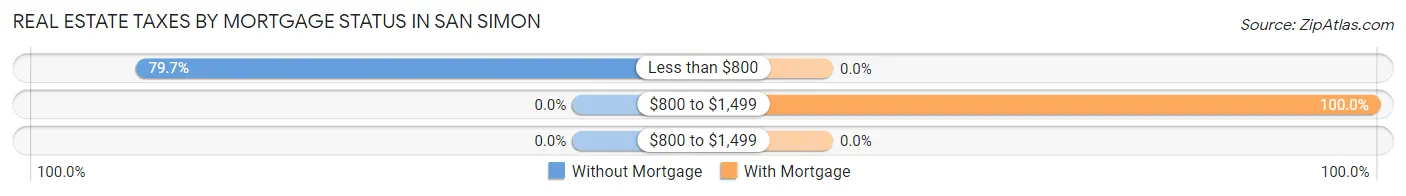
| Property Taxes | Without Mortgage | With Mortgage |
| Less than $800 | 59 (79.7%) | 0 (0.0%) |
| $800 to $1,499 | 0 (0.0%) | 7 (100.0%) |
| $800 to $1,499 | 0 (0.0%) | 0 (0.0%) |
| Total | 74 (100.0%) | 7 (100.0%) |
Health & Disability in San Simon
Health Insurance Coverage by Age in San Simon
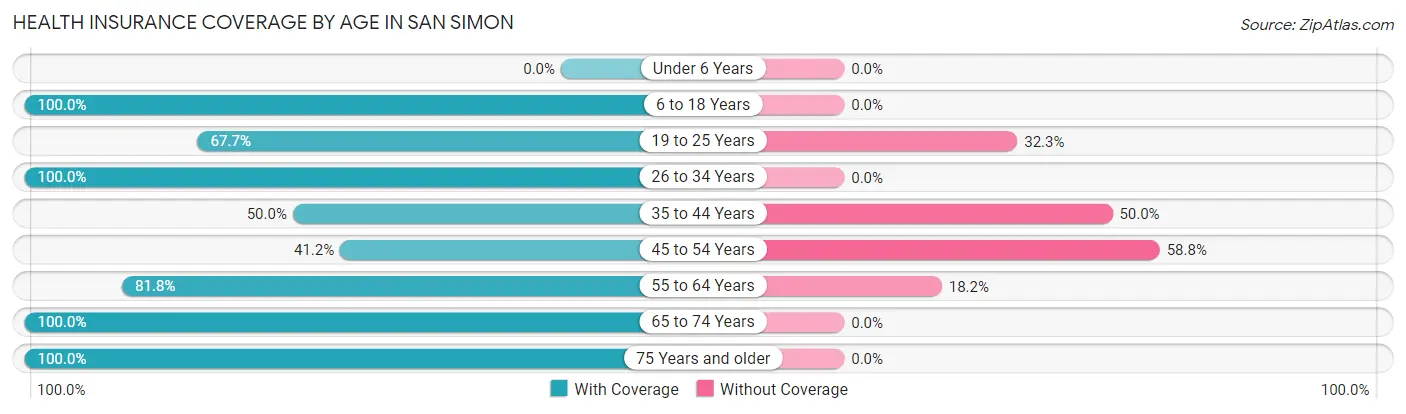
| Age Bracket | With Coverage | Without Coverage |
| Under 6 Years | 0 (0.0%) | 0 (0.0%) |
| 6 to 18 Years | 25 (100.0%) | 0 (0.0%) |
| 19 to 25 Years | 21 (67.7%) | 10 (32.3%) |
| 26 to 34 Years | 11 (100.0%) | 0 (0.0%) |
| 35 to 44 Years | 8 (50.0%) | 8 (50.0%) |
| 45 to 54 Years | 7 (41.2%) | 10 (58.8%) |
| 55 to 64 Years | 9 (81.8%) | 2 (18.2%) |
| 65 to 74 Years | 53 (100.0%) | 0 (0.0%) |
| 75 Years and older | 57 (100.0%) | 0 (0.0%) |
| Total | 191 (86.4%) | 30 (13.6%) |
Health Insurance Coverage by Citizenship Status in San Simon
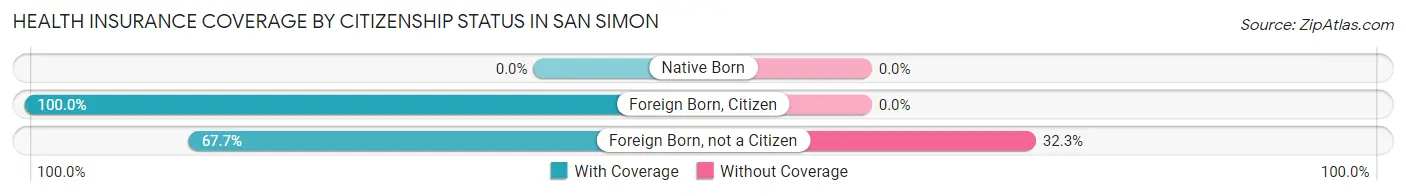
| Citizenship Status | With Coverage | Without Coverage |
| Native Born | 0 (0.0%) | 0 (0.0%) |
| Foreign Born, Citizen | 25 (100.0%) | 0 (0.0%) |
| Foreign Born, not a Citizen | 21 (67.7%) | 10 (32.3%) |
Health Insurance Coverage by Household Income in San Simon
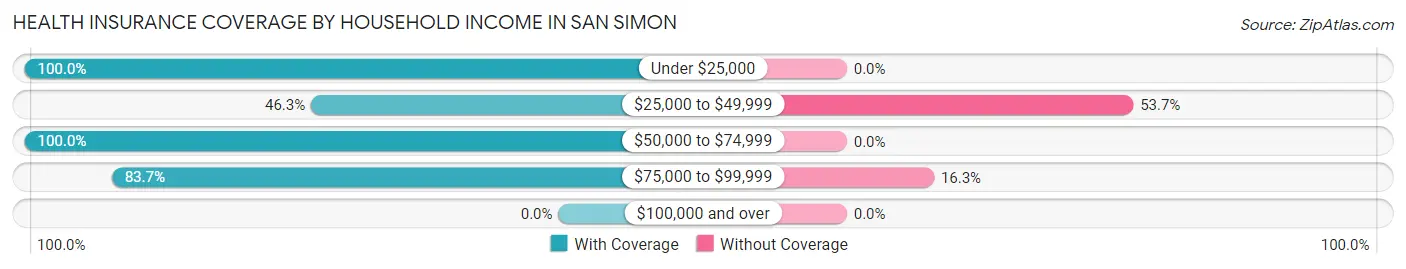
| Household Income | With Coverage | Without Coverage |
| Under $25,000 | 101 (100.0%) | 0 (0.0%) |
| $25,000 to $49,999 | 19 (46.3%) | 22 (53.7%) |
| $50,000 to $74,999 | 30 (100.0%) | 0 (0.0%) |
| $75,000 to $99,999 | 41 (83.7%) | 8 (16.3%) |
| $100,000 and over | 0 (0.0%) | 0 (0.0%) |
Public vs Private Health Insurance Coverage by Age in San Simon
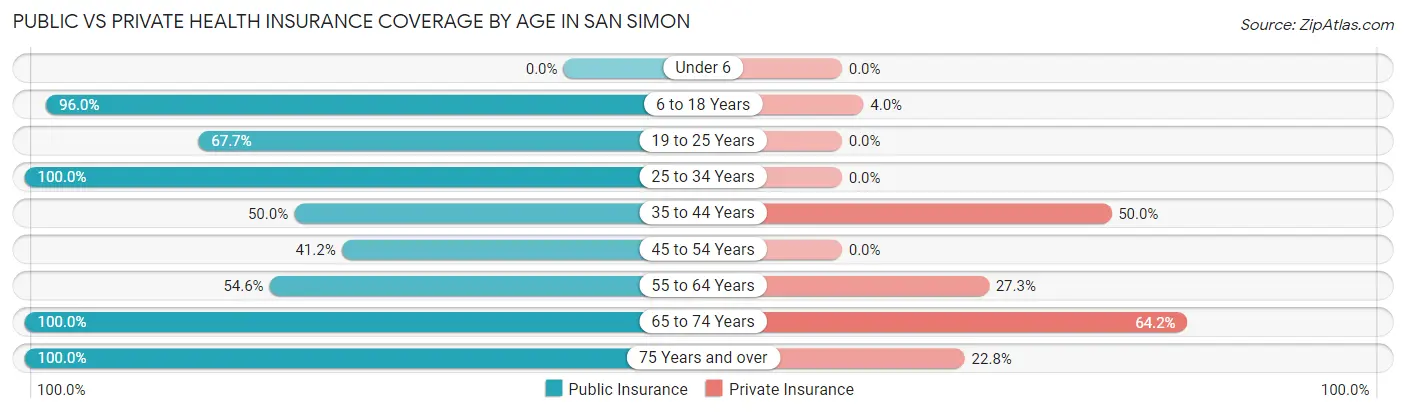
| Age Bracket | Public Insurance | Private Insurance |
| Under 6 | 0 (0.0%) | 0 (0.0%) |
| 6 to 18 Years | 24 (96.0%) | 1 (4.0%) |
| 19 to 25 Years | 21 (67.7%) | 0 (0.0%) |
| 25 to 34 Years | 11 (100.0%) | 0 (0.0%) |
| 35 to 44 Years | 8 (50.0%) | 8 (50.0%) |
| 45 to 54 Years | 7 (41.2%) | 0 (0.0%) |
| 55 to 64 Years | 6 (54.5%) | 3 (27.3%) |
| 65 to 74 Years | 53 (100.0%) | 34 (64.1%) |
| 75 Years and over | 57 (100.0%) | 13 (22.8%) |
| Total | 187 (84.6%) | 59 (26.7%) |
Disability Status by Sex by Age in San Simon
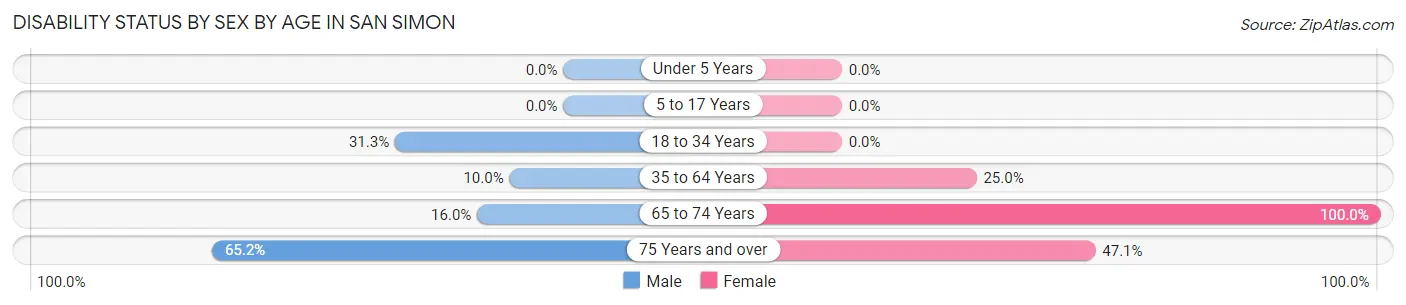
| Age Bracket | Male | Female |
| Under 5 Years | 0 (0.0%) | 0 (0.0%) |
| 5 to 17 Years | 0 (0.0%) | 0 (0.0%) |
| 18 to 34 Years | 10 (31.2%) | 0 (0.0%) |
| 35 to 64 Years | 2 (10.0%) | 6 (25.0%) |
| 65 to 74 Years | 4 (16.0%) | 28 (100.0%) |
| 75 Years and over | 15 (65.2%) | 16 (47.1%) |
Disability Class by Sex by Age in San Simon
Disability Class: Hearing Difficulty
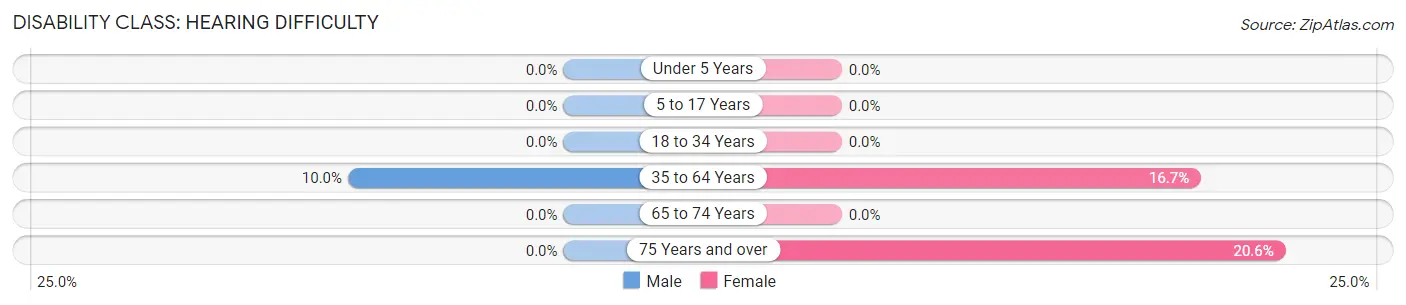
| Age Bracket | Male | Female |
| Under 5 Years | 0 (0.0%) | 0 (0.0%) |
| 5 to 17 Years | 0 (0.0%) | 0 (0.0%) |
| 18 to 34 Years | 0 (0.0%) | 0 (0.0%) |
| 35 to 64 Years | 2 (10.0%) | 4 (16.7%) |
| 65 to 74 Years | 0 (0.0%) | 0 (0.0%) |
| 75 Years and over | 0 (0.0%) | 7 (20.6%) |
Disability Class: Vision Difficulty
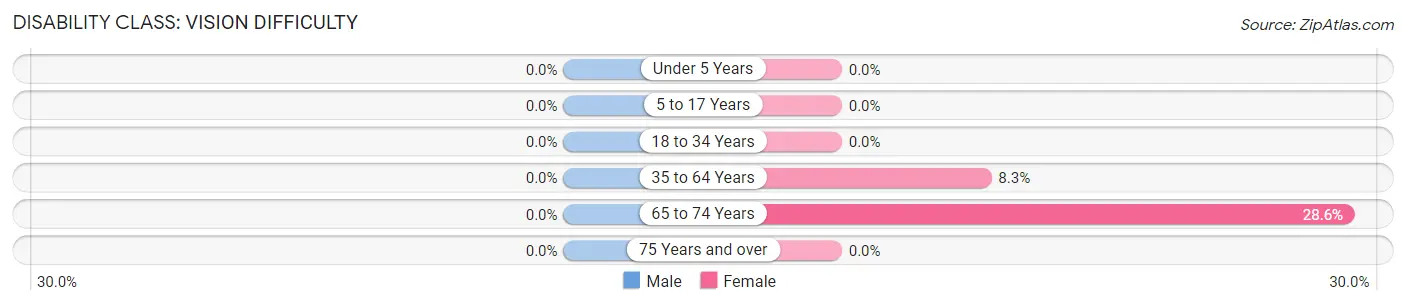
| Age Bracket | Male | Female |
| Under 5 Years | 0 (0.0%) | 0 (0.0%) |
| 5 to 17 Years | 0 (0.0%) | 0 (0.0%) |
| 18 to 34 Years | 0 (0.0%) | 0 (0.0%) |
| 35 to 64 Years | 0 (0.0%) | 2 (8.3%) |
| 65 to 74 Years | 0 (0.0%) | 8 (28.6%) |
| 75 Years and over | 0 (0.0%) | 0 (0.0%) |
Disability Class: Cognitive Difficulty
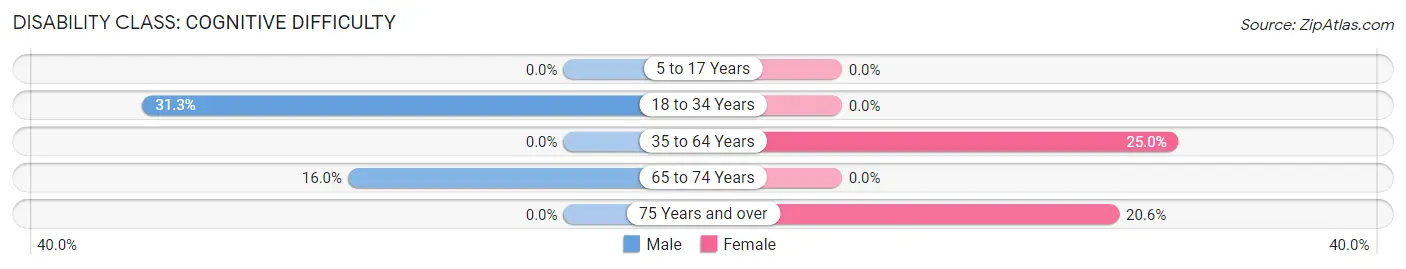
| Age Bracket | Male | Female |
| 5 to 17 Years | 0 (0.0%) | 0 (0.0%) |
| 18 to 34 Years | 10 (31.2%) | 0 (0.0%) |
| 35 to 64 Years | 0 (0.0%) | 6 (25.0%) |
| 65 to 74 Years | 4 (16.0%) | 0 (0.0%) |
| 75 Years and over | 0 (0.0%) | 7 (20.6%) |
Disability Class: Ambulatory Difficulty
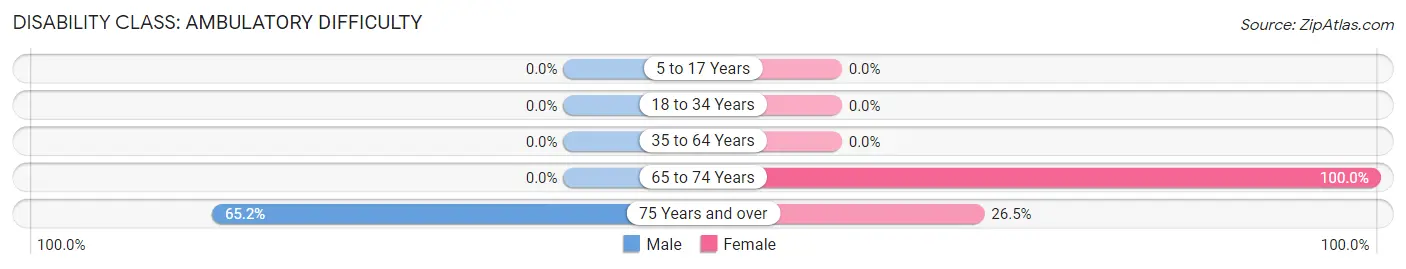
| Age Bracket | Male | Female |
| 5 to 17 Years | 0 (0.0%) | 0 (0.0%) |
| 18 to 34 Years | 0 (0.0%) | 0 (0.0%) |
| 35 to 64 Years | 0 (0.0%) | 0 (0.0%) |
| 65 to 74 Years | 0 (0.0%) | 28 (100.0%) |
| 75 Years and over | 15 (65.2%) | 9 (26.5%) |
Disability Class: Self-Care Difficulty
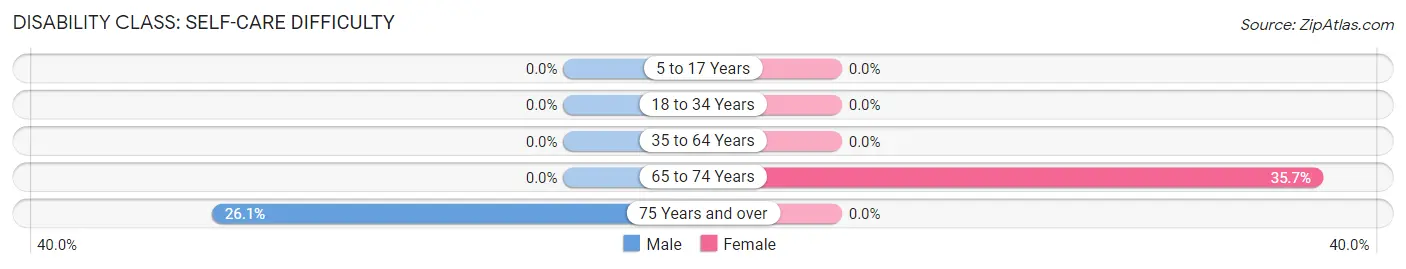
| Age Bracket | Male | Female |
| 5 to 17 Years | 0 (0.0%) | 0 (0.0%) |
| 18 to 34 Years | 0 (0.0%) | 0 (0.0%) |
| 35 to 64 Years | 0 (0.0%) | 0 (0.0%) |
| 65 to 74 Years | 0 (0.0%) | 10 (35.7%) |
| 75 Years and over | 6 (26.1%) | 0 (0.0%) |
Technology Access in San Simon
Computing Device Access in San Simon
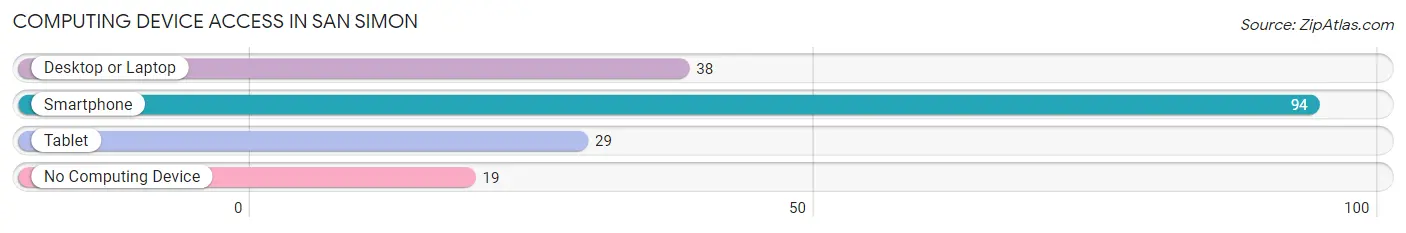
| Device Type | # Households | % Households |
| Desktop or Laptop | 38 | 32.8% |
| Smartphone | 94 | 81.0% |
| Tablet | 29 | 25.0% |
| No Computing Device | 19 | 16.4% |
| Total | 116 | 100.0% |
Internet Access in San Simon
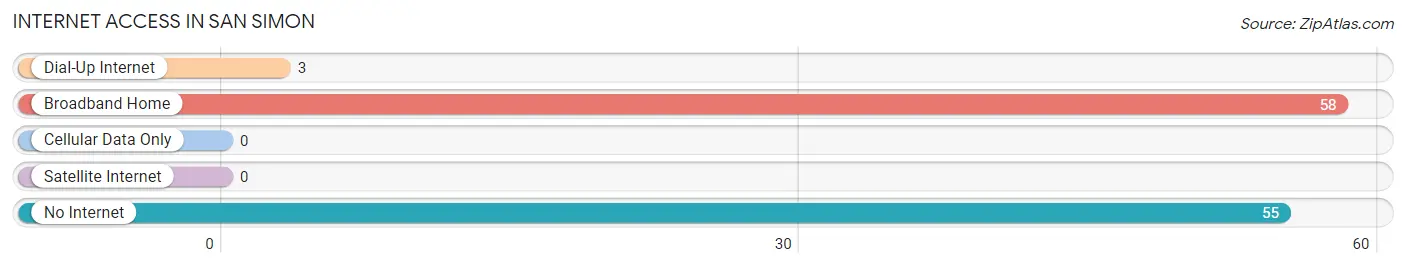
| Internet Type | # Households | % Households |
| Dial-Up Internet | 3 | 2.6% |
| Broadband Home | 58 | 50.0% |
| Cellular Data Only | 0 | 0.0% |
| Satellite Internet | 0 | 0.0% |
| No Internet | 55 | 47.4% |
| Total | 116 | 100.0% |
San Simon Summary
History
San Simon, Arizona is a small unincorporated community located in Cochise County, Arizona. It is situated along Interstate 10, approximately 40 miles east of the Arizona-New Mexico border. The town was founded in 1881 by a group of settlers from the nearby town of Tombstone. The settlers were looking for a place to settle and raise their families, and San Simon was the perfect spot.
The town was named after San Simon, a Catholic saint who was believed to have been born in the area. The town was originally a farming community, and the settlers grew cotton, corn, and other crops. The town also had a small general store, a post office, and a few other businesses.
In the early 1900s, the town began to grow and prosper. The railroad came to town in 1906, and the town became a stop on the Southern Pacific Railroad. This allowed the town to become a shipping center for the surrounding area. The town also had a school, a bank, and a few other businesses.
In the 1950s, the town began to decline. The railroad stopped running, and the town's population began to dwindle. By the 1970s, the town was nearly abandoned. In the 1980s, the town began to experience a resurgence. The town was revitalized by the construction of Interstate 10, which brought new businesses and residents to the area.
Today, San Simon is a small, quiet community. The town has a population of about 500 people, and the majority of the population is Hispanic. The town is home to a few small businesses, including a gas station, a grocery store, and a few restaurants.
Geography
San Simon is located in the southeastern corner of Cochise County, Arizona. It is situated along Interstate 10, approximately 40 miles east of the Arizona-New Mexico border. The town is located in the Chihuahuan Desert, and the terrain is mostly flat and dry. The town is surrounded by mountains, including the Chiricahua Mountains to the east and the Dragoon Mountains to the west.
The climate in San Simon is arid and semi-arid, with hot summers and mild winters. The average annual temperature is around 70 degrees Fahrenheit, and the average annual precipitation is around 10 inches.
Economy
The economy of San Simon is largely based on agriculture and tourism. The town is home to a few small businesses, including a gas station, a grocery store, and a few restaurants. The town also has a few tourist attractions, including the San Simon Valley Museum and the San Simon Wildlife Refuge.
The town is also home to a few small farms, which produce cotton, corn, and other crops. The town is also home to a few ranches, which raise cattle and other livestock.
Demographics
As of the 2010 census, the population of San Simon was 498. The racial makeup of the town was 94.4% Hispanic, 4.2% White, 0.2% Native American, and 0.2% Asian. The median household income was $25,000, and the median age was 33.
The town is home to a few small churches, including the San Simon Catholic Church and the San Simon Baptist Church. The town also has a few schools, including the San Simon Elementary School and the San Simon High School.
Common Questions
What is Per Capita Income in San Simon?
Per Capita income in San Simon is $18,457.
What is the Median Family Income in San Simon?
Median Family Income in San Simon is $43,654.
What is the Median Household income in San Simon?
Median Household Income in San Simon is $23,750.
What is Inequality or Gini Index in San Simon?
Inequality or Gini Index in San Simon is 0.42.
What is the Total Population of San Simon?
Total Population of San Simon is 221.
What is the Total Male Population of San Simon?
Total Male Population of San Simon is 117.
What is the Total Female Population of San Simon?
Total Female Population of San Simon is 104.
What is the Ratio of Males per 100 Females in San Simon?
There are 112.50 Males per 100 Females in San Simon.
What is the Ratio of Females per 100 Males in San Simon?
There are 88.89 Females per 100 Males in San Simon.
What is the Median Population Age in San Simon?
Median Population Age in San Simon is 64.8 Years.
What is the Average Family Size in San Simon
Average Family Size in San Simon is 2.5 People.
What is the Average Household Size in San Simon
Average Household Size in San Simon is 1.9 People.
How Large is the Labor Force in San Simon?
There are 66 People in the Labor Forcein in San Simon.
What is the Percentage of People in the Labor Force in San Simon?
33.5% of People are in the Labor Force in San Simon.
What is the Unemployment Rate in San Simon?
Unemployment Rate in San Simon is 24.2%.