San Luis, AZ Map & Demographics
San Luis Map
San Luis Overview
$16,690
PER CAPITA INCOME
$46,560
AVG FAMILY INCOME
$46,747
AVG HOUSEHOLD INCOME
20.4%
WAGE / INCOME GAP [ % ]
79.6¢/ $1
WAGE / INCOME GAP [ $ ]
$13,381
FAMILY INCOME DEFICIT
0.45
INEQUALITY / GINI INDEX
35,189
TOTAL POPULATION
18,797
MALE POPULATION
16,392
FEMALE POPULATION
114.67
MALES / 100 FEMALES
87.21
FEMALES / 100 MALES
31.6
MEDIAN AGE
3.8
AVG FAMILY SIZE
3.6
AVG HOUSEHOLD SIZE
13,175
LABOR FORCE [ PEOPLE ]
50.4%
PERCENT IN LABOR FORCE
10.1%
UNEMPLOYMENT RATE
San Luis Area Codes
Income in San Luis
Income Overview in San Luis
Per Capita Income in San Luis is $16,690, while median incomes of families and households are $46,560 and $46,747 respectively.
| Characteristic | Number | Measure |
| Per Capita Income | 35,189 | $16,690 |
| Median Family Income | 7,907 | $46,560 |
| Mean Family Income | 7,907 | $61,066 |
| Median Household Income | 8,846 | $46,747 |
| Mean Household Income | 8,846 | $62,109 |
| Income Deficit | 7,907 | $13,381 |
| Wage / Income Gap (%) | 35,189 | 20.42% |
| Wage / Income Gap ($) | 35,189 | 79.58¢ per $1 |
| Gini / Inequality Index | 35,189 | 0.45 |
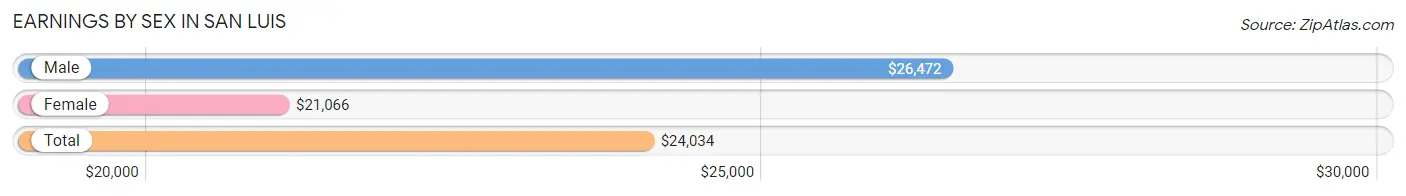
Earnings by Sex in San Luis
Average Earnings in San Luis are $24,034, $26,472 for men and $21,066 for women, a difference of 20.4%.
| Sex | Number | Average Earnings |
| Male | 9,655 (59.2%) | $26,472 |
| Female | 6,644 (40.8%) | $21,066 |
| Total | 16,299 (100.0%) | $24,034 |
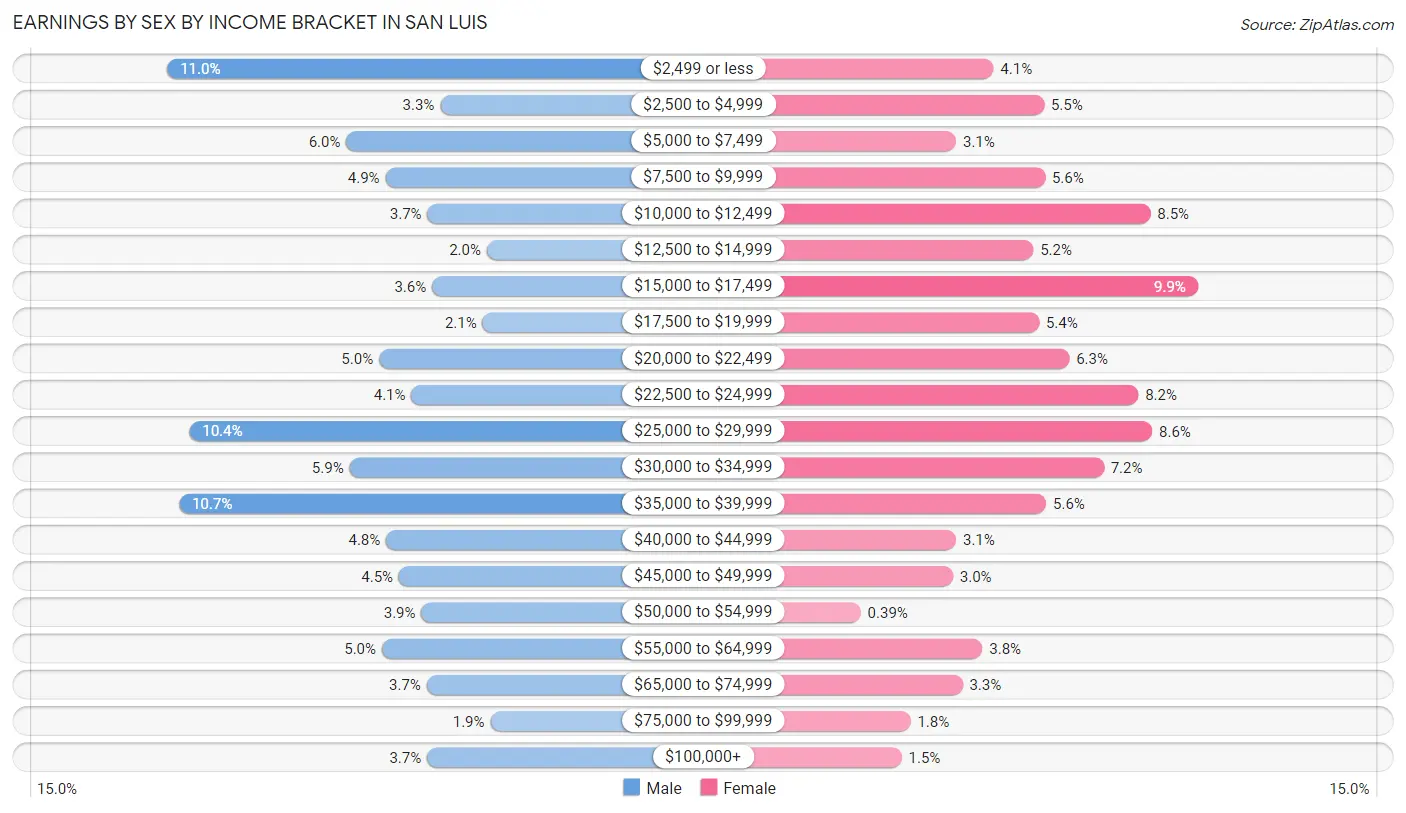
Earnings by Sex by Income Bracket in San Luis
The most common earnings brackets in San Luis are $2,499 or less for men (1,061 | 11.0%) and $15,000 to $17,499 for women (655 | 9.9%).
| Income | Male | Female |
| $2,499 or less | 1,061 (11.0%) | 274 (4.1%) |
| $2,500 to $4,999 | 321 (3.3%) | 368 (5.5%) |
| $5,000 to $7,499 | 575 (6.0%) | 204 (3.1%) |
| $7,500 to $9,999 | 469 (4.9%) | 370 (5.6%) |
| $10,000 to $12,499 | 355 (3.7%) | 567 (8.5%) |
| $12,500 to $14,999 | 194 (2.0%) | 348 (5.2%) |
| $15,000 to $17,499 | 343 (3.5%) | 655 (9.9%) |
| $17,500 to $19,999 | 206 (2.1%) | 359 (5.4%) |
| $20,000 to $22,499 | 487 (5.0%) | 415 (6.2%) |
| $22,500 to $24,999 | 399 (4.1%) | 544 (8.2%) |
| $25,000 to $29,999 | 1,001 (10.4%) | 570 (8.6%) |
| $30,000 to $34,999 | 567 (5.9%) | 480 (7.2%) |
| $35,000 to $39,999 | 1,029 (10.7%) | 372 (5.6%) |
| $40,000 to $44,999 | 467 (4.8%) | 204 (3.1%) |
| $45,000 to $49,999 | 433 (4.5%) | 198 (3.0%) |
| $50,000 to $54,999 | 372 (3.8%) | 26 (0.4%) |
| $55,000 to $64,999 | 479 (5.0%) | 253 (3.8%) |
| $65,000 to $74,999 | 357 (3.7%) | 216 (3.3%) |
| $75,000 to $99,999 | 184 (1.9%) | 119 (1.8%) |
| $100,000+ | 356 (3.7%) | 102 (1.5%) |
| Total | 9,655 (100.0%) | 6,644 (100.0%) |
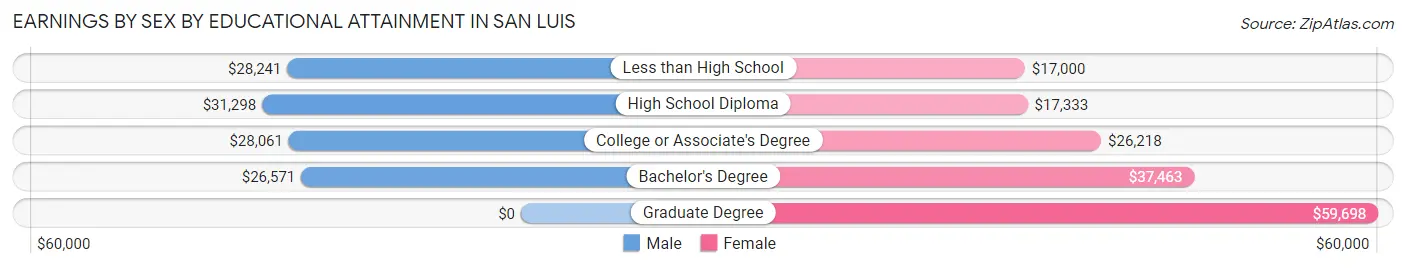
Earnings by Sex by Educational Attainment in San Luis
Average earnings in San Luis are $28,358 for men and $21,744 for women, a difference of 23.3%. Men with an educational attainment of high school diploma enjoy the highest average annual earnings of $31,298, while those with bachelor's degree education earn the least with $26,571. Women with an educational attainment of graduate degree earn the most with the average annual earnings of $59,698, while those with less than high school education have the smallest earnings of $17,000.
| Educational Attainment | Male Income | Female Income |
| Less than High School | $28,241 | $17,000 |
| High School Diploma | $31,298 | $17,333 |
| College or Associate's Degree | $28,061 | $26,218 |
| Bachelor's Degree | $26,571 | $37,463 |
| Graduate Degree | - | - |
| Total | $28,358 | $21,744 |
Family Income in San Luis
Family Income Brackets in San Luis
According to the San Luis family income data, there are 1,795 families falling into the $50,000 to $74,999 income range, which is the most common income bracket and makes up 22.7% of all families. Conversely, the $200,000+ income bracket is the least frequent group with only 119 families (1.5%) belonging to this category.
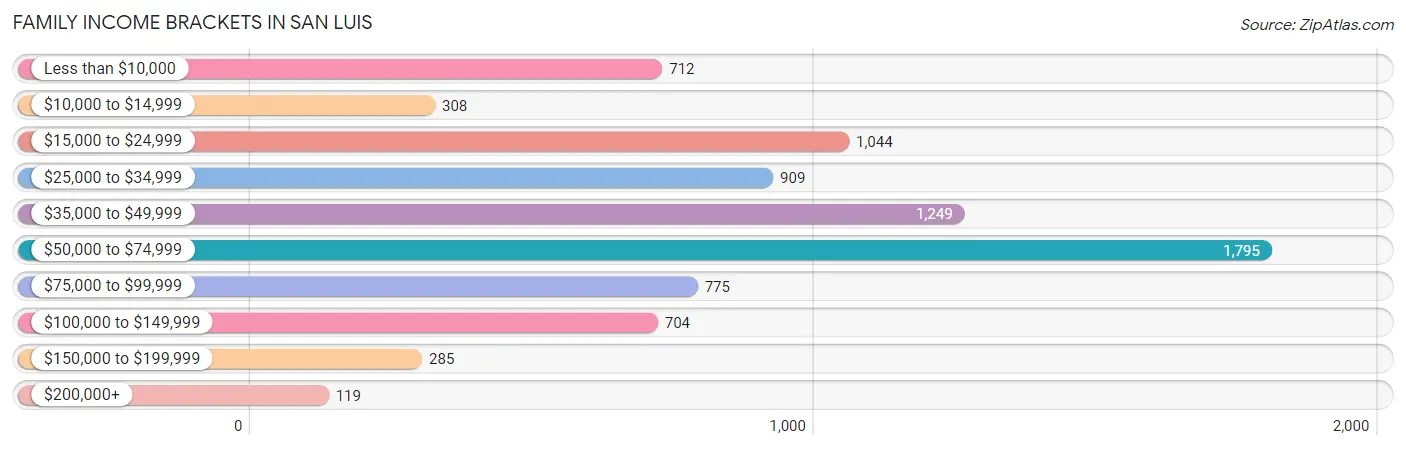
| Income Bracket | # Families | % Families |
| Less than $10,000 | 712 | 9.0% |
| $10,000 to $14,999 | 308 | 3.9% |
| $15,000 to $24,999 | 1,044 | 13.2% |
| $25,000 to $34,999 | 909 | 11.5% |
| $35,000 to $49,999 | 1,249 | 15.8% |
| $50,000 to $74,999 | 1,795 | 22.7% |
| $75,000 to $99,999 | 775 | 9.8% |
| $100,000 to $149,999 | 704 | 8.9% |
| $150,000 to $199,999 | 285 | 3.6% |
| $200,000+ | 119 | 1.5% |
Family Income by Famaliy Size in San Luis
7+ person families (436 | 5.5%) account for the highest median family income in San Luis with $100,859 per family, while 2-person families (1,945 | 24.6%) have the highest median income of $15,398 per family member.
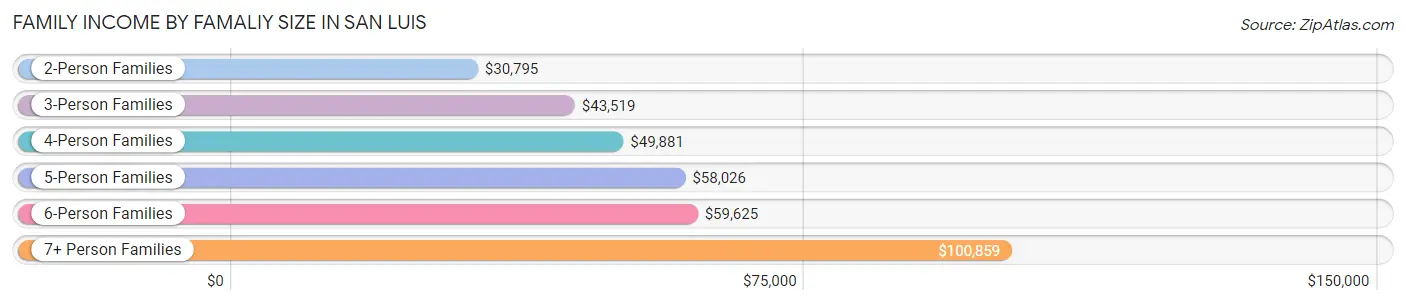
| Income Bracket | # Families | Median Income |
| 2-Person Families | 1,945 (24.6%) | $30,795 |
| 3-Person Families | 1,798 (22.7%) | $43,519 |
| 4-Person Families | 1,854 (23.4%) | $49,881 |
| 5-Person Families | 1,398 (17.7%) | $58,026 |
| 6-Person Families | 476 (6.0%) | $59,625 |
| 7+ Person Families | 436 (5.5%) | $100,859 |
| Total | 7,907 (100.0%) | $46,560 |
Family Income by Number of Earners in San Luis
The median family income in San Luis is $46,560, with families comprising 3+ earners (1,425) having the highest median family income of $76,505, while families with no earners (904) have the lowest median family income of $16,364, accounting for 18.0% and 11.4% of families, respectively.
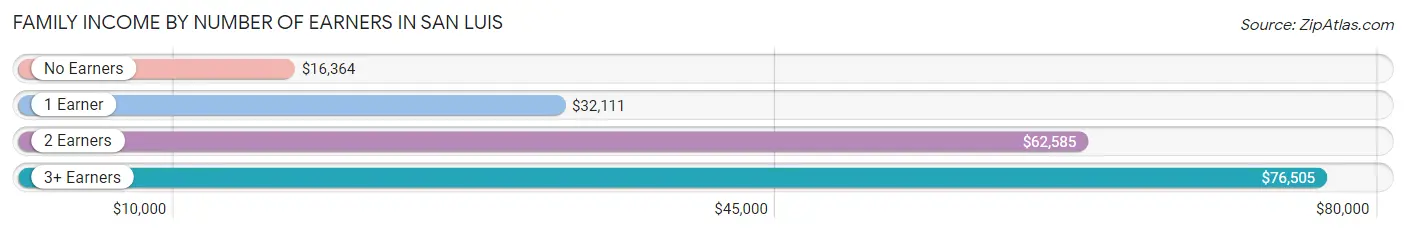
| Number of Earners | # Families | Median Income |
| No Earners | 904 (11.4%) | $16,364 |
| 1 Earner | 2,807 (35.5%) | $32,111 |
| 2 Earners | 2,771 (35.0%) | $62,585 |
| 3+ Earners | 1,425 (18.0%) | $76,505 |
| Total | 7,907 (100.0%) | $46,560 |
Household Income in San Luis
Household Income Brackets in San Luis
With 1,946 households falling in the category, the $50,000 to $74,999 income range is the most frequent in San Luis, accounting for 22.0% of all households. In contrast, only 168 households (1.9%) fall into the $200,000+ income bracket, making it the least populous group.
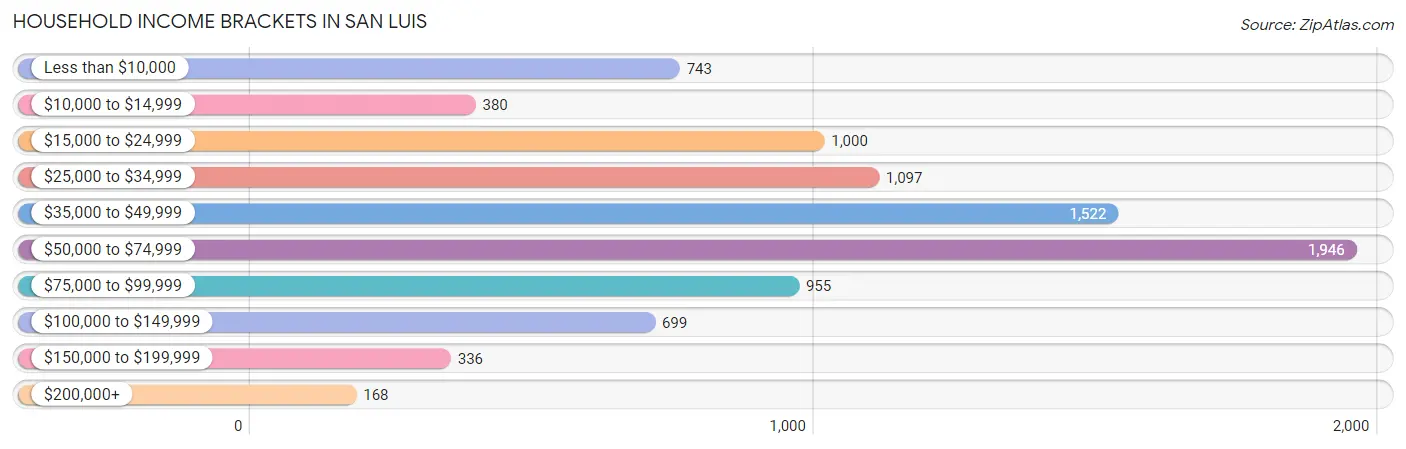
| Income Bracket | # Households | % Households |
| Less than $10,000 | 743 | 8.4% |
| $10,000 to $14,999 | 380 | 4.3% |
| $15,000 to $24,999 | 1,000 | 11.3% |
| $25,000 to $34,999 | 1,097 | 12.4% |
| $35,000 to $49,999 | 1,522 | 17.2% |
| $50,000 to $74,999 | 1,946 | 22.0% |
| $75,000 to $99,999 | 955 | 10.8% |
| $100,000 to $149,999 | 699 | 7.9% |
| $150,000 to $199,999 | 336 | 3.8% |
| $200,000+ | 168 | 1.9% |
Household Income by Householder Age in San Luis
The median household income in San Luis is $46,747, with the highest median household income of $59,759 found in the 45 to 64 years age bracket for the primary householder. A total of 4,129 households (46.7%) fall into this category. Meanwhile, the 65+ years age bracket for the primary householder has the lowest median household income of $31,417, with 1,691 households (19.1%) in this group.
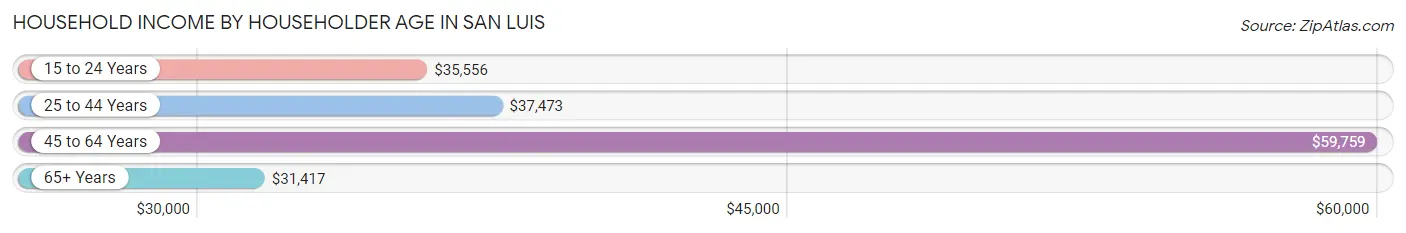
| Income Bracket | # Households | Median Income |
| 15 to 24 Years | 154 (1.7%) | $35,556 |
| 25 to 44 Years | 2,872 (32.5%) | $37,473 |
| 45 to 64 Years | 4,129 (46.7%) | $59,759 |
| 65+ Years | 1,691 (19.1%) | $31,417 |
| Total | 8,846 (100.0%) | $46,747 |
Poverty in San Luis
Income Below Poverty by Sex and Age in San Luis
With 22.7% poverty level for males and 26.9% for females among the residents of San Luis, 6 to 11 year old males and 75 year old and over females are the most vulnerable to poverty, with 902 males (58.0%) and 253 females (44.8%) in their respective age groups living below the poverty level.
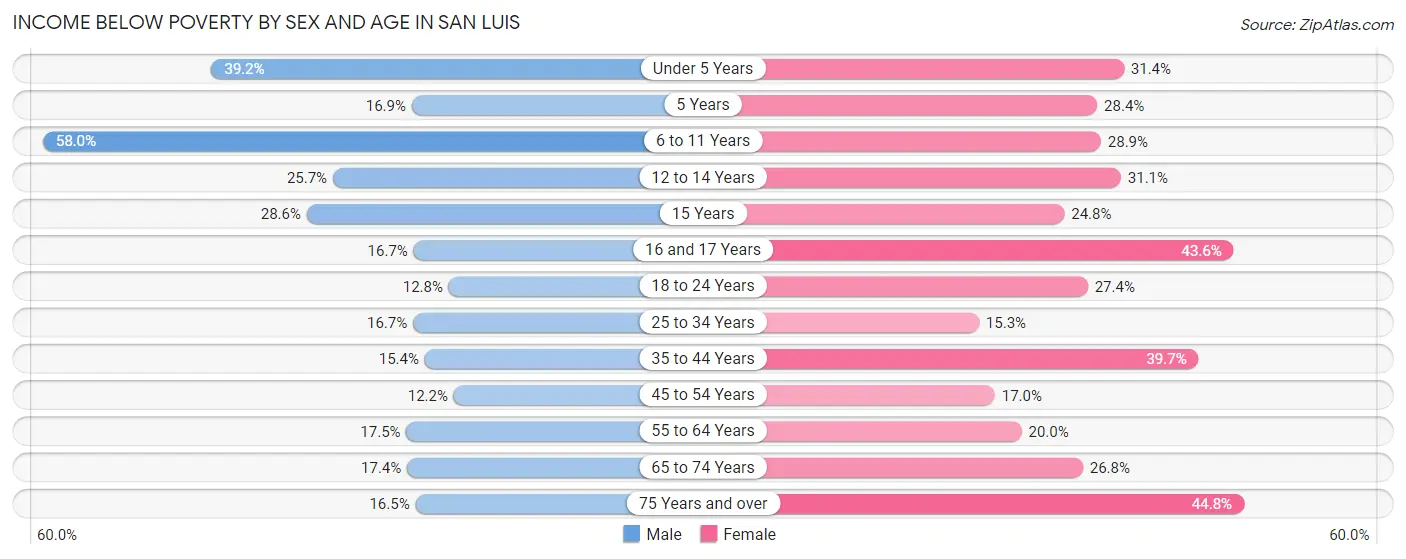
| Age Bracket | Male | Female |
| Under 5 Years | 568 (39.2%) | 387 (31.4%) |
| 5 Years | 39 (16.9%) | 60 (28.4%) |
| 6 to 11 Years | 902 (58.0%) | 455 (28.8%) |
| 12 to 14 Years | 225 (25.7%) | 367 (31.1%) |
| 15 Years | 96 (28.6%) | 86 (24.8%) |
| 16 and 17 Years | 89 (16.7%) | 302 (43.6%) |
| 18 to 24 Years | 265 (12.8%) | 495 (27.4%) |
| 25 to 34 Years | 363 (16.7%) | 304 (15.3%) |
| 35 to 44 Years | 200 (15.4%) | 688 (39.7%) |
| 45 to 54 Years | 215 (12.2%) | 376 (17.0%) |
| 55 to 64 Years | 241 (17.5%) | 356 (20.0%) |
| 65 to 74 Years | 202 (17.4%) | 274 (26.8%) |
| 75 Years and over | 97 (16.5%) | 253 (44.8%) |
| Total | 3,502 (22.7%) | 4,403 (26.9%) |
Income Above Poverty by Sex and Age in San Luis
According to the poverty statistics in San Luis, males aged 45 to 54 years and females aged 25 to 34 years are the age groups that are most secure financially, with 87.8% of males and 84.7% of females in these age groups living above the poverty line.
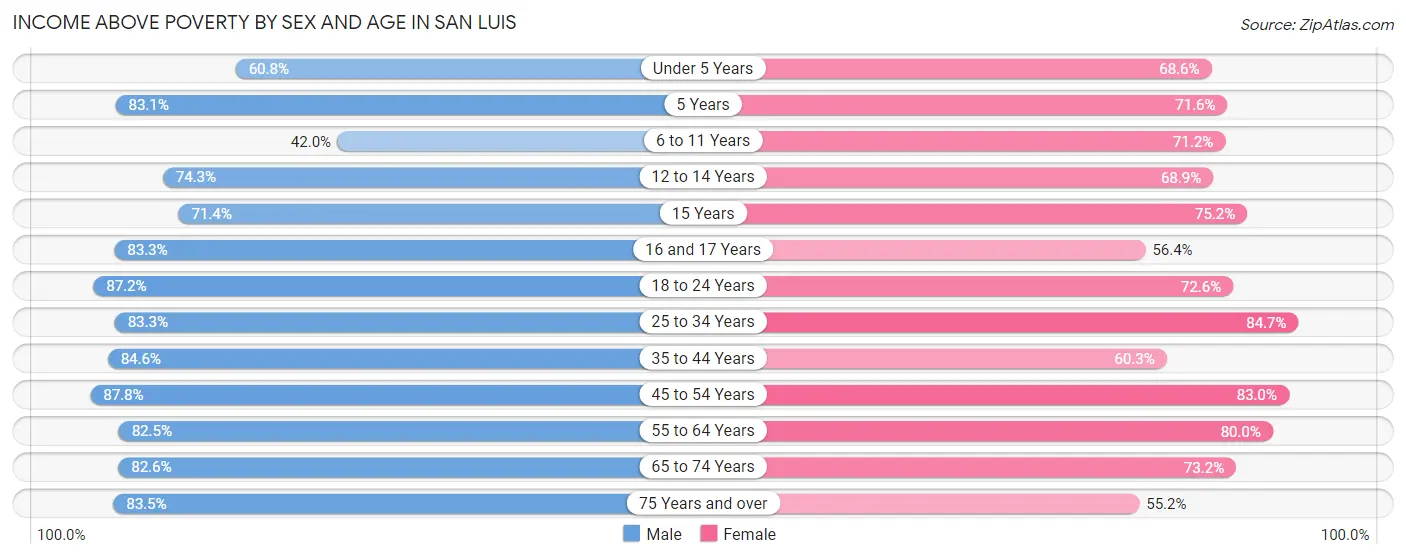
| Age Bracket | Male | Female |
| Under 5 Years | 881 (60.8%) | 845 (68.6%) |
| 5 Years | 192 (83.1%) | 151 (71.6%) |
| 6 to 11 Years | 654 (42.0%) | 1,122 (71.2%) |
| 12 to 14 Years | 652 (74.3%) | 814 (68.9%) |
| 15 Years | 240 (71.4%) | 261 (75.2%) |
| 16 and 17 Years | 445 (83.3%) | 390 (56.4%) |
| 18 to 24 Years | 1,812 (87.2%) | 1,312 (72.6%) |
| 25 to 34 Years | 1,805 (83.3%) | 1,687 (84.7%) |
| 35 to 44 Years | 1,096 (84.6%) | 1,044 (60.3%) |
| 45 to 54 Years | 1,548 (87.8%) | 1,831 (83.0%) |
| 55 to 64 Years | 1,138 (82.5%) | 1,422 (80.0%) |
| 65 to 74 Years | 959 (82.6%) | 747 (73.2%) |
| 75 Years and over | 492 (83.5%) | 312 (55.2%) |
| Total | 11,914 (77.3%) | 11,938 (73.1%) |
Income Below Poverty Among Married-Couple Families in San Luis
The poverty statistics for married-couple families in San Luis show that 14.5% or 750 of the total 5,169 families live below the poverty line. Families with 5 or more children have the highest poverty rate of 100.0%, comprising of 75 families. On the other hand, families with no children have the lowest poverty rate of 11.3%, which includes 267 families.
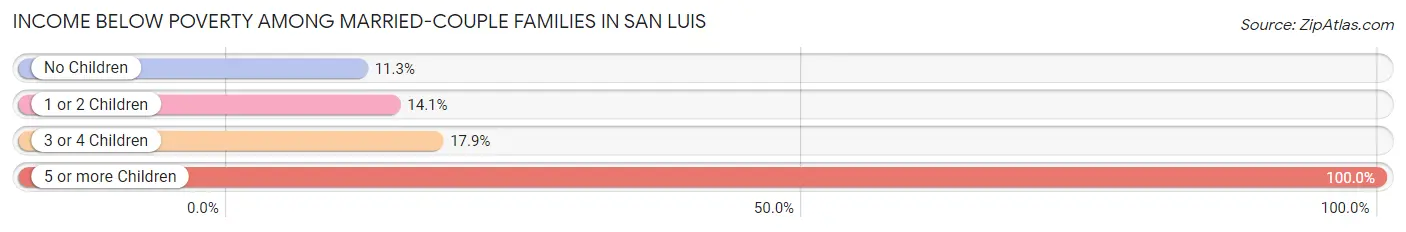
| Children | Above Poverty | Below Poverty |
| No Children | 2,098 (88.7%) | 267 (11.3%) |
| 1 or 2 Children | 1,829 (85.9%) | 301 (14.1%) |
| 3 or 4 Children | 492 (82.1%) | 107 (17.9%) |
| 5 or more Children | 0 (0.0%) | 75 (100.0%) |
| Total | 4,419 (85.5%) | 750 (14.5%) |
Income Below Poverty Among Single-Parent Households in San Luis
According to the poverty data in San Luis, 38.5% or 158 single-father households and 42.3% or 985 single-mother households are living below the poverty line. Among single-father households, those with 3 or 4 children have the highest poverty rate, with 48 households (73.9%) experiencing poverty. Likewise, among single-mother households, those with 3 or 4 children have the highest poverty rate, with 401 households (70.7%) falling below the poverty line.
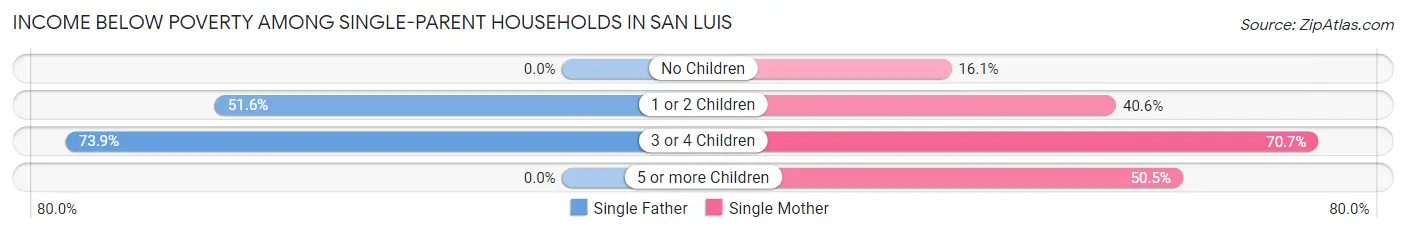
| Children | Single Father | Single Mother |
| No Children | 0 (0.0%) | 92 (16.1%) |
| 1 or 2 Children | 110 (51.6%) | 442 (40.6%) |
| 3 or 4 Children | 48 (73.9%) | 401 (70.7%) |
| 5 or more Children | 0 (0.0%) | 50 (50.5%) |
| Total | 158 (38.5%) | 985 (42.3%) |
Income Below Poverty Among Married-Couple vs Single-Parent Households in San Luis
The poverty data for San Luis shows that 750 of the married-couple family households (14.5%) and 1,143 of the single-parent households (41.7%) are living below the poverty level. Within the married-couple family households, those with 5 or more children have the highest poverty rate, with 75 households (100.0%) falling below the poverty line. Among the single-parent households, those with 3 or 4 children have the highest poverty rate, with 449 household (71.0%) living below poverty.
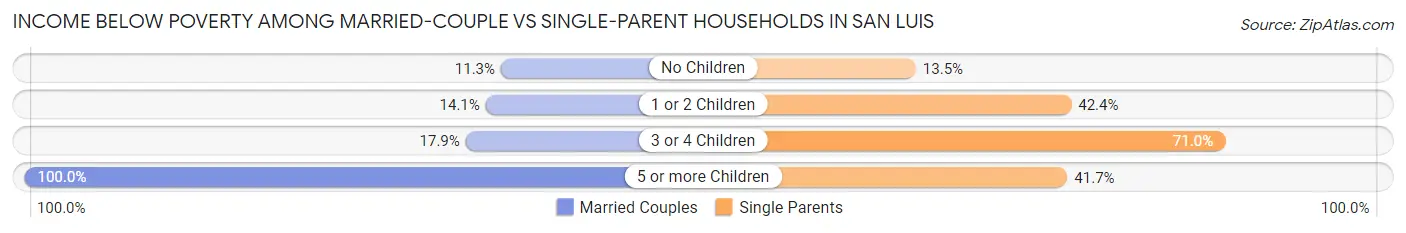
| Children | Married-Couple Families | Single-Parent Households |
| No Children | 267 (11.3%) | 92 (13.5%) |
| 1 or 2 Children | 301 (14.1%) | 552 (42.4%) |
| 3 or 4 Children | 107 (17.9%) | 449 (71.0%) |
| 5 or more Children | 75 (100.0%) | 50 (41.7%) |
| Total | 750 (14.5%) | 1,143 (41.7%) |
Race in San Luis
The most populous races in San Luis are Hispanic or Latino (33,150 | 94.2%), White / Caucasian (17,514 | 49.8%), and Two or more Races (15,611 | 44.4%).
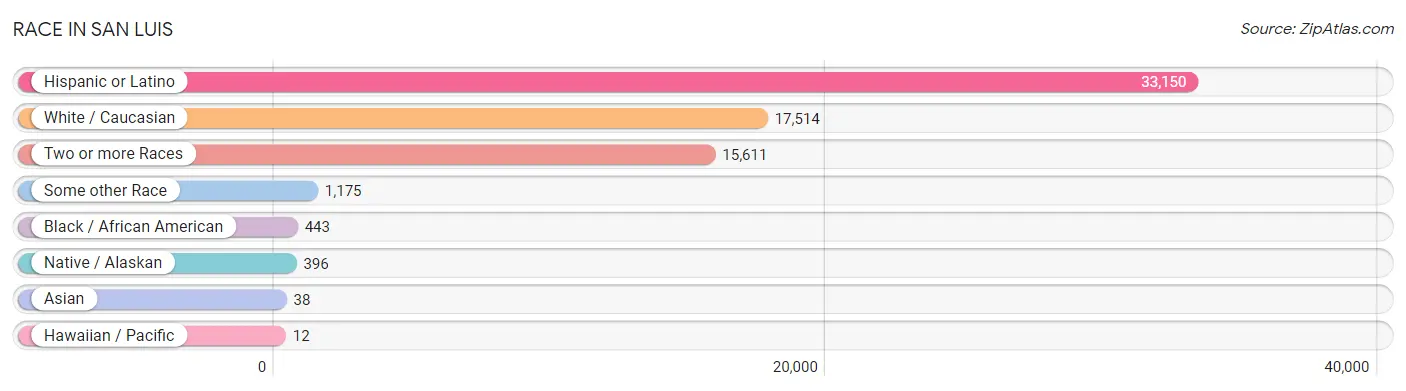
| Race | # Population | % Population |
| Asian | 38 | 0.1% |
| Black / African American | 443 | 1.3% |
| Hawaiian / Pacific | 12 | 0.0% |
| Hispanic or Latino | 33,150 | 94.2% |
| Native / Alaskan | 396 | 1.1% |
| White / Caucasian | 17,514 | 49.8% |
| Two or more Races | 15,611 | 44.4% |
| Some other Race | 1,175 | 3.3% |
| Total | 35,189 | 100.0% |
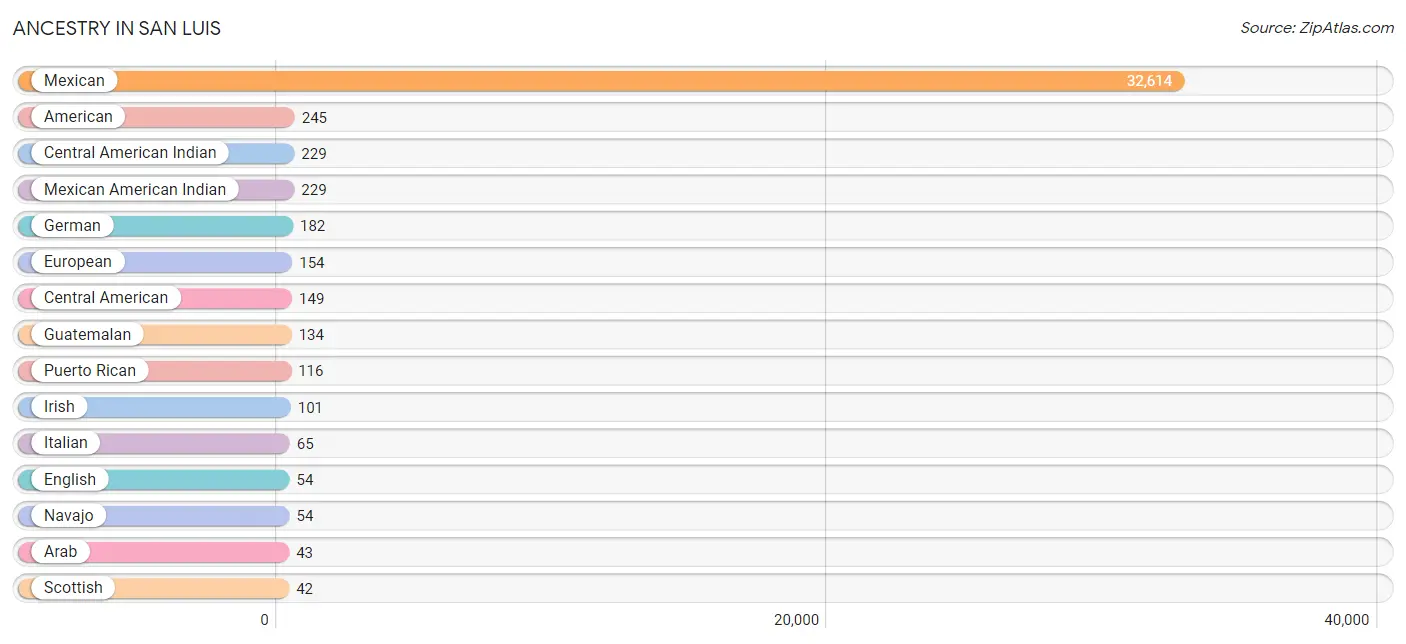
Ancestry in San Luis
The most populous ancestries reported in San Luis are Mexican (32,614 | 92.7%), American (245 | 0.7%), Central American Indian (229 | 0.6%), Mexican American Indian (229 | 0.6%), and German (182 | 0.5%), together accounting for 95.2% of all San Luis residents.
| Ancestry | # Population | % Population |
| African | 26 | 0.1% |
| American | 245 | 0.7% |
| Apache | 6 | 0.0% |
| Arab | 43 | 0.1% |
| Burmese | 35 | 0.1% |
| Central American | 149 | 0.4% |
| Central American Indian | 229 | 0.6% |
| Cherokee | 25 | 0.1% |
| Choctaw | 16 | 0.1% |
| Colombian | 14 | 0.0% |
| Cuban | 14 | 0.0% |
| Dutch | 11 | 0.0% |
| English | 54 | 0.2% |
| European | 154 | 0.4% |
| French | 32 | 0.1% |
| German | 182 | 0.5% |
| Greek | 10 | 0.0% |
| Guamanian / Chamorro | 12 | 0.0% |
| Guatemalan | 134 | 0.4% |
| Honduran | 15 | 0.0% |
| Iraqi | 23 | 0.1% |
| Irish | 101 | 0.3% |
| Italian | 65 | 0.2% |
| Korean | 29 | 0.1% |
| Mexican | 32,614 | 92.7% |
| Mexican American Indian | 229 | 0.6% |
| Navajo | 54 | 0.2% |
| Norwegian | 14 | 0.0% |
| Pima | 23 | 0.1% |
| Polish | 9 | 0.0% |
| Puerto Rican | 116 | 0.3% |
| Scottish | 42 | 0.1% |
| South American | 14 | 0.0% |
| Spaniard | 22 | 0.1% |
| Subsaharan African | 26 | 0.1% |
| Yaqui | 23 | 0.1% |
| Yuman | 12 | 0.0% | View All 37 Rows |
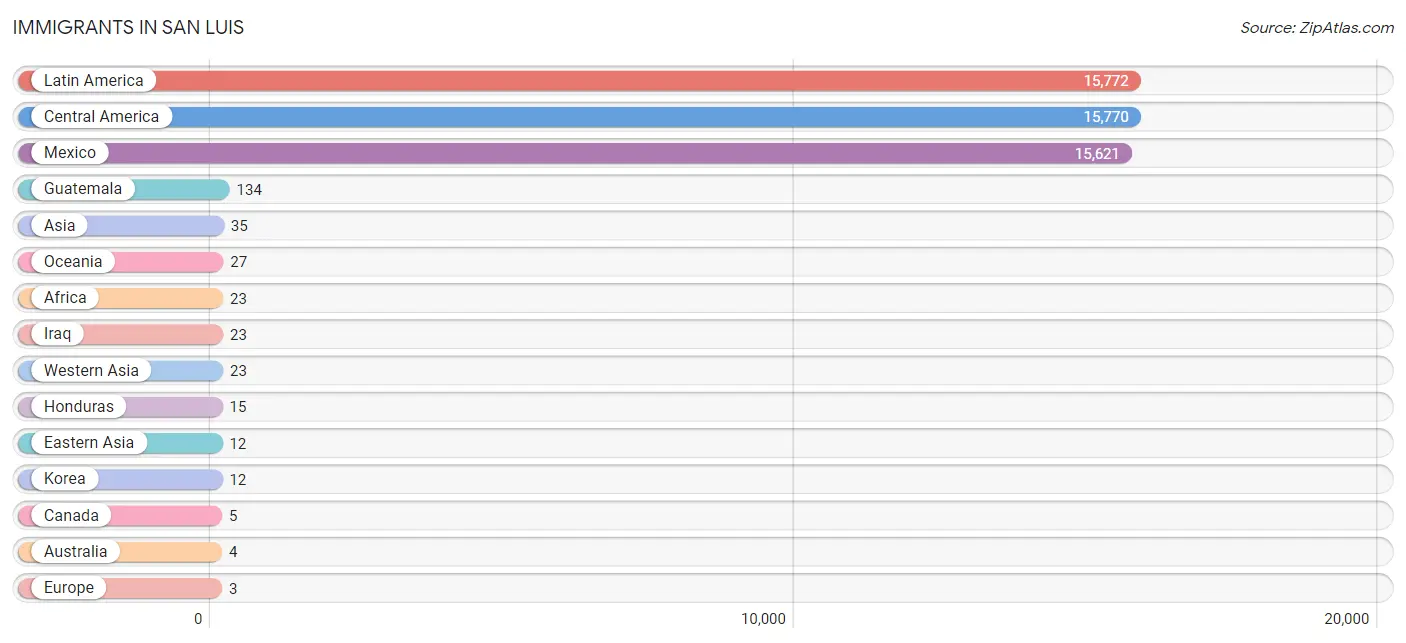
Immigrants in San Luis
The most numerous immigrant groups reported in San Luis came from Latin America (15,772 | 44.8%), Central America (15,770 | 44.8%), Mexico (15,621 | 44.4%), Guatemala (134 | 0.4%), and Asia (35 | 0.1%), together accounting for 134.5% of all San Luis residents.
| Immigration Origin | # Population | % Population |
| Africa | 23 | 0.1% |
| Asia | 35 | 0.1% |
| Australia | 4 | 0.0% |
| Canada | 5 | 0.0% |
| Central America | 15,770 | 44.8% |
| Colombia | 2 | 0.0% |
| Eastern Asia | 12 | 0.0% |
| Europe | 3 | 0.0% |
| Germany | 3 | 0.0% |
| Guatemala | 134 | 0.4% |
| Honduras | 15 | 0.0% |
| Iraq | 23 | 0.1% |
| Korea | 12 | 0.0% |
| Latin America | 15,772 | 44.8% |
| Mexico | 15,621 | 44.4% |
| Oceania | 27 | 0.1% |
| South America | 2 | 0.0% |
| Western Asia | 23 | 0.1% |
| Western Europe | 3 | 0.0% | View All 19 Rows |
Sex and Age in San Luis
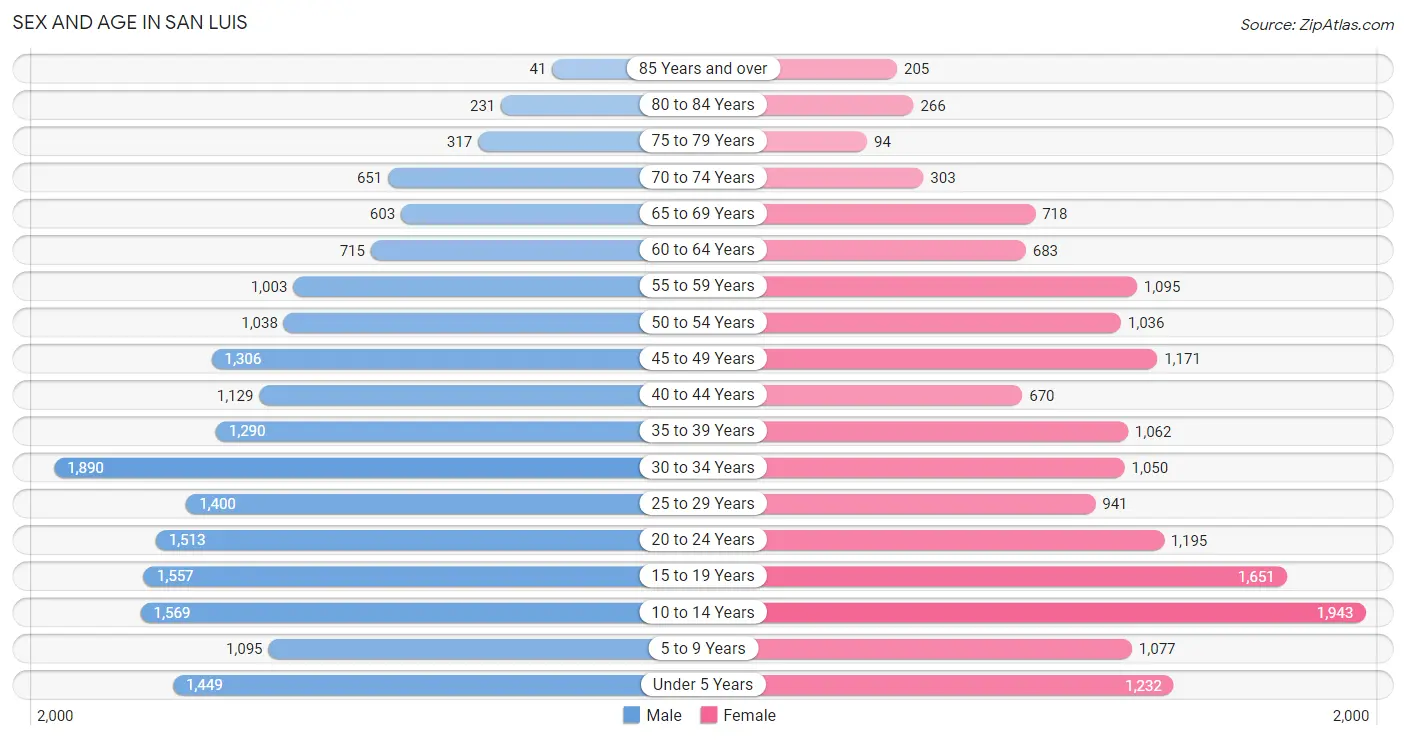
Sex and Age in San Luis
The most populous age groups in San Luis are 30 to 34 Years (1,890 | 10.1%) for men and 10 to 14 Years (1,943 | 11.8%) for women.
| Age Bracket | Male | Female |
| Under 5 Years | 1,449 (7.7%) | 1,232 (7.5%) |
| 5 to 9 Years | 1,095 (5.8%) | 1,077 (6.6%) |
| 10 to 14 Years | 1,569 (8.4%) | 1,943 (11.8%) |
| 15 to 19 Years | 1,557 (8.3%) | 1,651 (10.1%) |
| 20 to 24 Years | 1,513 (8.1%) | 1,195 (7.3%) |
| 25 to 29 Years | 1,400 (7.4%) | 941 (5.7%) |
| 30 to 34 Years | 1,890 (10.1%) | 1,050 (6.4%) |
| 35 to 39 Years | 1,290 (6.9%) | 1,062 (6.5%) |
| 40 to 44 Years | 1,129 (6.0%) | 670 (4.1%) |
| 45 to 49 Years | 1,306 (7.0%) | 1,171 (7.1%) |
| 50 to 54 Years | 1,038 (5.5%) | 1,036 (6.3%) |
| 55 to 59 Years | 1,003 (5.3%) | 1,095 (6.7%) |
| 60 to 64 Years | 715 (3.8%) | 683 (4.2%) |
| 65 to 69 Years | 603 (3.2%) | 718 (4.4%) |
| 70 to 74 Years | 651 (3.5%) | 303 (1.8%) |
| 75 to 79 Years | 317 (1.7%) | 94 (0.6%) |
| 80 to 84 Years | 231 (1.2%) | 266 (1.6%) |
| 85 Years and over | 41 (0.2%) | 205 (1.3%) |
| Total | 18,797 (100.0%) | 16,392 (100.0%) |
Families and Households in San Luis
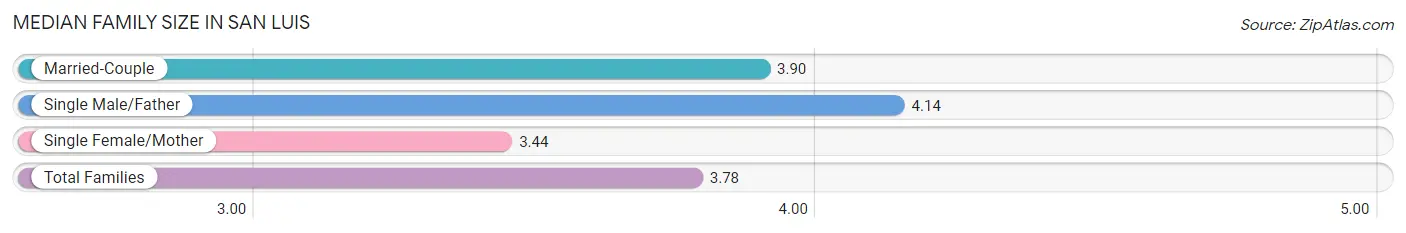
Median Family Size in San Luis
The median family size in San Luis is 3.78 persons per family, with single male/father families (410 | 5.2%) accounting for the largest median family size of 4.14 persons per family. On the other hand, single female/mother families (2,328 | 29.4%) represent the smallest median family size with 3.44 persons per family.
| Family Type | # Families | Family Size |
| Married-Couple | 5,169 (65.4%) | 3.90 |
| Single Male/Father | 410 (5.2%) | 4.14 |
| Single Female/Mother | 2,328 (29.4%) | 3.44 |
| Total Families | 7,907 (100.0%) | 3.78 |
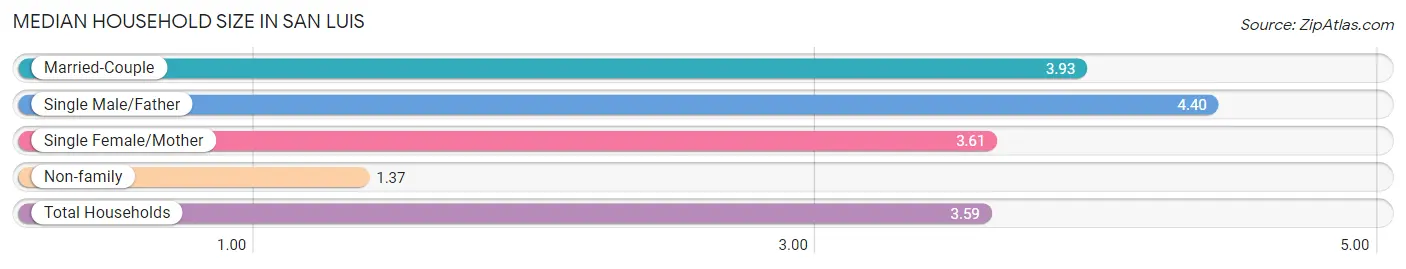
Median Household Size in San Luis
The median household size in San Luis is 3.59 persons per household, with single male/father households (410 | 4.6%) accounting for the largest median household size of 4.4 persons per household. non-family households (939 | 10.6%) represent the smallest median household size with 1.37 persons per household.
| Household Type | # Households | Household Size |
| Married-Couple | 5,169 (58.4%) | 3.93 |
| Single Male/Father | 410 (4.6%) | 4.40 |
| Single Female/Mother | 2,328 (26.3%) | 3.61 |
| Non-family | 939 (10.6%) | 1.37 |
| Total Households | 8,846 (100.0%) | 3.59 |
Household Size by Marriage Status in San Luis
Out of a total of 8,846 households in San Luis, 7,907 (89.4%) are family households, while 939 (10.6%) are nonfamily households. The most numerous type of family households are 4-person households, comprising 1,934, and the most common type of nonfamily households are 1-person households, comprising 727.
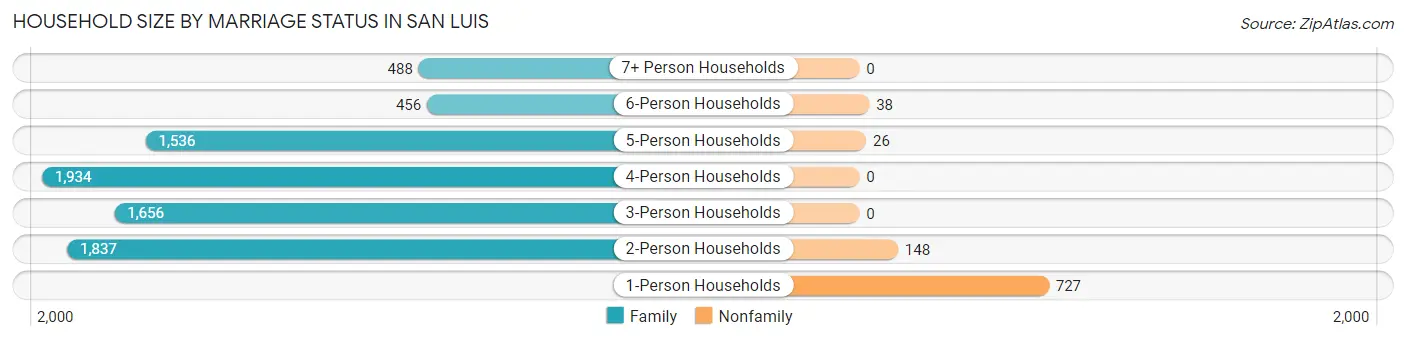
| Household Size | Family Households | Nonfamily Households |
| 1-Person Households | - | 727 (8.2%) |
| 2-Person Households | 1,837 (20.8%) | 148 (1.7%) |
| 3-Person Households | 1,656 (18.7%) | 0 (0.0%) |
| 4-Person Households | 1,934 (21.9%) | 0 (0.0%) |
| 5-Person Households | 1,536 (17.4%) | 26 (0.3%) |
| 6-Person Households | 456 (5.1%) | 38 (0.4%) |
| 7+ Person Households | 488 (5.5%) | 0 (0.0%) |
| Total | 7,907 (89.4%) | 939 (10.6%) |
Female Fertility in San Luis
Fertility by Age in San Luis
Average fertility rate in San Luis is 62.0 births per 1,000 women. Women in the age bracket of 20 to 34 years have the highest fertility rate with 79.0 births per 1,000 women. Women in the age bracket of 20 to 34 years acount for 50.4% of all women with births.
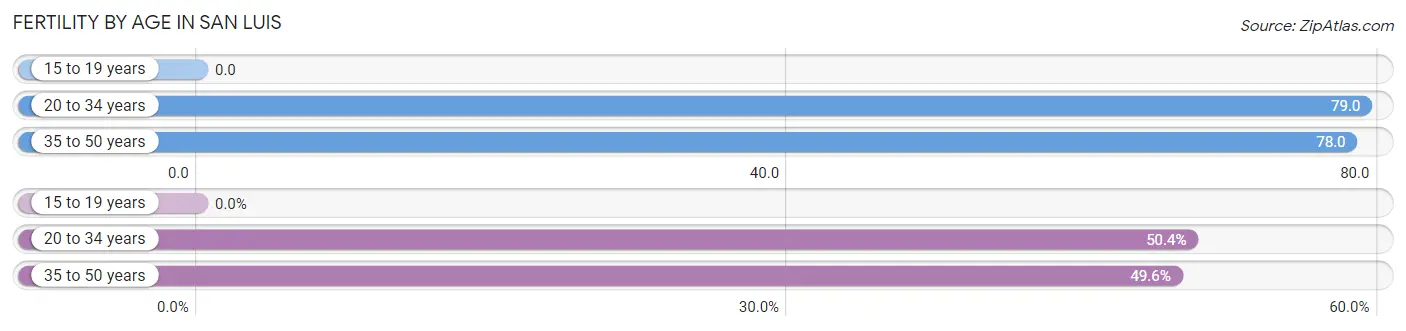
| Age Bracket | Women with Births | Births / 1,000 Women |
| 15 to 19 years | 0 (0.0%) | 0.0 |
| 20 to 34 years | 251 (50.4%) | 79.0 |
| 35 to 50 years | 247 (49.6%) | 78.0 |
| Total | 498 (100.0%) | 62.0 |
Fertility by Age by Marriage Status in San Luis
69.7% of women with births (498) in San Luis are married. The highest percentage of unmarried women with births falls into 20 to 34 years age bracket with 60.2% of them unmarried at the time of birth, while the lowest percentage of unmarried women with births belong to 35 to 50 years age bracket with 0.0% of them unmarried.

| Age Bracket | Married | Unmarried |
| 15 to 19 years | 0 (0.0%) | 0 (0.0%) |
| 20 to 34 years | 100 (39.8%) | 151 (60.2%) |
| 35 to 50 years | 247 (100.0%) | 0 (0.0%) |
| Total | 347 (69.7%) | 151 (30.3%) |
Fertility by Education in San Luis
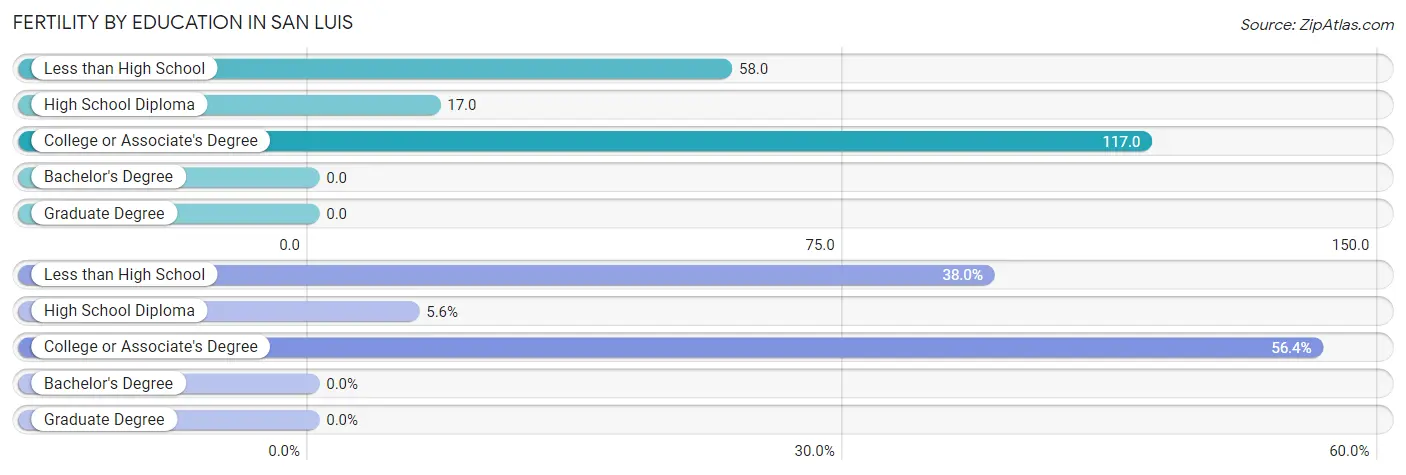
| Educational Attainment | Women with Births | Births / 1,000 Women |
| Less than High School | 189 (38.0%) | 58.0 |
| High School Diploma | 28 (5.6%) | 17.0 |
| College or Associate's Degree | 281 (56.4%) | 117.0 |
| Bachelor's Degree | 0 (0.0%) | 0.0 |
| Graduate Degree | 0 (0.0%) | 0.0 |
| Total | 498 (100.0%) | 62.0 |
Fertility by Education by Marriage Status in San Luis
30.3% of women with births in San Luis are unmarried. Women with the educational attainment of less than high school are most likely to be married with 100.0% of them married at childbirth, while women with the educational attainment of college or associate's degree are least likely to be married with 53.7% of them unmarried at childbirth.
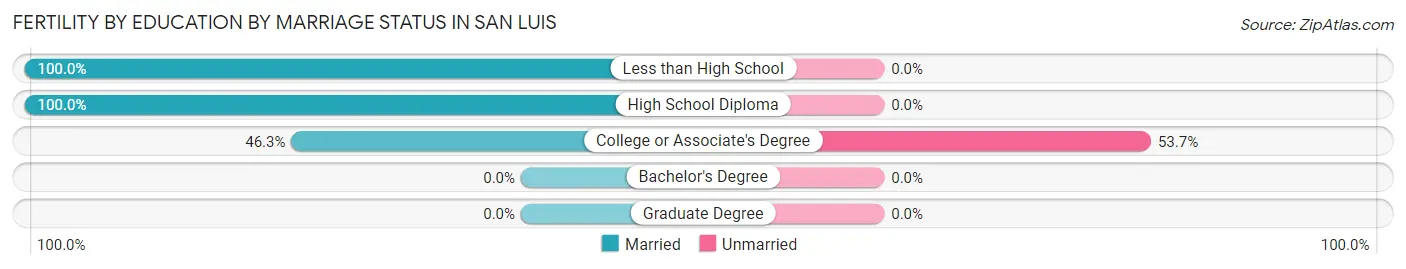
| Educational Attainment | Married | Unmarried |
| Less than High School | 189 (100.0%) | 0 (0.0%) |
| High School Diploma | 28 (100.0%) | 0 (0.0%) |
| College or Associate's Degree | 130 (46.3%) | 151 (53.7%) |
| Bachelor's Degree | 0 (0.0%) | 0 (0.0%) |
| Graduate Degree | 0 (0.0%) | 0 (0.0%) |
| Total | 347 (69.7%) | 151 (30.3%) |
Employment Characteristics in San Luis
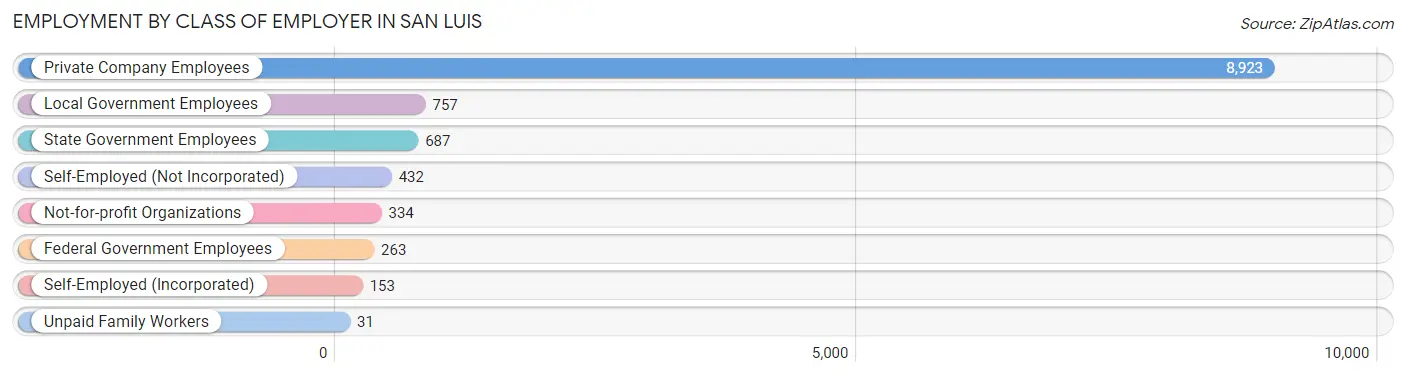
Employment by Class of Employer in San Luis
Among the 11,580 employed individuals in San Luis, private company employees (8,923 | 77.1%), local government employees (757 | 6.5%), and state government employees (687 | 5.9%) make up the most common classes of employment.
| Employer Class | # Employees | % Employees |
| Private Company Employees | 8,923 | 77.1% |
| Self-Employed (Incorporated) | 153 | 1.3% |
| Self-Employed (Not Incorporated) | 432 | 3.7% |
| Not-for-profit Organizations | 334 | 2.9% |
| Local Government Employees | 757 | 6.5% |
| State Government Employees | 687 | 5.9% |
| Federal Government Employees | 263 | 2.3% |
| Unpaid Family Workers | 31 | 0.3% |
| Total | 11,580 | 100.0% |
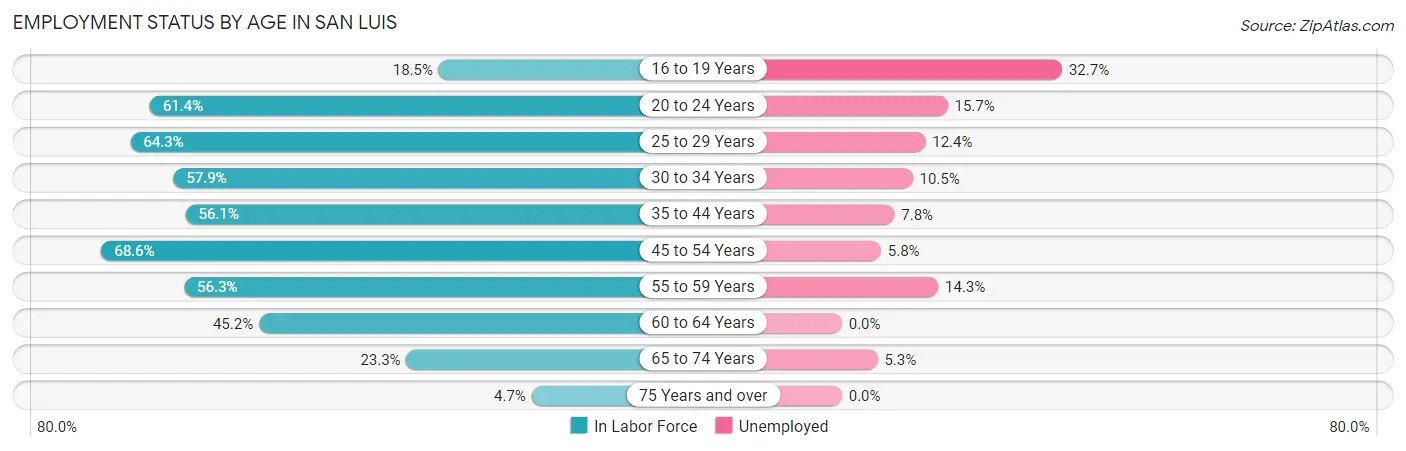
Employment Status by Age in San Luis
According to the labor force statistics for San Luis, out of the total population over 16 years of age (26,141), 50.4% or 13,175 individuals are in the labor force, with 10.1% or 1,331 of them unemployed. The age group with the highest labor force participation rate is 45 to 54 years, with 68.6% or 3,122 individuals in the labor force. Within the labor force, the 16 to 19 years age range has the highest percentage of unemployed individuals, with 32.7% or 153 of them being unemployed.
| Age Bracket | In Labor Force | Unemployed |
| 16 to 19 Years | 467 (18.5%) | 153 (32.7%) |
| 20 to 24 Years | 1,663 (61.4%) | 261 (15.7%) |
| 25 to 29 Years | 1,505 (64.3%) | 187 (12.4%) |
| 30 to 34 Years | 1,702 (57.9%) | 179 (10.5%) |
| 35 to 44 Years | 2,329 (56.1%) | 182 (7.8%) |
| 45 to 54 Years | 3,122 (68.6%) | 181 (5.8%) |
| 55 to 59 Years | 1,181 (56.3%) | 169 (14.3%) |
| 60 to 64 Years | 632 (45.2%) | 0 (0.0%) |
| 65 to 74 Years | 530 (23.3%) | 28 (5.3%) |
| 75 Years and over | 54 (4.7%) | 0 (0.0%) |
| Total | 13,175 (50.4%) | 1,331 (10.1%) |
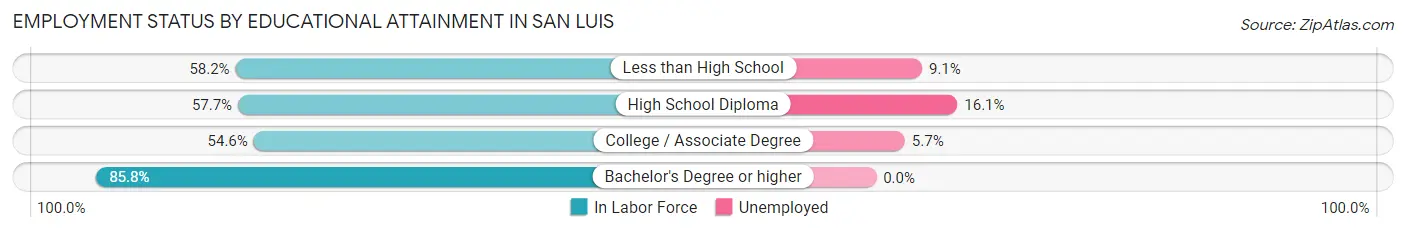
Employment Status by Educational Attainment in San Luis
According to labor force statistics for San Luis, 59.9% of individuals (10,470) out of the total population between 25 and 64 years of age (17,479) are in the labor force, with 8.6% or 900 of them being unemployed. The group with the highest labor force participation rate are those with the educational attainment of bachelor's degree or higher, with 85.8% or 1,532 individuals in the labor force. Within the labor force, individuals with high school diploma education have the highest percentage of unemployment, with 16.1% or 392 of them being unemployed.
| Educational Attainment | In Labor Force | Unemployed |
| Less than High School | 3,942 (58.2%) | 616 (9.1%) |
| High School Diploma | 2,434 (57.7%) | 679 (16.1%) |
| College / Associate Degree | 2,566 (54.6%) | 268 (5.7%) |
| Bachelor's Degree or higher | 1,532 (85.8%) | 0 (0.0%) |
| Total | 10,470 (59.9%) | 1,503 (8.6%) |
Employment Occupations by Sex in San Luis
Management, Business, Science and Arts Occupations
The most common Management, Business, Science and Arts occupations in San Luis are Community & Social Service (893 | 7.5%), Education Instruction & Library (750 | 6.3%), Management (563 | 4.8%), Health Diagnosing & Treating (281 | 2.4%), and Computers, Engineering & Science (248 | 2.1%).
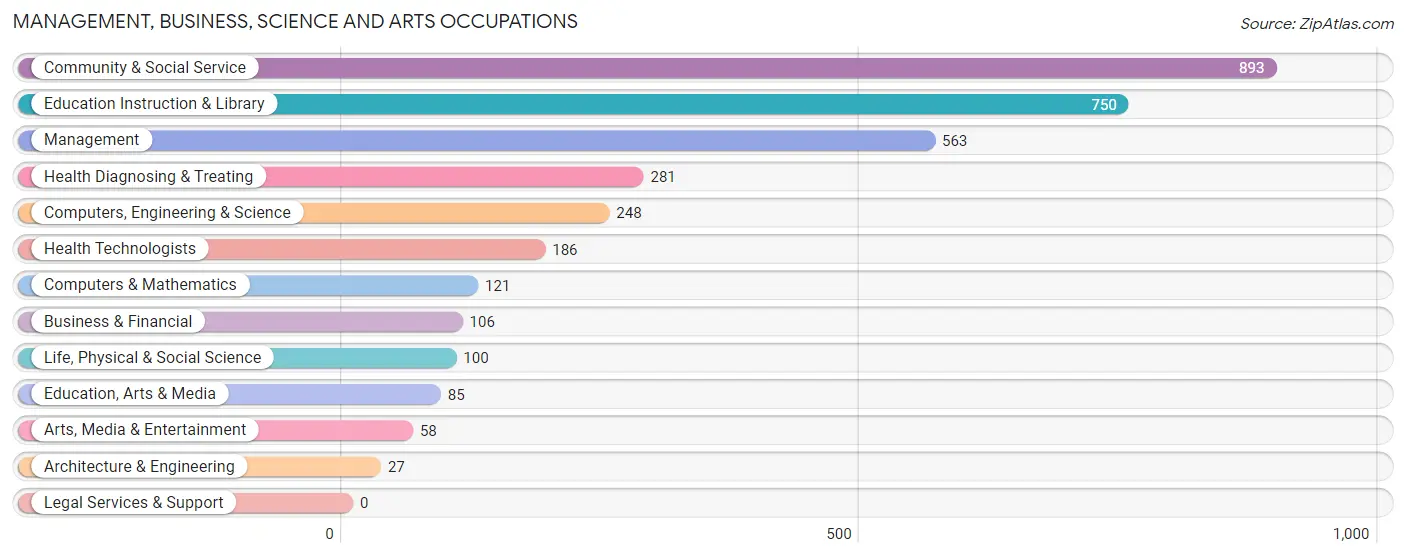
Management, Business, Science and Arts Occupations by Sex
Within the Management, Business, Science and Arts occupations in San Luis, the most male-oriented occupations are Architecture & Engineering (100.0%), Business & Financial (54.7%), and Management (54.7%), while the most female-oriented occupations are Education, Arts & Media (100.0%), Health Diagnosing & Treating (80.8%), and Community & Social Service (72.2%).
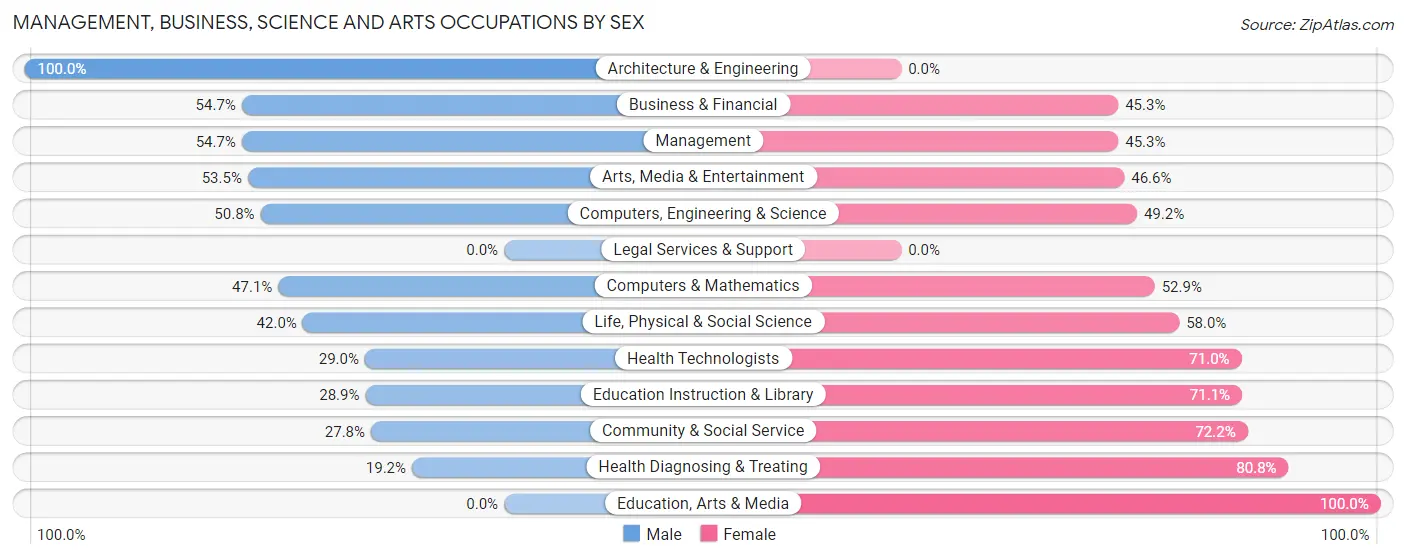
| Occupation | Male | Female |
| Management | 308 (54.7%) | 255 (45.3%) |
| Business & Financial | 58 (54.7%) | 48 (45.3%) |
| Computers, Engineering & Science | 126 (50.8%) | 122 (49.2%) |
| Computers & Mathematics | 57 (47.1%) | 64 (52.9%) |
| Architecture & Engineering | 27 (100.0%) | 0 (0.0%) |
| Life, Physical & Social Science | 42 (42.0%) | 58 (58.0%) |
| Community & Social Service | 248 (27.8%) | 645 (72.2%) |
| Education, Arts & Media | 0 (0.0%) | 85 (100.0%) |
| Legal Services & Support | 0 (0.0%) | 0 (0.0%) |
| Education Instruction & Library | 217 (28.9%) | 533 (71.1%) |
| Arts, Media & Entertainment | 31 (53.4%) | 27 (46.6%) |
| Health Diagnosing & Treating | 54 (19.2%) | 227 (80.8%) |
| Health Technologists | 54 (29.0%) | 132 (71.0%) |
| Total (Category) | 794 (38.0%) | 1,297 (62.0%) |
| Total (Overall) | 6,719 (56.7%) | 5,131 (43.3%) |
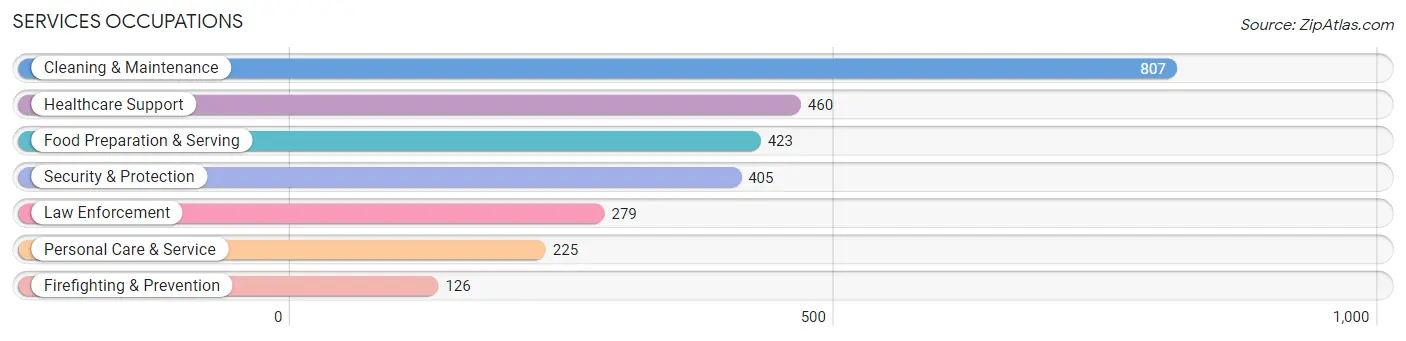
Services Occupations
The most common Services occupations in San Luis are Cleaning & Maintenance (807 | 6.8%), Healthcare Support (460 | 3.9%), Food Preparation & Serving (423 | 3.6%), Security & Protection (405 | 3.4%), and Law Enforcement (279 | 2.4%).
Services Occupations by Sex
Within the Services occupations in San Luis, the most male-oriented occupations are Firefighting & Prevention (100.0%), Security & Protection (73.1%), and Cleaning & Maintenance (62.1%), while the most female-oriented occupations are Personal Care & Service (100.0%), Healthcare Support (68.7%), and Food Preparation & Serving (56.3%).
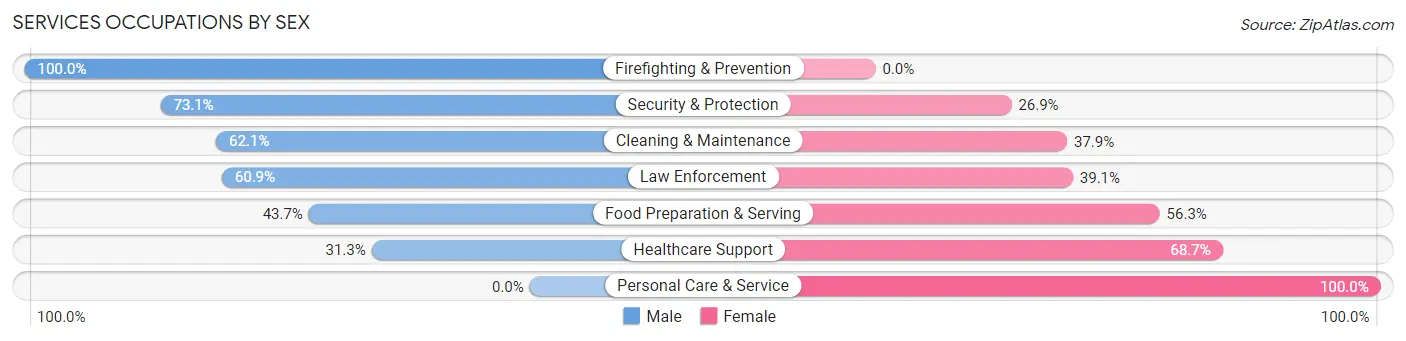
| Occupation | Male | Female |
| Healthcare Support | 144 (31.3%) | 316 (68.7%) |
| Security & Protection | 296 (73.1%) | 109 (26.9%) |
| Firefighting & Prevention | 126 (100.0%) | 0 (0.0%) |
| Law Enforcement | 170 (60.9%) | 109 (39.1%) |
| Food Preparation & Serving | 185 (43.7%) | 238 (56.3%) |
| Cleaning & Maintenance | 501 (62.1%) | 306 (37.9%) |
| Personal Care & Service | 0 (0.0%) | 225 (100.0%) |
| Total (Category) | 1,126 (48.5%) | 1,194 (51.5%) |
| Total (Overall) | 6,719 (56.7%) | 5,131 (43.3%) |
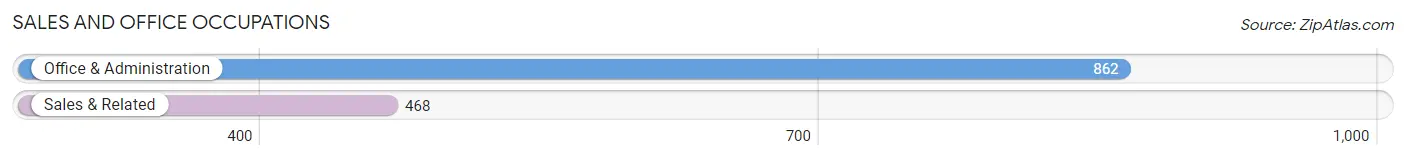
Sales and Office Occupations
The most common Sales and Office occupations in San Luis are Office & Administration (862 | 7.3%), and Sales & Related (468 | 4.0%).
Sales and Office Occupations by Sex
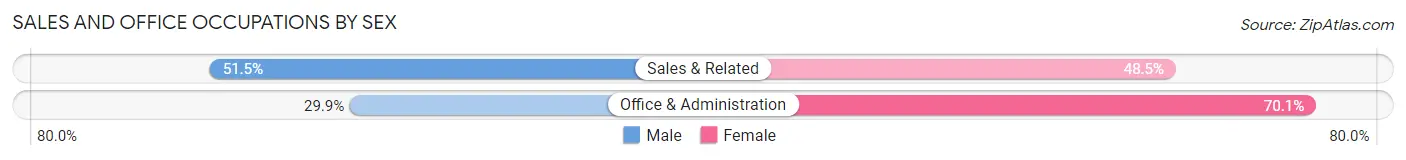
| Occupation | Male | Female |
| Sales & Related | 241 (51.5%) | 227 (48.5%) |
| Office & Administration | 258 (29.9%) | 604 (70.1%) |
| Total (Category) | 499 (37.5%) | 831 (62.5%) |
| Total (Overall) | 6,719 (56.7%) | 5,131 (43.3%) |
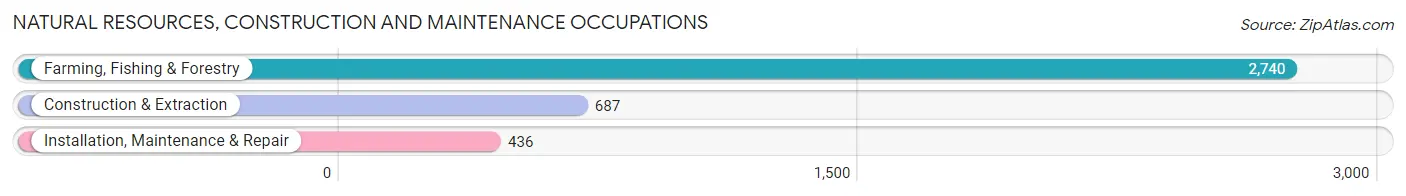
Natural Resources, Construction and Maintenance Occupations
The most common Natural Resources, Construction and Maintenance occupations in San Luis are Farming, Fishing & Forestry (2,740 | 23.1%), Construction & Extraction (687 | 5.8%), and Installation, Maintenance & Repair (436 | 3.7%).
Natural Resources, Construction and Maintenance Occupations by Sex
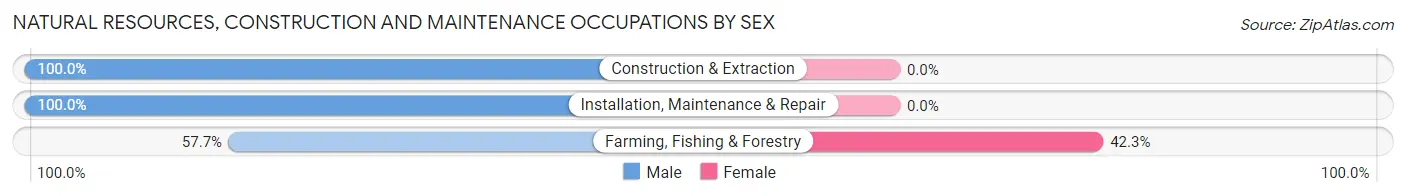
| Occupation | Male | Female |
| Farming, Fishing & Forestry | 1,581 (57.7%) | 1,159 (42.3%) |
| Construction & Extraction | 687 (100.0%) | 0 (0.0%) |
| Installation, Maintenance & Repair | 436 (100.0%) | 0 (0.0%) |
| Total (Category) | 2,704 (70.0%) | 1,159 (30.0%) |
| Total (Overall) | 6,719 (56.7%) | 5,131 (43.3%) |
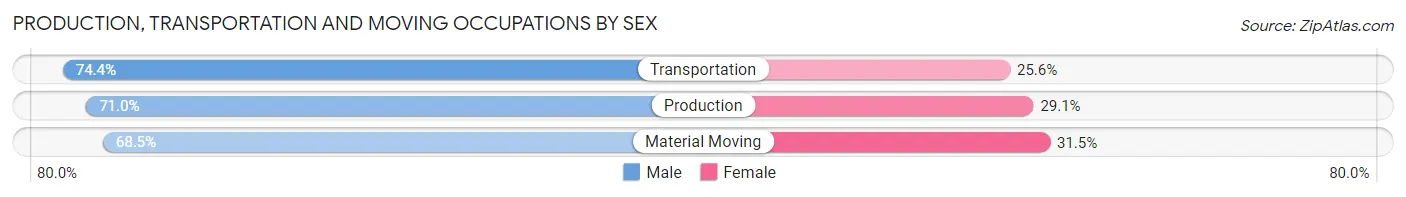
Production, Transportation and Moving Occupations
The most common Production, Transportation and Moving occupations in San Luis are Material Moving (832 | 7.0%), Production (754 | 6.4%), and Transportation (660 | 5.6%).
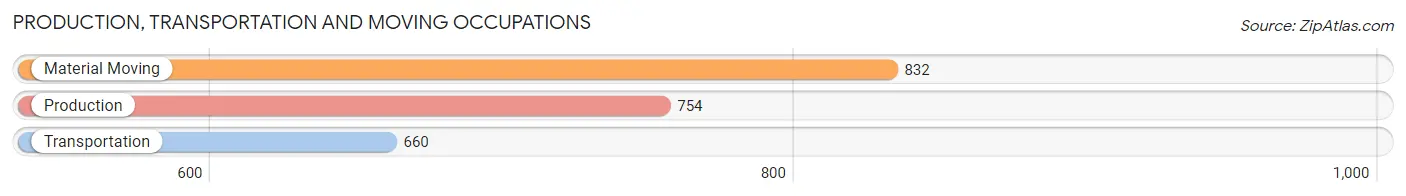
Production, Transportation and Moving Occupations by Sex
| Occupation | Male | Female |
| Production | 535 (71.0%) | 219 (29.0%) |
| Transportation | 491 (74.4%) | 169 (25.6%) |
| Material Moving | 570 (68.5%) | 262 (31.5%) |
| Total (Category) | 1,596 (71.1%) | 650 (28.9%) |
| Total (Overall) | 6,719 (56.7%) | 5,131 (43.3%) |
Employment Industries by Sex in San Luis
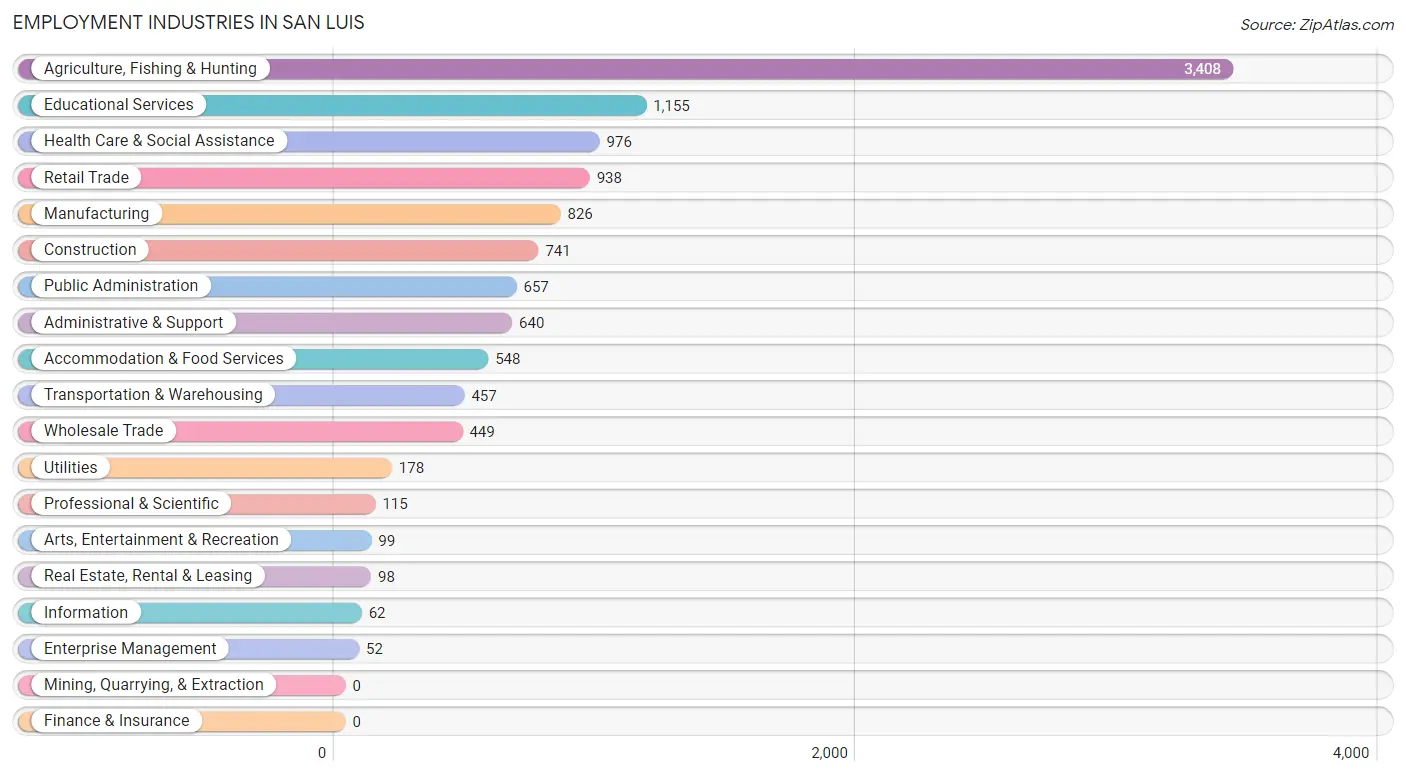
Employment Industries in San Luis
The major employment industries in San Luis include Agriculture, Fishing & Hunting (3,408 | 28.8%), Educational Services (1,155 | 9.8%), Health Care & Social Assistance (976 | 8.2%), Retail Trade (938 | 7.9%), and Manufacturing (826 | 7.0%).
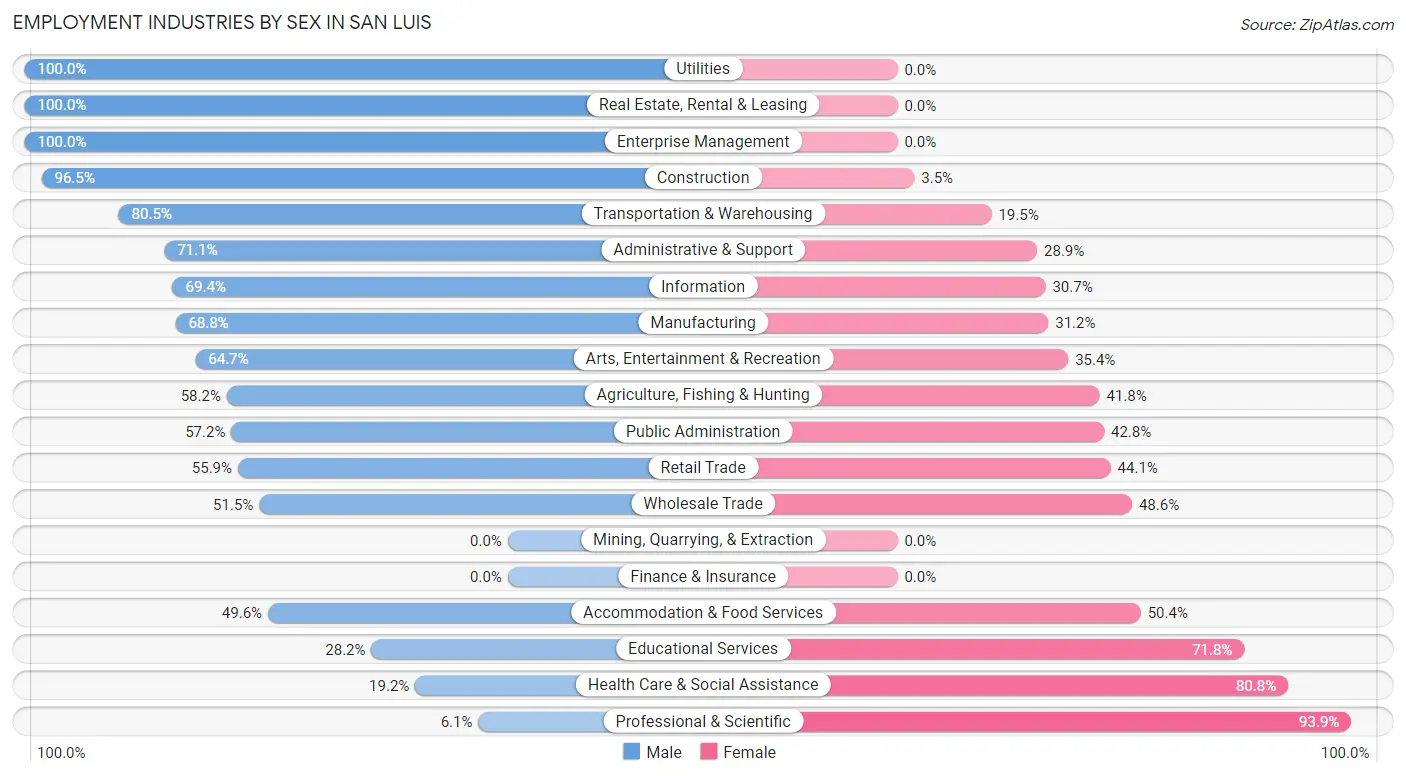
Employment Industries by Sex in San Luis
The San Luis industries that see more men than women are Utilities (100.0%), Real Estate, Rental & Leasing (100.0%), and Enterprise Management (100.0%), whereas the industries that tend to have a higher number of women are Professional & Scientific (93.9%), Health Care & Social Assistance (80.8%), and Educational Services (71.8%).
| Industry | Male | Female |
| Agriculture, Fishing & Hunting | 1,982 (58.2%) | 1,426 (41.8%) |
| Mining, Quarrying, & Extraction | 0 (0.0%) | 0 (0.0%) |
| Construction | 715 (96.5%) | 26 (3.5%) |
| Manufacturing | 568 (68.8%) | 258 (31.2%) |
| Wholesale Trade | 231 (51.4%) | 218 (48.5%) |
| Retail Trade | 524 (55.9%) | 414 (44.1%) |
| Transportation & Warehousing | 368 (80.5%) | 89 (19.5%) |
| Utilities | 178 (100.0%) | 0 (0.0%) |
| Information | 43 (69.4%) | 19 (30.6%) |
| Finance & Insurance | 0 (0.0%) | 0 (0.0%) |
| Real Estate, Rental & Leasing | 98 (100.0%) | 0 (0.0%) |
| Professional & Scientific | 7 (6.1%) | 108 (93.9%) |
| Enterprise Management | 52 (100.0%) | 0 (0.0%) |
| Administrative & Support | 455 (71.1%) | 185 (28.9%) |
| Educational Services | 326 (28.2%) | 829 (71.8%) |
| Health Care & Social Assistance | 187 (19.2%) | 789 (80.8%) |
| Arts, Entertainment & Recreation | 64 (64.6%) | 35 (35.3%) |
| Accommodation & Food Services | 272 (49.6%) | 276 (50.4%) |
| Public Administration | 376 (57.2%) | 281 (42.8%) |
| Total | 6,719 (56.7%) | 5,131 (43.3%) |
Education in San Luis
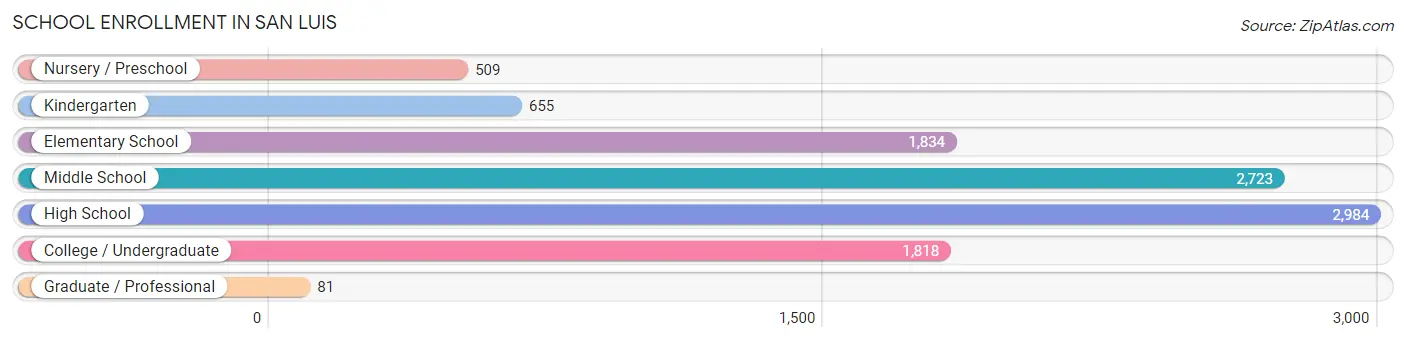
School Enrollment in San Luis
The most common levels of schooling among the 10,604 students in San Luis are high school (2,984 | 28.1%), middle school (2,723 | 25.7%), and elementary school (1,834 | 17.3%).
| School Level | # Students | % Students |
| Nursery / Preschool | 509 | 4.8% |
| Kindergarten | 655 | 6.2% |
| Elementary School | 1,834 | 17.3% |
| Middle School | 2,723 | 25.7% |
| High School | 2,984 | 28.1% |
| College / Undergraduate | 1,818 | 17.1% |
| Graduate / Professional | 81 | 0.8% |
| Total | 10,604 | 100.0% |
School Enrollment by Age by Funding Source in San Luis
Out of a total of 10,604 students who are enrolled in schools in San Luis, 95 (0.9%) attend a private institution, while the remaining 10,509 (99.1%) are enrolled in public schools. The age group of 35 years and over has the highest likelihood of being enrolled in private schools, with 38 (8.9% in the age bracket) enrolled. Conversely, the age group of 3 to 4 year olds has the lowest likelihood of being enrolled in a private school, with 649 (100.0% in the age bracket) attending a public institution.
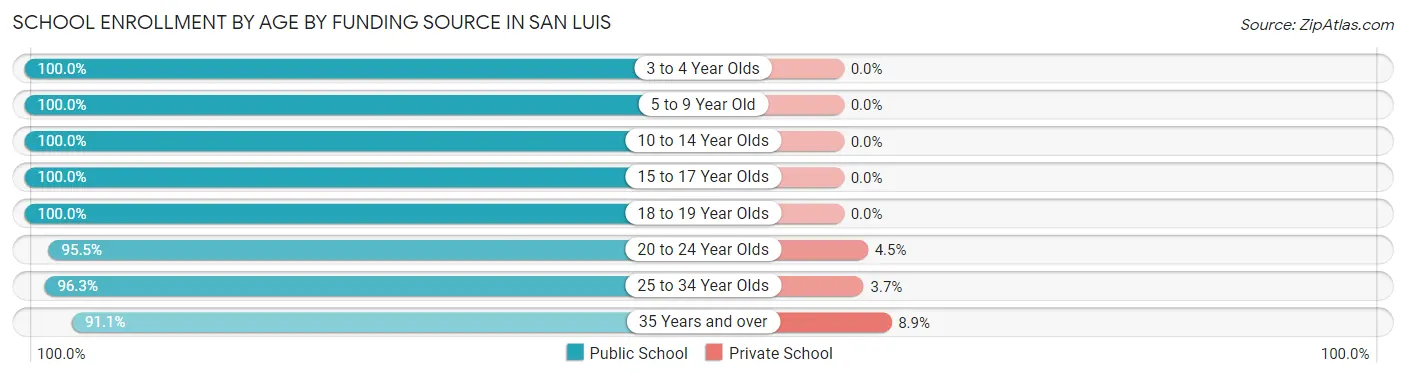
| Age Bracket | Public School | Private School |
| 3 to 4 Year Olds | 649 (100.0%) | 0 (0.0%) |
| 5 to 9 Year Old | 2,074 (100.0%) | 0 (0.0%) |
| 10 to 14 Year Olds | 3,312 (100.0%) | 0 (0.0%) |
| 15 to 17 Year Olds | 1,867 (100.0%) | 0 (0.0%) |
| 18 to 19 Year Olds | 957 (100.0%) | 0 (0.0%) |
| 20 to 24 Year Olds | 639 (95.5%) | 30 (4.5%) |
| 25 to 34 Year Olds | 623 (96.3%) | 24 (3.7%) |
| 35 Years and over | 391 (91.1%) | 38 (8.9%) |
| Total | 10,509 (99.1%) | 95 (0.9%) |
Educational Attainment by Field of Study in San Luis
Education (467 | 22.7%), business (449 | 21.8%), arts & humanities (183 | 8.9%), liberal arts & history (181 | 8.8%), and science & technology (150 | 7.3%) are the most common fields of study among 2,058 individuals in San Luis who have obtained a bachelor's degree or higher.
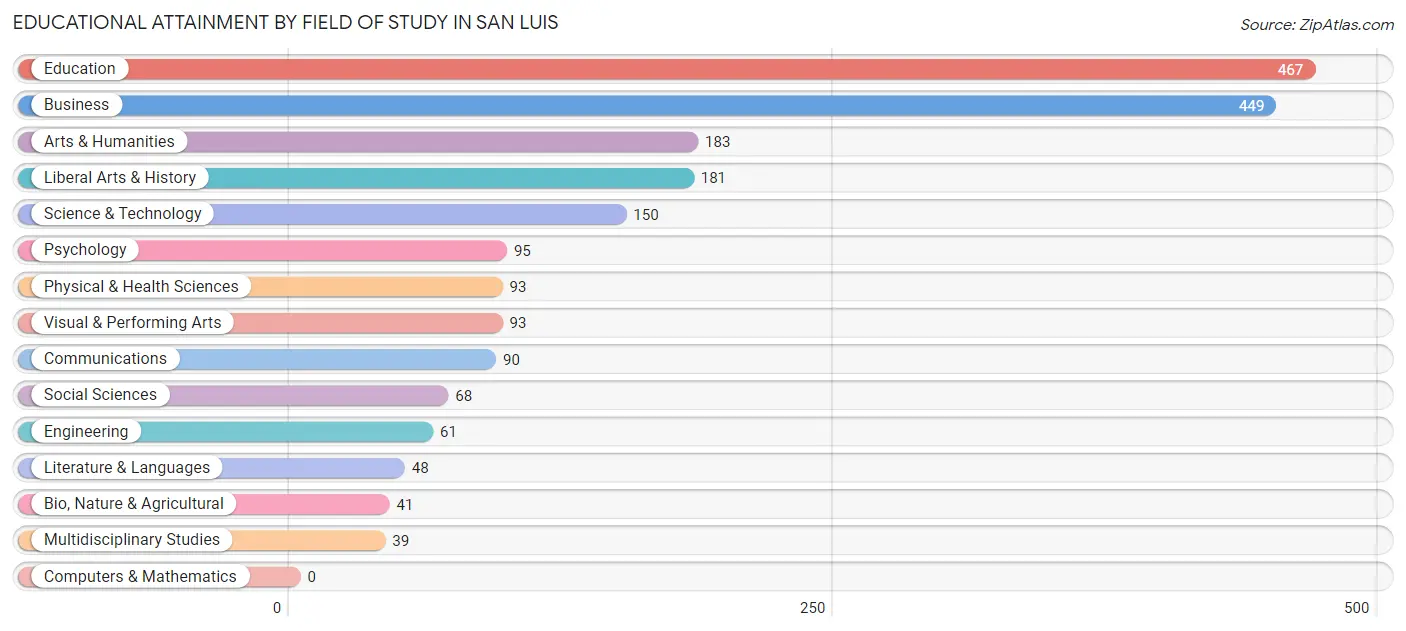
| Field of Study | # Graduates | % Graduates |
| Computers & Mathematics | 0 | 0.0% |
| Bio, Nature & Agricultural | 41 | 2.0% |
| Physical & Health Sciences | 93 | 4.5% |
| Psychology | 95 | 4.6% |
| Social Sciences | 68 | 3.3% |
| Engineering | 61 | 3.0% |
| Multidisciplinary Studies | 39 | 1.9% |
| Science & Technology | 150 | 7.3% |
| Business | 449 | 21.8% |
| Education | 467 | 22.7% |
| Literature & Languages | 48 | 2.3% |
| Liberal Arts & History | 181 | 8.8% |
| Visual & Performing Arts | 93 | 4.5% |
| Communications | 90 | 4.4% |
| Arts & Humanities | 183 | 8.9% |
| Total | 2,058 | 100.0% |
Transportation & Commute in San Luis
Vehicle Availability by Sex in San Luis
The most prevalent vehicle ownership categories in San Luis are males with 2 vehicles (2,107, accounting for 31.7%) and females with 2 vehicles (1,858, making up 42.7%).
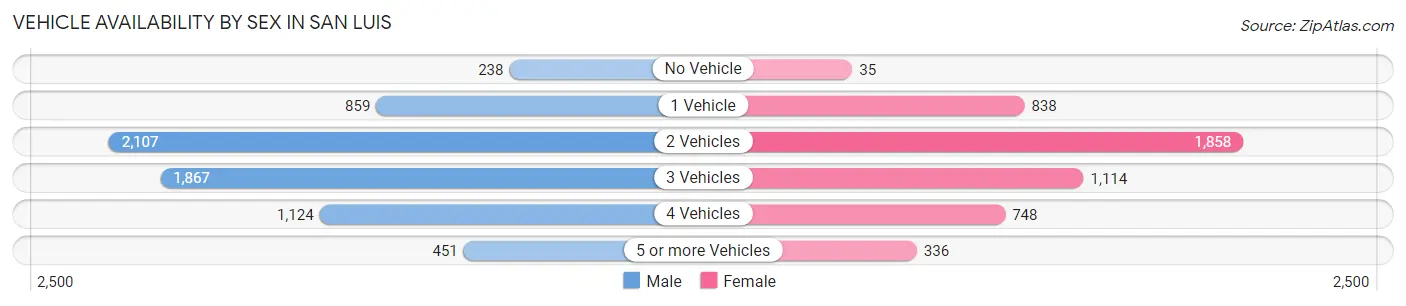
| Vehicles Available | Male | Female |
| No Vehicle | 238 (3.6%) | 35 (0.7%) |
| 1 Vehicle | 859 (12.9%) | 838 (17.0%) |
| 2 Vehicles | 2,107 (31.7%) | 1,858 (37.7%) |
| 3 Vehicles | 1,867 (28.1%) | 1,114 (22.6%) |
| 4 Vehicles | 1,124 (16.9%) | 748 (15.2%) |
| 5 or more Vehicles | 451 (6.8%) | 336 (6.8%) |
| Total | 6,646 (100.0%) | 4,929 (100.0%) |
Commute Time in San Luis
The most frequently occuring commute durations in San Luis are 30 to 34 minutes (2,137 commuters, 19.6%), 40 to 44 minutes (1,383 commuters, 12.7%), and 10 to 14 minutes (1,163 commuters, 10.6%).
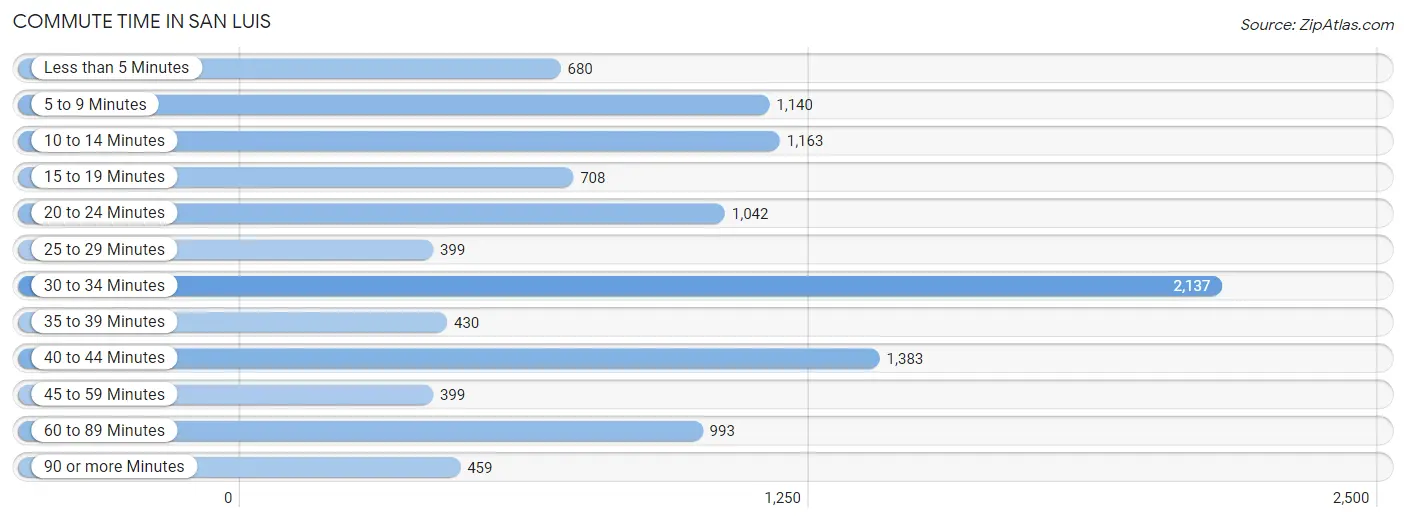
| Commute Time | # Commuters | % Commuters |
| Less than 5 Minutes | 680 | 6.2% |
| 5 to 9 Minutes | 1,140 | 10.4% |
| 10 to 14 Minutes | 1,163 | 10.6% |
| 15 to 19 Minutes | 708 | 6.5% |
| 20 to 24 Minutes | 1,042 | 9.5% |
| 25 to 29 Minutes | 399 | 3.6% |
| 30 to 34 Minutes | 2,137 | 19.6% |
| 35 to 39 Minutes | 430 | 3.9% |
| 40 to 44 Minutes | 1,383 | 12.7% |
| 45 to 59 Minutes | 399 | 3.6% |
| 60 to 89 Minutes | 993 | 9.1% |
| 90 or more Minutes | 459 | 4.2% |
Commute Time by Sex in San Luis
The most common commute times in San Luis are 30 to 34 minutes (1,269 commuters, 20.1%) for males and 30 to 34 minutes (868 commuters, 18.8%) for females.
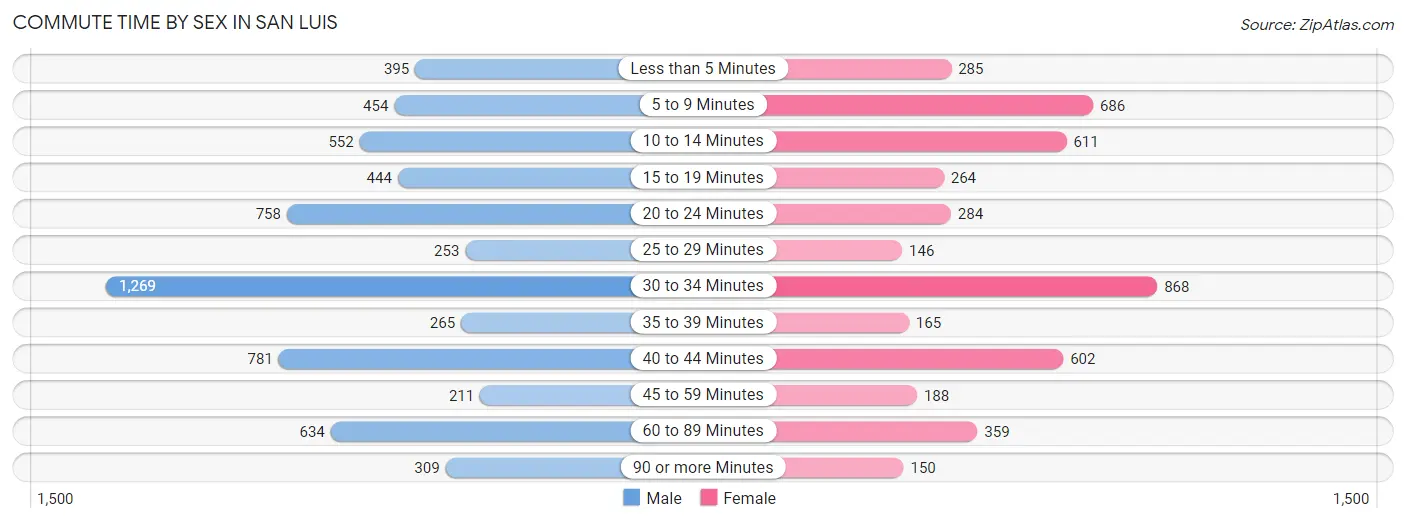
| Commute Time | Male | Female |
| Less than 5 Minutes | 395 (6.2%) | 285 (6.2%) |
| 5 to 9 Minutes | 454 (7.2%) | 686 (14.9%) |
| 10 to 14 Minutes | 552 (8.7%) | 611 (13.3%) |
| 15 to 19 Minutes | 444 (7.0%) | 264 (5.7%) |
| 20 to 24 Minutes | 758 (12.0%) | 284 (6.2%) |
| 25 to 29 Minutes | 253 (4.0%) | 146 (3.2%) |
| 30 to 34 Minutes | 1,269 (20.1%) | 868 (18.8%) |
| 35 to 39 Minutes | 265 (4.2%) | 165 (3.6%) |
| 40 to 44 Minutes | 781 (12.3%) | 602 (13.1%) |
| 45 to 59 Minutes | 211 (3.3%) | 188 (4.1%) |
| 60 to 89 Minutes | 634 (10.0%) | 359 (7.8%) |
| 90 or more Minutes | 309 (4.9%) | 150 (3.3%) |
Time of Departure to Work by Sex in San Luis
The most frequent times of departure to work in San Luis are 12:00 AM to 4:59 AM (1,306, 20.6%) for males and 12:00 AM to 4:59 AM (670, 14.5%) for females.
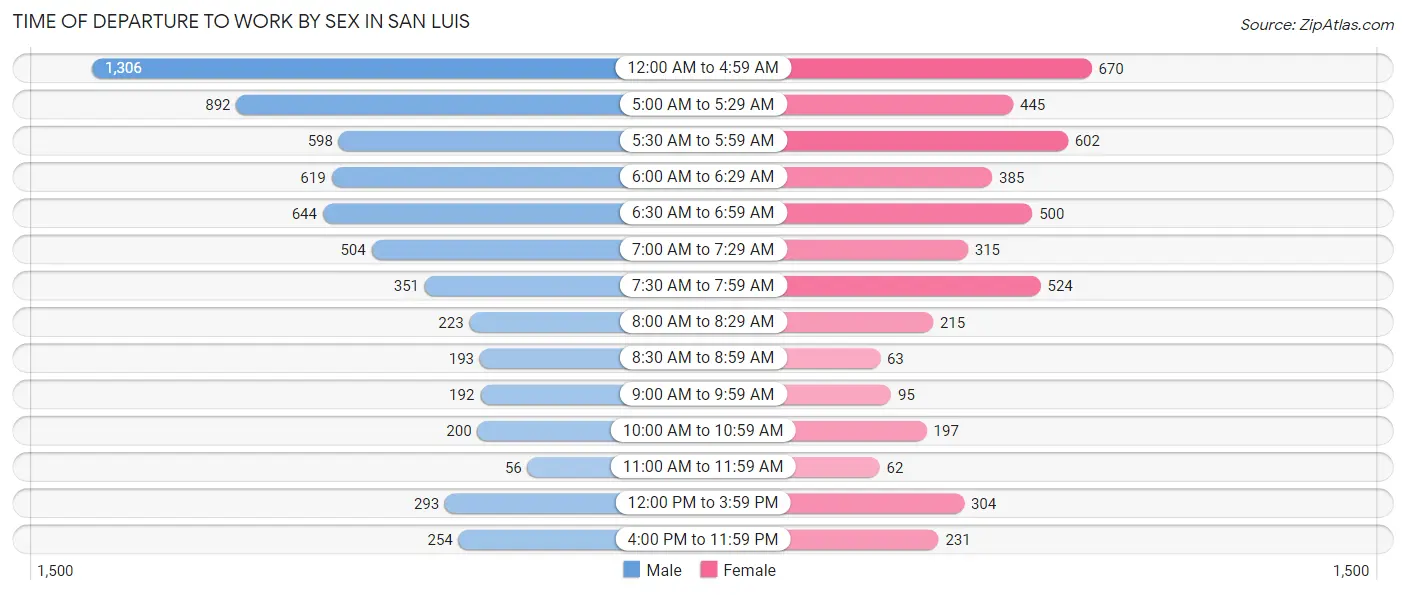
| Time of Departure | Male | Female |
| 12:00 AM to 4:59 AM | 1,306 (20.6%) | 670 (14.5%) |
| 5:00 AM to 5:29 AM | 892 (14.1%) | 445 (9.7%) |
| 5:30 AM to 5:59 AM | 598 (9.5%) | 602 (13.1%) |
| 6:00 AM to 6:29 AM | 619 (9.8%) | 385 (8.4%) |
| 6:30 AM to 6:59 AM | 644 (10.2%) | 500 (10.8%) |
| 7:00 AM to 7:29 AM | 504 (8.0%) | 315 (6.8%) |
| 7:30 AM to 7:59 AM | 351 (5.6%) | 524 (11.4%) |
| 8:00 AM to 8:29 AM | 223 (3.5%) | 215 (4.7%) |
| 8:30 AM to 8:59 AM | 193 (3.0%) | 63 (1.4%) |
| 9:00 AM to 9:59 AM | 192 (3.0%) | 95 (2.1%) |
| 10:00 AM to 10:59 AM | 200 (3.2%) | 197 (4.3%) |
| 11:00 AM to 11:59 AM | 56 (0.9%) | 62 (1.3%) |
| 12:00 PM to 3:59 PM | 293 (4.6%) | 304 (6.6%) |
| 4:00 PM to 11:59 PM | 254 (4.0%) | 231 (5.0%) |
| Total | 6,325 (100.0%) | 4,608 (100.0%) |
Housing Occupancy in San Luis
Occupancy by Ownership in San Luis
Of the total 8,846 dwellings in San Luis, owner-occupied units account for 5,701 (64.4%), while renter-occupied units make up 3,145 (35.5%).
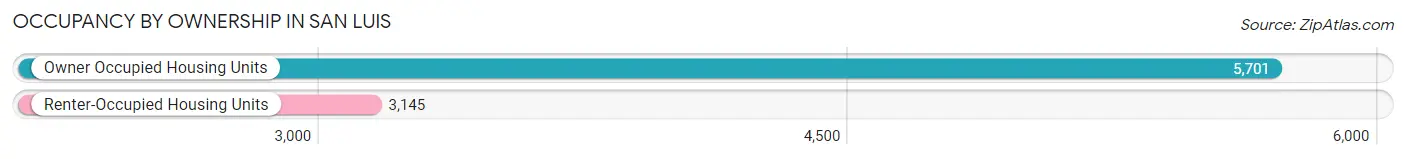
| Occupancy | # Housing Units | % Housing Units |
| Owner Occupied Housing Units | 5,701 | 64.4% |
| Renter-Occupied Housing Units | 3,145 | 35.5% |
| Total Occupied Housing Units | 8,846 | 100.0% |
Occupancy by Household Size in San Luis
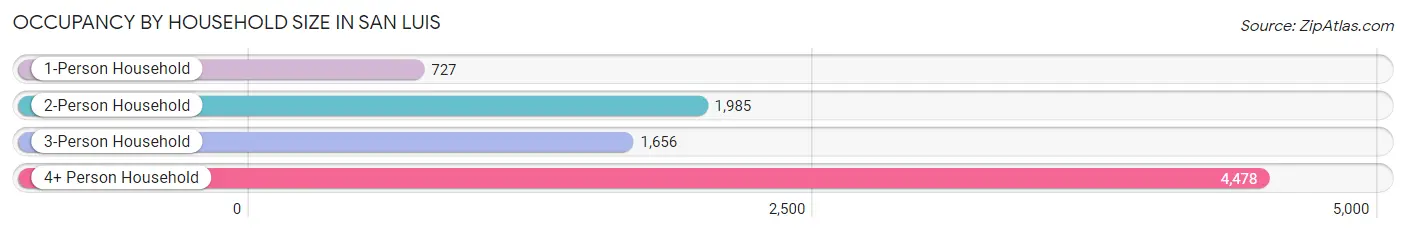
| Household Size | # Housing Units | % Housing Units |
| 1-Person Household | 727 | 8.2% |
| 2-Person Household | 1,985 | 22.4% |
| 3-Person Household | 1,656 | 18.7% |
| 4+ Person Household | 4,478 | 50.6% |
| Total Housing Units | 8,846 | 100.0% |
Occupancy by Ownership by Household Size in San Luis
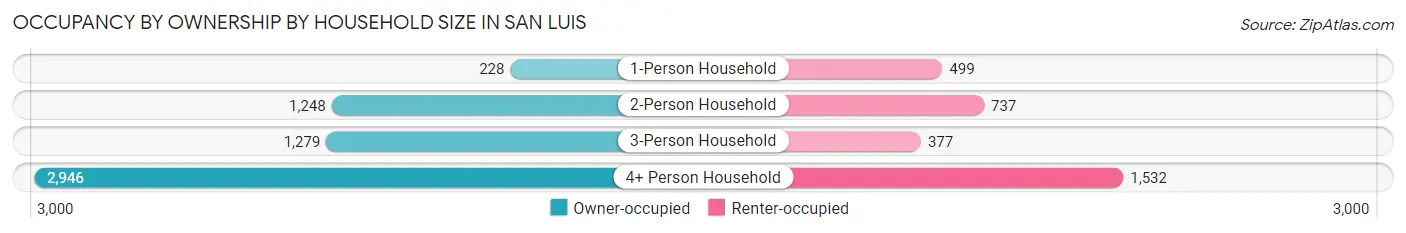
| Household Size | Owner-occupied | Renter-occupied |
| 1-Person Household | 228 (31.4%) | 499 (68.6%) |
| 2-Person Household | 1,248 (62.9%) | 737 (37.1%) |
| 3-Person Household | 1,279 (77.2%) | 377 (22.8%) |
| 4+ Person Household | 2,946 (65.8%) | 1,532 (34.2%) |
| Total Housing Units | 5,701 (64.4%) | 3,145 (35.5%) |
Occupancy by Educational Attainment in San Luis
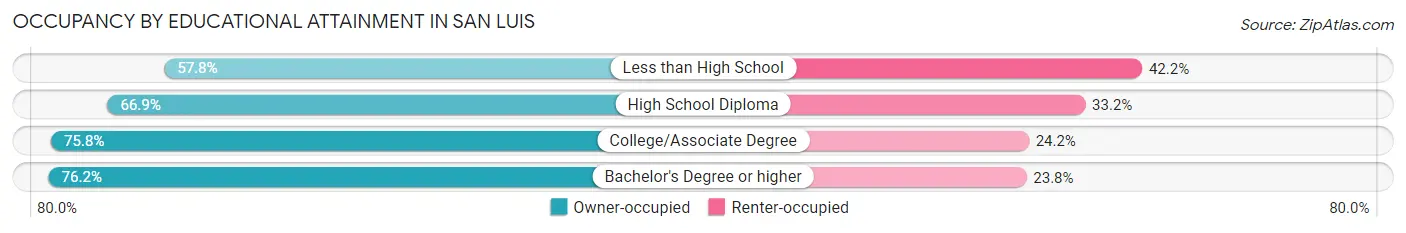
| Household Size | Owner-occupied | Renter-occupied |
| Less than High School | 2,876 (57.8%) | 2,096 (42.2%) |
| High School Diploma | 859 (66.8%) | 426 (33.2%) |
| College/Associate Degree | 1,304 (75.8%) | 416 (24.2%) |
| Bachelor's Degree or higher | 662 (76.2%) | 207 (23.8%) |
Occupancy by Age of Householder in San Luis
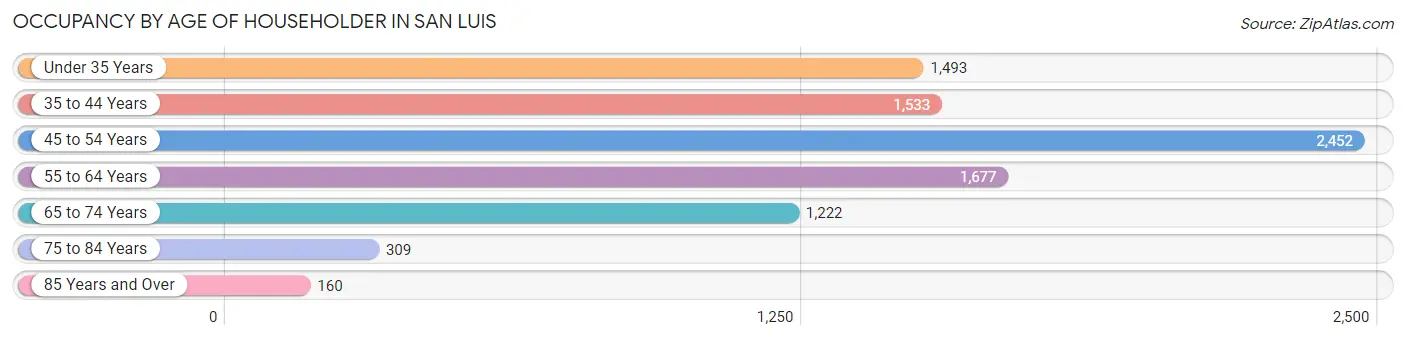
| Age Bracket | # Households | % Households |
| Under 35 Years | 1,493 | 16.9% |
| 35 to 44 Years | 1,533 | 17.3% |
| 45 to 54 Years | 2,452 | 27.7% |
| 55 to 64 Years | 1,677 | 19.0% |
| 65 to 74 Years | 1,222 | 13.8% |
| 75 to 84 Years | 309 | 3.5% |
| 85 Years and Over | 160 | 1.8% |
| Total | 8,846 | 100.0% |
Housing Finances in San Luis
Median Income by Occupancy in San Luis
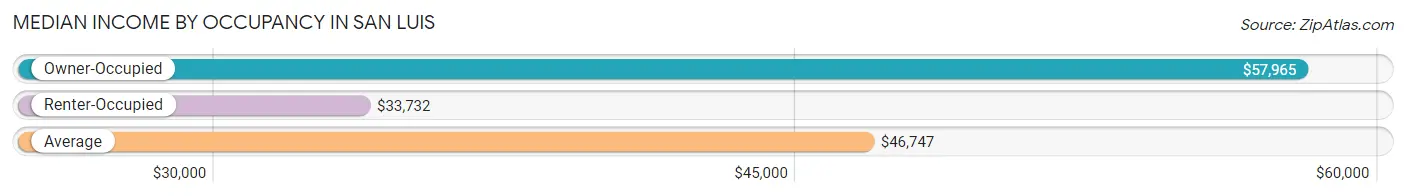
| Occupancy Type | # Households | Median Income |
| Owner-Occupied | 5,701 (64.4%) | $57,965 |
| Renter-Occupied | 3,145 (35.5%) | $33,732 |
| Average | 8,846 (100.0%) | $46,747 |
Occupancy by Householder Income Bracket in San Luis
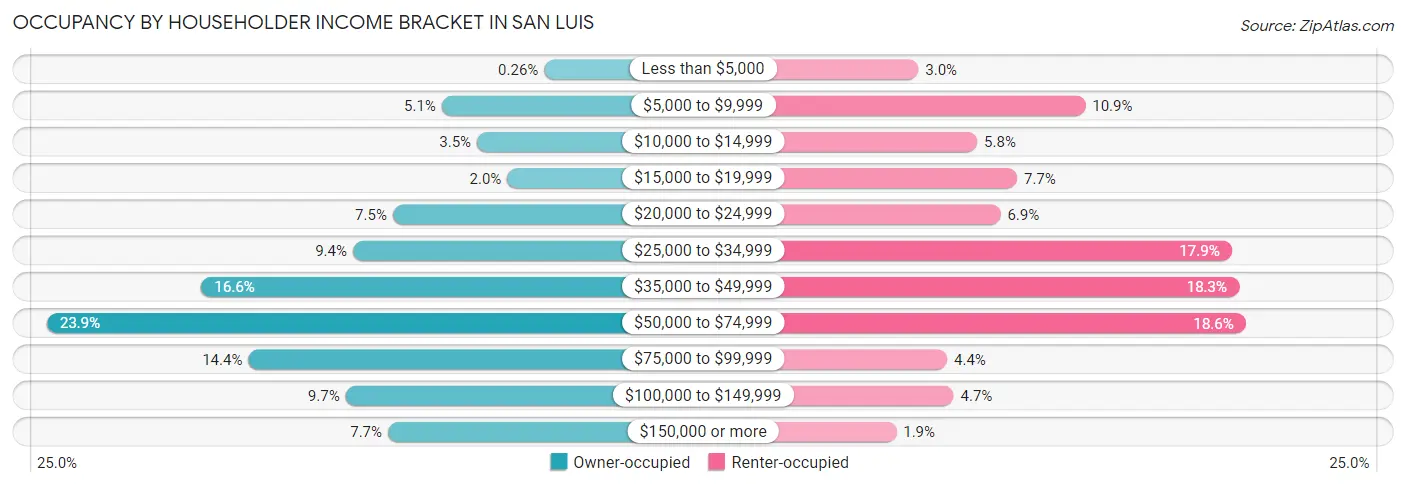
| Income Bracket | Owner-occupied | Renter-occupied |
| Less than $5,000 | 15 (0.3%) | 94 (3.0%) |
| $5,000 to $9,999 | 293 (5.1%) | 344 (10.9%) |
| $10,000 to $14,999 | 197 (3.5%) | 182 (5.8%) |
| $15,000 to $19,999 | 115 (2.0%) | 242 (7.7%) |
| $20,000 to $24,999 | 426 (7.5%) | 217 (6.9%) |
| $25,000 to $34,999 | 534 (9.4%) | 563 (17.9%) |
| $35,000 to $49,999 | 945 (16.6%) | 574 (18.2%) |
| $50,000 to $74,999 | 1,365 (23.9%) | 584 (18.6%) |
| $75,000 to $99,999 | 818 (14.3%) | 137 (4.4%) |
| $100,000 to $149,999 | 554 (9.7%) | 147 (4.7%) |
| $150,000 or more | 439 (7.7%) | 61 (1.9%) |
| Total | 5,701 (100.0%) | 3,145 (100.0%) |
Monthly Housing Cost Tiers in San Luis
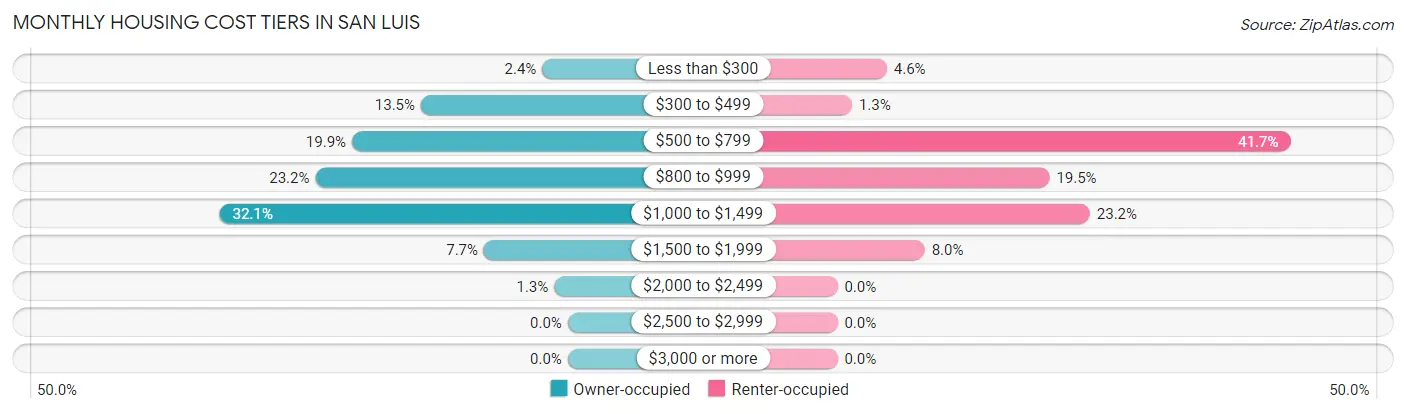
| Monthly Cost | Owner-occupied | Renter-occupied |
| Less than $300 | 134 (2.4%) | 143 (4.5%) |
| $300 to $499 | 771 (13.5%) | 42 (1.3%) |
| $500 to $799 | 1,133 (19.9%) | 1,311 (41.7%) |
| $800 to $999 | 1,325 (23.2%) | 614 (19.5%) |
| $1,000 to $1,499 | 1,827 (32.1%) | 731 (23.2%) |
| $1,500 to $1,999 | 440 (7.7%) | 253 (8.0%) |
| $2,000 to $2,499 | 71 (1.3%) | 0 (0.0%) |
| $2,500 to $2,999 | 0 (0.0%) | 0 (0.0%) |
| $3,000 or more | 0 (0.0%) | 0 (0.0%) |
| Total | 5,701 (100.0%) | 3,145 (100.0%) |
Physical Housing Characteristics in San Luis
Housing Structures in San Luis
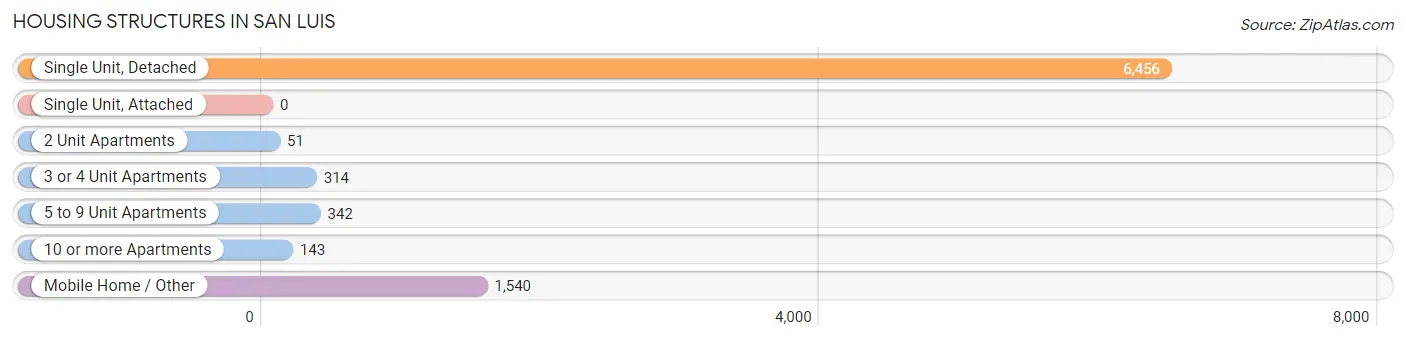
| Structure Type | # Housing Units | % Housing Units |
| Single Unit, Detached | 6,456 | 73.0% |
| Single Unit, Attached | 0 | 0.0% |
| 2 Unit Apartments | 51 | 0.6% |
| 3 or 4 Unit Apartments | 314 | 3.5% |
| 5 to 9 Unit Apartments | 342 | 3.9% |
| 10 or more Apartments | 143 | 1.6% |
| Mobile Home / Other | 1,540 | 17.4% |
| Total | 8,846 | 100.0% |
Housing Structures by Occupancy in San Luis
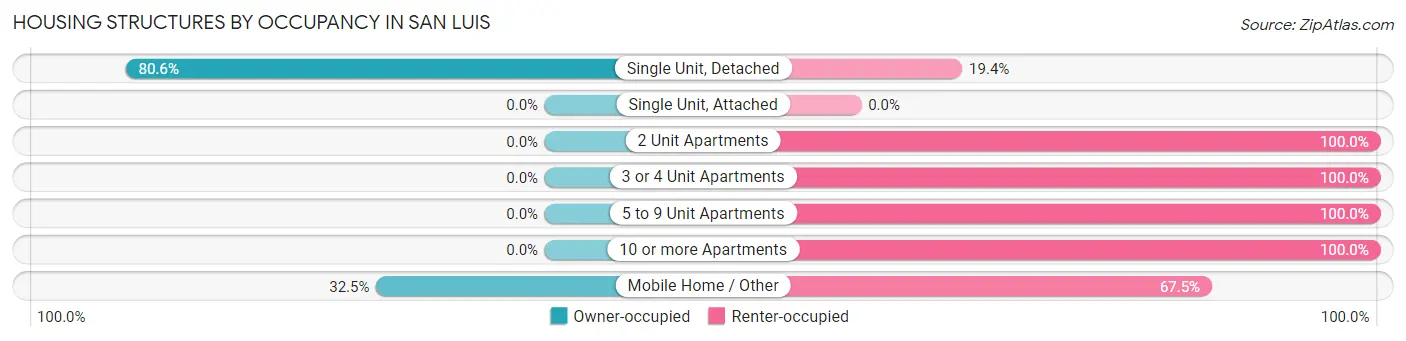
| Structure Type | Owner-occupied | Renter-occupied |
| Single Unit, Detached | 5,201 (80.6%) | 1,255 (19.4%) |
| Single Unit, Attached | 0 (0.0%) | 0 (0.0%) |
| 2 Unit Apartments | 0 (0.0%) | 51 (100.0%) |
| 3 or 4 Unit Apartments | 0 (0.0%) | 314 (100.0%) |
| 5 to 9 Unit Apartments | 0 (0.0%) | 342 (100.0%) |
| 10 or more Apartments | 0 (0.0%) | 143 (100.0%) |
| Mobile Home / Other | 500 (32.5%) | 1,040 (67.5%) |
| Total | 5,701 (64.4%) | 3,145 (35.5%) |
Housing Structures by Number of Rooms in San Luis
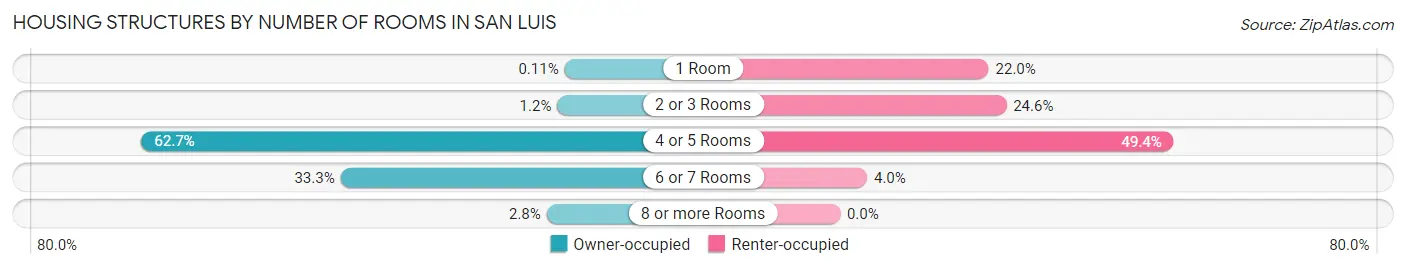
| Number of Rooms | Owner-occupied | Renter-occupied |
| 1 Room | 6 (0.1%) | 692 (22.0%) |
| 2 or 3 Rooms | 67 (1.2%) | 774 (24.6%) |
| 4 or 5 Rooms | 3,575 (62.7%) | 1,553 (49.4%) |
| 6 or 7 Rooms | 1,896 (33.3%) | 126 (4.0%) |
| 8 or more Rooms | 157 (2.8%) | 0 (0.0%) |
| Total | 5,701 (100.0%) | 3,145 (100.0%) |
Housing Structure by Heating Type in San Luis
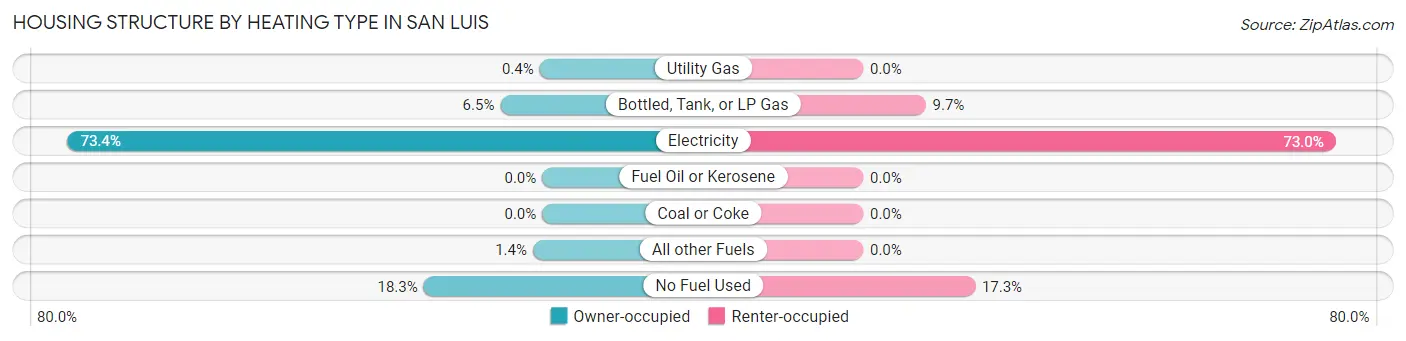
| Heating Type | Owner-occupied | Renter-occupied |
| Utility Gas | 23 (0.4%) | 0 (0.0%) |
| Bottled, Tank, or LP Gas | 369 (6.5%) | 304 (9.7%) |
| Electricity | 4,182 (73.4%) | 2,297 (73.0%) |
| Fuel Oil or Kerosene | 0 (0.0%) | 0 (0.0%) |
| Coal or Coke | 0 (0.0%) | 0 (0.0%) |
| All other Fuels | 82 (1.4%) | 0 (0.0%) |
| No Fuel Used | 1,045 (18.3%) | 544 (17.3%) |
| Total | 5,701 (100.0%) | 3,145 (100.0%) |
Household Vehicle Usage in San Luis
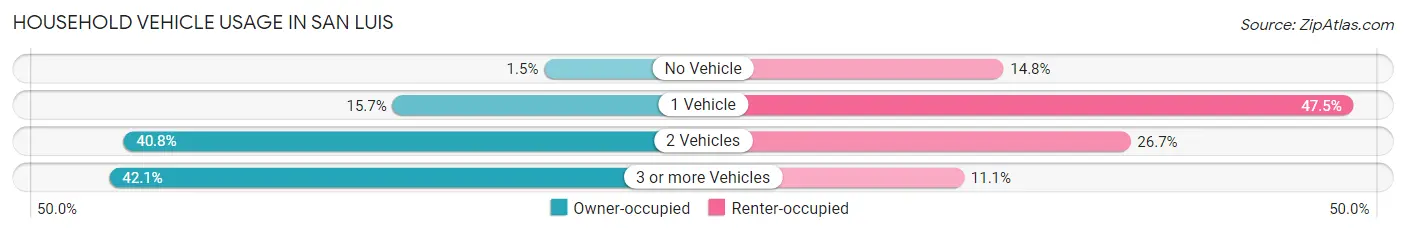
| Vehicles per Household | Owner-occupied | Renter-occupied |
| No Vehicle | 85 (1.5%) | 465 (14.8%) |
| 1 Vehicle | 892 (15.7%) | 1,493 (47.5%) |
| 2 Vehicles | 2,325 (40.8%) | 838 (26.7%) |
| 3 or more Vehicles | 2,399 (42.1%) | 349 (11.1%) |
| Total | 5,701 (100.0%) | 3,145 (100.0%) |
Real Estate & Mortgages in San Luis
Real Estate and Mortgage Overview in San Luis
| Characteristic | Without Mortgage | With Mortgage |
| Housing Units | 1,229 | 4,472 |
| Median Property Value | $145,300 | $180,700 |
| Median Household Income | $41,051 | $380 |
| Monthly Housing Costs | $426 | $0 |
| Real Estate Taxes | $1,155 | $0 |
Property Value by Mortgage Status in San Luis
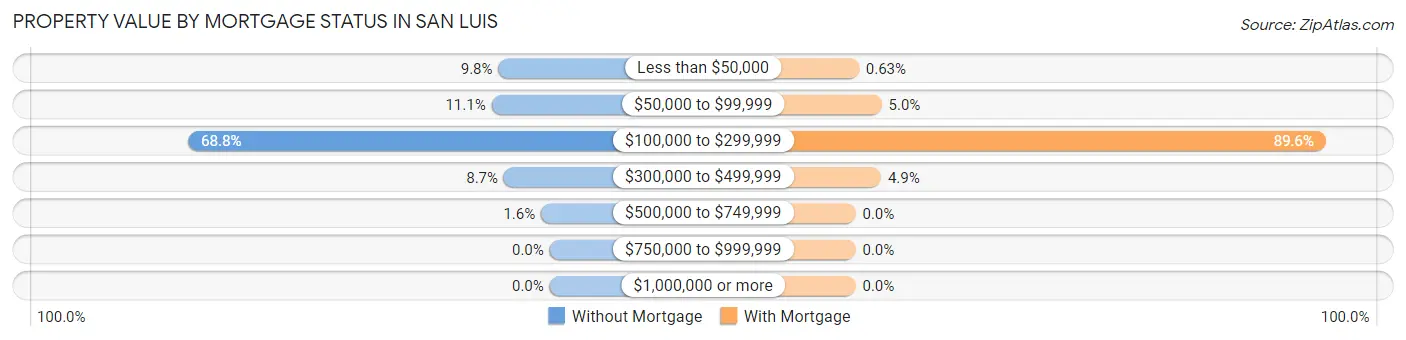
| Property Value | Without Mortgage | With Mortgage |
| Less than $50,000 | 120 (9.8%) | 28 (0.6%) |
| $50,000 to $99,999 | 136 (11.1%) | 222 (5.0%) |
| $100,000 to $299,999 | 846 (68.8%) | 4,005 (89.6%) |
| $300,000 to $499,999 | 107 (8.7%) | 217 (4.9%) |
| $500,000 to $749,999 | 20 (1.6%) | 0 (0.0%) |
| $750,000 to $999,999 | 0 (0.0%) | 0 (0.0%) |
| $1,000,000 or more | 0 (0.0%) | 0 (0.0%) |
| Total | 1,229 (100.0%) | 4,472 (100.0%) |
Household Income by Mortgage Status in San Luis
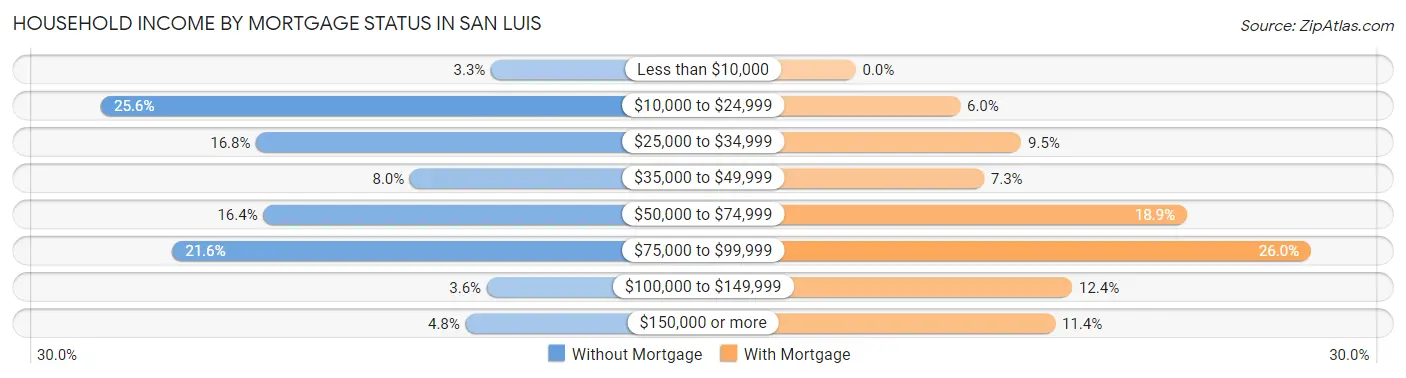
| Household Income | Without Mortgage | With Mortgage |
| Less than $10,000 | 41 (3.3%) | 0 (0.0%) |
| $10,000 to $24,999 | 315 (25.6%) | 267 (6.0%) |
| $25,000 to $34,999 | 206 (16.8%) | 423 (9.5%) |
| $35,000 to $49,999 | 98 (8.0%) | 328 (7.3%) |
| $50,000 to $74,999 | 201 (16.4%) | 847 (18.9%) |
| $75,000 to $99,999 | 265 (21.6%) | 1,164 (26.0%) |
| $100,000 to $149,999 | 44 (3.6%) | 553 (12.4%) |
| $150,000 or more | 59 (4.8%) | 510 (11.4%) |
| Total | 1,229 (100.0%) | 4,472 (100.0%) |
Property Value to Household Income Ratio in San Luis
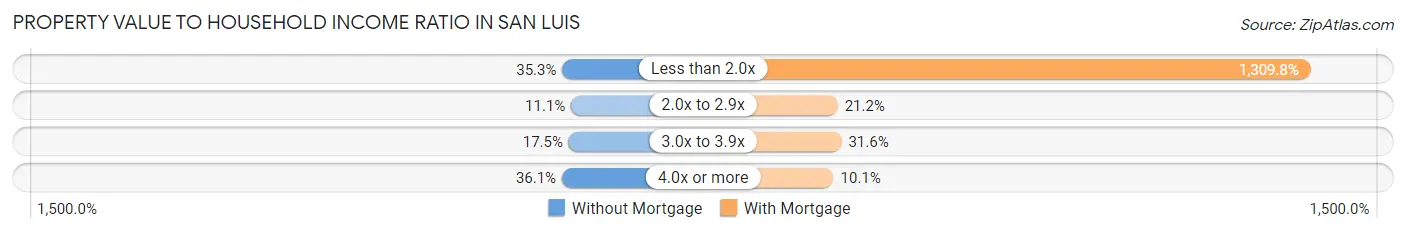
| Value-to-Income Ratio | Without Mortgage | With Mortgage |
| Less than 2.0x | 434 (35.3%) | 58,572 (1,309.8%) |
| 2.0x to 2.9x | 136 (11.1%) | 949 (21.2%) |
| 3.0x to 3.9x | 215 (17.5%) | 1,411 (31.6%) |
| 4.0x or more | 444 (36.1%) | 451 (10.1%) |
| Total | 1,229 (100.0%) | 4,472 (100.0%) |
Real Estate Taxes by Mortgage Status in San Luis
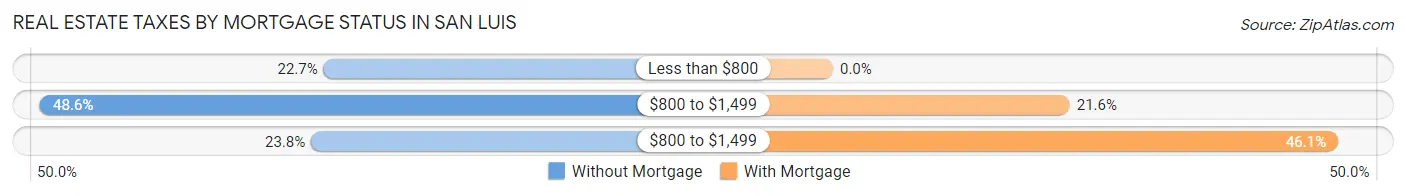
| Property Taxes | Without Mortgage | With Mortgage |
| Less than $800 | 279 (22.7%) | 0 (0.0%) |
| $800 to $1,499 | 597 (48.6%) | 967 (21.6%) |
| $800 to $1,499 | 293 (23.8%) | 2,062 (46.1%) |
| Total | 1,229 (100.0%) | 4,472 (100.0%) |
Health & Disability in San Luis
Health Insurance Coverage by Age in San Luis
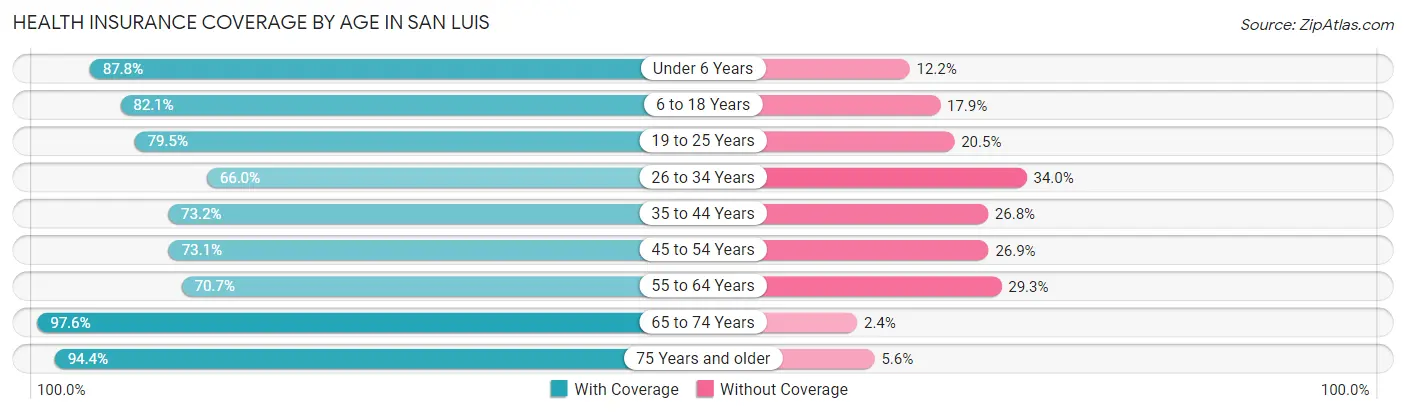
| Age Bracket | With Coverage | Without Coverage |
| Under 6 Years | 2,743 (87.8%) | 380 (12.2%) |
| 6 to 18 Years | 6,490 (82.1%) | 1,411 (17.9%) |
| 19 to 25 Years | 2,753 (79.5%) | 710 (20.5%) |
| 26 to 34 Years | 2,528 (66.0%) | 1,302 (34.0%) |
| 35 to 44 Years | 2,217 (73.2%) | 811 (26.8%) |
| 45 to 54 Years | 2,903 (73.1%) | 1,067 (26.9%) |
| 55 to 64 Years | 2,233 (70.7%) | 924 (29.3%) |
| 65 to 74 Years | 2,130 (97.6%) | 52 (2.4%) |
| 75 Years and older | 1,089 (94.4%) | 65 (5.6%) |
| Total | 25,086 (78.9%) | 6,722 (21.1%) |
Health Insurance Coverage by Citizenship Status in San Luis
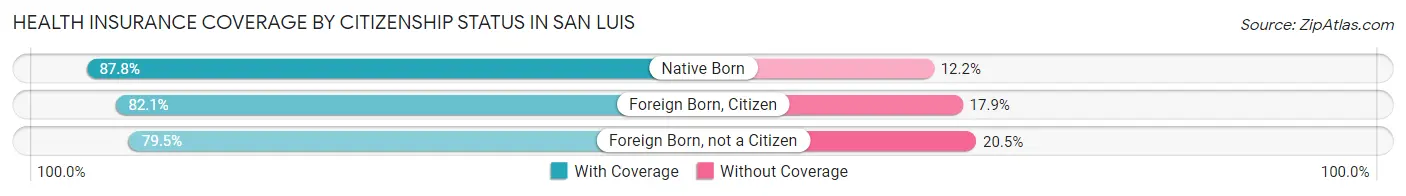
| Citizenship Status | With Coverage | Without Coverage |
| Native Born | 2,743 (87.8%) | 380 (12.2%) |
| Foreign Born, Citizen | 6,490 (82.1%) | 1,411 (17.9%) |
| Foreign Born, not a Citizen | 2,753 (79.5%) | 710 (20.5%) |
Health Insurance Coverage by Household Income in San Luis
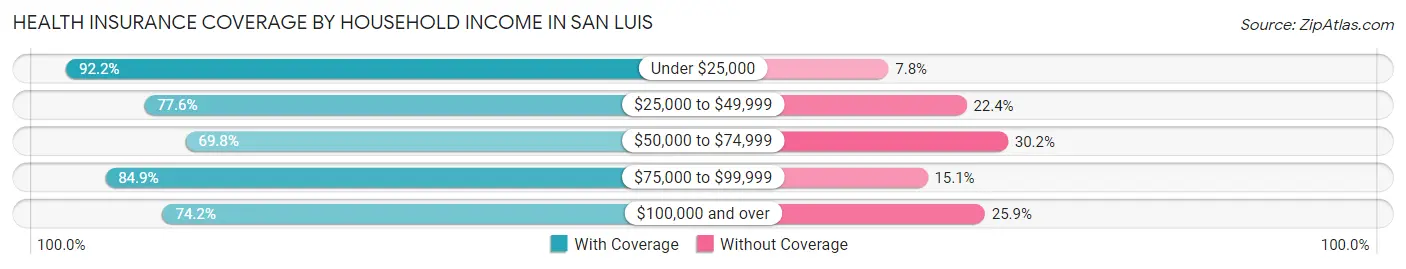
| Household Income | With Coverage | Without Coverage |
| Under $25,000 | 5,934 (92.2%) | 501 (7.8%) |
| $25,000 to $49,999 | 6,466 (77.6%) | 1,869 (22.4%) |
| $50,000 to $74,999 | 5,133 (69.8%) | 2,217 (30.2%) |
| $75,000 to $99,999 | 2,877 (84.9%) | 512 (15.1%) |
| $100,000 and over | 4,656 (74.2%) | 1,623 (25.9%) |
Public vs Private Health Insurance Coverage by Age in San Luis
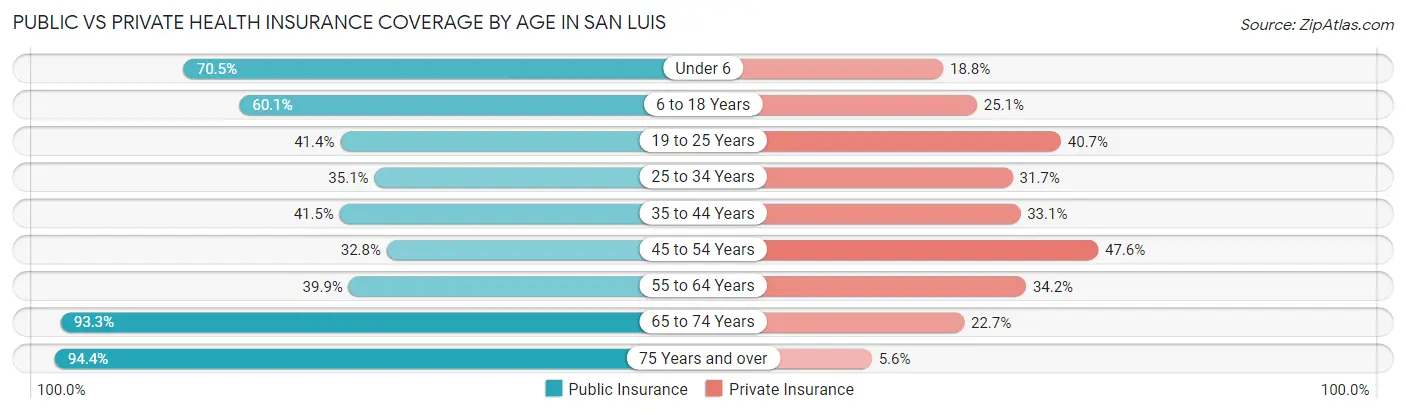
| Age Bracket | Public Insurance | Private Insurance |
| Under 6 | 2,200 (70.5%) | 587 (18.8%) |
| 6 to 18 Years | 4,752 (60.1%) | 1,981 (25.1%) |
| 19 to 25 Years | 1,434 (41.4%) | 1,408 (40.7%) |
| 25 to 34 Years | 1,343 (35.1%) | 1,214 (31.7%) |
| 35 to 44 Years | 1,257 (41.5%) | 1,003 (33.1%) |
| 45 to 54 Years | 1,301 (32.8%) | 1,888 (47.6%) |
| 55 to 64 Years | 1,258 (39.9%) | 1,079 (34.2%) |
| 65 to 74 Years | 2,035 (93.3%) | 495 (22.7%) |
| 75 Years and over | 1,089 (94.4%) | 64 (5.6%) |
| Total | 16,669 (52.4%) | 9,719 (30.6%) |
Disability Status by Sex by Age in San Luis
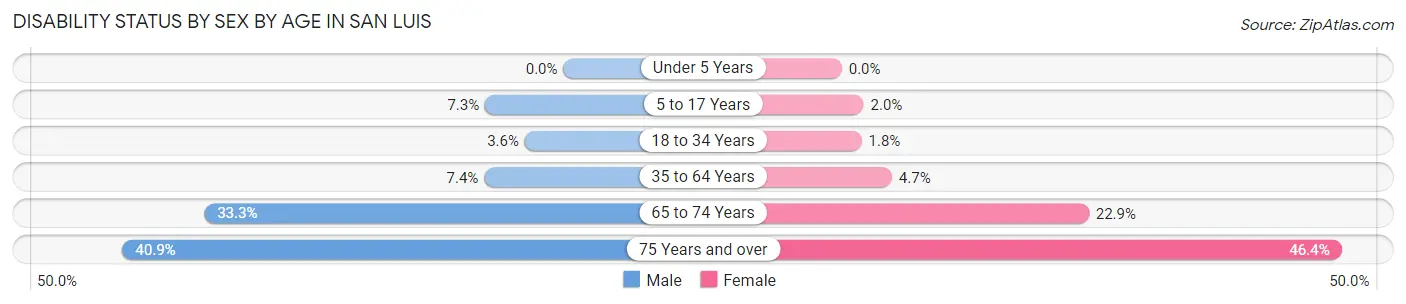
| Age Bracket | Male | Female |
| Under 5 Years | 0 (0.0%) | 0 (0.0%) |
| 5 to 17 Years | 257 (7.3%) | 82 (2.0%) |
| 18 to 34 Years | 152 (3.6%) | 70 (1.8%) |
| 35 to 64 Years | 326 (7.3%) | 266 (4.6%) |
| 65 to 74 Years | 387 (33.3%) | 234 (22.9%) |
| 75 Years and over | 241 (40.9%) | 262 (46.4%) |
Disability Class by Sex by Age in San Luis
Disability Class: Hearing Difficulty
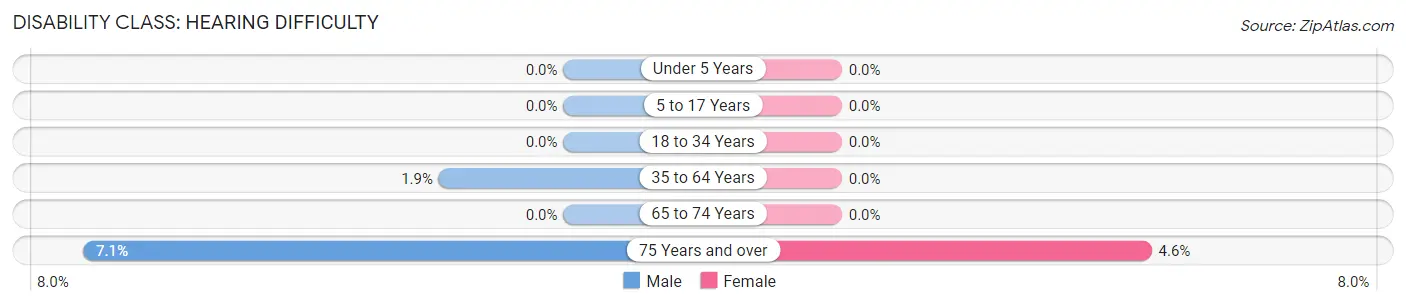
| Age Bracket | Male | Female |
| Under 5 Years | 0 (0.0%) | 0 (0.0%) |
| 5 to 17 Years | 0 (0.0%) | 0 (0.0%) |
| 18 to 34 Years | 0 (0.0%) | 0 (0.0%) |
| 35 to 64 Years | 82 (1.8%) | 0 (0.0%) |
| 65 to 74 Years | 0 (0.0%) | 0 (0.0%) |
| 75 Years and over | 42 (7.1%) | 26 (4.6%) |
Disability Class: Vision Difficulty
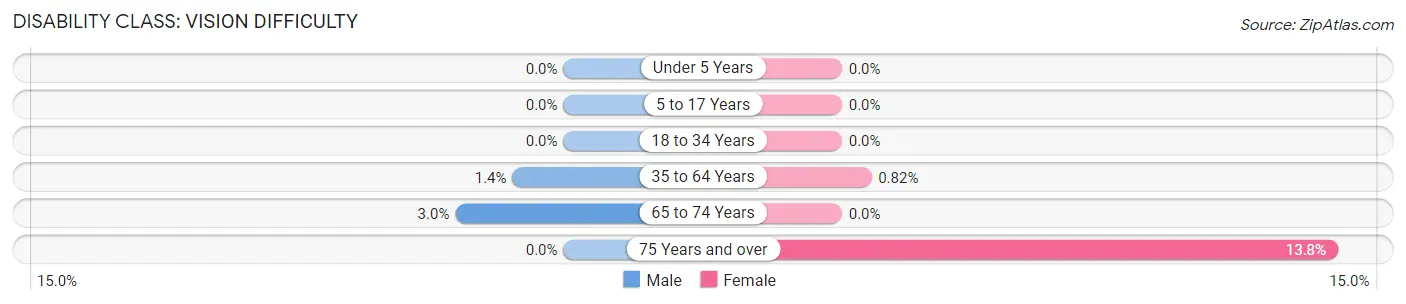
| Age Bracket | Male | Female |
| Under 5 Years | 0 (0.0%) | 0 (0.0%) |
| 5 to 17 Years | 0 (0.0%) | 0 (0.0%) |
| 18 to 34 Years | 0 (0.0%) | 0 (0.0%) |
| 35 to 64 Years | 63 (1.4%) | 47 (0.8%) |
| 65 to 74 Years | 35 (3.0%) | 0 (0.0%) |
| 75 Years and over | 0 (0.0%) | 78 (13.8%) |
Disability Class: Cognitive Difficulty
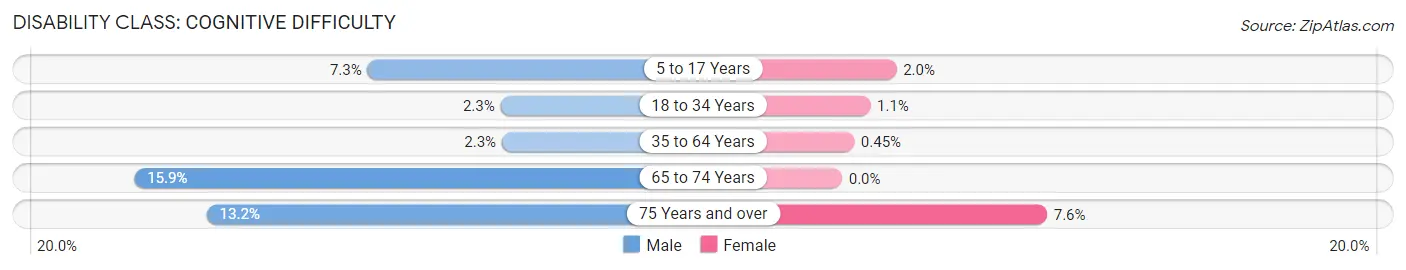
| Age Bracket | Male | Female |
| 5 to 17 Years | 257 (7.3%) | 82 (2.0%) |
| 18 to 34 Years | 99 (2.3%) | 40 (1.1%) |
| 35 to 64 Years | 101 (2.3%) | 26 (0.4%) |
| 65 to 74 Years | 185 (15.9%) | 0 (0.0%) |
| 75 Years and over | 78 (13.2%) | 43 (7.6%) |
Disability Class: Ambulatory Difficulty
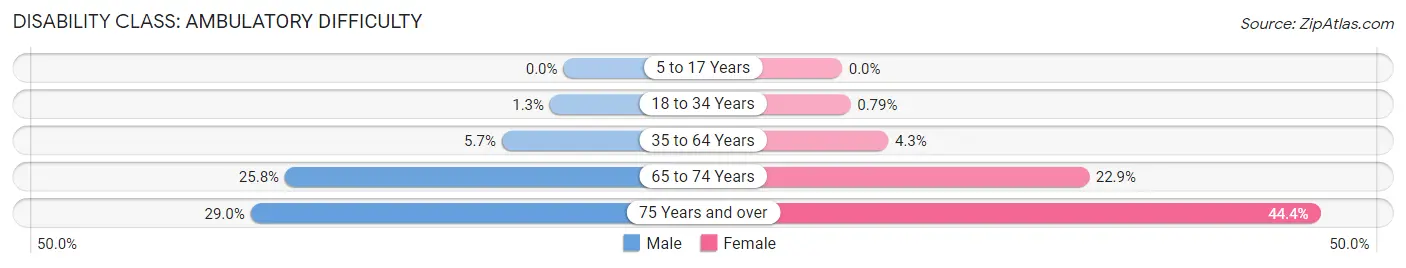
| Age Bracket | Male | Female |
| 5 to 17 Years | 0 (0.0%) | 0 (0.0%) |
| 18 to 34 Years | 53 (1.3%) | 30 (0.8%) |
| 35 to 64 Years | 254 (5.7%) | 245 (4.3%) |
| 65 to 74 Years | 300 (25.8%) | 234 (22.9%) |
| 75 Years and over | 171 (29.0%) | 251 (44.4%) |
Disability Class: Self-Care Difficulty
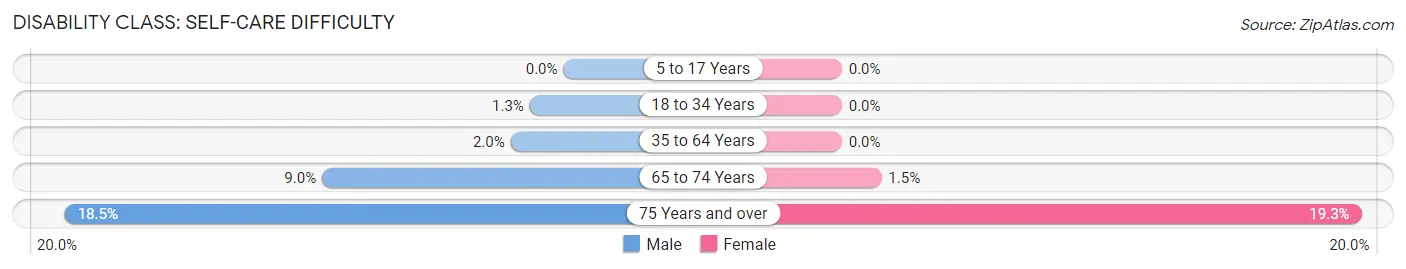
| Age Bracket | Male | Female |
| 5 to 17 Years | 0 (0.0%) | 0 (0.0%) |
| 18 to 34 Years | 53 (1.3%) | 0 (0.0%) |
| 35 to 64 Years | 87 (2.0%) | 0 (0.0%) |
| 65 to 74 Years | 104 (9.0%) | 15 (1.5%) |
| 75 Years and over | 109 (18.5%) | 109 (19.3%) |
Technology Access in San Luis
Computing Device Access in San Luis
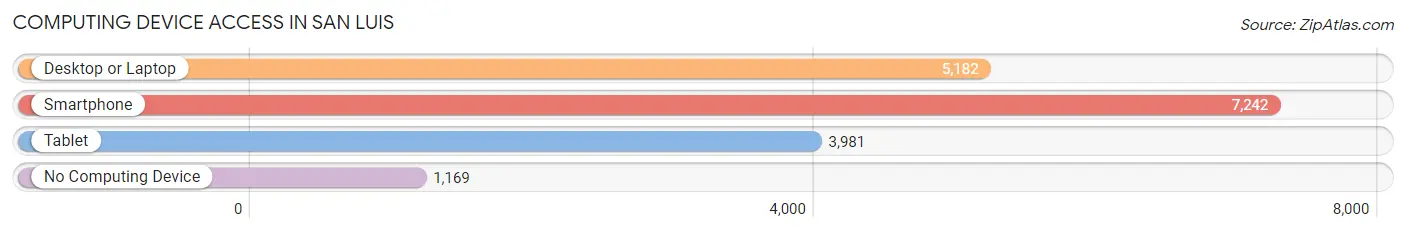
| Device Type | # Households | % Households |
| Desktop or Laptop | 5,182 | 58.6% |
| Smartphone | 7,242 | 81.9% |
| Tablet | 3,981 | 45.0% |
| No Computing Device | 1,169 | 13.2% |
| Total | 8,846 | 100.0% |
Internet Access in San Luis
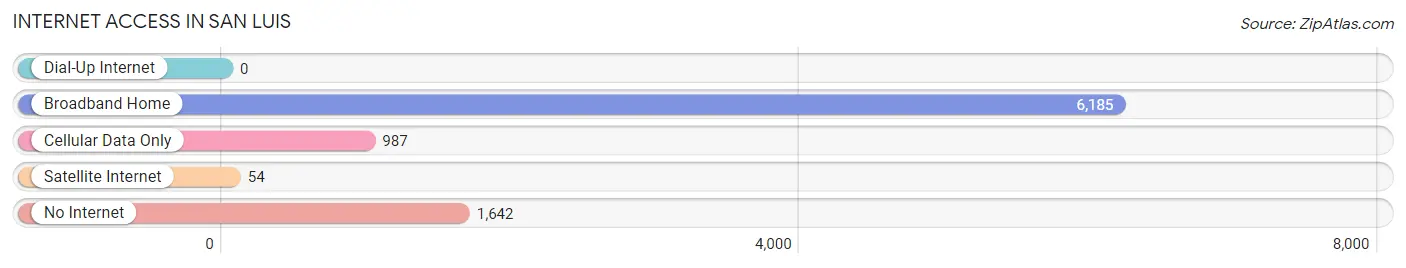
| Internet Type | # Households | % Households |
| Dial-Up Internet | 0 | 0.0% |
| Broadband Home | 6,185 | 69.9% |
| Cellular Data Only | 987 | 11.2% |
| Satellite Internet | 54 | 0.6% |
| No Internet | 1,642 | 18.6% |
| Total | 8,846 | 100.0% |
San Luis Summary
San Luis, Arizona is a city located in the southwestern corner of the state, just north of the Mexican border. It is the county seat of Yuma County and the most populous city in the county. The city was founded in 1930 and has a population of approximately 25,000 people.
History
San Luis was founded in 1930 by the Yuma County Board of Supervisors. The city was named after the San Luis Rey Mission, which was established in 1780 by Father Francisco Garcés. The mission was located near the present-day city of San Luis.
The city was originally a farming community, but in the 1950s, the population began to grow as the city became a hub for agricultural and industrial activity. The city was incorporated in 1960 and has since grown to become the largest city in Yuma County.
Geography
San Luis is located in the southwestern corner of Arizona, just north of the Mexican border. It is situated in the Sonoran Desert, which is characterized by hot, dry summers and mild winters. The city is located at an elevation of approximately 500 feet above sea level.
The city is bordered by the Gila River to the east and the Colorado River to the west. The city is also located near the Imperial Sand Dunes, which are the largest sand dunes in the United States.
Economy
San Luis is a major agricultural center in the region, with a variety of crops grown in the area. The city is also home to several manufacturing and industrial businesses, including a large solar panel manufacturing plant.
The city is also a popular tourist destination, with a variety of attractions, including the Imperial Sand Dunes, the Yuma Territorial Prison State Historic Park, and the San Luis Rey Mission.
Demographics
As of the 2010 census, the population of San Luis was 25,505. The racial makeup of the city was 75.3% Hispanic or Latino, 19.2% White, 0.7% African American, 0.4% Native American, 0.2% Asian, 0.1% Pacific Islander, and 4.1% from other races.
The median household income in San Luis was $30,945, and the median family income was $35,945. The per capita income was $14,945. Approximately 24.3% of the population was below the poverty line.
Conclusion
San Luis, Arizona is a city located in the southwestern corner of the state, just north of the Mexican border. It is the county seat of Yuma County and the most populous city in the county. The city was founded in 1930 and has a population of approximately 25,000 people. San Luis is a major agricultural center in the region, with a variety of crops grown in the area. The city is also home to several manufacturing and industrial businesses, and is a popular tourist destination. The population of San Luis is predominantly Hispanic or Latino, with a median household income of $30,945 and a per capita income of $14,945.
Common Questions
What is Per Capita Income in San Luis?
Per Capita income in San Luis is $16,690.
What is the Median Family Income in San Luis?
Median Family Income in San Luis is $46,560.
What is the Median Household income in San Luis?
Median Household Income in San Luis is $46,747.
What is Income or Wage Gap in San Luis?
Income or Wage Gap in San Luis is 20.4%.
Women in San Luis earn 79.6 cents for every dollar earned by a man.
What is Family Income Deficit in San Luis?
Family Income Deficit in San Luis is $13,381.
Families that are below poverty line in San Luis earn $13,381 less on average than the poverty threshold level.
What is Inequality or Gini Index in San Luis?
Inequality or Gini Index in San Luis is 0.45.
What is the Total Population of San Luis?
Total Population of San Luis is 35,189.
What is the Total Male Population of San Luis?
Total Male Population of San Luis is 18,797.
What is the Total Female Population of San Luis?
Total Female Population of San Luis is 16,392.
What is the Ratio of Males per 100 Females in San Luis?
There are 114.67 Males per 100 Females in San Luis.
What is the Ratio of Females per 100 Males in San Luis?
There are 87.21 Females per 100 Males in San Luis.
What is the Median Population Age in San Luis?
Median Population Age in San Luis is 31.6 Years.
What is the Average Family Size in San Luis
Average Family Size in San Luis is 3.8 People.
What is the Average Household Size in San Luis
Average Household Size in San Luis is 3.6 People.
How Large is the Labor Force in San Luis?
There are 13,175 People in the Labor Forcein in San Luis.
What is the Percentage of People in the Labor Force in San Luis?
50.4% of People are in the Labor Force in San Luis.
What is the Unemployment Rate in San Luis?
Unemployment Rate in San Luis is 10.1%.