Bitter Springs, AZ Map & Demographics
Bitter Springs Map
Bitter Springs Overview
$20,012
PER CAPITA INCOME
$46,750
AVG FAMILY INCOME
$34,848
AVG HOUSEHOLD INCOME
13.1%
WAGE / INCOME GAP [ % ]
86.9¢/ $1
WAGE / INCOME GAP [ $ ]
0.39
INEQUALITY / GINI INDEX
374
TOTAL POPULATION
164
MALE POPULATION
210
FEMALE POPULATION
78.10
MALES / 100 FEMALES
128.05
FEMALES / 100 MALES
37.1
MEDIAN AGE
3.9
AVG FAMILY SIZE
2.9
AVG HOUSEHOLD SIZE
168
LABOR FORCE [ PEOPLE ]
58.1%
PERCENT IN LABOR FORCE
27.4%
UNEMPLOYMENT RATE
Income in Bitter Springs
Income Overview in Bitter Springs
Per Capita Income in Bitter Springs is $20,012, while median incomes of families and households are $46,750 and $34,848 respectively.
| Characteristic | Number | Measure |
| Per Capita Income | 374 | $20,012 |
| Median Family Income | 81 | $46,750 |
| Mean Family Income | 81 | $62,836 |
| Median Household Income | 128 | $34,848 |
| Mean Household Income | 128 | $51,368 |
| Income Deficit | 81 | $0 |
| Wage / Income Gap (%) | 374 | 13.11% |
| Wage / Income Gap ($) | 374 | 86.89¢ per $1 |
| Gini / Inequality Index | 374 | 0.39 |
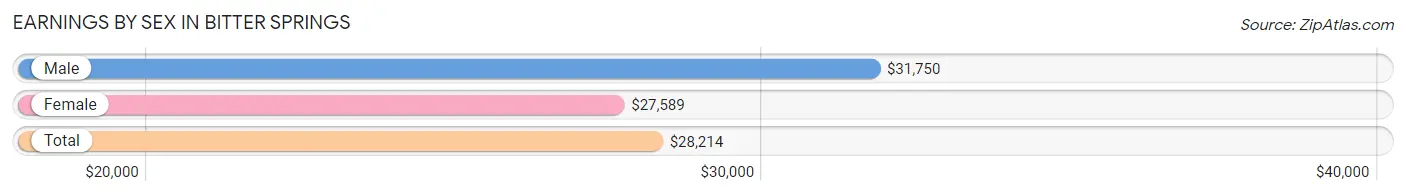
Earnings by Sex in Bitter Springs
Average Earnings in Bitter Springs are $28,214, $31,750 for men and $27,589 for women, a difference of 13.1%.
| Sex | Number | Average Earnings |
| Male | 71 (40.3%) | $31,750 |
| Female | 105 (59.7%) | $27,589 |
| Total | 176 (100.0%) | $28,214 |
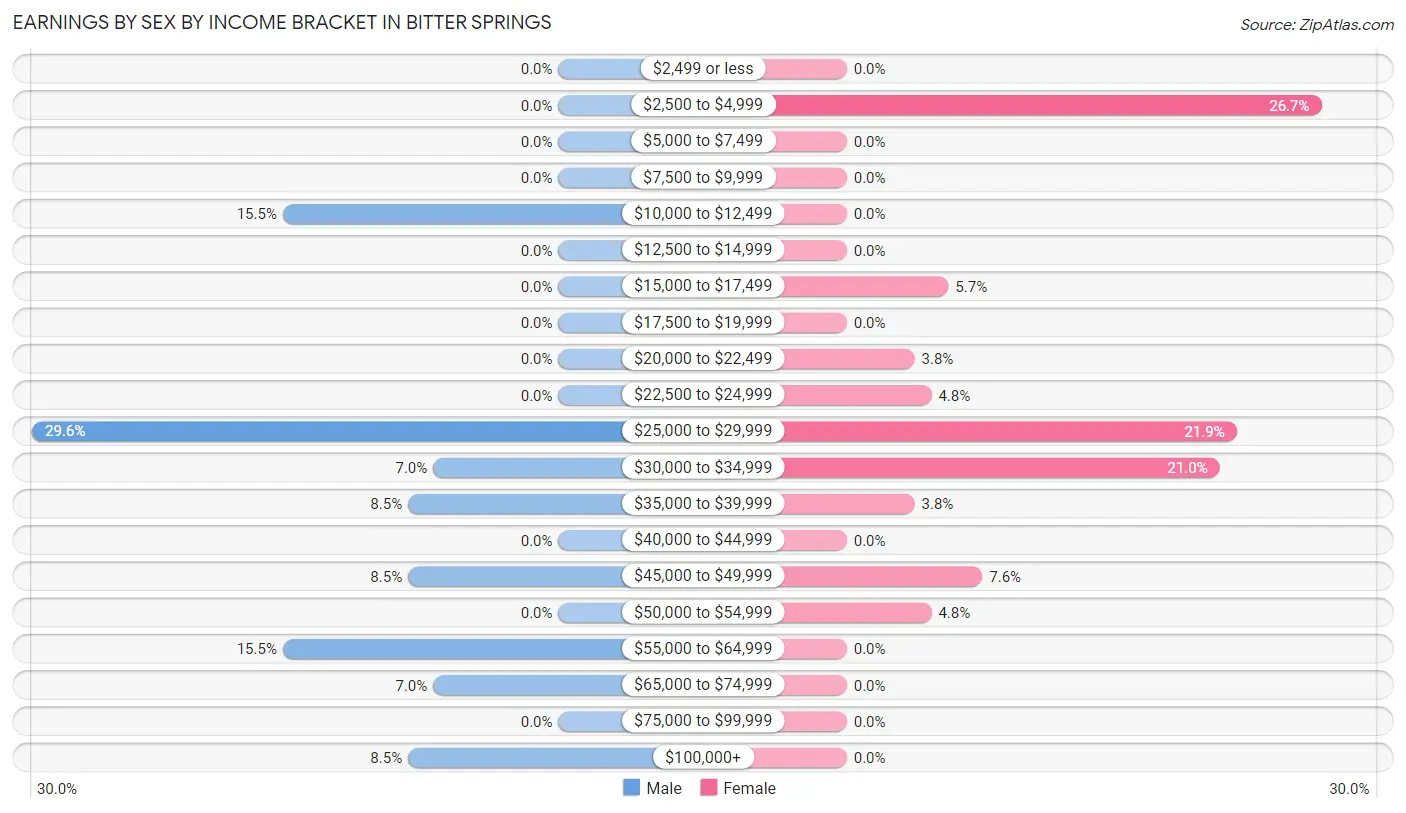
Earnings by Sex by Income Bracket in Bitter Springs
The most common earnings brackets in Bitter Springs are $25,000 to $29,999 for men (21 | 29.6%) and $2,500 to $4,999 for women (28 | 26.7%).
| Income | Male | Female |
| $2,499 or less | 0 (0.0%) | 0 (0.0%) |
| $2,500 to $4,999 | 0 (0.0%) | 28 (26.7%) |
| $5,000 to $7,499 | 0 (0.0%) | 0 (0.0%) |
| $7,500 to $9,999 | 0 (0.0%) | 0 (0.0%) |
| $10,000 to $12,499 | 11 (15.5%) | 0 (0.0%) |
| $12,500 to $14,999 | 0 (0.0%) | 0 (0.0%) |
| $15,000 to $17,499 | 0 (0.0%) | 6 (5.7%) |
| $17,500 to $19,999 | 0 (0.0%) | 0 (0.0%) |
| $20,000 to $22,499 | 0 (0.0%) | 4 (3.8%) |
| $22,500 to $24,999 | 0 (0.0%) | 5 (4.8%) |
| $25,000 to $29,999 | 21 (29.6%) | 23 (21.9%) |
| $30,000 to $34,999 | 5 (7.0%) | 22 (20.9%) |
| $35,000 to $39,999 | 6 (8.5%) | 4 (3.8%) |
| $40,000 to $44,999 | 0 (0.0%) | 0 (0.0%) |
| $45,000 to $49,999 | 6 (8.5%) | 8 (7.6%) |
| $50,000 to $54,999 | 0 (0.0%) | 5 (4.8%) |
| $55,000 to $64,999 | 11 (15.5%) | 0 (0.0%) |
| $65,000 to $74,999 | 5 (7.0%) | 0 (0.0%) |
| $75,000 to $99,999 | 0 (0.0%) | 0 (0.0%) |
| $100,000+ | 6 (8.5%) | 0 (0.0%) |
| Total | 71 (100.0%) | 105 (100.0%) |
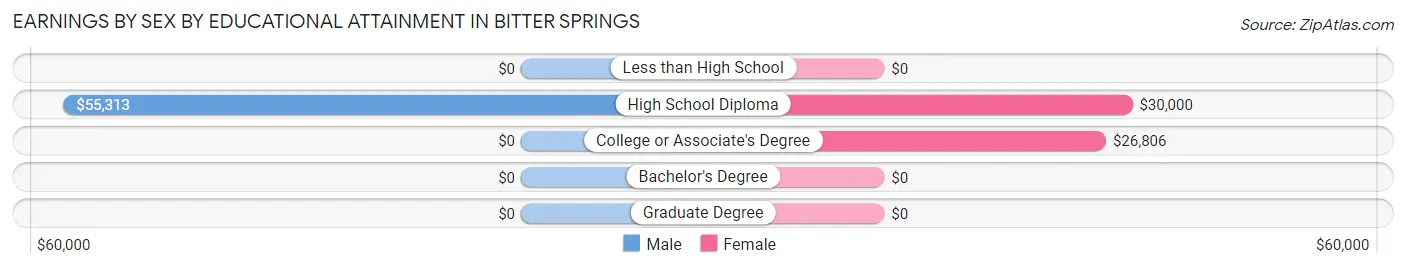
Earnings by Sex by Educational Attainment in Bitter Springs
Average earnings in Bitter Springs are $47,500 for men and $26,528 for women, a difference of 44.2%. Men with an educational attainment of high school diploma enjoy the highest average annual earnings of $55,313, while those with high school diploma education earn the least with $55,313. Women with an educational attainment of high school diploma earn the most with the average annual earnings of $30,000, while those with college or associate's degree education have the smallest earnings of $26,806.
| Educational Attainment | Male Income | Female Income |
| Less than High School | - | - |
| High School Diploma | $55,313 | $30,000 |
| College or Associate's Degree | - | - |
| Bachelor's Degree | - | - |
| Graduate Degree | - | - |
| Total | $47,500 | $26,528 |
Family Income in Bitter Springs
Family Income Brackets in Bitter Springs
According to the Bitter Springs family income data, there are 22 families falling into the $50,000 to $74,999 income range, which is the most common income bracket and makes up 27.2% of all families.
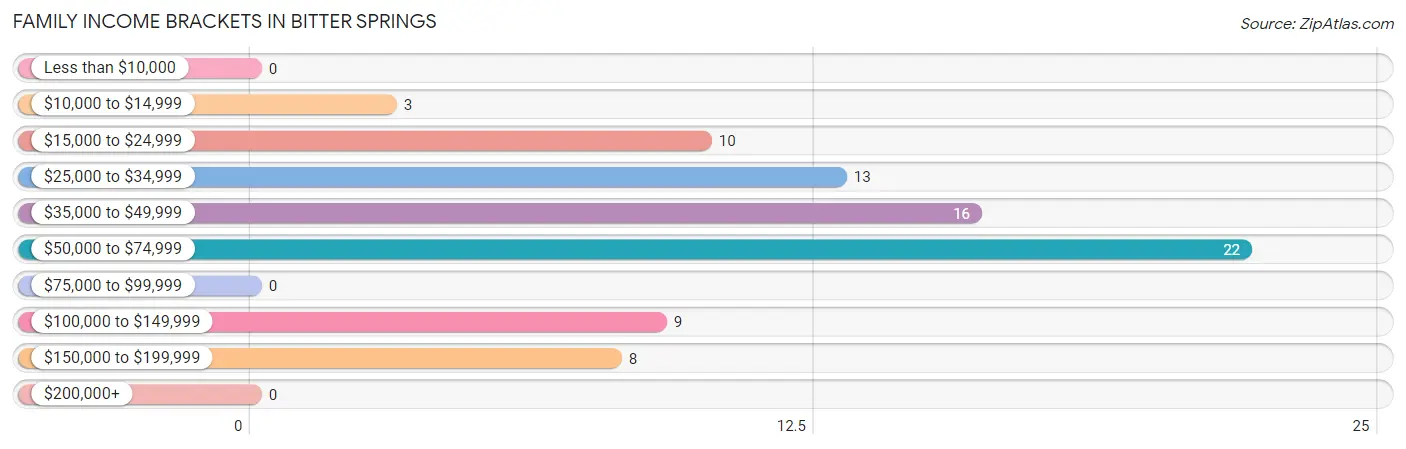
| Income Bracket | # Families | % Families |
| Less than $10,000 | 0 | 0.0% |
| $10,000 to $14,999 | 3 | 3.7% |
| $15,000 to $24,999 | 10 | 12.3% |
| $25,000 to $34,999 | 13 | 16.0% |
| $35,000 to $49,999 | 16 | 19.8% |
| $50,000 to $74,999 | 22 | 27.2% |
| $75,000 to $99,999 | 0 | 0.0% |
| $100,000 to $149,999 | 9 | 11.1% |
| $150,000 to $199,999 | 8 | 9.9% |
| $200,000+ | 0 | 0.0% |
Family Income by Famaliy Size in Bitter Springs
3-person families (28 | 34.6%) account for the highest median family income in Bitter Springs with $73,750 per family, while 3-person families (28 | 34.6%) have the highest median income of $24,583 per family member.
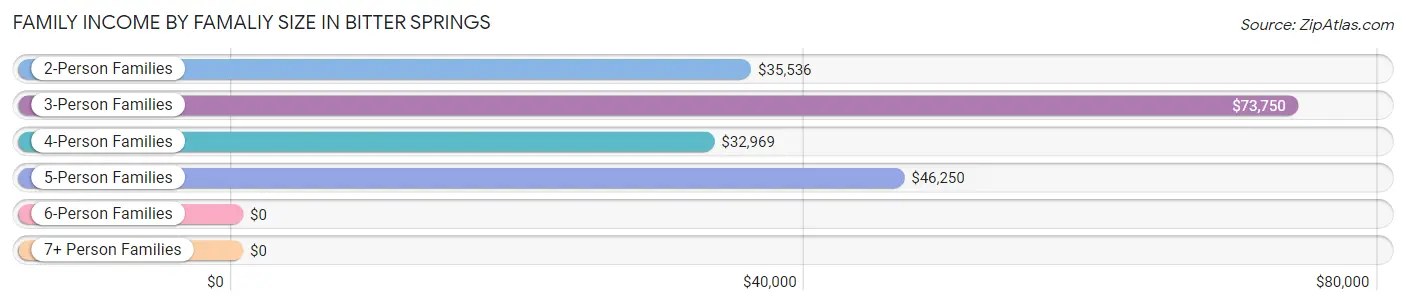
| Income Bracket | # Families | Median Income |
| 2-Person Families | 19 (23.5%) | $35,536 |
| 3-Person Families | 28 (34.6%) | $73,750 |
| 4-Person Families | 13 (16.1%) | $32,969 |
| 5-Person Families | 13 (16.1%) | $46,250 |
| 6-Person Families | 4 (4.9%) | $0 |
| 7+ Person Families | 4 (4.9%) | $0 |
| Total | 81 (100.0%) | $46,750 |
Family Income by Number of Earners in Bitter Springs
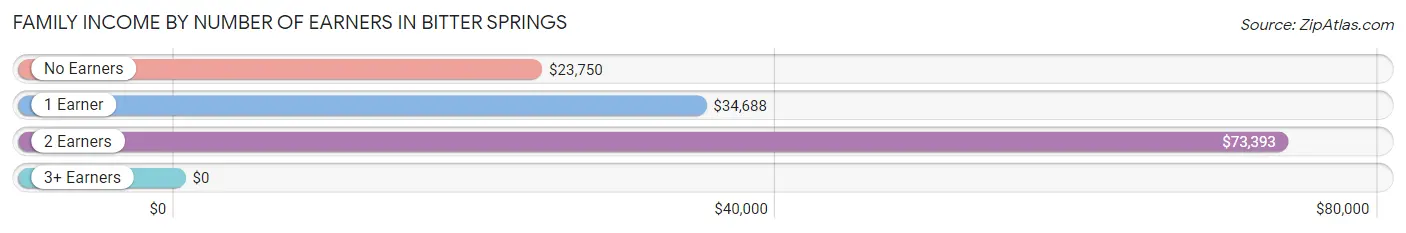
| Number of Earners | # Families | Median Income |
| No Earners | 11 (13.6%) | $23,750 |
| 1 Earner | 34 (42.0%) | $34,688 |
| 2 Earners | 28 (34.6%) | $73,393 |
| 3+ Earners | 8 (9.9%) | $0 |
| Total | 81 (100.0%) | $46,750 |
Household Income in Bitter Springs
Household Income Brackets in Bitter Springs
With 38 households falling in the category, the $25,000 to $34,999 income range is the most frequent in Bitter Springs, accounting for 29.7% of all households.
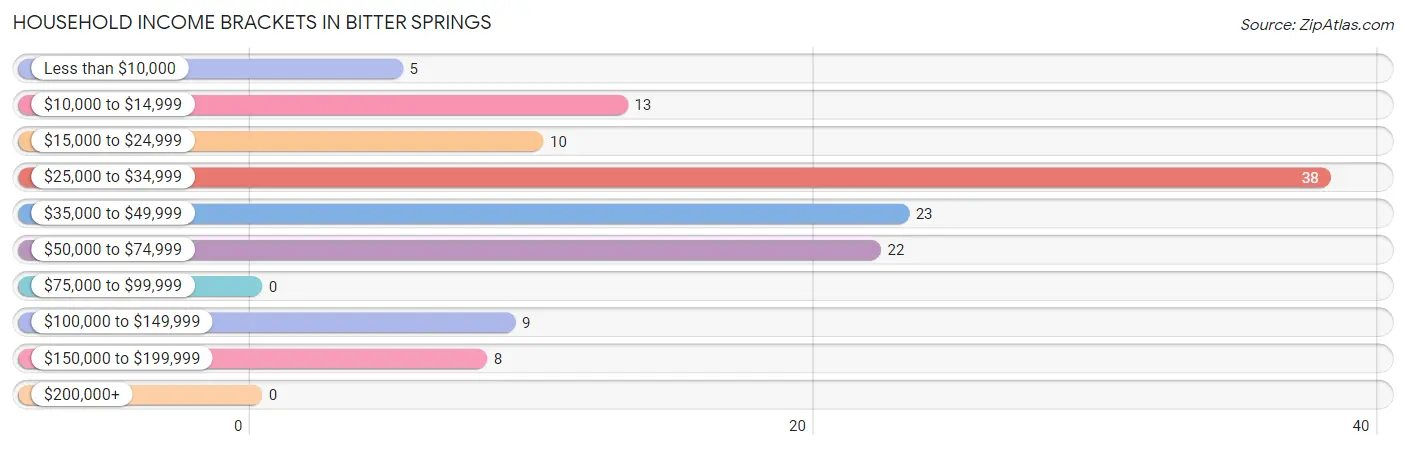
| Income Bracket | # Households | % Households |
| Less than $10,000 | 5 | 3.9% |
| $10,000 to $14,999 | 13 | 10.2% |
| $15,000 to $24,999 | 10 | 7.8% |
| $25,000 to $34,999 | 38 | 29.7% |
| $35,000 to $49,999 | 23 | 18.0% |
| $50,000 to $74,999 | 22 | 17.2% |
| $75,000 to $99,999 | 0 | 0.0% |
| $100,000 to $149,999 | 9 | 7.0% |
| $150,000 to $199,999 | 8 | 6.3% |
| $200,000+ | 0 | 0.0% |
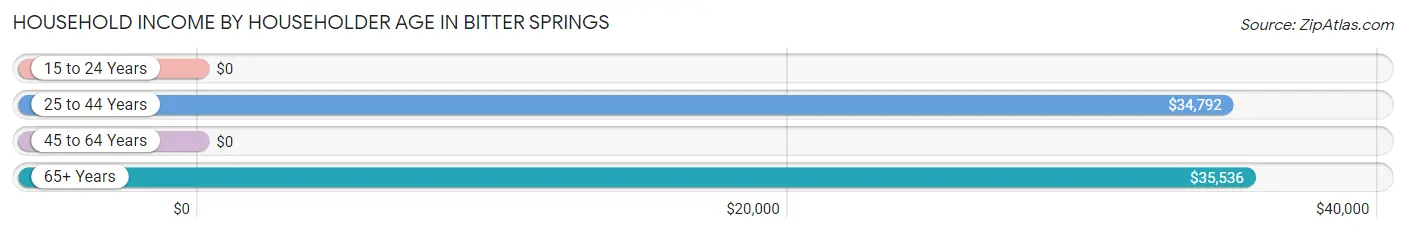
Household Income by Householder Age in Bitter Springs
The median household income in Bitter Springs is $34,848, with the highest median household income of $35,536 found in the 65+ years age bracket for the primary householder. A total of 33 households (25.8%) fall into this category.
| Income Bracket | # Households | Median Income |
| 15 to 24 Years | 0 (0.0%) | $0 |
| 25 to 44 Years | 21 (16.4%) | $34,792 |
| 45 to 64 Years | 74 (57.8%) | $0 |
| 65+ Years | 33 (25.8%) | $35,536 |
| Total | 128 (100.0%) | $34,848 |
Poverty in Bitter Springs
Income Below Poverty by Sex and Age in Bitter Springs
With 12.2% poverty level for males and 11.4% for females among the residents of Bitter Springs, 15 year old males and 65 to 74 year old females are the most vulnerable to poverty, with 6 males (100.0%) and 6 females (42.9%) in their respective age groups living below the poverty level.
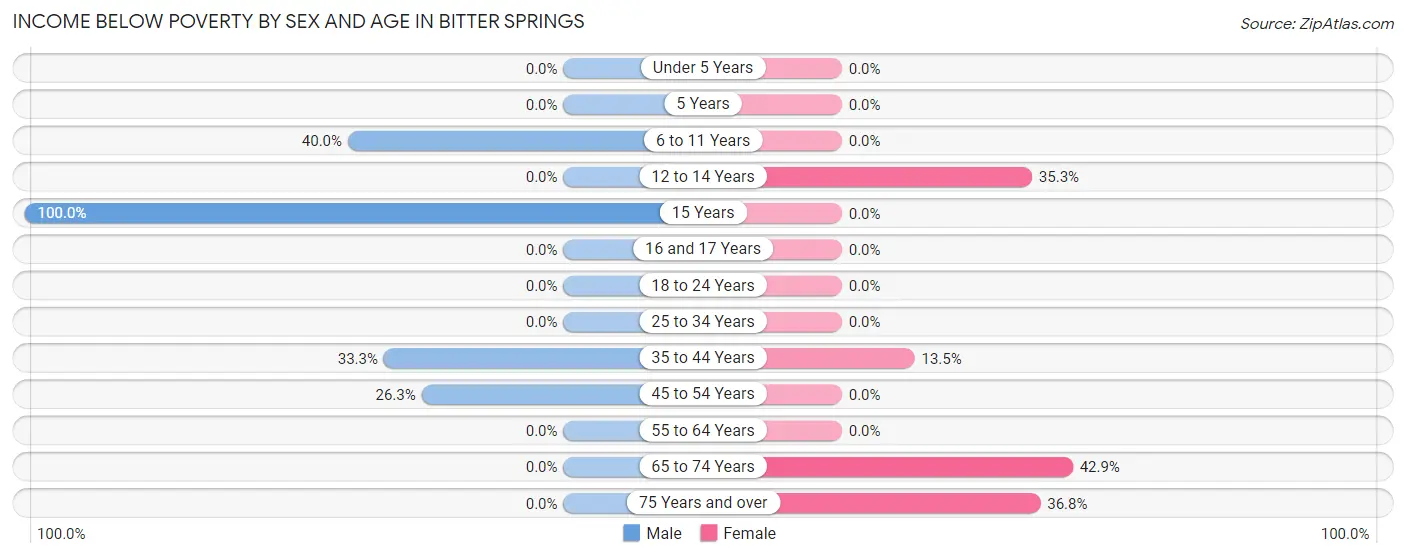
| Age Bracket | Male | Female |
| Under 5 Years | 0 (0.0%) | 0 (0.0%) |
| 5 Years | 0 (0.0%) | 0 (0.0%) |
| 6 to 11 Years | 4 (40.0%) | 0 (0.0%) |
| 12 to 14 Years | 0 (0.0%) | 6 (35.3%) |
| 15 Years | 6 (100.0%) | 0 (0.0%) |
| 16 and 17 Years | 0 (0.0%) | 0 (0.0%) |
| 18 to 24 Years | 0 (0.0%) | 0 (0.0%) |
| 25 to 34 Years | 0 (0.0%) | 0 (0.0%) |
| 35 to 44 Years | 5 (33.3%) | 5 (13.5%) |
| 45 to 54 Years | 5 (26.3%) | 0 (0.0%) |
| 55 to 64 Years | 0 (0.0%) | 0 (0.0%) |
| 65 to 74 Years | 0 (0.0%) | 6 (42.9%) |
| 75 Years and over | 0 (0.0%) | 7 (36.8%) |
| Total | 20 (12.2%) | 24 (11.4%) |
Income Above Poverty by Sex and Age in Bitter Springs
According to the poverty statistics in Bitter Springs, males aged under 5 years and females aged under 5 years are the age groups that are most secure financially, with 100.0% of males and 100.0% of females in these age groups living above the poverty line.
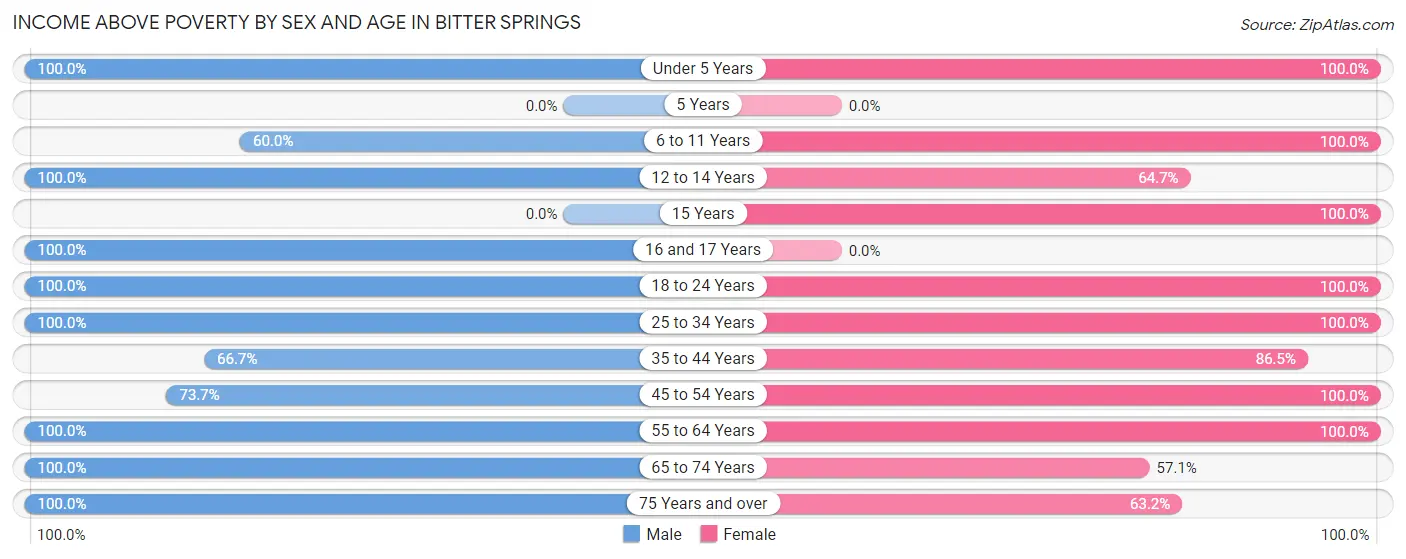
| Age Bracket | Male | Female |
| Under 5 Years | 8 (100.0%) | 5 (100.0%) |
| 5 Years | 0 (0.0%) | 0 (0.0%) |
| 6 to 11 Years | 6 (60.0%) | 20 (100.0%) |
| 12 to 14 Years | 13 (100.0%) | 11 (64.7%) |
| 15 Years | 0 (0.0%) | 6 (100.0%) |
| 16 and 17 Years | 10 (100.0%) | 0 (0.0%) |
| 18 to 24 Years | 43 (100.0%) | 8 (100.0%) |
| 25 to 34 Years | 16 (100.0%) | 13 (100.0%) |
| 35 to 44 Years | 10 (66.7%) | 32 (86.5%) |
| 45 to 54 Years | 14 (73.7%) | 12 (100.0%) |
| 55 to 64 Years | 16 (100.0%) | 59 (100.0%) |
| 65 to 74 Years | 4 (100.0%) | 8 (57.1%) |
| 75 Years and over | 4 (100.0%) | 12 (63.2%) |
| Total | 144 (87.8%) | 186 (88.6%) |
Income Below Poverty Among Married-Couple Families in Bitter Springs
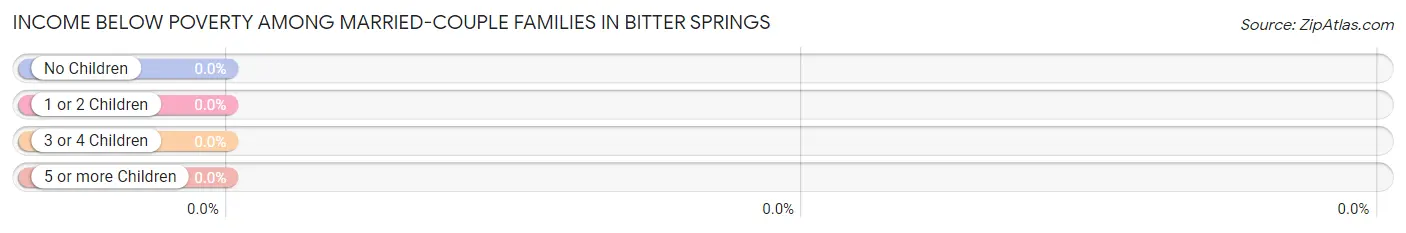
| Children | Above Poverty | Below Poverty |
| No Children | 19 (100.0%) | 0 (0.0%) |
| 1 or 2 Children | 22 (100.0%) | 0 (0.0%) |
| 3 or 4 Children | 5 (100.0%) | 0 (0.0%) |
| 5 or more Children | 0 (0.0%) | 0 (0.0%) |
| Total | 46 (100.0%) | 0 (0.0%) |
Income Below Poverty Among Single-Parent Households in Bitter Springs
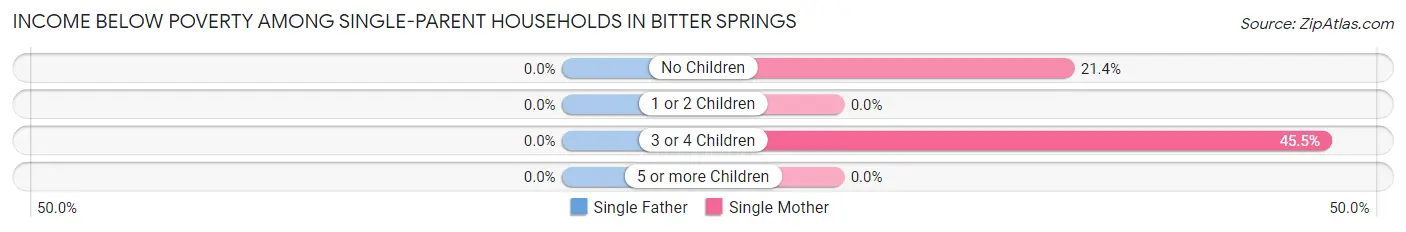
| Children | Single Father | Single Mother |
| No Children | 0 (0.0%) | 3 (21.4%) |
| 1 or 2 Children | 0 (0.0%) | 0 (0.0%) |
| 3 or 4 Children | 0 (0.0%) | 5 (45.5%) |
| 5 or more Children | 0 (0.0%) | 0 (0.0%) |
| Total | 0 (0.0%) | 8 (22.9%) |
Income Below Poverty Among Married-Couple vs Single-Parent Households in Bitter Springs
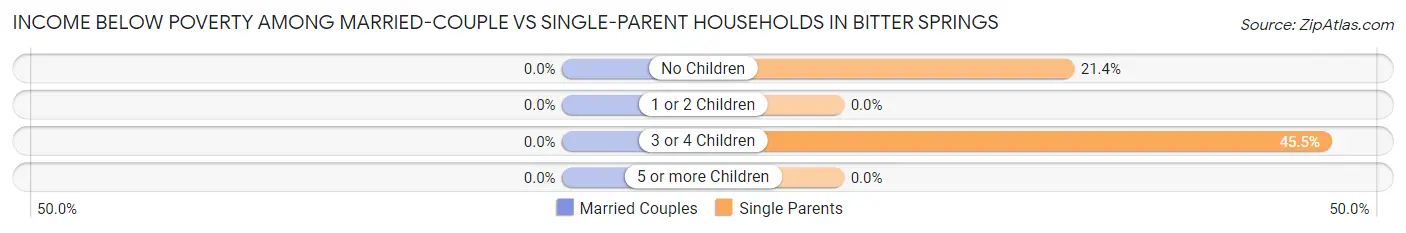
| Children | Married-Couple Families | Single-Parent Households |
| No Children | 0 (0.0%) | 3 (21.4%) |
| 1 or 2 Children | 0 (0.0%) | 0 (0.0%) |
| 3 or 4 Children | 0 (0.0%) | 5 (45.5%) |
| 5 or more Children | 0 (0.0%) | 0 (0.0%) |
| Total | 0 (0.0%) | 8 (22.9%) |
Race in Bitter Springs
The most populous races in Bitter Springs are Native / Alaskan (365 | 97.6%), Hispanic or Latino (9 | 2.4%), and Some other Race (9 | 2.4%).
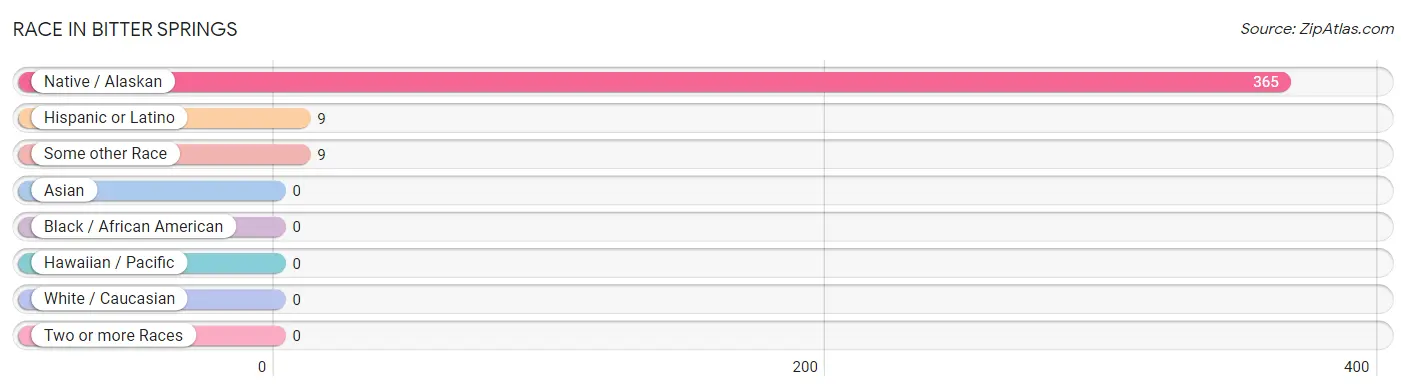
| Race | # Population | % Population |
| Asian | 0 | 0.0% |
| Black / African American | 0 | 0.0% |
| Hawaiian / Pacific | 0 | 0.0% |
| Hispanic or Latino | 9 | 2.4% |
| Native / Alaskan | 365 | 97.6% |
| White / Caucasian | 0 | 0.0% |
| Two or more Races | 0 | 0.0% |
| Some other Race | 9 | 2.4% |
| Total | 374 | 100.0% |
Ancestry in Bitter Springs
The most populous ancestries reported in Bitter Springs are Navajo (360 | 96.3%), and Apache (5 | 1.3%), together accounting for 97.6% of all Bitter Springs residents.
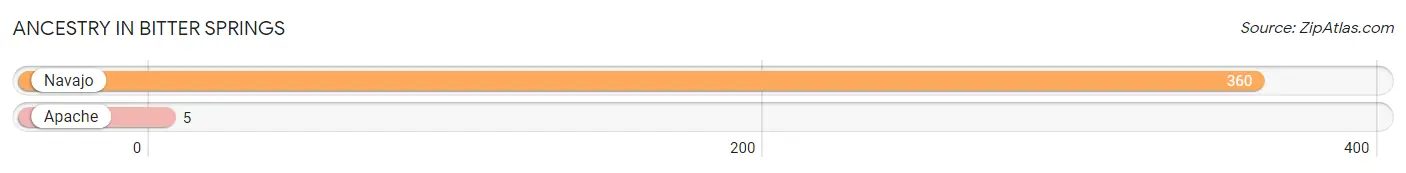
| Ancestry | # Population | % Population |
| Apache | 5 | 1.3% |
| Navajo | 360 | 96.3% | View All 2 Rows |
Immigrants in Bitter Springs

| Immigration Origin | # Population | % Population | View All 0 Rows |
Sex and Age in Bitter Springs
Sex and Age in Bitter Springs
The most populous age groups in Bitter Springs are 20 to 24 Years (39 | 23.8%) for men and 60 to 64 Years (37 | 17.6%) for women.
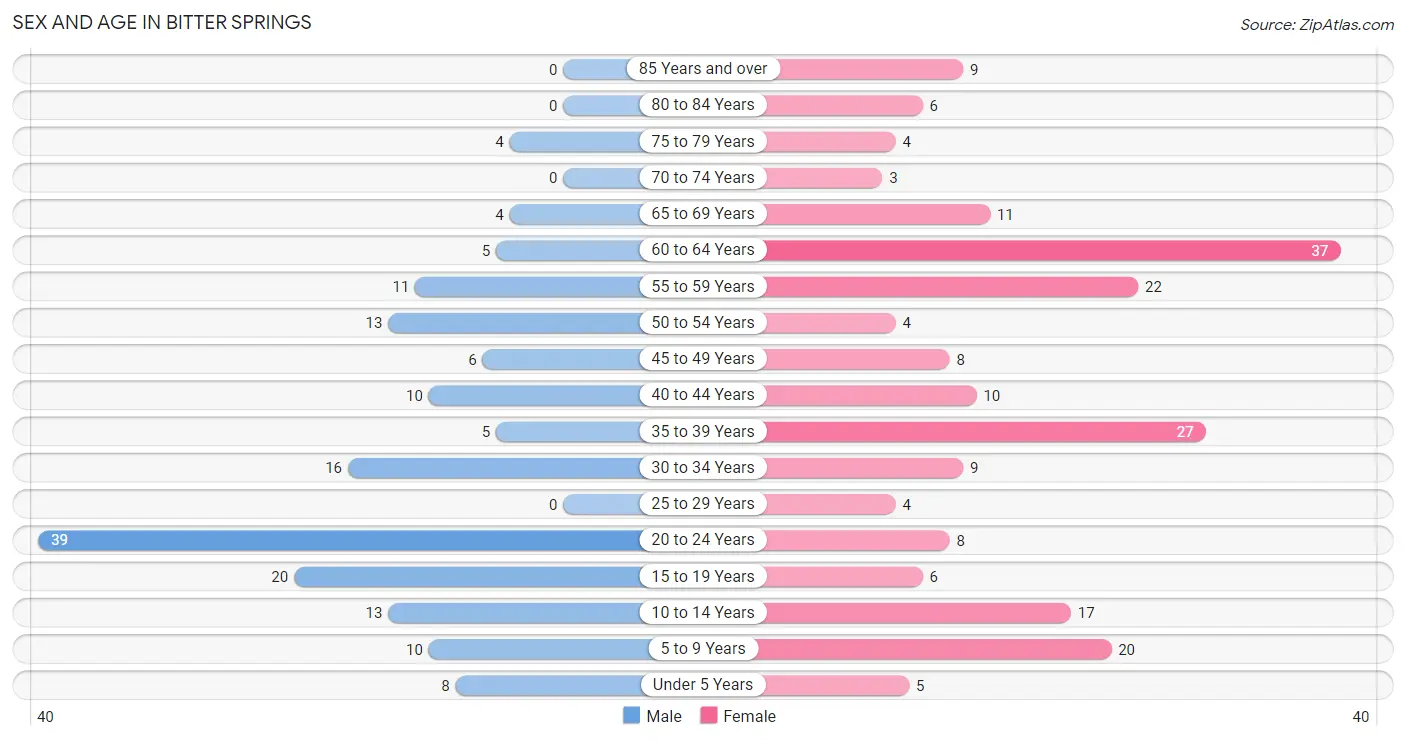
| Age Bracket | Male | Female |
| Under 5 Years | 8 (4.9%) | 5 (2.4%) |
| 5 to 9 Years | 10 (6.1%) | 20 (9.5%) |
| 10 to 14 Years | 13 (7.9%) | 17 (8.1%) |
| 15 to 19 Years | 20 (12.2%) | 6 (2.9%) |
| 20 to 24 Years | 39 (23.8%) | 8 (3.8%) |
| 25 to 29 Years | 0 (0.0%) | 4 (1.9%) |
| 30 to 34 Years | 16 (9.8%) | 9 (4.3%) |
| 35 to 39 Years | 5 (3.0%) | 27 (12.9%) |
| 40 to 44 Years | 10 (6.1%) | 10 (4.8%) |
| 45 to 49 Years | 6 (3.7%) | 8 (3.8%) |
| 50 to 54 Years | 13 (7.9%) | 4 (1.9%) |
| 55 to 59 Years | 11 (6.7%) | 22 (10.5%) |
| 60 to 64 Years | 5 (3.0%) | 37 (17.6%) |
| 65 to 69 Years | 4 (2.4%) | 11 (5.2%) |
| 70 to 74 Years | 0 (0.0%) | 3 (1.4%) |
| 75 to 79 Years | 4 (2.4%) | 4 (1.9%) |
| 80 to 84 Years | 0 (0.0%) | 6 (2.9%) |
| 85 Years and over | 0 (0.0%) | 9 (4.3%) |
| Total | 164 (100.0%) | 210 (100.0%) |
Families and Households in Bitter Springs
Median Family Size in Bitter Springs
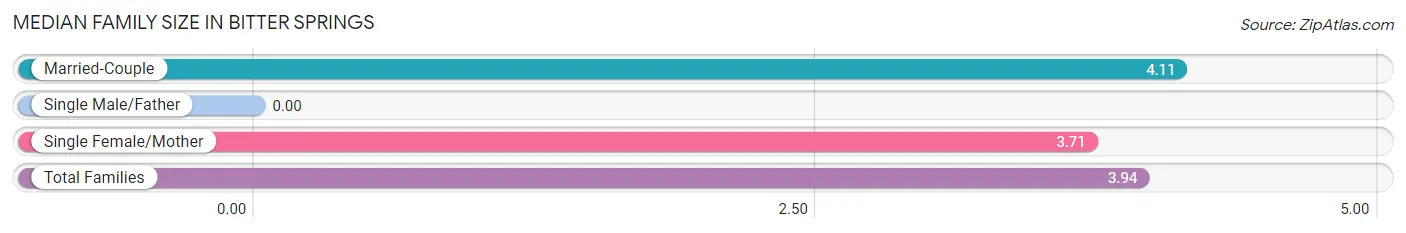
| Family Type | # Families | Family Size |
| Married-Couple | 46 (56.8%) | 4.11 |
| Single Male/Father | 0 (0.0%) | - |
| Single Female/Mother | 35 (43.2%) | 3.71 |
| Total Families | 81 (100.0%) | 3.94 |
Median Household Size in Bitter Springs
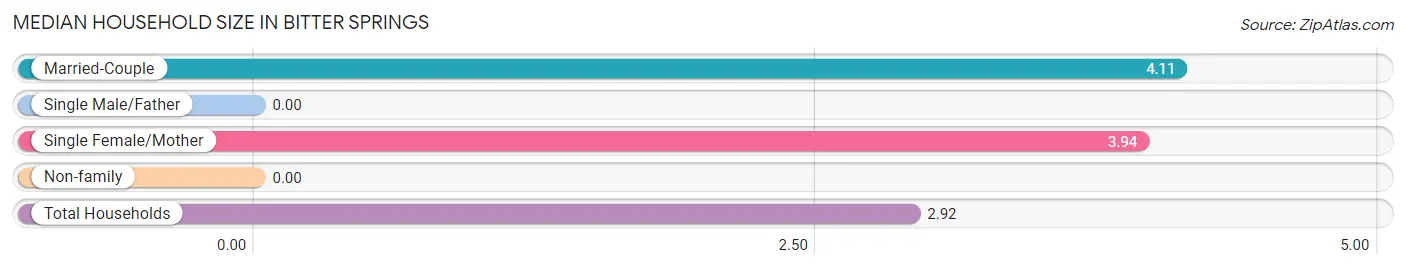
| Household Type | # Households | Household Size |
| Married-Couple | 46 (35.9%) | 4.11 |
| Single Male/Father | 0 (0.0%) | - |
| Single Female/Mother | 35 (27.3%) | 3.94 |
| Non-family | 47 (36.7%) | - |
| Total Households | 128 (100.0%) | 2.92 |
Household Size by Marriage Status in Bitter Springs
Out of a total of 128 households in Bitter Springs, 81 (63.3%) are family households, while 47 (36.7%) are nonfamily households. The most numerous type of family households are 3-person households, comprising 24, and the most common type of nonfamily households are 1-person households, comprising 47.
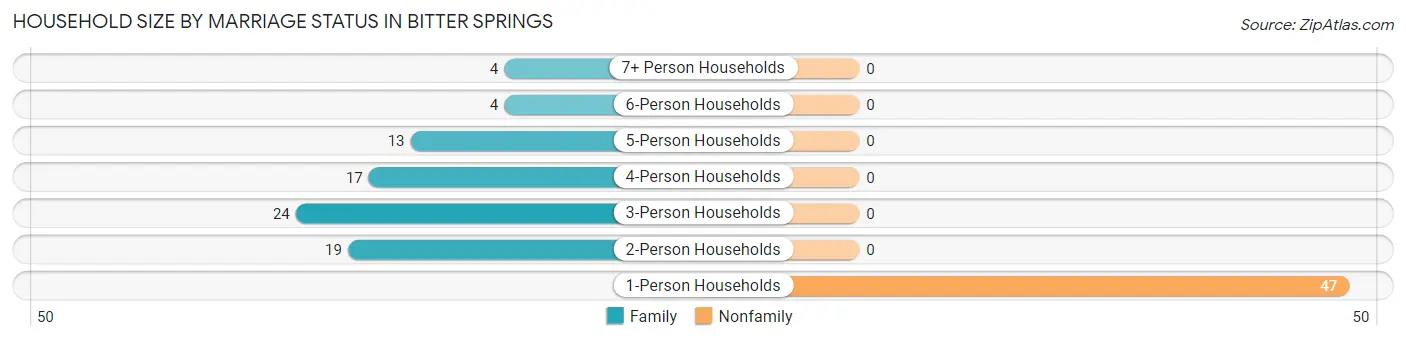
| Household Size | Family Households | Nonfamily Households |
| 1-Person Households | - | 47 (36.7%) |
| 2-Person Households | 19 (14.8%) | 0 (0.0%) |
| 3-Person Households | 24 (18.8%) | 0 (0.0%) |
| 4-Person Households | 17 (13.3%) | 0 (0.0%) |
| 5-Person Households | 13 (10.2%) | 0 (0.0%) |
| 6-Person Households | 4 (3.1%) | 0 (0.0%) |
| 7+ Person Households | 4 (3.1%) | 0 (0.0%) |
| Total | 81 (63.3%) | 47 (36.7%) |
Female Fertility in Bitter Springs
Fertility by Age in Bitter Springs
| Age Bracket | Women with Births | Births / 1,000 Women |
| 15 to 19 years | 0 (0.0%) | 0.0 |
| 20 to 34 years | 0 (0.0%) | 0.0 |
| 35 to 50 years | 0 (0.0%) | 0.0 |
| Total | 0 (0.0%) | 0.0 |
Fertility by Age by Marriage Status in Bitter Springs
| Age Bracket | Married | Unmarried |
| 15 to 19 years | 0 (0.0%) | 0 (0.0%) |
| 20 to 34 years | 0 (0.0%) | 0 (0.0%) |
| 35 to 50 years | 0 (0.0%) | 0 (0.0%) |
| Total | 0 (0.0%) | 0 (0.0%) |
Fertility by Education in Bitter Springs
| Educational Attainment | Women with Births | Births / 1,000 Women |
| Less than High School | 0 (0.0%) | 0.0 |
| High School Diploma | 0 (0.0%) | 0.0 |
| College or Associate's Degree | 0 (0.0%) | 0.0 |
| Bachelor's Degree | 0 (0.0%) | 0.0 |
| Graduate Degree | 0 (0.0%) | 0.0 |
| Total | 0 (0.0%) | 0.0 |
Fertility by Education by Marriage Status in Bitter Springs
| Educational Attainment | Married | Unmarried |
| Less than High School | 0 (0.0%) | 0 (0.0%) |
| High School Diploma | 0 (0.0%) | 0 (0.0%) |
| College or Associate's Degree | 0 (0.0%) | 0 (0.0%) |
| Bachelor's Degree | 0 (0.0%) | 0 (0.0%) |
| Graduate Degree | 0 (0.0%) | 0 (0.0%) |
| Total | 0 (0.0%) | 0 (0.0%) |
Employment Characteristics in Bitter Springs
Employment by Class of Employer in Bitter Springs
Among the 122 employed individuals in Bitter Springs, private company employees (103 | 84.4%), self-employed (incorporated) (5 | 4.1%), and not-for-profit organizations (5 | 4.1%) make up the most common classes of employment.
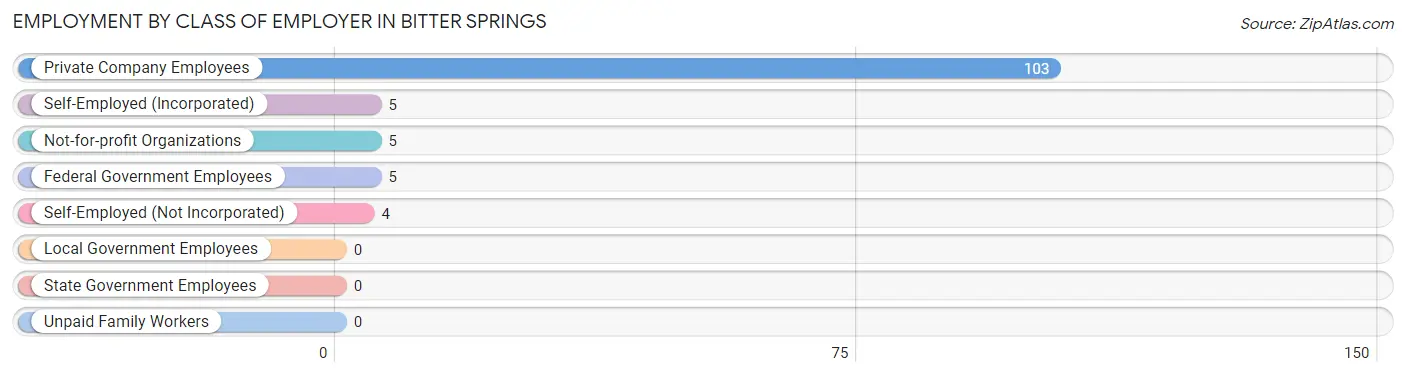
| Employer Class | # Employees | % Employees |
| Private Company Employees | 103 | 84.4% |
| Self-Employed (Incorporated) | 5 | 4.1% |
| Self-Employed (Not Incorporated) | 4 | 3.3% |
| Not-for-profit Organizations | 5 | 4.1% |
| Local Government Employees | 0 | 0.0% |
| State Government Employees | 0 | 0.0% |
| Federal Government Employees | 5 | 4.1% |
| Unpaid Family Workers | 0 | 0.0% |
| Total | 122 | 100.0% |
Employment Status by Age in Bitter Springs
According to the labor force statistics for Bitter Springs, out of the total population over 16 years of age (289), 58.1% or 168 individuals are in the labor force, with 27.4% or 46 of them unemployed. The age group with the highest labor force participation rate is 20 to 24 years, with 100.0% or 47 individuals in the labor force. Within the labor force, the 60 to 64 years age range has the highest percentage of unemployed individuals, with 83.3% or 25 of them being unemployed.
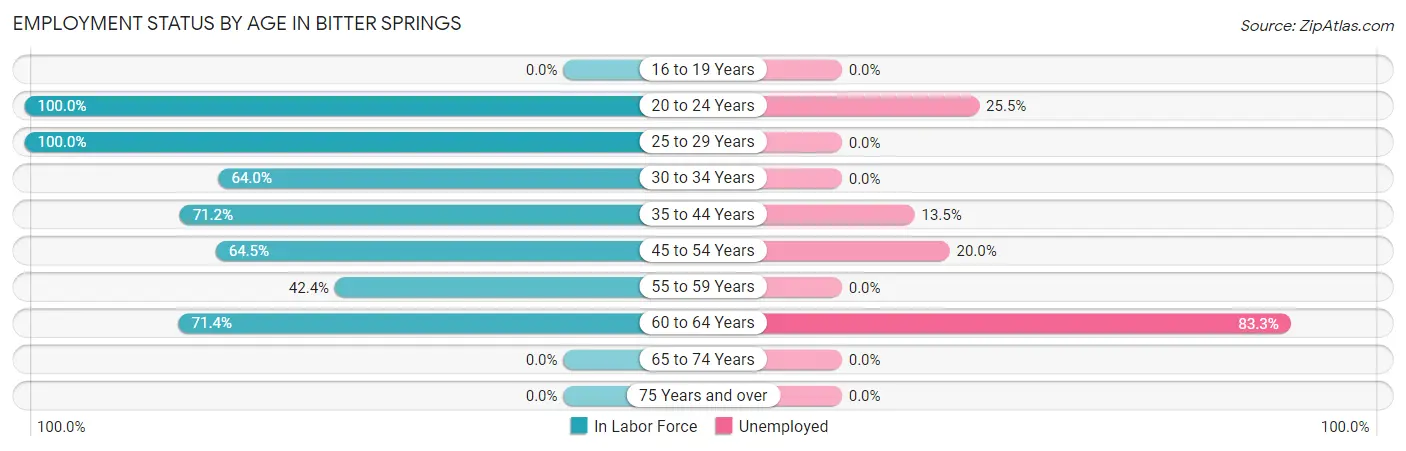
| Age Bracket | In Labor Force | Unemployed |
| 16 to 19 Years | 0 (0.0%) | 0 (0.0%) |
| 20 to 24 Years | 47 (100.0%) | 12 (25.5%) |
| 25 to 29 Years | 4 (100.0%) | 0 (0.0%) |
| 30 to 34 Years | 16 (64.0%) | 0 (0.0%) |
| 35 to 44 Years | 37 (71.2%) | 5 (13.5%) |
| 45 to 54 Years | 20 (64.5%) | 4 (20.0%) |
| 55 to 59 Years | 14 (42.4%) | 0 (0.0%) |
| 60 to 64 Years | 30 (71.4%) | 25 (83.3%) |
| 65 to 74 Years | 0 (0.0%) | 0 (0.0%) |
| 75 Years and over | 0 (0.0%) | 0 (0.0%) |
| Total | 168 (58.1%) | 46 (27.4%) |
Employment Status by Educational Attainment in Bitter Springs
According to labor force statistics for Bitter Springs, 64.7% of individuals (121) out of the total population between 25 and 64 years of age (187) are in the labor force, with 28.1% or 34 of them being unemployed. The group with the highest labor force participation rate are those with the educational attainment of college / associate degree, with 86.7% or 26 individuals in the labor force. Within the labor force, individuals with less than high school education have the highest percentage of unemployment, with 59.2% or 29 of them being unemployed.
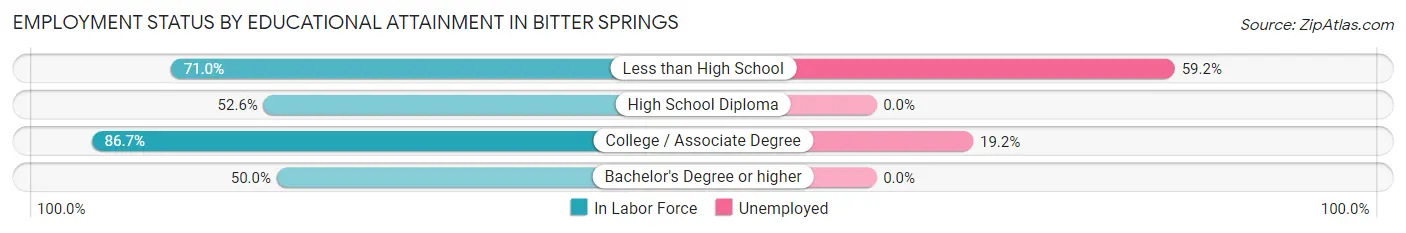
| Educational Attainment | In Labor Force | Unemployed |
| Less than High School | 49 (71.0%) | 41 (59.2%) |
| High School Diploma | 41 (52.6%) | 0 (0.0%) |
| College / Associate Degree | 26 (86.7%) | 6 (19.2%) |
| Bachelor's Degree or higher | 5 (50.0%) | 0 (0.0%) |
| Total | 121 (64.7%) | 53 (28.1%) |
Employment Occupations by Sex in Bitter Springs
Management, Business, Science and Arts Occupations
The most common Management, Business, Science and Arts occupations in Bitter Springs are , and Health Diagnosing & Treating (3 | 2.5%).
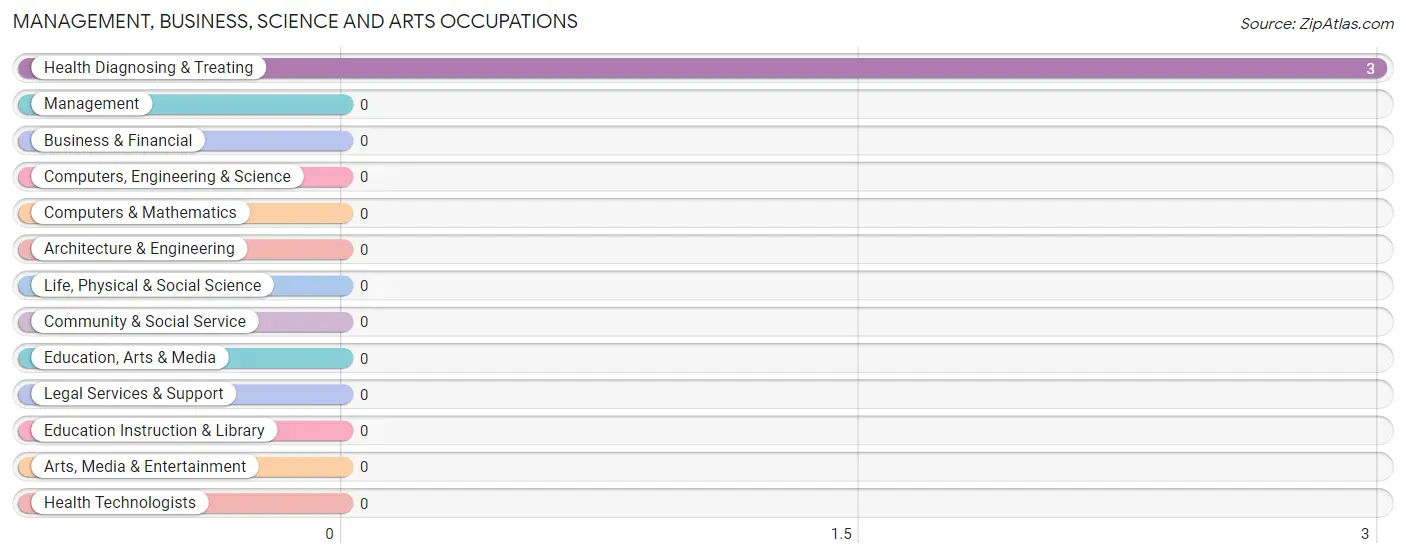
Management, Business, Science and Arts Occupations by Sex
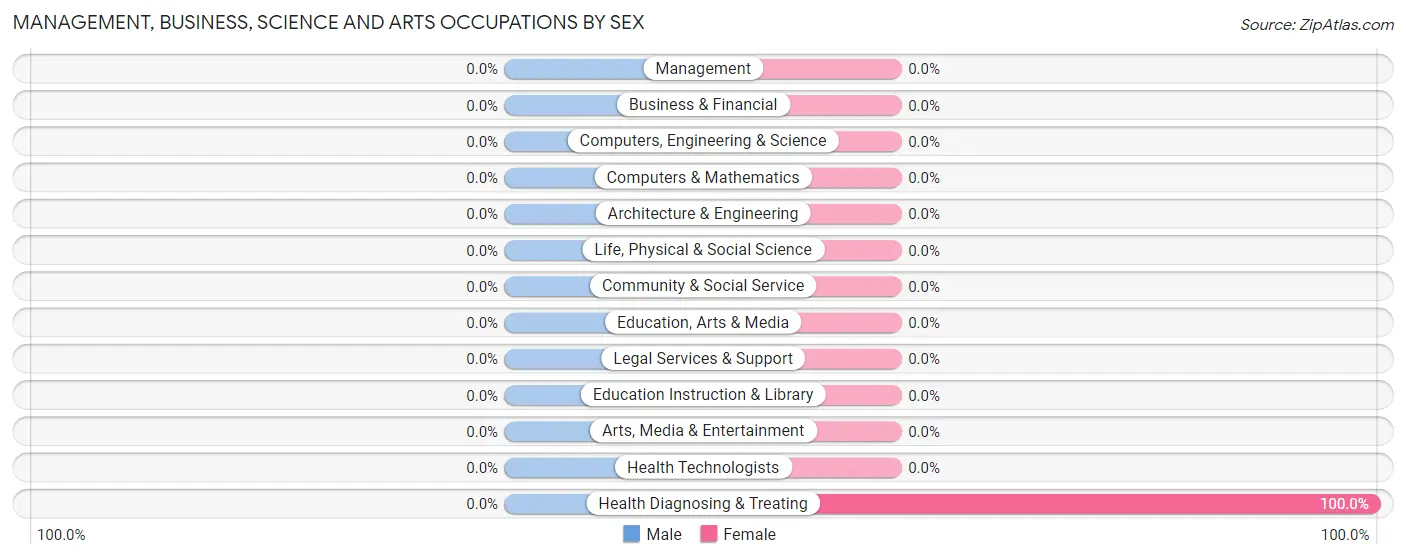
| Occupation | Male | Female |
| Management | 0 (0.0%) | 0 (0.0%) |
| Business & Financial | 0 (0.0%) | 0 (0.0%) |
| Computers, Engineering & Science | 0 (0.0%) | 0 (0.0%) |
| Computers & Mathematics | 0 (0.0%) | 0 (0.0%) |
| Architecture & Engineering | 0 (0.0%) | 0 (0.0%) |
| Life, Physical & Social Science | 0 (0.0%) | 0 (0.0%) |
| Community & Social Service | 0 (0.0%) | 0 (0.0%) |
| Education, Arts & Media | 0 (0.0%) | 0 (0.0%) |
| Legal Services & Support | 0 (0.0%) | 0 (0.0%) |
| Education Instruction & Library | 0 (0.0%) | 0 (0.0%) |
| Arts, Media & Entertainment | 0 (0.0%) | 0 (0.0%) |
| Health Diagnosing & Treating | 0 (0.0%) | 3 (100.0%) |
| Health Technologists | 0 (0.0%) | 0 (0.0%) |
| Total (Category) | 0 (0.0%) | 3 (100.0%) |
| Total (Overall) | 50 (41.0%) | 72 (59.0%) |
Services Occupations
The most common Services occupations in Bitter Springs are Healthcare Support (11 | 9.0%), Food Preparation & Serving (5 | 4.1%), and Cleaning & Maintenance (5 | 4.1%).
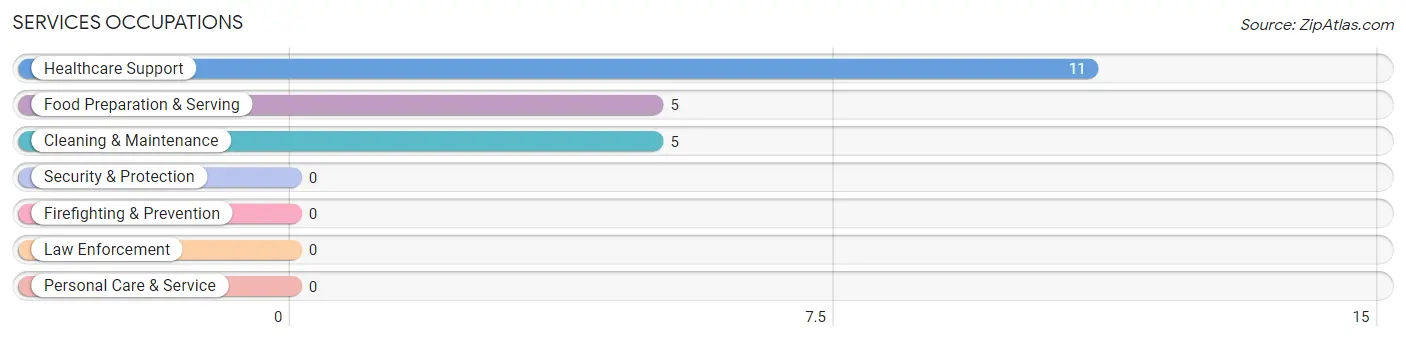
Services Occupations by Sex
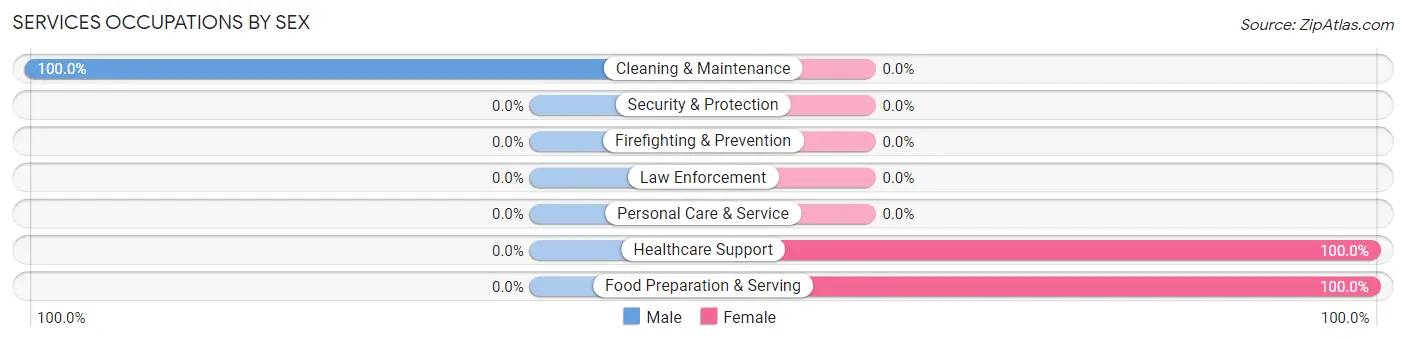
| Occupation | Male | Female |
| Healthcare Support | 0 (0.0%) | 11 (100.0%) |
| Security & Protection | 0 (0.0%) | 0 (0.0%) |
| Firefighting & Prevention | 0 (0.0%) | 0 (0.0%) |
| Law Enforcement | 0 (0.0%) | 0 (0.0%) |
| Food Preparation & Serving | 0 (0.0%) | 5 (100.0%) |
| Cleaning & Maintenance | 5 (100.0%) | 0 (0.0%) |
| Personal Care & Service | 0 (0.0%) | 0 (0.0%) |
| Total (Category) | 5 (23.8%) | 16 (76.2%) |
| Total (Overall) | 50 (41.0%) | 72 (59.0%) |
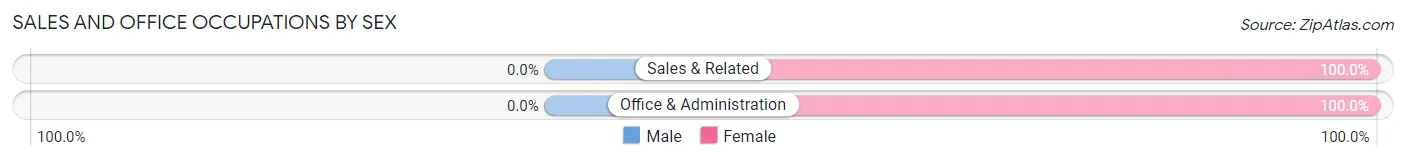
Sales and Office Occupations
The most common Sales and Office occupations in Bitter Springs are Sales & Related (9 | 7.4%), and Office & Administration (5 | 4.1%).
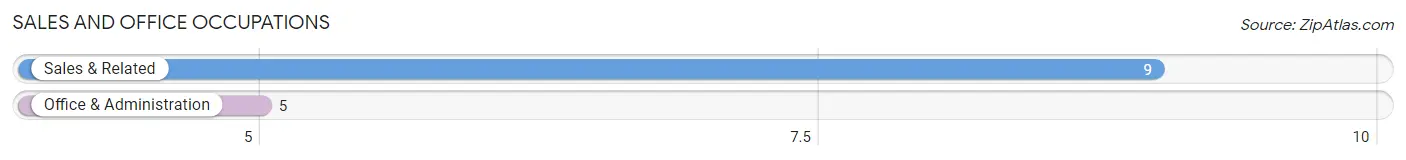
Sales and Office Occupations by Sex
| Occupation | Male | Female |
| Sales & Related | 0 (0.0%) | 9 (100.0%) |
| Office & Administration | 0 (0.0%) | 5 (100.0%) |
| Total (Category) | 0 (0.0%) | 14 (100.0%) |
| Total (Overall) | 50 (41.0%) | 72 (59.0%) |
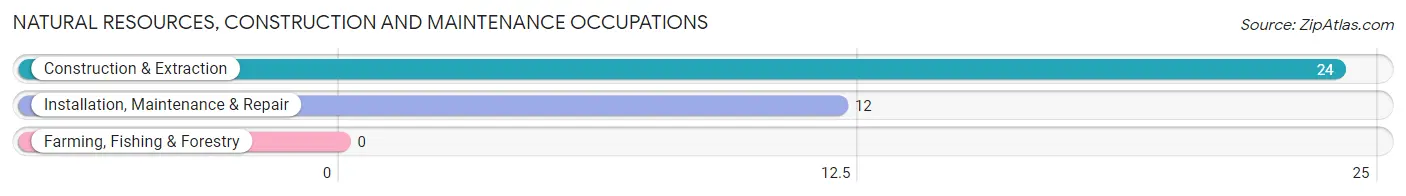
Natural Resources, Construction and Maintenance Occupations
The most common Natural Resources, Construction and Maintenance occupations in Bitter Springs are Construction & Extraction (24 | 19.7%), and Installation, Maintenance & Repair (12 | 9.8%).
Natural Resources, Construction and Maintenance Occupations by Sex
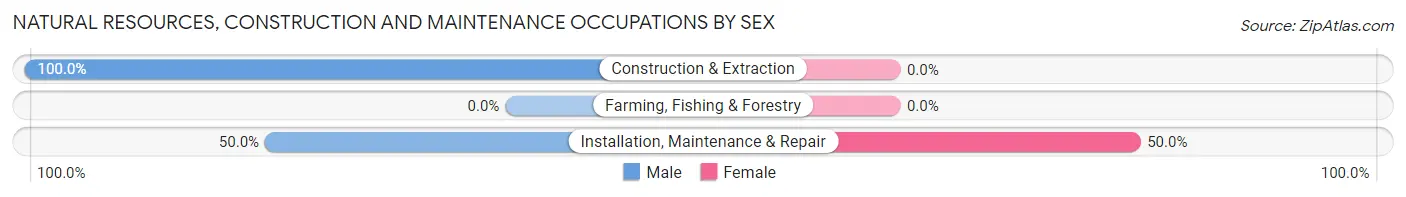
| Occupation | Male | Female |
| Farming, Fishing & Forestry | 0 (0.0%) | 0 (0.0%) |
| Construction & Extraction | 24 (100.0%) | 0 (0.0%) |
| Installation, Maintenance & Repair | 6 (50.0%) | 6 (50.0%) |
| Total (Category) | 30 (83.3%) | 6 (16.7%) |
| Total (Overall) | 50 (41.0%) | 72 (59.0%) |
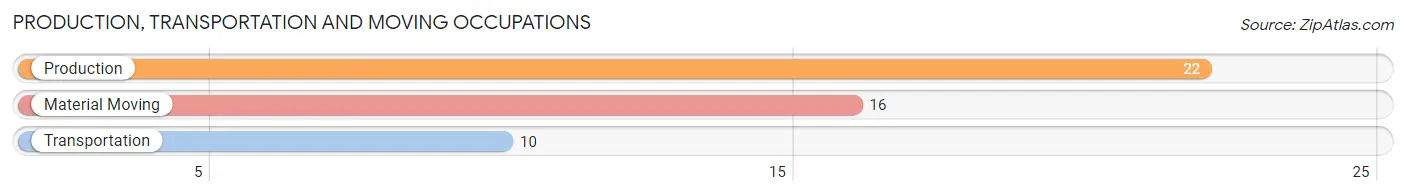
Production, Transportation and Moving Occupations
The most common Production, Transportation and Moving occupations in Bitter Springs are Production (22 | 18.0%), Material Moving (16 | 13.1%), and Transportation (10 | 8.2%).
Production, Transportation and Moving Occupations by Sex
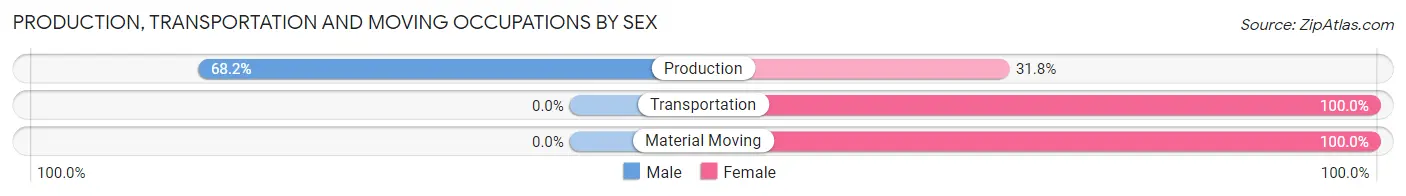
| Occupation | Male | Female |
| Production | 15 (68.2%) | 7 (31.8%) |
| Transportation | 0 (0.0%) | 10 (100.0%) |
| Material Moving | 0 (0.0%) | 16 (100.0%) |
| Total (Category) | 15 (31.2%) | 33 (68.8%) |
| Total (Overall) | 50 (41.0%) | 72 (59.0%) |
Employment Industries by Sex in Bitter Springs
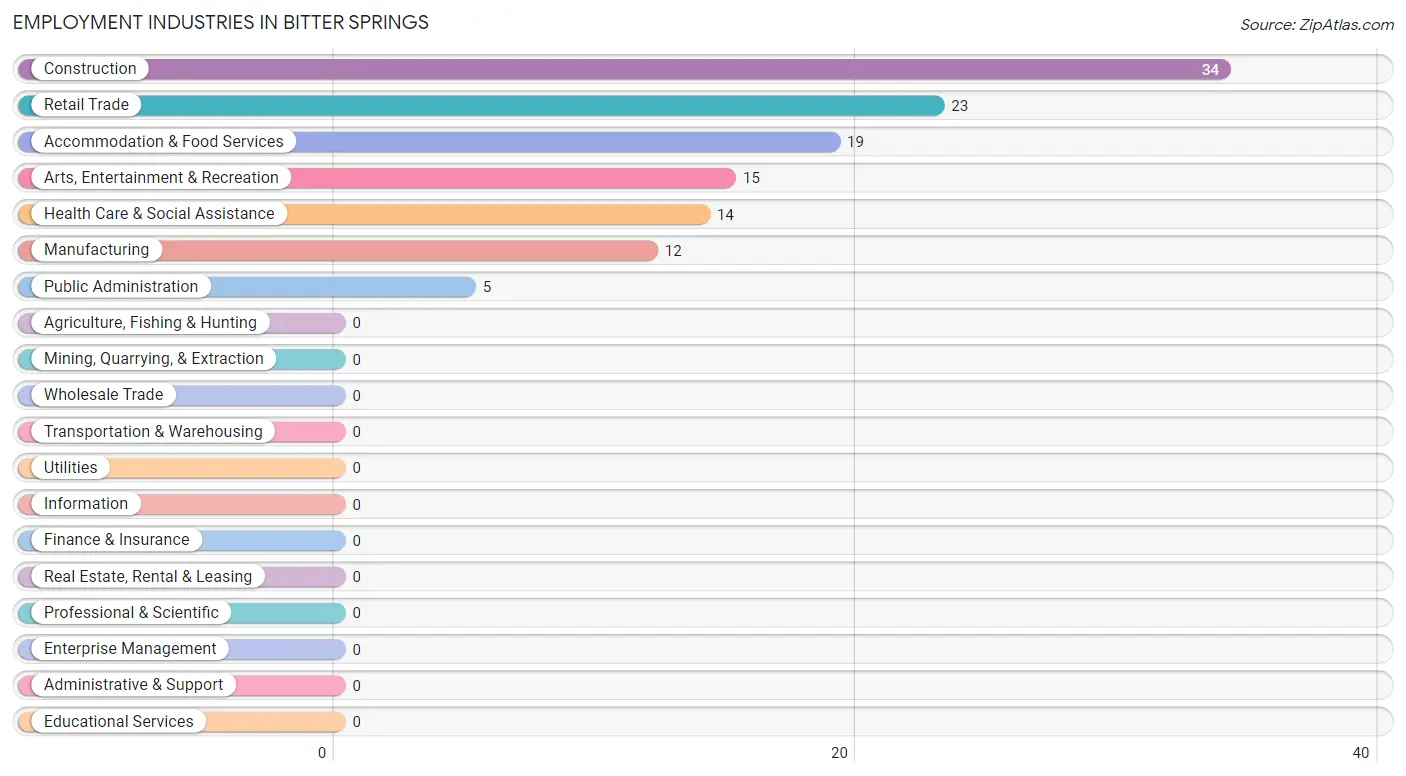
Employment Industries in Bitter Springs
The major employment industries in Bitter Springs include Construction (34 | 27.9%), Retail Trade (23 | 18.9%), Accommodation & Food Services (19 | 15.6%), Arts, Entertainment & Recreation (15 | 12.3%), and Health Care & Social Assistance (14 | 11.5%).
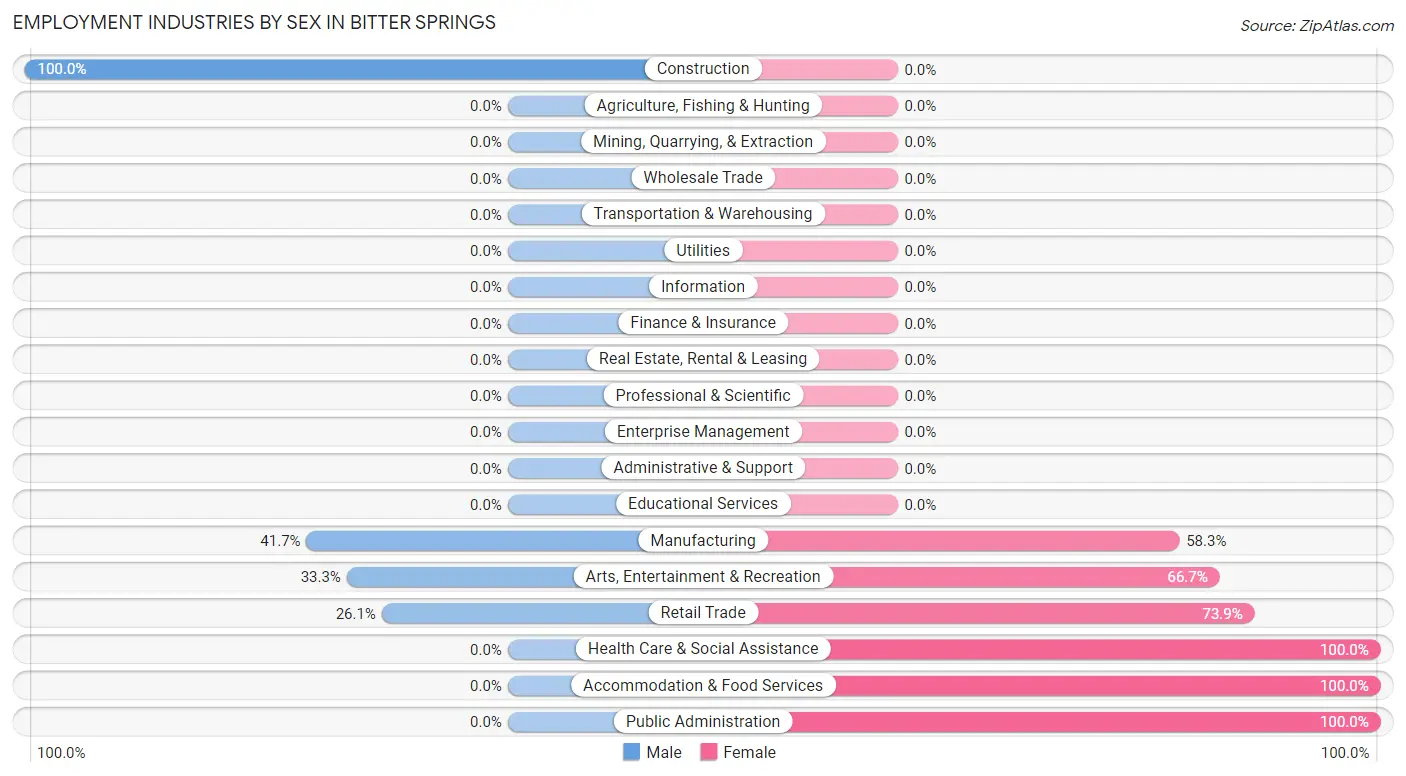
Employment Industries by Sex in Bitter Springs
The Bitter Springs industries that see more men than women are Construction (100.0%), Manufacturing (41.7%), and Arts, Entertainment & Recreation (33.3%), whereas the industries that tend to have a higher number of women are Health Care & Social Assistance (100.0%), Accommodation & Food Services (100.0%), and Public Administration (100.0%).
| Industry | Male | Female |
| Agriculture, Fishing & Hunting | 0 (0.0%) | 0 (0.0%) |
| Mining, Quarrying, & Extraction | 0 (0.0%) | 0 (0.0%) |
| Construction | 34 (100.0%) | 0 (0.0%) |
| Manufacturing | 5 (41.7%) | 7 (58.3%) |
| Wholesale Trade | 0 (0.0%) | 0 (0.0%) |
| Retail Trade | 6 (26.1%) | 17 (73.9%) |
| Transportation & Warehousing | 0 (0.0%) | 0 (0.0%) |
| Utilities | 0 (0.0%) | 0 (0.0%) |
| Information | 0 (0.0%) | 0 (0.0%) |
| Finance & Insurance | 0 (0.0%) | 0 (0.0%) |
| Real Estate, Rental & Leasing | 0 (0.0%) | 0 (0.0%) |
| Professional & Scientific | 0 (0.0%) | 0 (0.0%) |
| Enterprise Management | 0 (0.0%) | 0 (0.0%) |
| Administrative & Support | 0 (0.0%) | 0 (0.0%) |
| Educational Services | 0 (0.0%) | 0 (0.0%) |
| Health Care & Social Assistance | 0 (0.0%) | 14 (100.0%) |
| Arts, Entertainment & Recreation | 5 (33.3%) | 10 (66.7%) |
| Accommodation & Food Services | 0 (0.0%) | 19 (100.0%) |
| Public Administration | 0 (0.0%) | 5 (100.0%) |
| Total | 50 (41.0%) | 72 (59.0%) |
Education in Bitter Springs
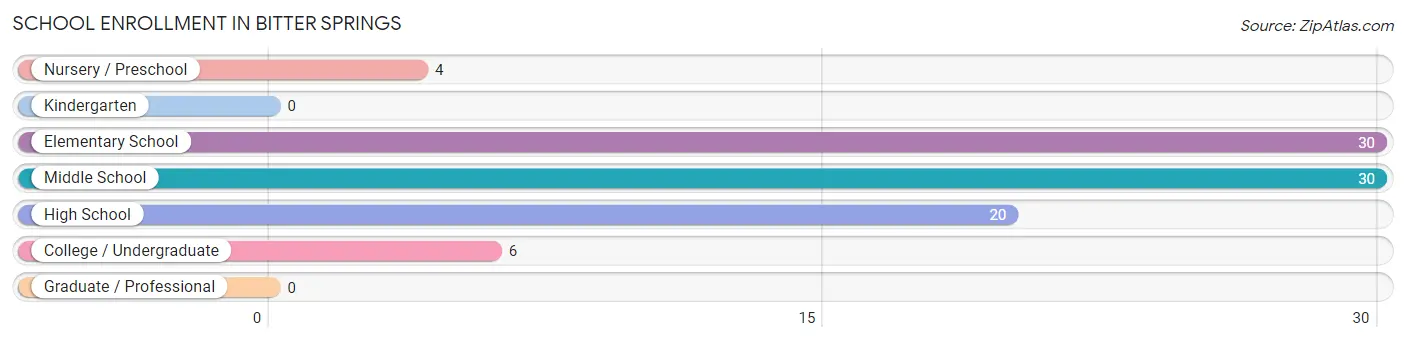
School Enrollment in Bitter Springs
The most common levels of schooling among the 90 students in Bitter Springs are elementary school (30 | 33.3%), middle school (30 | 33.3%), and high school (20 | 22.2%).
| School Level | # Students | % Students |
| Nursery / Preschool | 4 | 4.4% |
| Kindergarten | 0 | 0.0% |
| Elementary School | 30 | 33.3% |
| Middle School | 30 | 33.3% |
| High School | 20 | 22.2% |
| College / Undergraduate | 6 | 6.7% |
| Graduate / Professional | 0 | 0.0% |
| Total | 90 | 100.0% |
School Enrollment by Age by Funding Source in Bitter Springs
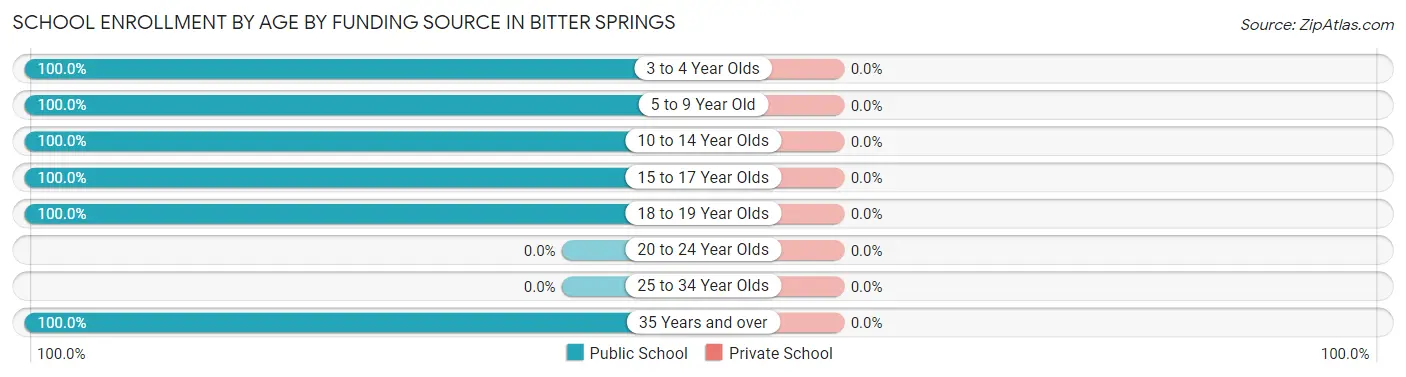
| Age Bracket | Public School | Private School |
| 3 to 4 Year Olds | 4 (100.0%) | 0 (0.0%) |
| 5 to 9 Year Old | 30 (100.0%) | 0 (0.0%) |
| 10 to 14 Year Olds | 30 (100.0%) | 0 (0.0%) |
| 15 to 17 Year Olds | 16 (100.0%) | 0 (0.0%) |
| 18 to 19 Year Olds | 4 (100.0%) | 0 (0.0%) |
| 20 to 24 Year Olds | 0 (0.0%) | 0 (0.0%) |
| 25 to 34 Year Olds | 0 (0.0%) | 0 (0.0%) |
| 35 Years and over | 6 (100.0%) | 0 (0.0%) |
| Total | 90 (100.0%) | 0 (0.0%) |
Educational Attainment by Field of Study in Bitter Springs
Social sciences (5 | 50.0%), and education (5 | 50.0%) are the most common fields of study among 10 individuals in Bitter Springs who have obtained a bachelor's degree or higher.
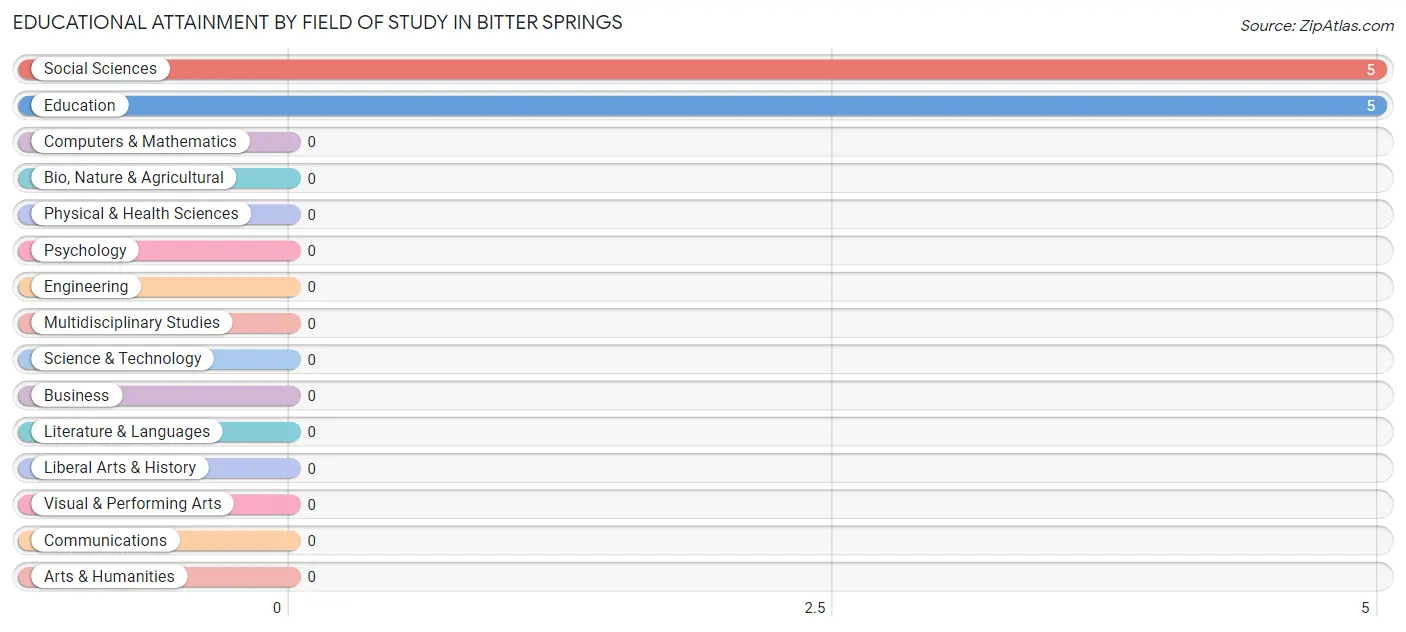
| Field of Study | # Graduates | % Graduates |
| Computers & Mathematics | 0 | 0.0% |
| Bio, Nature & Agricultural | 0 | 0.0% |
| Physical & Health Sciences | 0 | 0.0% |
| Psychology | 0 | 0.0% |
| Social Sciences | 5 | 50.0% |
| Engineering | 0 | 0.0% |
| Multidisciplinary Studies | 0 | 0.0% |
| Science & Technology | 0 | 0.0% |
| Business | 0 | 0.0% |
| Education | 5 | 50.0% |
| Literature & Languages | 0 | 0.0% |
| Liberal Arts & History | 0 | 0.0% |
| Visual & Performing Arts | 0 | 0.0% |
| Communications | 0 | 0.0% |
| Arts & Humanities | 0 | 0.0% |
| Total | 10 | 100.0% |
Transportation & Commute in Bitter Springs
Vehicle Availability by Sex in Bitter Springs
The most prevalent vehicle ownership categories in Bitter Springs are males with 1 vehicle (27, accounting for 54.0%) and females with 1 vehicle (39, making up 37.5%).
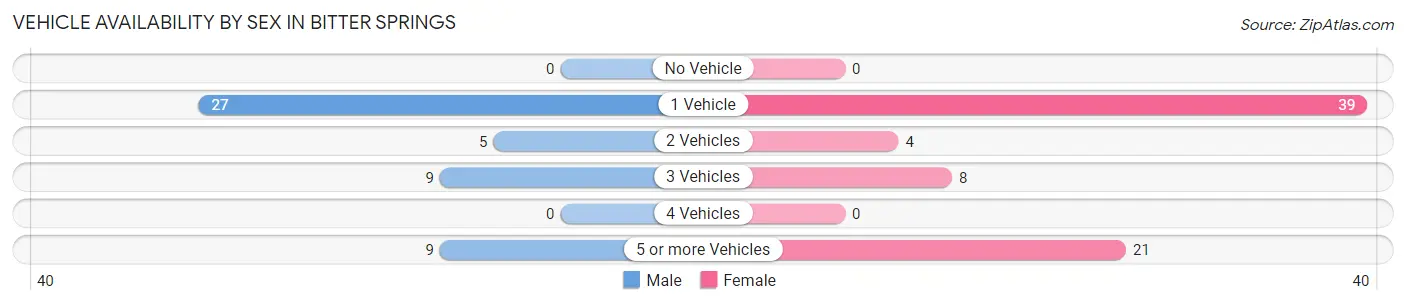
| Vehicles Available | Male | Female |
| No Vehicle | 0 (0.0%) | 0 (0.0%) |
| 1 Vehicle | 27 (54.0%) | 39 (54.2%) |
| 2 Vehicles | 5 (10.0%) | 4 (5.6%) |
| 3 Vehicles | 9 (18.0%) | 8 (11.1%) |
| 4 Vehicles | 0 (0.0%) | 0 (0.0%) |
| 5 or more Vehicles | 9 (18.0%) | 21 (29.2%) |
| Total | 50 (100.0%) | 72 (100.0%) |
Commute Time in Bitter Springs
The most frequently occuring commute durations in Bitter Springs are 30 to 34 minutes (32 commuters, 26.2%), 5 to 9 minutes (21 commuters, 17.2%), and 45 to 59 minutes (16 commuters, 13.1%).
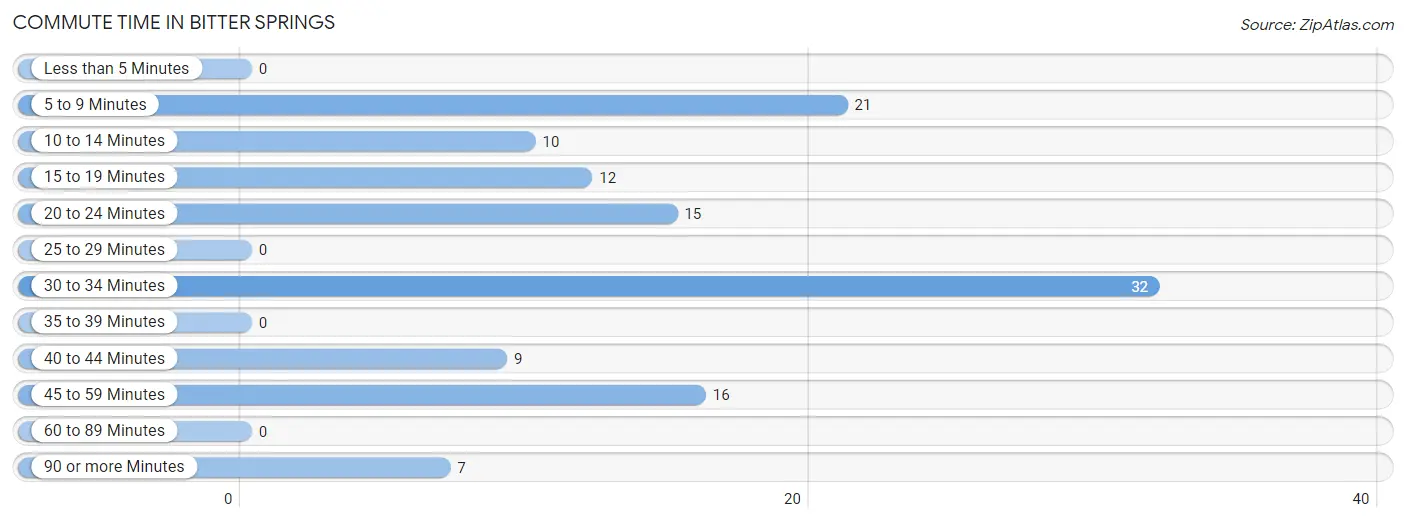
| Commute Time | # Commuters | % Commuters |
| Less than 5 Minutes | 0 | 0.0% |
| 5 to 9 Minutes | 21 | 17.2% |
| 10 to 14 Minutes | 10 | 8.2% |
| 15 to 19 Minutes | 12 | 9.8% |
| 20 to 24 Minutes | 15 | 12.3% |
| 25 to 29 Minutes | 0 | 0.0% |
| 30 to 34 Minutes | 32 | 26.2% |
| 35 to 39 Minutes | 0 | 0.0% |
| 40 to 44 Minutes | 9 | 7.4% |
| 45 to 59 Minutes | 16 | 13.1% |
| 60 to 89 Minutes | 0 | 0.0% |
| 90 or more Minutes | 7 | 5.7% |
Commute Time by Sex in Bitter Springs
The most common commute times in Bitter Springs are 5 to 9 minutes (21 commuters, 42.0%) for males and 30 to 34 minutes (22 commuters, 30.6%) for females.
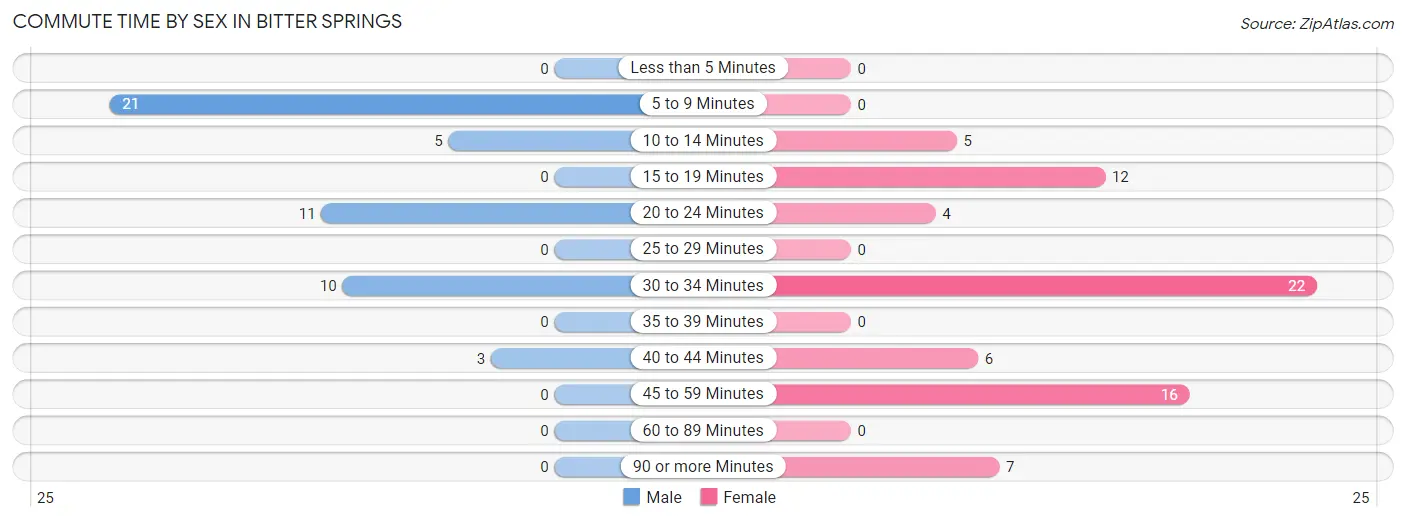
| Commute Time | Male | Female |
| Less than 5 Minutes | 0 (0.0%) | 0 (0.0%) |
| 5 to 9 Minutes | 21 (42.0%) | 0 (0.0%) |
| 10 to 14 Minutes | 5 (10.0%) | 5 (6.9%) |
| 15 to 19 Minutes | 0 (0.0%) | 12 (16.7%) |
| 20 to 24 Minutes | 11 (22.0%) | 4 (5.6%) |
| 25 to 29 Minutes | 0 (0.0%) | 0 (0.0%) |
| 30 to 34 Minutes | 10 (20.0%) | 22 (30.6%) |
| 35 to 39 Minutes | 0 (0.0%) | 0 (0.0%) |
| 40 to 44 Minutes | 3 (6.0%) | 6 (8.3%) |
| 45 to 59 Minutes | 0 (0.0%) | 16 (22.2%) |
| 60 to 89 Minutes | 0 (0.0%) | 0 (0.0%) |
| 90 or more Minutes | 0 (0.0%) | 7 (9.7%) |
Time of Departure to Work by Sex in Bitter Springs
The most frequent times of departure to work in Bitter Springs are 6:30 AM to 6:59 AM (21, 42.0%) for males and 6:00 AM to 6:29 AM (18, 25.0%) for females.
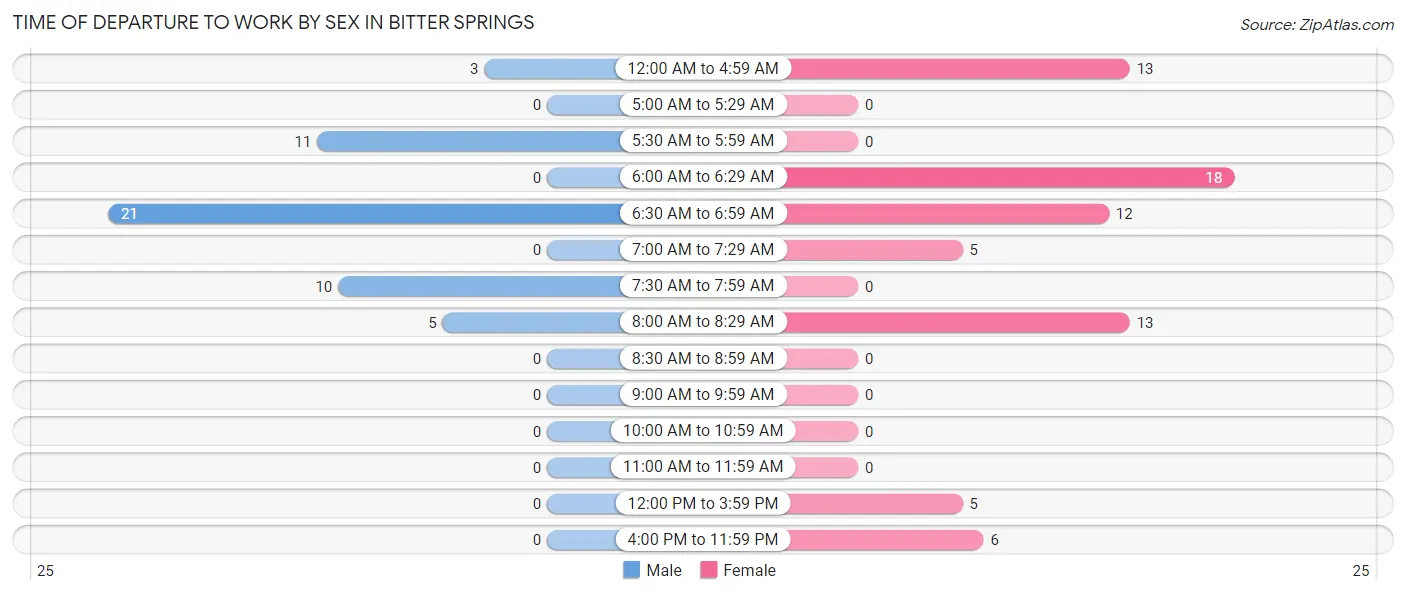
| Time of Departure | Male | Female |
| 12:00 AM to 4:59 AM | 3 (6.0%) | 13 (18.1%) |
| 5:00 AM to 5:29 AM | 0 (0.0%) | 0 (0.0%) |
| 5:30 AM to 5:59 AM | 11 (22.0%) | 0 (0.0%) |
| 6:00 AM to 6:29 AM | 0 (0.0%) | 18 (25.0%) |
| 6:30 AM to 6:59 AM | 21 (42.0%) | 12 (16.7%) |
| 7:00 AM to 7:29 AM | 0 (0.0%) | 5 (6.9%) |
| 7:30 AM to 7:59 AM | 10 (20.0%) | 0 (0.0%) |
| 8:00 AM to 8:29 AM | 5 (10.0%) | 13 (18.1%) |
| 8:30 AM to 8:59 AM | 0 (0.0%) | 0 (0.0%) |
| 9:00 AM to 9:59 AM | 0 (0.0%) | 0 (0.0%) |
| 10:00 AM to 10:59 AM | 0 (0.0%) | 0 (0.0%) |
| 11:00 AM to 11:59 AM | 0 (0.0%) | 0 (0.0%) |
| 12:00 PM to 3:59 PM | 0 (0.0%) | 5 (6.9%) |
| 4:00 PM to 11:59 PM | 0 (0.0%) | 6 (8.3%) |
| Total | 50 (100.0%) | 72 (100.0%) |
Housing Occupancy in Bitter Springs
Occupancy by Ownership in Bitter Springs
Of the total 128 dwellings in Bitter Springs, owner-occupied units account for 128 (100.0%), while renter-occupied units make up 0 (0.0%).
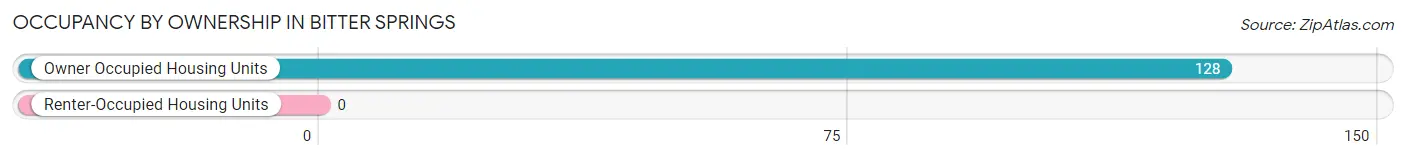
| Occupancy | # Housing Units | % Housing Units |
| Owner Occupied Housing Units | 128 | 100.0% |
| Renter-Occupied Housing Units | 0 | 0.0% |
| Total Occupied Housing Units | 128 | 100.0% |
Occupancy by Household Size in Bitter Springs
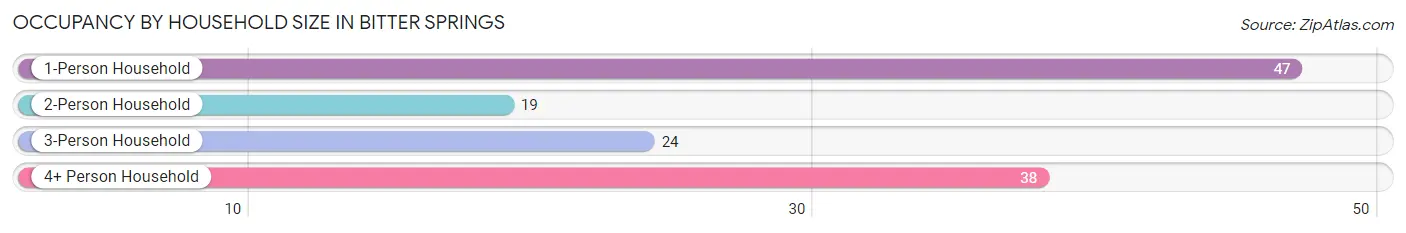
| Household Size | # Housing Units | % Housing Units |
| 1-Person Household | 47 | 36.7% |
| 2-Person Household | 19 | 14.8% |
| 3-Person Household | 24 | 18.8% |
| 4+ Person Household | 38 | 29.7% |
| Total Housing Units | 128 | 100.0% |
Occupancy by Ownership by Household Size in Bitter Springs
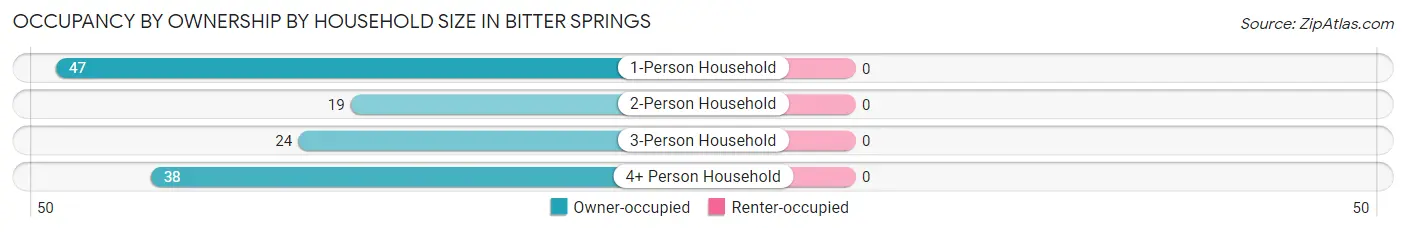
| Household Size | Owner-occupied | Renter-occupied |
| 1-Person Household | 47 (100.0%) | 0 (0.0%) |
| 2-Person Household | 19 (100.0%) | 0 (0.0%) |
| 3-Person Household | 24 (100.0%) | 0 (0.0%) |
| 4+ Person Household | 38 (100.0%) | 0 (0.0%) |
| Total Housing Units | 128 (100.0%) | 0 (0.0%) |
Occupancy by Educational Attainment in Bitter Springs
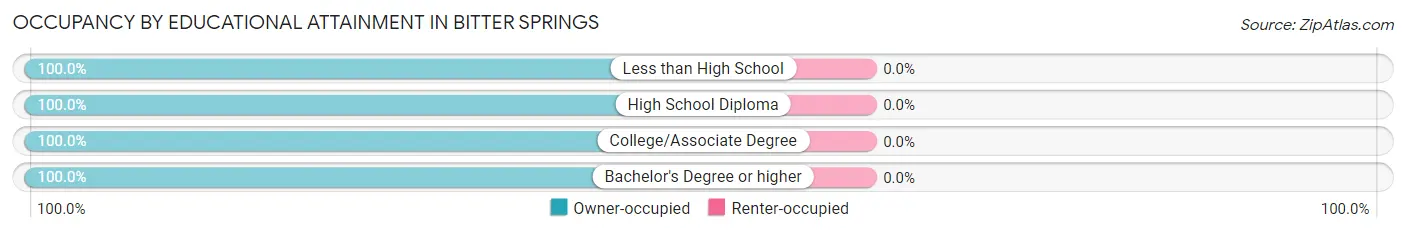
| Household Size | Owner-occupied | Renter-occupied |
| Less than High School | 71 (100.0%) | 0 (0.0%) |
| High School Diploma | 37 (100.0%) | 0 (0.0%) |
| College/Associate Degree | 15 (100.0%) | 0 (0.0%) |
| Bachelor's Degree or higher | 5 (100.0%) | 0 (0.0%) |
Occupancy by Age of Householder in Bitter Springs
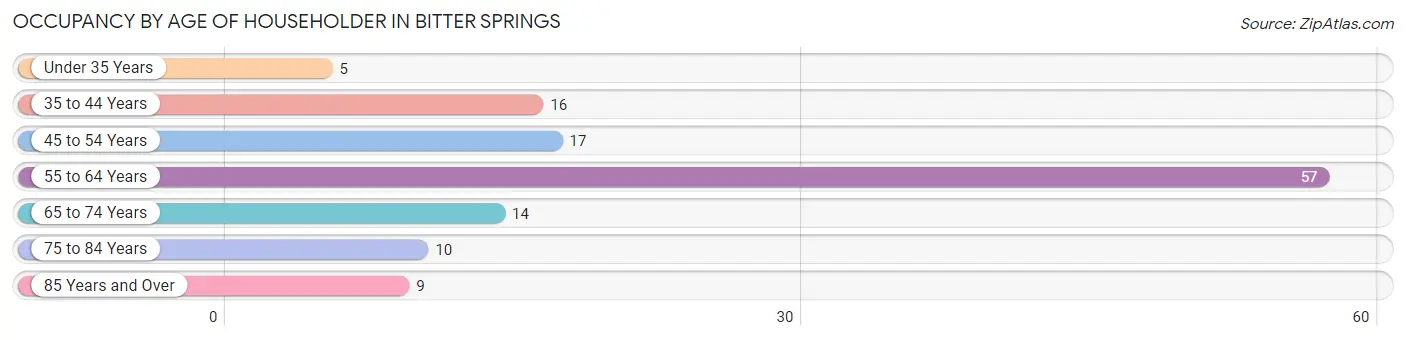
| Age Bracket | # Households | % Households |
| Under 35 Years | 5 | 3.9% |
| 35 to 44 Years | 16 | 12.5% |
| 45 to 54 Years | 17 | 13.3% |
| 55 to 64 Years | 57 | 44.5% |
| 65 to 74 Years | 14 | 10.9% |
| 75 to 84 Years | 10 | 7.8% |
| 85 Years and Over | 9 | 7.0% |
| Total | 128 | 100.0% |
Housing Finances in Bitter Springs
Median Income by Occupancy in Bitter Springs
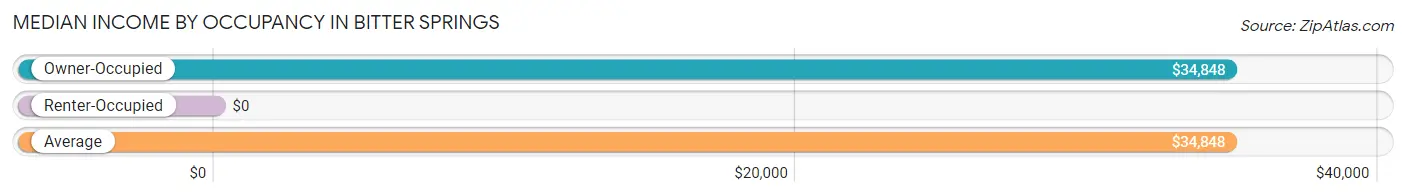
| Occupancy Type | # Households | Median Income |
| Owner-Occupied | 128 (100.0%) | $34,848 |
| Renter-Occupied | 0 (0.0%) | $0 |
| Average | 128 (100.0%) | $34,848 |
Occupancy by Householder Income Bracket in Bitter Springs
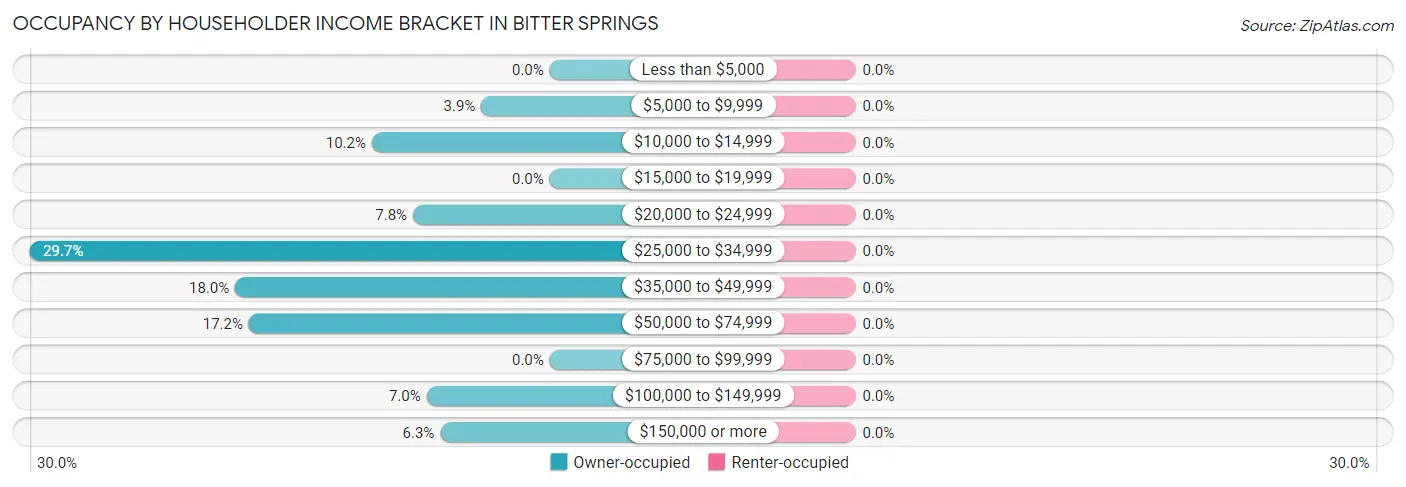
| Income Bracket | Owner-occupied | Renter-occupied |
| Less than $5,000 | 0 (0.0%) | 0 (0.0%) |
| $5,000 to $9,999 | 5 (3.9%) | 0 (0.0%) |
| $10,000 to $14,999 | 13 (10.2%) | 0 (0.0%) |
| $15,000 to $19,999 | 0 (0.0%) | 0 (0.0%) |
| $20,000 to $24,999 | 10 (7.8%) | 0 (0.0%) |
| $25,000 to $34,999 | 38 (29.7%) | 0 (0.0%) |
| $35,000 to $49,999 | 23 (18.0%) | 0 (0.0%) |
| $50,000 to $74,999 | 22 (17.2%) | 0 (0.0%) |
| $75,000 to $99,999 | 0 (0.0%) | 0 (0.0%) |
| $100,000 to $149,999 | 9 (7.0%) | 0 (0.0%) |
| $150,000 or more | 8 (6.2%) | 0 (0.0%) |
| Total | 128 (100.0%) | 0 (0.0%) |
Monthly Housing Cost Tiers in Bitter Springs
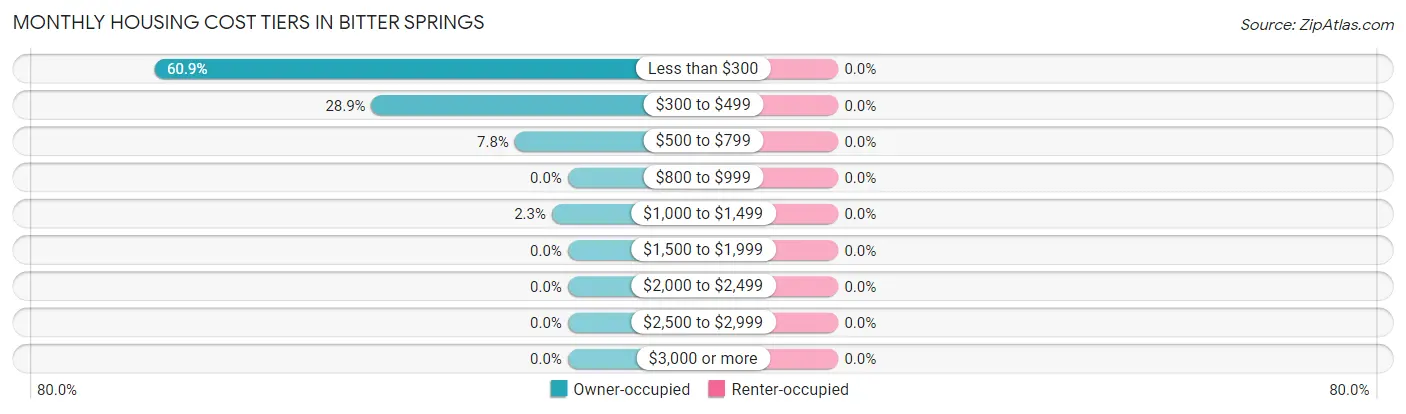
| Monthly Cost | Owner-occupied | Renter-occupied |
| Less than $300 | 78 (60.9%) | 0 (0.0%) |
| $300 to $499 | 37 (28.9%) | 0 (0.0%) |
| $500 to $799 | 10 (7.8%) | 0 (0.0%) |
| $800 to $999 | 0 (0.0%) | 0 (0.0%) |
| $1,000 to $1,499 | 3 (2.3%) | 0 (0.0%) |
| $1,500 to $1,999 | 0 (0.0%) | 0 (0.0%) |
| $2,000 to $2,499 | 0 (0.0%) | 0 (0.0%) |
| $2,500 to $2,999 | 0 (0.0%) | 0 (0.0%) |
| $3,000 or more | 0 (0.0%) | 0 (0.0%) |
| Total | 128 (100.0%) | 0 (0.0%) |
Physical Housing Characteristics in Bitter Springs
Housing Structures in Bitter Springs
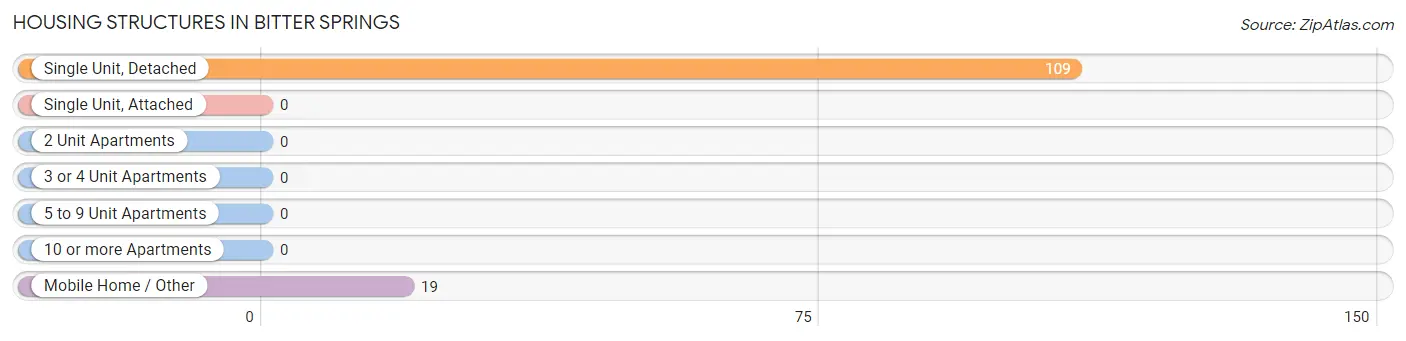
| Structure Type | # Housing Units | % Housing Units |
| Single Unit, Detached | 109 | 85.2% |
| Single Unit, Attached | 0 | 0.0% |
| 2 Unit Apartments | 0 | 0.0% |
| 3 or 4 Unit Apartments | 0 | 0.0% |
| 5 to 9 Unit Apartments | 0 | 0.0% |
| 10 or more Apartments | 0 | 0.0% |
| Mobile Home / Other | 19 | 14.8% |
| Total | 128 | 100.0% |
Housing Structures by Occupancy in Bitter Springs
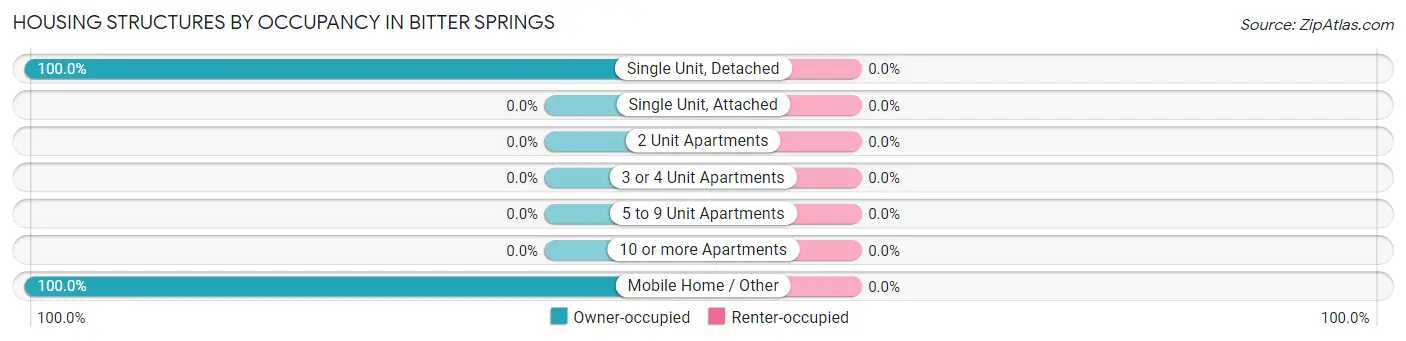
| Structure Type | Owner-occupied | Renter-occupied |
| Single Unit, Detached | 109 (100.0%) | 0 (0.0%) |
| Single Unit, Attached | 0 (0.0%) | 0 (0.0%) |
| 2 Unit Apartments | 0 (0.0%) | 0 (0.0%) |
| 3 or 4 Unit Apartments | 0 (0.0%) | 0 (0.0%) |
| 5 to 9 Unit Apartments | 0 (0.0%) | 0 (0.0%) |
| 10 or more Apartments | 0 (0.0%) | 0 (0.0%) |
| Mobile Home / Other | 19 (100.0%) | 0 (0.0%) |
| Total | 128 (100.0%) | 0 (0.0%) |
Housing Structures by Number of Rooms in Bitter Springs
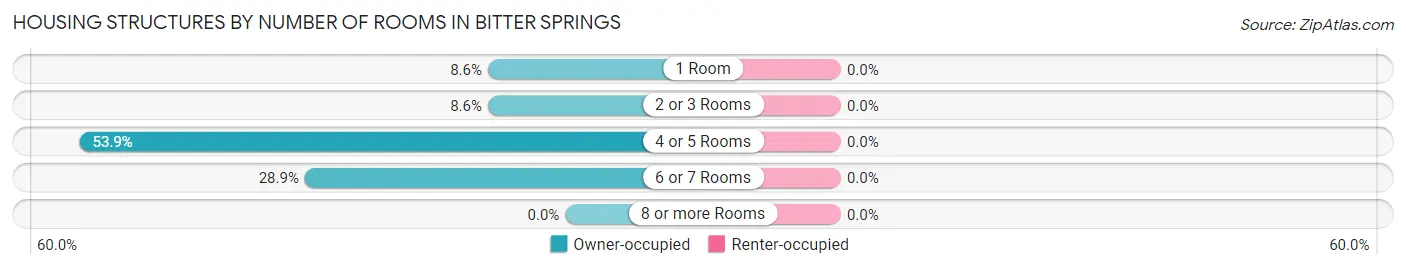
| Number of Rooms | Owner-occupied | Renter-occupied |
| 1 Room | 11 (8.6%) | 0 (0.0%) |
| 2 or 3 Rooms | 11 (8.6%) | 0 (0.0%) |
| 4 or 5 Rooms | 69 (53.9%) | 0 (0.0%) |
| 6 or 7 Rooms | 37 (28.9%) | 0 (0.0%) |
| 8 or more Rooms | 0 (0.0%) | 0 (0.0%) |
| Total | 128 (100.0%) | 0 (0.0%) |
Housing Structure by Heating Type in Bitter Springs
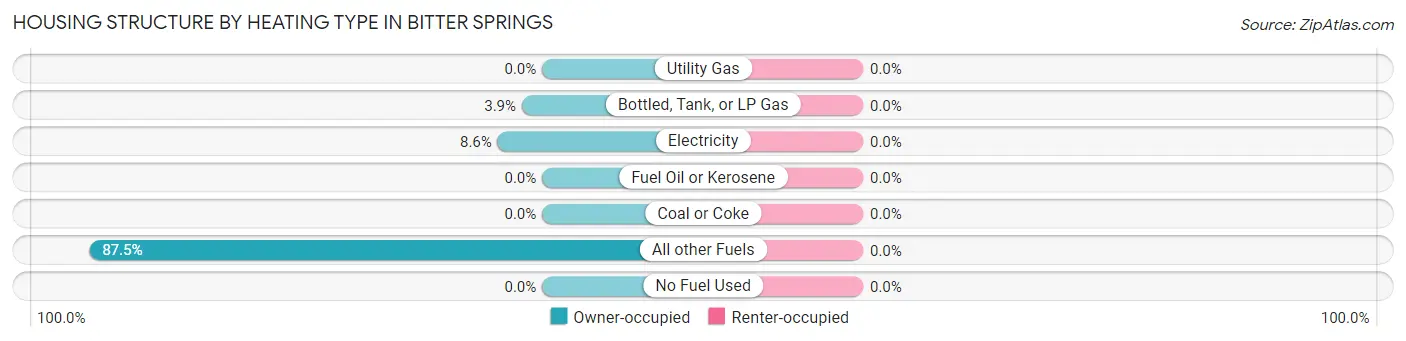
| Heating Type | Owner-occupied | Renter-occupied |
| Utility Gas | 0 (0.0%) | 0 (0.0%) |
| Bottled, Tank, or LP Gas | 5 (3.9%) | 0 (0.0%) |
| Electricity | 11 (8.6%) | 0 (0.0%) |
| Fuel Oil or Kerosene | 0 (0.0%) | 0 (0.0%) |
| Coal or Coke | 0 (0.0%) | 0 (0.0%) |
| All other Fuels | 112 (87.5%) | 0 (0.0%) |
| No Fuel Used | 0 (0.0%) | 0 (0.0%) |
| Total | 128 (100.0%) | 0 (0.0%) |
Household Vehicle Usage in Bitter Springs
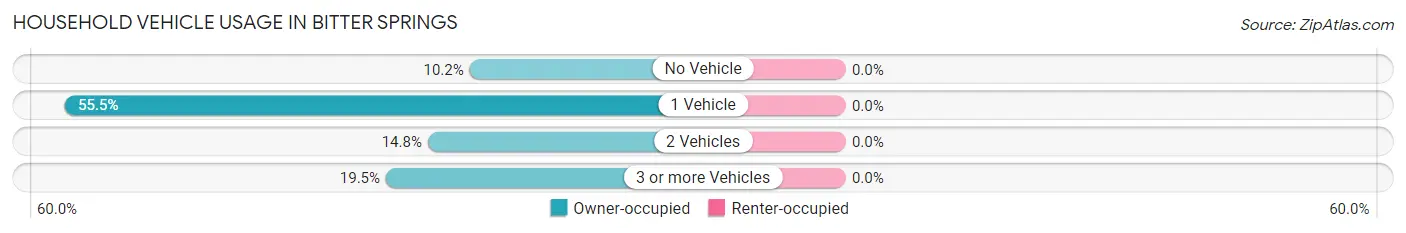
| Vehicles per Household | Owner-occupied | Renter-occupied |
| No Vehicle | 13 (10.2%) | 0 (0.0%) |
| 1 Vehicle | 71 (55.5%) | 0 (0.0%) |
| 2 Vehicles | 19 (14.8%) | 0 (0.0%) |
| 3 or more Vehicles | 25 (19.5%) | 0 (0.0%) |
| Total | 128 (100.0%) | 0 (0.0%) |
Real Estate & Mortgages in Bitter Springs
Real Estate and Mortgage Overview in Bitter Springs
| Characteristic | Without Mortgage | With Mortgage |
| Housing Units | 125 | 3 |
| Median Property Value | $56,100 | $0 |
| Median Household Income | $34,735 | $0 |
| Monthly Housing Costs | $270 | $0 |
| Real Estate Taxes | - | - |
Property Value by Mortgage Status in Bitter Springs
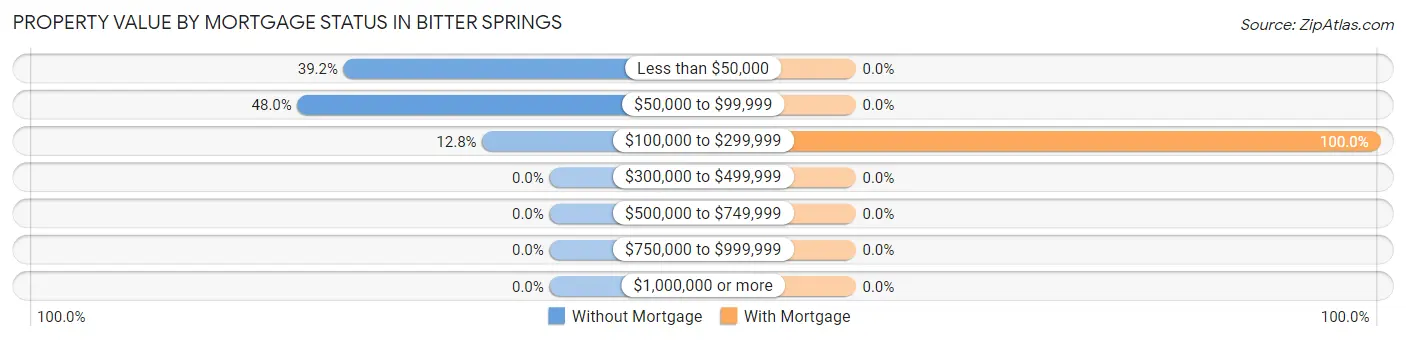
| Property Value | Without Mortgage | With Mortgage |
| Less than $50,000 | 49 (39.2%) | 0 (0.0%) |
| $50,000 to $99,999 | 60 (48.0%) | 0 (0.0%) |
| $100,000 to $299,999 | 16 (12.8%) | 3 (100.0%) |
| $300,000 to $499,999 | 0 (0.0%) | 0 (0.0%) |
| $500,000 to $749,999 | 0 (0.0%) | 0 (0.0%) |
| $750,000 to $999,999 | 0 (0.0%) | 0 (0.0%) |
| $1,000,000 or more | 0 (0.0%) | 0 (0.0%) |
| Total | 125 (100.0%) | 3 (100.0%) |
Household Income by Mortgage Status in Bitter Springs
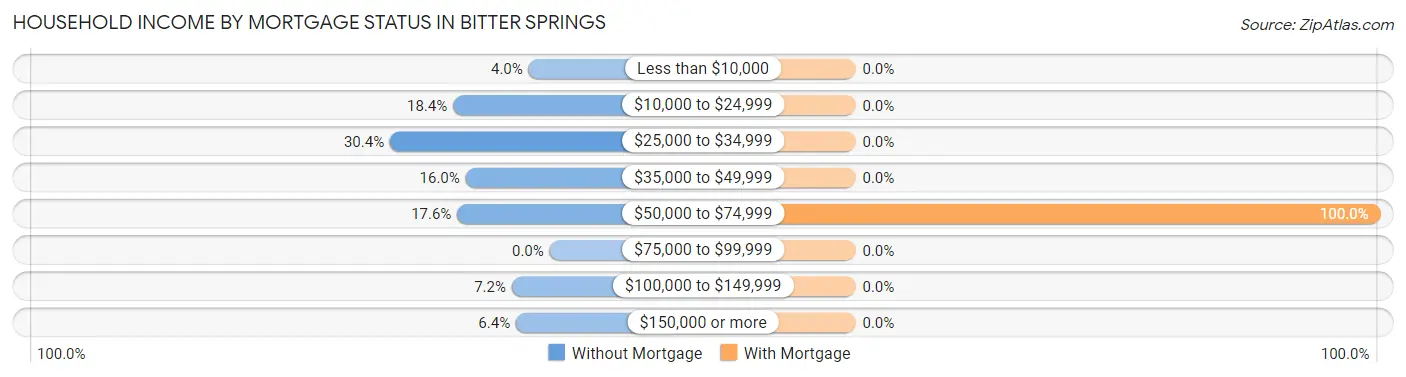
| Household Income | Without Mortgage | With Mortgage |
| Less than $10,000 | 5 (4.0%) | 0 (0.0%) |
| $10,000 to $24,999 | 23 (18.4%) | 0 (0.0%) |
| $25,000 to $34,999 | 38 (30.4%) | 0 (0.0%) |
| $35,000 to $49,999 | 20 (16.0%) | 0 (0.0%) |
| $50,000 to $74,999 | 22 (17.6%) | 3 (100.0%) |
| $75,000 to $99,999 | 0 (0.0%) | 0 (0.0%) |
| $100,000 to $149,999 | 9 (7.2%) | 0 (0.0%) |
| $150,000 or more | 8 (6.4%) | 0 (0.0%) |
| Total | 125 (100.0%) | 3 (100.0%) |
Property Value to Household Income Ratio in Bitter Springs
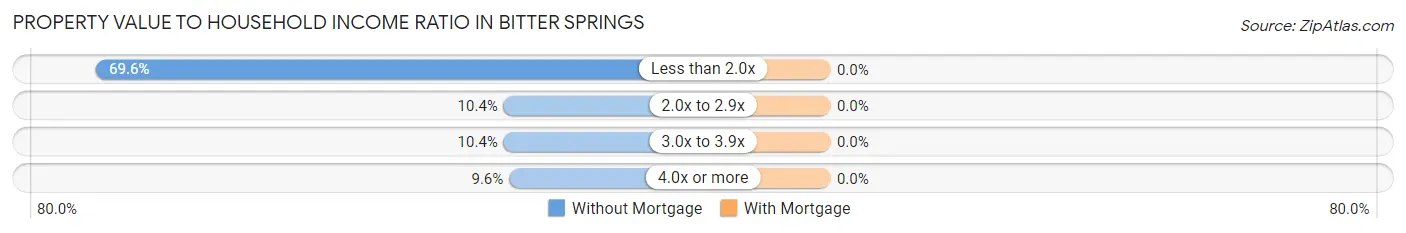
| Value-to-Income Ratio | Without Mortgage | With Mortgage |
| Less than 2.0x | 87 (69.6%) | 0 (0.0%) |
| 2.0x to 2.9x | 13 (10.4%) | 0 (0.0%) |
| 3.0x to 3.9x | 13 (10.4%) | 0 (0.0%) |
| 4.0x or more | 12 (9.6%) | 0 (0.0%) |
| Total | 125 (100.0%) | 3 (100.0%) |
Real Estate Taxes by Mortgage Status in Bitter Springs
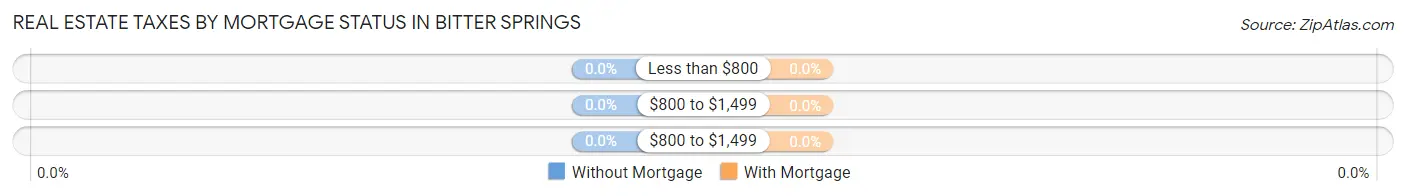
| Property Taxes | Without Mortgage | With Mortgage |
| Less than $800 | 0 (0.0%) | 0 (0.0%) |
| $800 to $1,499 | 0 (0.0%) | 0 (0.0%) |
| $800 to $1,499 | 0 (0.0%) | 0 (0.0%) |
| Total | 125 (100.0%) | 3 (100.0%) |
Health & Disability in Bitter Springs
Health Insurance Coverage by Age in Bitter Springs
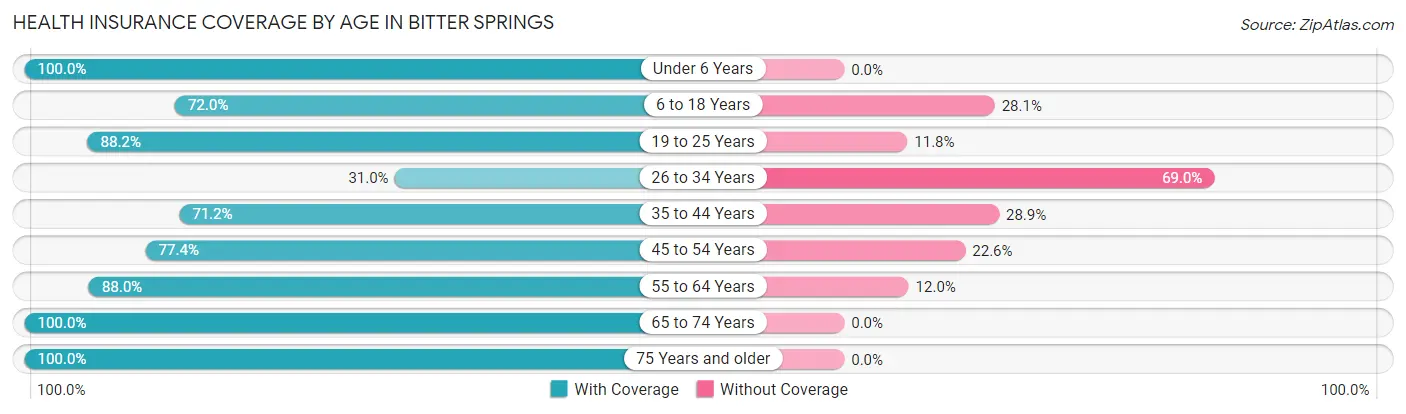
| Age Bracket | With Coverage | Without Coverage |
| Under 6 Years | 13 (100.0%) | 0 (0.0%) |
| 6 to 18 Years | 59 (72.0%) | 23 (28.1%) |
| 19 to 25 Years | 45 (88.2%) | 6 (11.8%) |
| 26 to 34 Years | 9 (31.0%) | 20 (69.0%) |
| 35 to 44 Years | 37 (71.2%) | 15 (28.8%) |
| 45 to 54 Years | 24 (77.4%) | 7 (22.6%) |
| 55 to 64 Years | 66 (88.0%) | 9 (12.0%) |
| 65 to 74 Years | 18 (100.0%) | 0 (0.0%) |
| 75 Years and older | 23 (100.0%) | 0 (0.0%) |
| Total | 294 (78.6%) | 80 (21.4%) |
Health Insurance Coverage by Citizenship Status in Bitter Springs
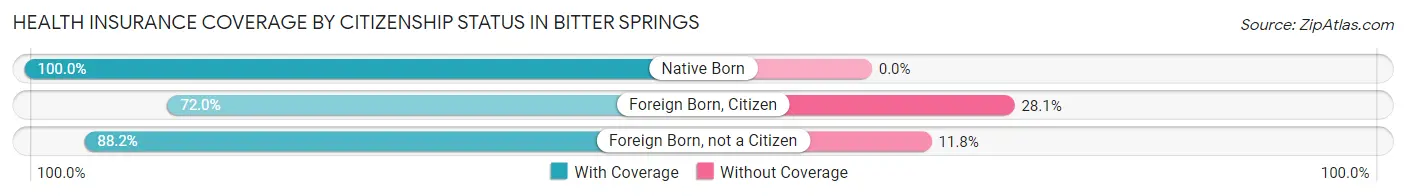
| Citizenship Status | With Coverage | Without Coverage |
| Native Born | 13 (100.0%) | 0 (0.0%) |
| Foreign Born, Citizen | 59 (72.0%) | 23 (28.1%) |
| Foreign Born, not a Citizen | 45 (88.2%) | 6 (11.8%) |
Health Insurance Coverage by Household Income in Bitter Springs
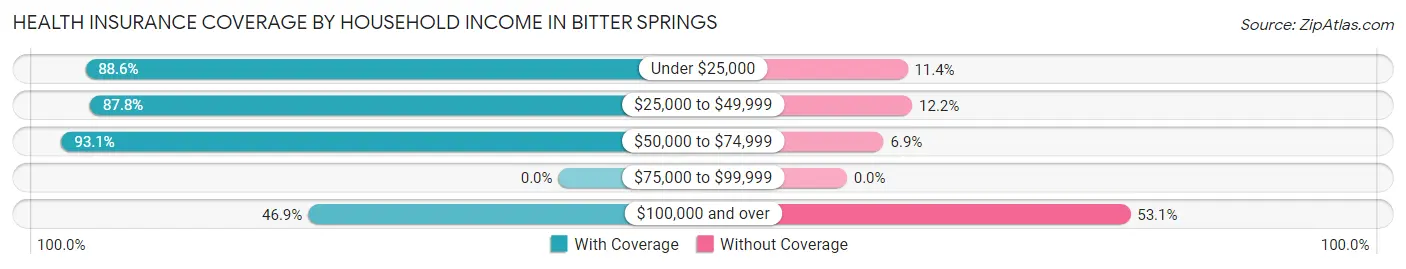
| Household Income | With Coverage | Without Coverage |
| Under $25,000 | 39 (88.6%) | 5 (11.4%) |
| $25,000 to $49,999 | 129 (87.8%) | 18 (12.2%) |
| $50,000 to $74,999 | 81 (93.1%) | 6 (6.9%) |
| $75,000 to $99,999 | 0 (0.0%) | 0 (0.0%) |
| $100,000 and over | 45 (46.9%) | 51 (53.1%) |
Public vs Private Health Insurance Coverage by Age in Bitter Springs
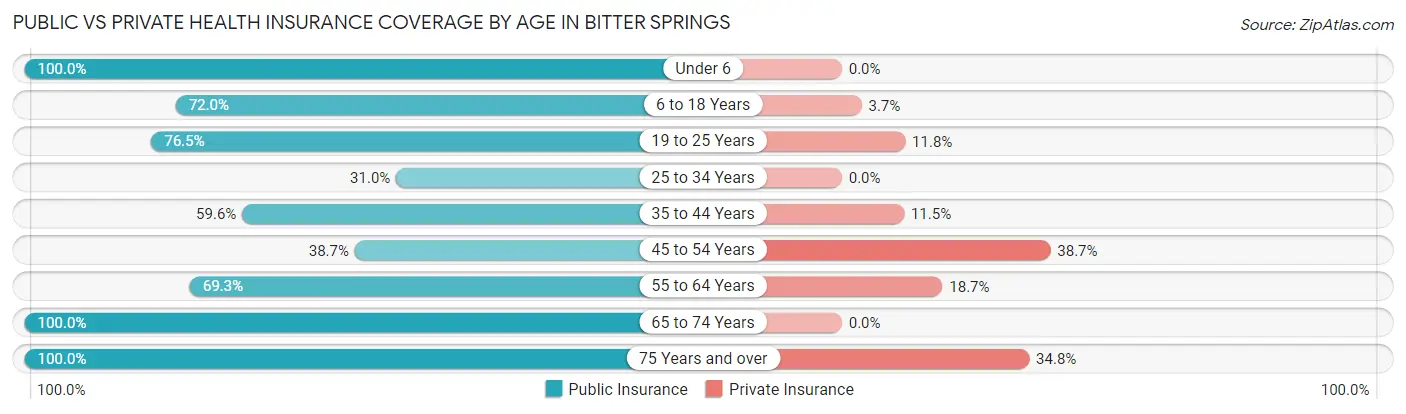
| Age Bracket | Public Insurance | Private Insurance |
| Under 6 | 13 (100.0%) | 0 (0.0%) |
| 6 to 18 Years | 59 (72.0%) | 3 (3.7%) |
| 19 to 25 Years | 39 (76.5%) | 6 (11.8%) |
| 25 to 34 Years | 9 (31.0%) | 0 (0.0%) |
| 35 to 44 Years | 31 (59.6%) | 6 (11.5%) |
| 45 to 54 Years | 12 (38.7%) | 12 (38.7%) |
| 55 to 64 Years | 52 (69.3%) | 14 (18.7%) |
| 65 to 74 Years | 18 (100.0%) | 0 (0.0%) |
| 75 Years and over | 23 (100.0%) | 8 (34.8%) |
| Total | 256 (68.4%) | 49 (13.1%) |
Disability Status by Sex by Age in Bitter Springs
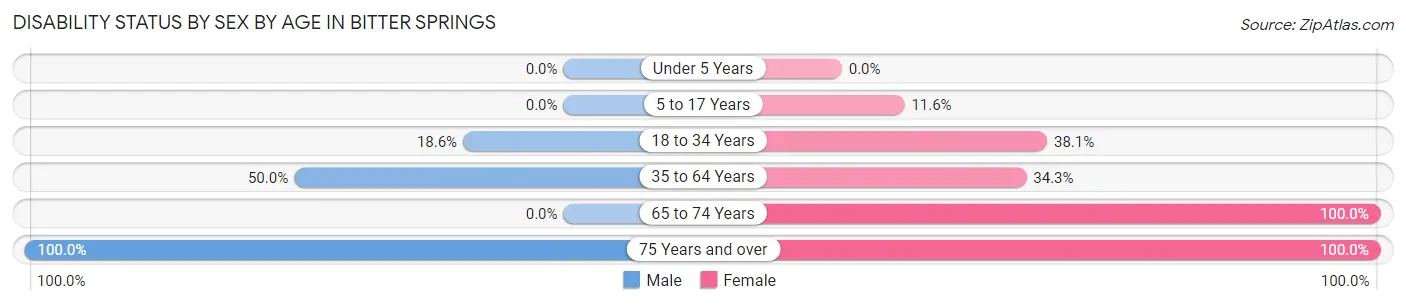
| Age Bracket | Male | Female |
| Under 5 Years | 0 (0.0%) | 0 (0.0%) |
| 5 to 17 Years | 0 (0.0%) | 5 (11.6%) |
| 18 to 34 Years | 11 (18.6%) | 8 (38.1%) |
| 35 to 64 Years | 25 (50.0%) | 37 (34.3%) |
| 65 to 74 Years | 0 (0.0%) | 14 (100.0%) |
| 75 Years and over | 4 (100.0%) | 19 (100.0%) |
Disability Class by Sex by Age in Bitter Springs
Disability Class: Hearing Difficulty
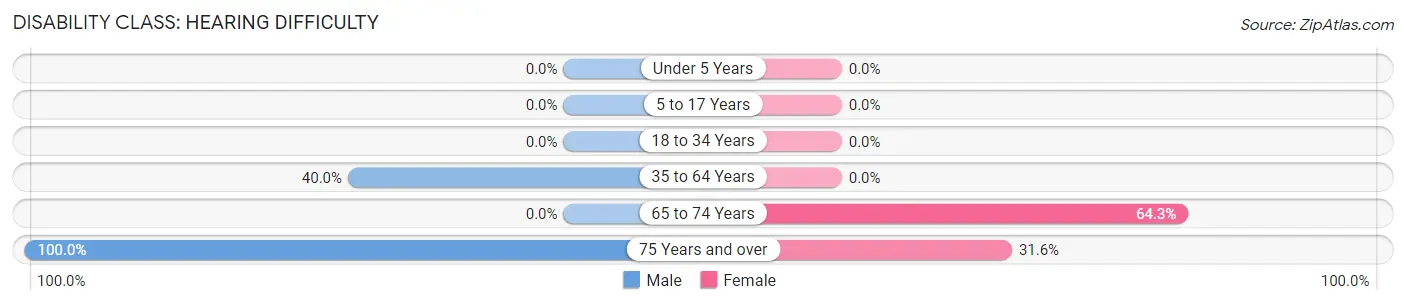
| Age Bracket | Male | Female |
| Under 5 Years | 0 (0.0%) | 0 (0.0%) |
| 5 to 17 Years | 0 (0.0%) | 0 (0.0%) |
| 18 to 34 Years | 0 (0.0%) | 0 (0.0%) |
| 35 to 64 Years | 20 (40.0%) | 0 (0.0%) |
| 65 to 74 Years | 0 (0.0%) | 9 (64.3%) |
| 75 Years and over | 4 (100.0%) | 6 (31.6%) |
Disability Class: Vision Difficulty
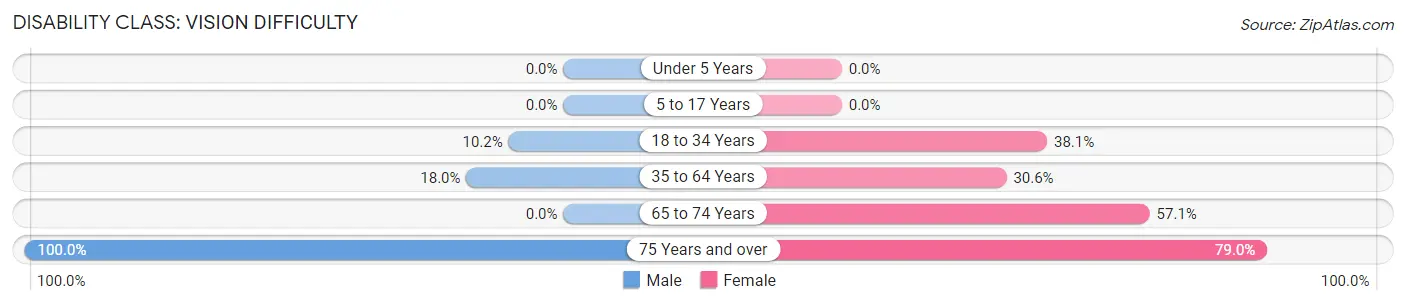
| Age Bracket | Male | Female |
| Under 5 Years | 0 (0.0%) | 0 (0.0%) |
| 5 to 17 Years | 0 (0.0%) | 0 (0.0%) |
| 18 to 34 Years | 6 (10.2%) | 8 (38.1%) |
| 35 to 64 Years | 9 (18.0%) | 33 (30.6%) |
| 65 to 74 Years | 0 (0.0%) | 8 (57.1%) |
| 75 Years and over | 4 (100.0%) | 15 (78.9%) |
Disability Class: Cognitive Difficulty
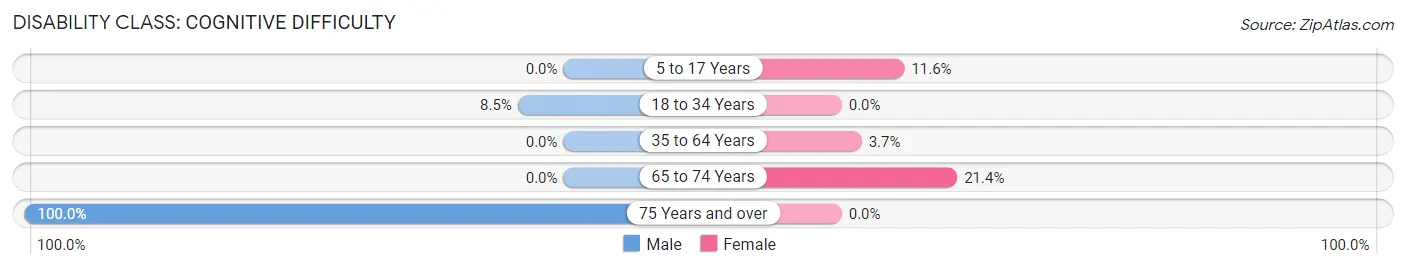
| Age Bracket | Male | Female |
| 5 to 17 Years | 0 (0.0%) | 5 (11.6%) |
| 18 to 34 Years | 5 (8.5%) | 0 (0.0%) |
| 35 to 64 Years | 0 (0.0%) | 4 (3.7%) |
| 65 to 74 Years | 0 (0.0%) | 3 (21.4%) |
| 75 Years and over | 4 (100.0%) | 0 (0.0%) |
Disability Class: Ambulatory Difficulty
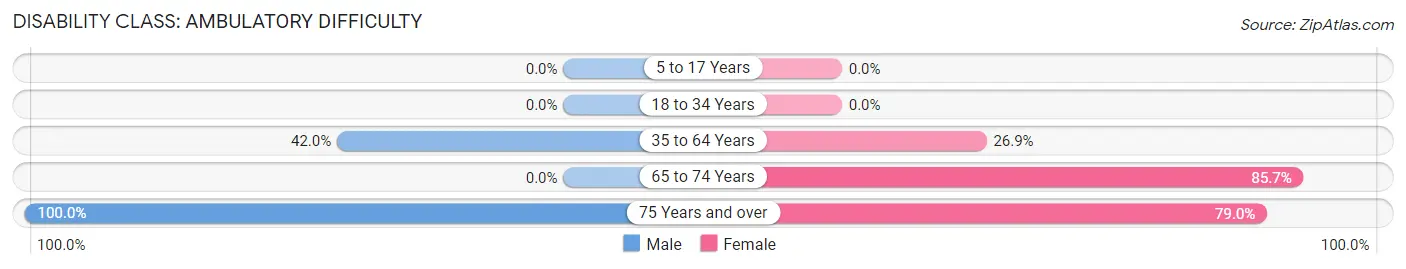
| Age Bracket | Male | Female |
| 5 to 17 Years | 0 (0.0%) | 0 (0.0%) |
| 18 to 34 Years | 0 (0.0%) | 0 (0.0%) |
| 35 to 64 Years | 21 (42.0%) | 29 (26.9%) |
| 65 to 74 Years | 0 (0.0%) | 12 (85.7%) |
| 75 Years and over | 4 (100.0%) | 15 (78.9%) |
Disability Class: Self-Care Difficulty
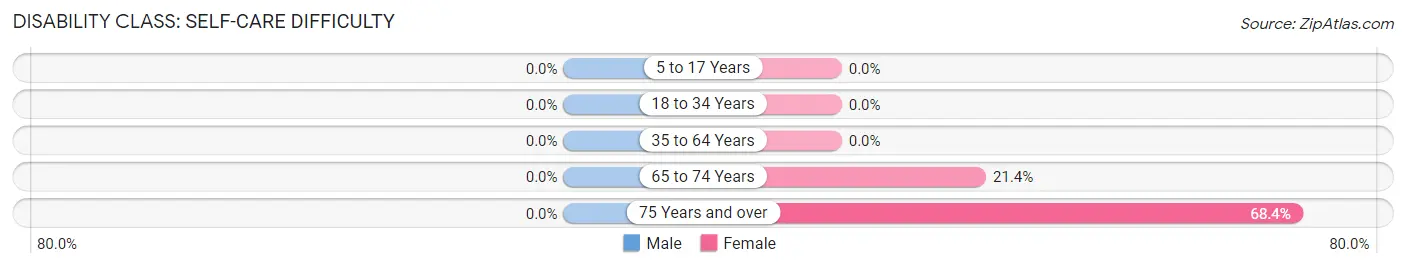
| Age Bracket | Male | Female |
| 5 to 17 Years | 0 (0.0%) | 0 (0.0%) |
| 18 to 34 Years | 0 (0.0%) | 0 (0.0%) |
| 35 to 64 Years | 0 (0.0%) | 0 (0.0%) |
| 65 to 74 Years | 0 (0.0%) | 3 (21.4%) |
| 75 Years and over | 0 (0.0%) | 13 (68.4%) |
Technology Access in Bitter Springs
Computing Device Access in Bitter Springs
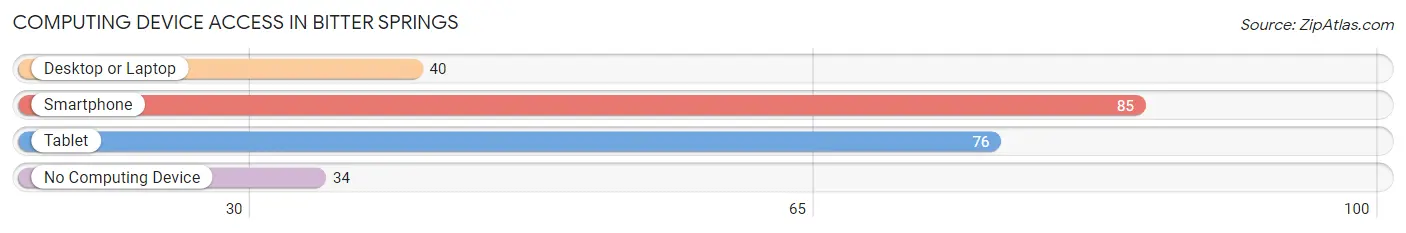
| Device Type | # Households | % Households |
| Desktop or Laptop | 40 | 31.2% |
| Smartphone | 85 | 66.4% |
| Tablet | 76 | 59.4% |
| No Computing Device | 34 | 26.6% |
| Total | 128 | 100.0% |
Internet Access in Bitter Springs
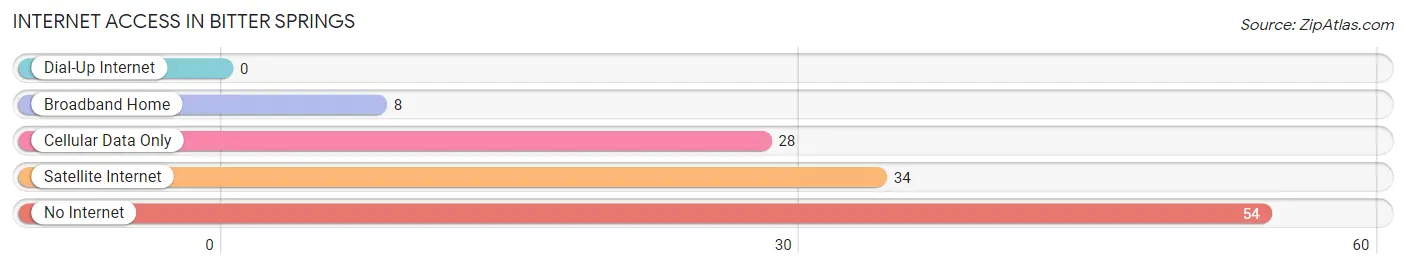
| Internet Type | # Households | % Households |
| Dial-Up Internet | 0 | 0.0% |
| Broadband Home | 8 | 6.2% |
| Cellular Data Only | 28 | 21.9% |
| Satellite Internet | 34 | 26.6% |
| No Internet | 54 | 42.2% |
| Total | 128 | 100.0% |
Bitter Springs Summary
Bitter Springs is a small unincorporated community located in Coconino County, Arizona. It is situated in the northern part of the state, approximately 25 miles south of Flagstaff. The community is located along the Little Colorado River, near the Arizona-Utah border. The population of Bitter Springs was estimated to be around 200 people in 2020.
History
The area around Bitter Springs has been inhabited for thousands of years. The first known inhabitants were the Anasazi, who lived in the area from around 1000 BC to 1300 AD. The Hopi people also lived in the area, and the ruins of their villages can still be seen in the area.
The first European settlers arrived in the area in the late 1800s. The area was originally known as "Bitter Springs Ranch" and was used for cattle ranching. The town was officially established in the early 1900s and was named after the nearby springs.
Geography
Bitter Springs is located in the northern part of Arizona, approximately 25 miles south of Flagstaff. The town is situated along the Little Colorado River, near the Arizona-Utah border. The area is mostly desert, with some grasslands and shrublands. The climate is semi-arid, with hot summers and mild winters.
Economy
The economy of Bitter Springs is largely based on tourism. The town is a popular destination for outdoor activities such as camping, fishing, and hiking. There are also several local businesses in the area, including a gas station, a grocery store, and a few restaurants.
Demographics
The population of Bitter Springs was estimated to be around 200 people in 2020. The majority of the population is white (90%), followed by Native American (5%), Hispanic (3%), and other (2%). The median household income is $35,000, and the median age is 40.
Conclusion
Bitter Springs is a small unincorporated community located in Coconino County, Arizona. It is situated in the northern part of the state, approximately 25 miles south of Flagstaff. The area has been inhabited for thousands of years, and the town was officially established in the early 1900s. The economy of Bitter Springs is largely based on tourism, and the population was estimated to be around 200 people in 2020. The majority of the population is white, followed by Native American, Hispanic, and other.
Common Questions
What is Per Capita Income in Bitter Springs?
Per Capita income in Bitter Springs is $20,012.
What is the Median Family Income in Bitter Springs?
Median Family Income in Bitter Springs is $46,750.
What is the Median Household income in Bitter Springs?
Median Household Income in Bitter Springs is $34,848.
What is Income or Wage Gap in Bitter Springs?
Income or Wage Gap in Bitter Springs is 13.1%.
Women in Bitter Springs earn 86.9 cents for every dollar earned by a man.
What is Inequality or Gini Index in Bitter Springs?
Inequality or Gini Index in Bitter Springs is 0.39.
What is the Total Population of Bitter Springs?
Total Population of Bitter Springs is 374.
What is the Total Male Population of Bitter Springs?
Total Male Population of Bitter Springs is 164.
What is the Total Female Population of Bitter Springs?
Total Female Population of Bitter Springs is 210.
What is the Ratio of Males per 100 Females in Bitter Springs?
There are 78.10 Males per 100 Females in Bitter Springs.
What is the Ratio of Females per 100 Males in Bitter Springs?
There are 128.05 Females per 100 Males in Bitter Springs.
What is the Median Population Age in Bitter Springs?
Median Population Age in Bitter Springs is 37.1 Years.
What is the Average Family Size in Bitter Springs
Average Family Size in Bitter Springs is 3.9 People.
What is the Average Household Size in Bitter Springs
Average Household Size in Bitter Springs is 2.9 People.
How Large is the Labor Force in Bitter Springs?
There are 168 People in the Labor Forcein in Bitter Springs.
What is the Percentage of People in the Labor Force in Bitter Springs?
58.1% of People are in the Labor Force in Bitter Springs.
What is the Unemployment Rate in Bitter Springs?
Unemployment Rate in Bitter Springs is 27.4%.