Kaibito, AZ Map & Demographics
Kaibito Map
Kaibito Overview
$19,100
PER CAPITA INCOME
$57,861
AVG FAMILY INCOME
$47,212
AVG HOUSEHOLD INCOME
16.1%
WAGE / INCOME GAP [ % ]
83.9¢/ $1
WAGE / INCOME GAP [ $ ]
0.43
INEQUALITY / GINI INDEX
1,718
TOTAL POPULATION
807
MALE POPULATION
911
FEMALE POPULATION
88.58
MALES / 100 FEMALES
112.89
FEMALES / 100 MALES
28.4
MEDIAN AGE
3.6
AVG FAMILY SIZE
3.3
AVG HOUSEHOLD SIZE
625
LABOR FORCE [ PEOPLE ]
49.6%
PERCENT IN LABOR FORCE
16.0%
UNEMPLOYMENT RATE
Income in Kaibito
Income Overview in Kaibito
Per Capita Income in Kaibito is $19,100, while median incomes of families and households are $57,861 and $47,212 respectively.
| Characteristic | Number | Measure |
| Per Capita Income | 1,718 | $19,100 |
| Median Family Income | 441 | $57,861 |
| Mean Family Income | 441 | $72,178 |
| Median Household Income | 527 | $47,212 |
| Mean Household Income | 527 | $64,132 |
| Income Deficit | 441 | $0 |
| Wage / Income Gap (%) | 1,718 | 16.10% |
| Wage / Income Gap ($) | 1,718 | 83.90¢ per $1 |
| Gini / Inequality Index | 1,718 | 0.43 |
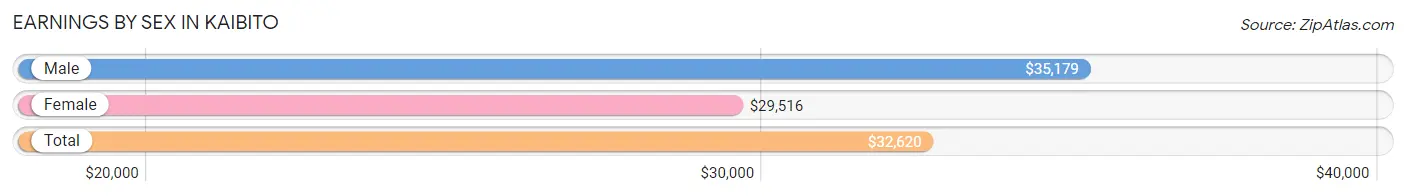
Earnings by Sex in Kaibito
Average Earnings in Kaibito are $32,620, $35,179 for men and $29,516 for women, a difference of 16.1%.
| Sex | Number | Average Earnings |
| Male | 297 (44.5%) | $35,179 |
| Female | 370 (55.5%) | $29,516 |
| Total | 667 (100.0%) | $32,620 |
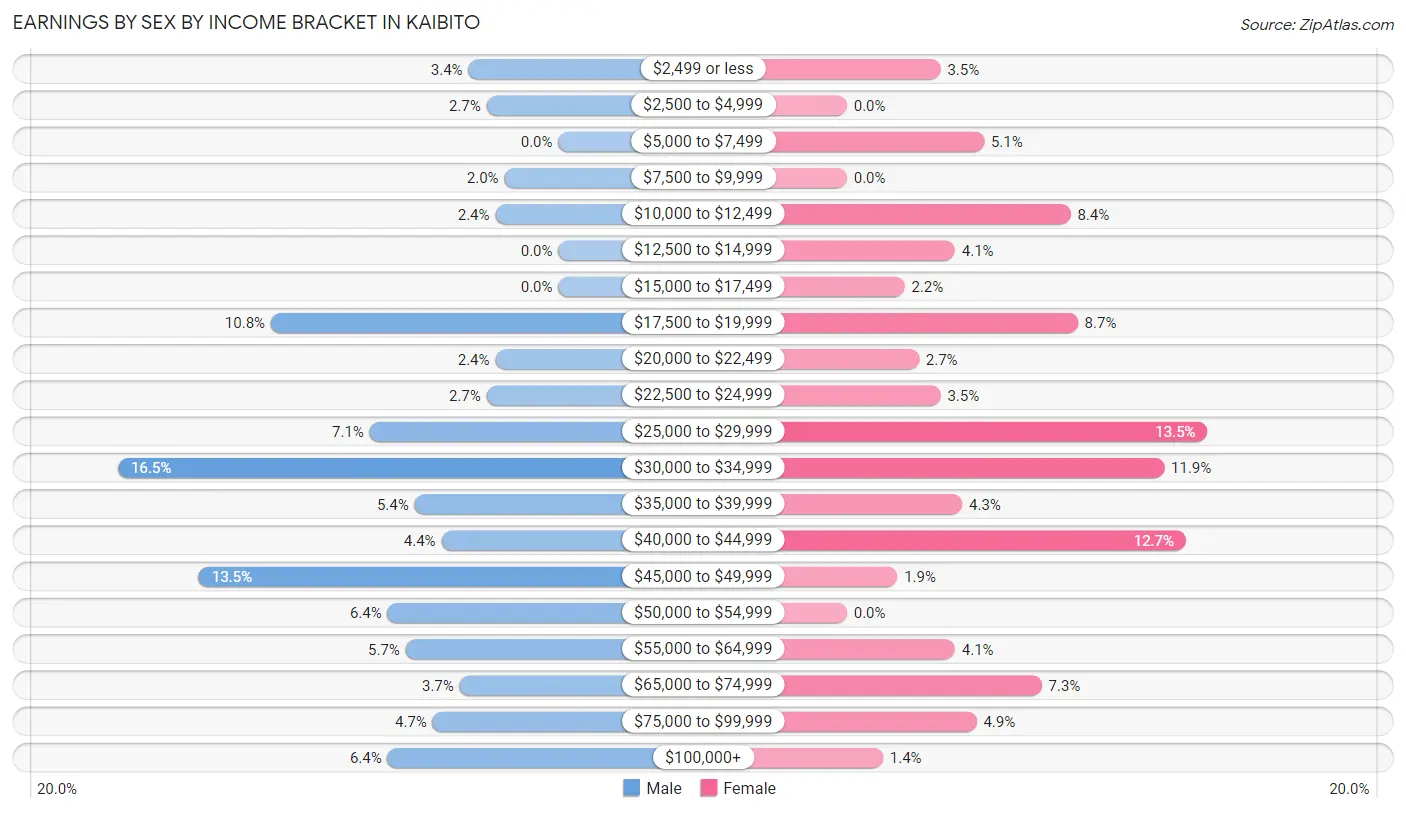
Earnings by Sex by Income Bracket in Kaibito
The most common earnings brackets in Kaibito are $30,000 to $34,999 for men (49 | 16.5%) and $25,000 to $29,999 for women (50 | 13.5%).
| Income | Male | Female |
| $2,499 or less | 10 (3.4%) | 13 (3.5%) |
| $2,500 to $4,999 | 8 (2.7%) | 0 (0.0%) |
| $5,000 to $7,499 | 0 (0.0%) | 19 (5.1%) |
| $7,500 to $9,999 | 6 (2.0%) | 0 (0.0%) |
| $10,000 to $12,499 | 7 (2.4%) | 31 (8.4%) |
| $12,500 to $14,999 | 0 (0.0%) | 15 (4.1%) |
| $15,000 to $17,499 | 0 (0.0%) | 8 (2.2%) |
| $17,500 to $19,999 | 32 (10.8%) | 32 (8.6%) |
| $20,000 to $22,499 | 7 (2.4%) | 10 (2.7%) |
| $22,500 to $24,999 | 8 (2.7%) | 13 (3.5%) |
| $25,000 to $29,999 | 21 (7.1%) | 50 (13.5%) |
| $30,000 to $34,999 | 49 (16.5%) | 44 (11.9%) |
| $35,000 to $39,999 | 16 (5.4%) | 16 (4.3%) |
| $40,000 to $44,999 | 13 (4.4%) | 47 (12.7%) |
| $45,000 to $49,999 | 40 (13.5%) | 7 (1.9%) |
| $50,000 to $54,999 | 19 (6.4%) | 0 (0.0%) |
| $55,000 to $64,999 | 17 (5.7%) | 15 (4.1%) |
| $65,000 to $74,999 | 11 (3.7%) | 27 (7.3%) |
| $75,000 to $99,999 | 14 (4.7%) | 18 (4.9%) |
| $100,000+ | 19 (6.4%) | 5 (1.3%) |
| Total | 297 (100.0%) | 370 (100.0%) |
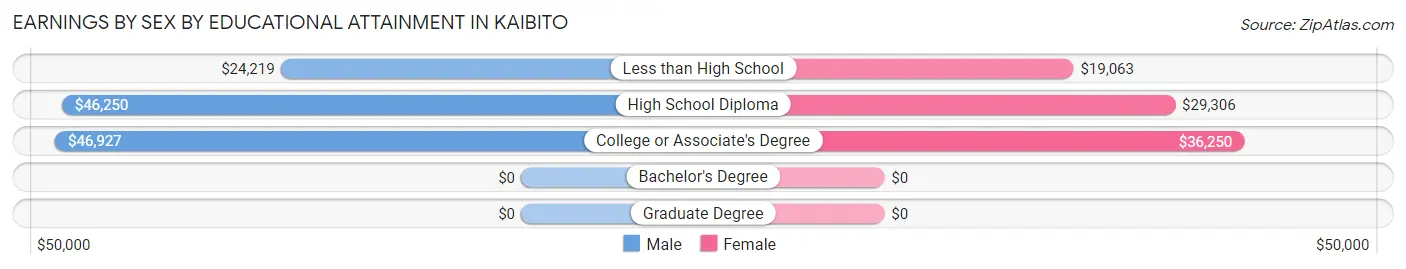
Earnings by Sex by Educational Attainment in Kaibito
Average earnings in Kaibito are $46,250 for men and $29,861 for women, a difference of 35.4%. Men with an educational attainment of college or associate's degree enjoy the highest average annual earnings of $46,927, while those with less than high school education earn the least with $24,219. Women with an educational attainment of college or associate's degree earn the most with the average annual earnings of $36,250, while those with less than high school education have the smallest earnings of $19,063.
| Educational Attainment | Male Income | Female Income |
| Less than High School | $24,219 | $19,063 |
| High School Diploma | $46,250 | $29,306 |
| College or Associate's Degree | $46,927 | $36,250 |
| Bachelor's Degree | - | - |
| Graduate Degree | - | - |
| Total | $46,250 | $29,861 |
Family Income in Kaibito
Family Income Brackets in Kaibito
According to the Kaibito family income data, there are 109 families falling into the $50,000 to $74,999 income range, which is the most common income bracket and makes up 24.7% of all families.
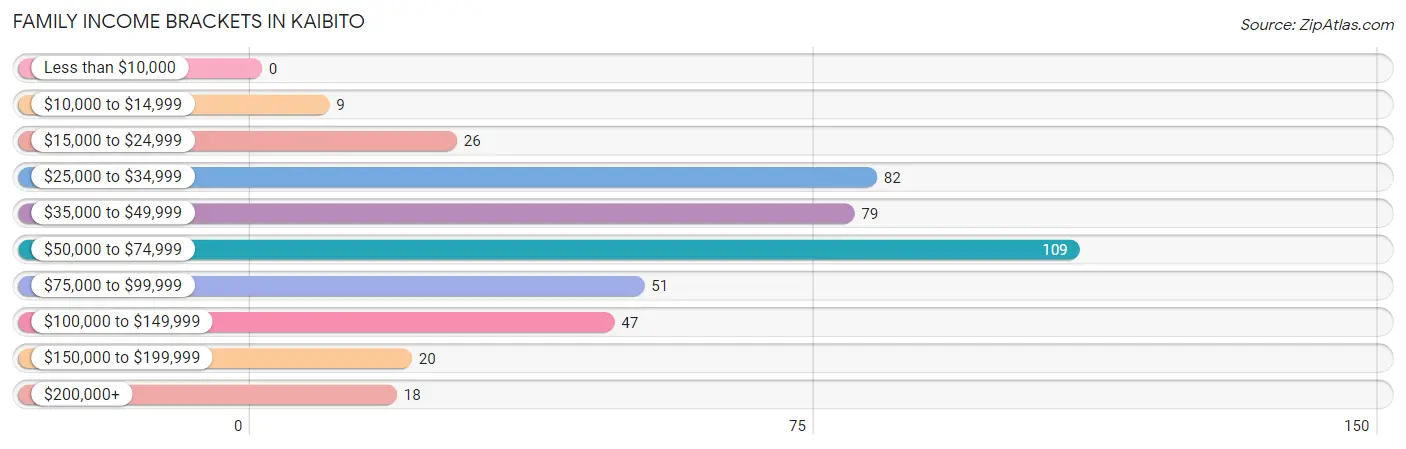
| Income Bracket | # Families | % Families |
| Less than $10,000 | 0 | 0.0% |
| $10,000 to $14,999 | 9 | 2.0% |
| $15,000 to $24,999 | 26 | 5.9% |
| $25,000 to $34,999 | 82 | 18.6% |
| $35,000 to $49,999 | 79 | 17.9% |
| $50,000 to $74,999 | 109 | 24.7% |
| $75,000 to $99,999 | 51 | 11.6% |
| $100,000 to $149,999 | 47 | 10.7% |
| $150,000 to $199,999 | 20 | 4.5% |
| $200,000+ | 18 | 4.1% |
Family Income by Famaliy Size in Kaibito
5-person families (93 | 21.1%) account for the highest median family income in Kaibito with $125,063 per family, while 2-person families (106 | 24.0%) have the highest median income of $33,750 per family member.
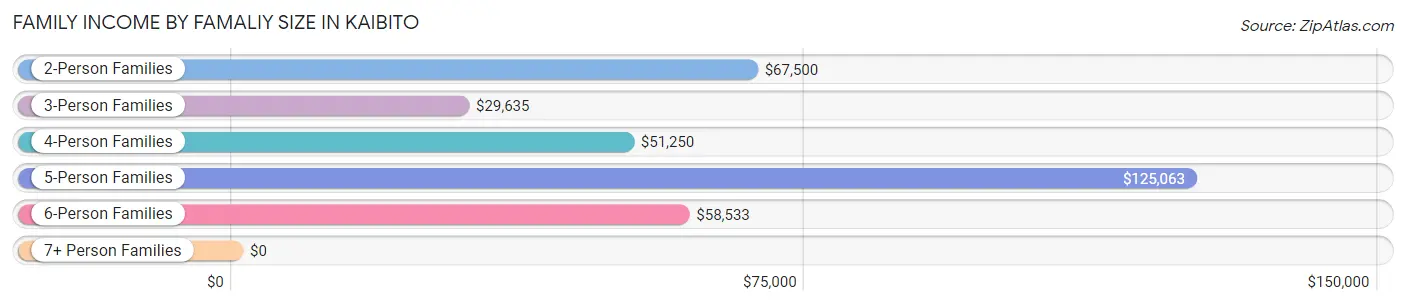
| Income Bracket | # Families | Median Income |
| 2-Person Families | 106 (24.0%) | $67,500 |
| 3-Person Families | 114 (25.9%) | $29,635 |
| 4-Person Families | 38 (8.6%) | $51,250 |
| 5-Person Families | 93 (21.1%) | $125,063 |
| 6-Person Families | 62 (14.1%) | $58,533 |
| 7+ Person Families | 28 (6.4%) | $0 |
| Total | 441 (100.0%) | $57,861 |
Family Income by Number of Earners in Kaibito
The median family income in Kaibito is $57,861, with families comprising 3+ earners (44) having the highest median family income of $167,500, while families with no earners (79) have the lowest median family income of $28,750, accounting for 10.0% and 17.9% of families, respectively.
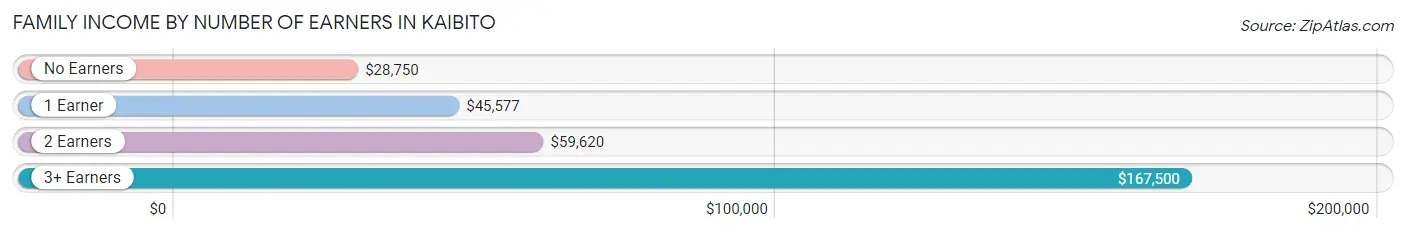
| Number of Earners | # Families | Median Income |
| No Earners | 79 (17.9%) | $28,750 |
| 1 Earner | 144 (32.7%) | $45,577 |
| 2 Earners | 174 (39.5%) | $59,620 |
| 3+ Earners | 44 (10.0%) | $167,500 |
| Total | 441 (100.0%) | $57,861 |
Household Income in Kaibito
Household Income Brackets in Kaibito
With 121 households falling in the category, the $50,000 to $74,999 income range is the most frequent in Kaibito, accounting for 23.0% of all households. In contrast, only 13 households (2.5%) fall into the less than $10,000 income bracket, making it the least populous group.
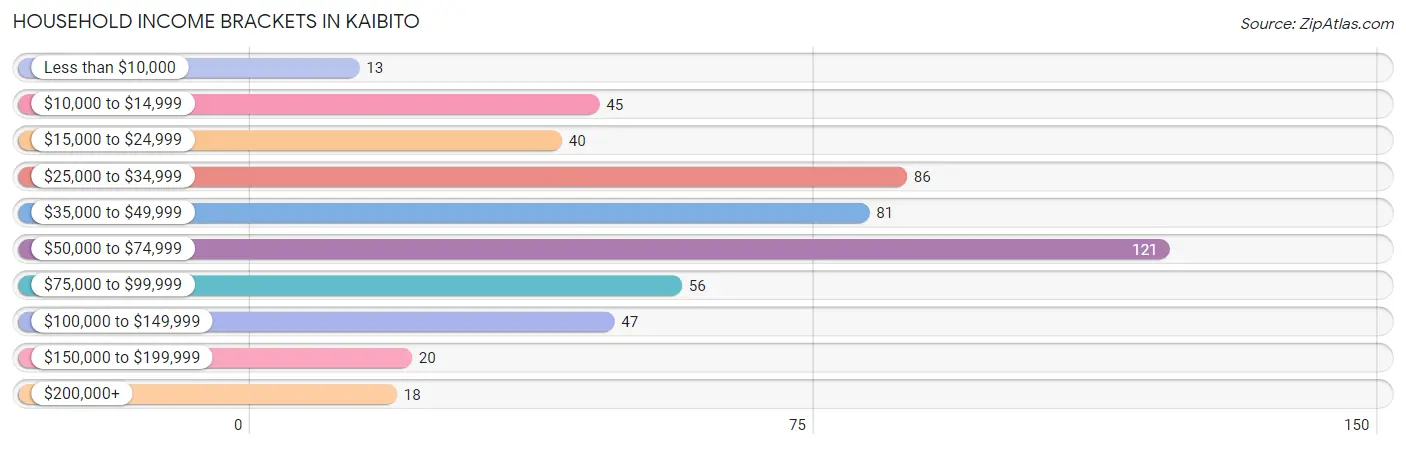
| Income Bracket | # Households | % Households |
| Less than $10,000 | 13 | 2.5% |
| $10,000 to $14,999 | 45 | 8.5% |
| $15,000 to $24,999 | 40 | 7.6% |
| $25,000 to $34,999 | 86 | 16.3% |
| $35,000 to $49,999 | 81 | 15.4% |
| $50,000 to $74,999 | 121 | 23.0% |
| $75,000 to $99,999 | 56 | 10.6% |
| $100,000 to $149,999 | 47 | 8.9% |
| $150,000 to $199,999 | 20 | 3.8% |
| $200,000+ | 18 | 3.4% |
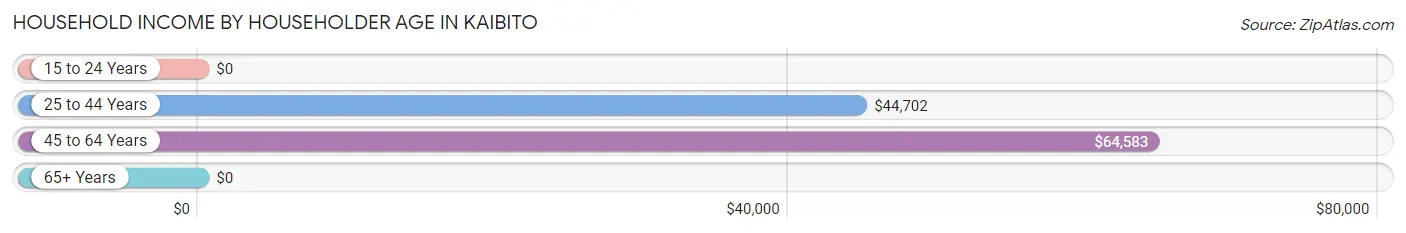
Household Income by Householder Age in Kaibito
The median household income in Kaibito is $47,212, with the highest median household income of $64,583 found in the 45 to 64 years age bracket for the primary householder. A total of 236 households (44.8%) fall into this category.
| Income Bracket | # Households | Median Income |
| 15 to 24 Years | 0 (0.0%) | $0 |
| 25 to 44 Years | 127 (24.1%) | $44,702 |
| 45 to 64 Years | 236 (44.8%) | $64,583 |
| 65+ Years | 164 (31.1%) | $0 |
| Total | 527 (100.0%) | $47,212 |
Poverty in Kaibito
Income Below Poverty by Sex and Age in Kaibito
With 27.4% poverty level for males and 28.2% for females among the residents of Kaibito, 12 to 14 year old males and 6 to 11 year old females are the most vulnerable to poverty, with 37 males (63.8%) and 60 females (73.2%) in their respective age groups living below the poverty level.
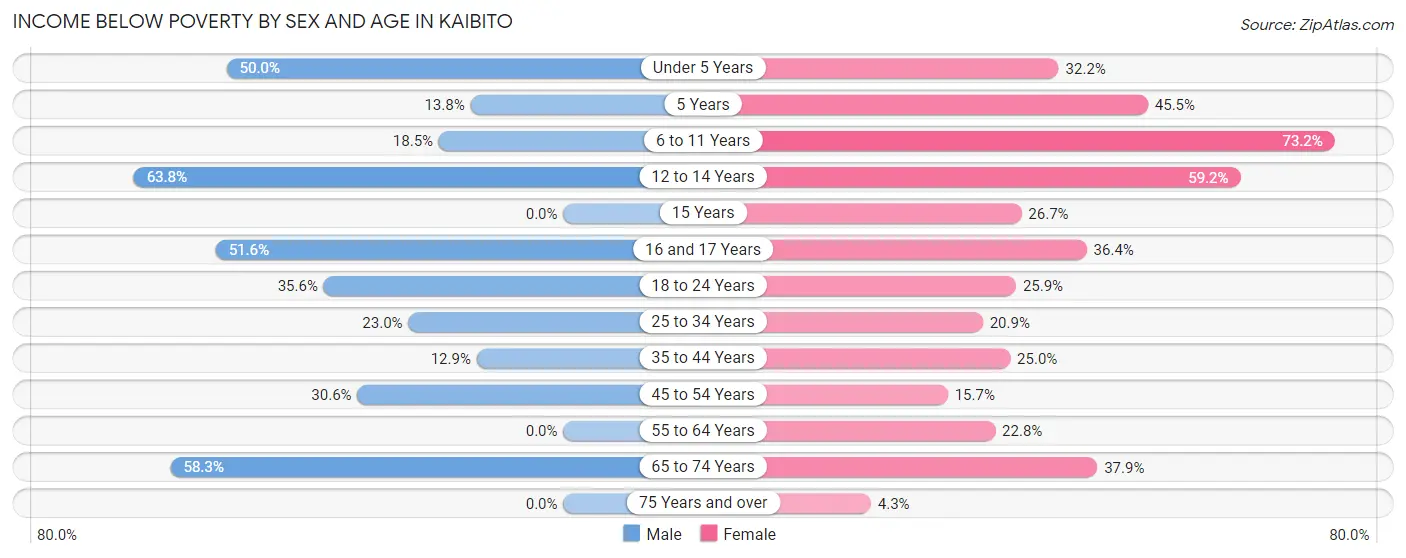
| Age Bracket | Male | Female |
| Under 5 Years | 24 (50.0%) | 19 (32.2%) |
| 5 Years | 4 (13.8%) | 5 (45.5%) |
| 6 to 11 Years | 17 (18.5%) | 60 (73.2%) |
| 12 to 14 Years | 37 (63.8%) | 29 (59.2%) |
| 15 Years | 0 (0.0%) | 4 (26.7%) |
| 16 and 17 Years | 16 (51.6%) | 4 (36.4%) |
| 18 to 24 Years | 37 (35.6%) | 30 (25.9%) |
| 25 to 34 Years | 26 (23.0%) | 27 (20.9%) |
| 35 to 44 Years | 9 (12.9%) | 26 (25.0%) |
| 45 to 54 Years | 37 (30.6%) | 14 (15.7%) |
| 55 to 64 Years | 0 (0.0%) | 23 (22.8%) |
| 65 to 74 Years | 14 (58.3%) | 11 (37.9%) |
| 75 Years and over | 0 (0.0%) | 5 (4.3%) |
| Total | 221 (27.4%) | 257 (28.2%) |
Income Above Poverty by Sex and Age in Kaibito
According to the poverty statistics in Kaibito, males aged 15 years and females aged 75 years and over are the age groups that are most secure financially, with 100.0% of males and 95.7% of females in these age groups living above the poverty line.
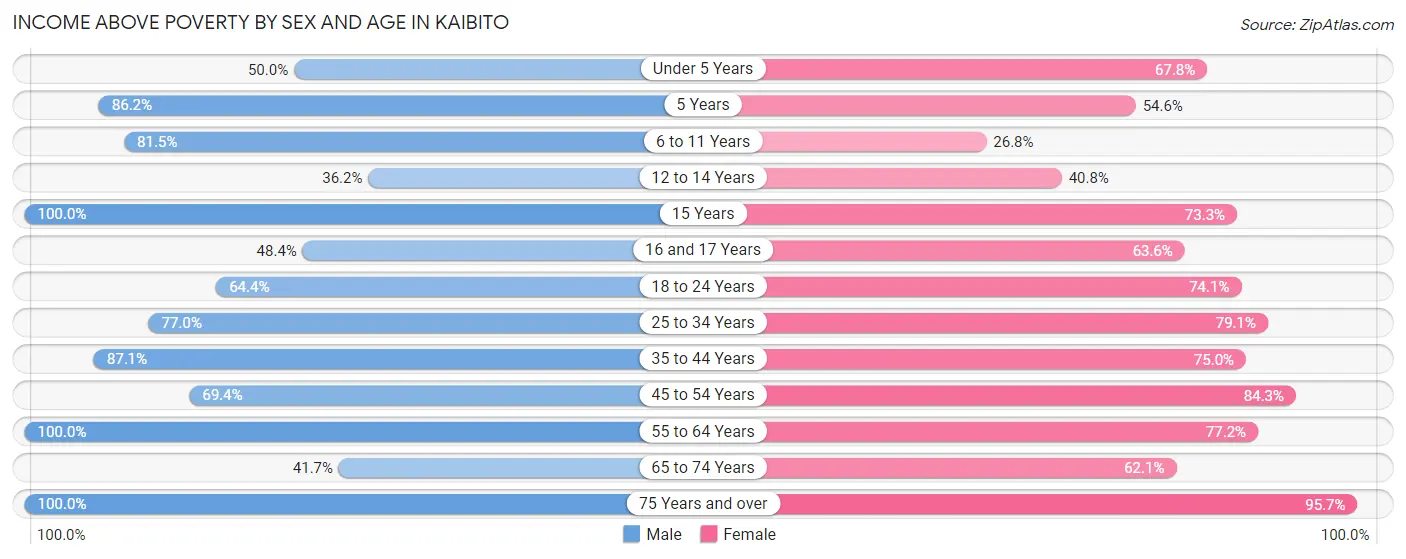
| Age Bracket | Male | Female |
| Under 5 Years | 24 (50.0%) | 40 (67.8%) |
| 5 Years | 25 (86.2%) | 6 (54.5%) |
| 6 to 11 Years | 75 (81.5%) | 22 (26.8%) |
| 12 to 14 Years | 21 (36.2%) | 20 (40.8%) |
| 15 Years | 14 (100.0%) | 11 (73.3%) |
| 16 and 17 Years | 15 (48.4%) | 7 (63.6%) |
| 18 to 24 Years | 67 (64.4%) | 86 (74.1%) |
| 25 to 34 Years | 87 (77.0%) | 102 (79.1%) |
| 35 to 44 Years | 61 (87.1%) | 78 (75.0%) |
| 45 to 54 Years | 84 (69.4%) | 75 (84.3%) |
| 55 to 64 Years | 90 (100.0%) | 78 (77.2%) |
| 65 to 74 Years | 10 (41.7%) | 18 (62.1%) |
| 75 Years and over | 13 (100.0%) | 111 (95.7%) |
| Total | 586 (72.6%) | 654 (71.8%) |
Income Below Poverty Among Married-Couple Families in Kaibito
The poverty statistics for married-couple families in Kaibito show that 3.2% or 5 of the total 156 families live below the poverty line. Families with no children have the highest poverty rate of 4.7%, comprising of 5 families. On the other hand, families with 1 or 2 children have the lowest poverty rate of 0.0%, which includes 0 families.
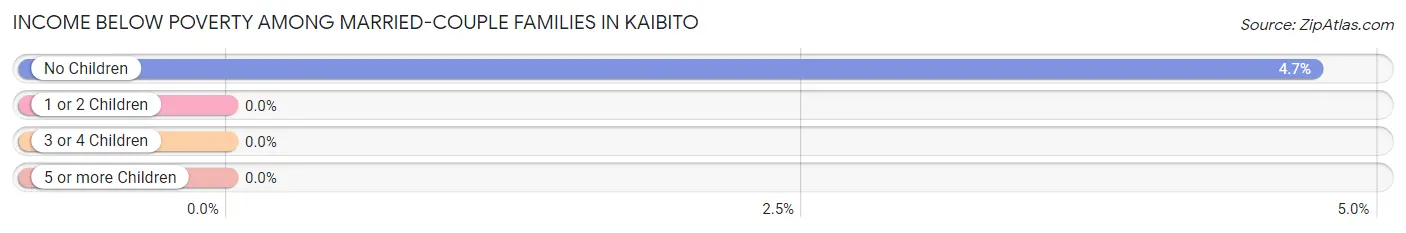
| Children | Above Poverty | Below Poverty |
| No Children | 101 (95.3%) | 5 (4.7%) |
| 1 or 2 Children | 29 (100.0%) | 0 (0.0%) |
| 3 or 4 Children | 14 (100.0%) | 0 (0.0%) |
| 5 or more Children | 7 (100.0%) | 0 (0.0%) |
| Total | 151 (96.8%) | 5 (3.2%) |
Income Below Poverty Among Single-Parent Households in Kaibito
According to the poverty data in Kaibito, 20.0% or 11 single-father households and 24.3% or 56 single-mother households are living below the poverty line. Among single-father households, those with 3 or 4 children have the highest poverty rate, with 6 households (100.0%) experiencing poverty. Likewise, among single-mother households, those with 5 or more children have the highest poverty rate, with 12 households (100.0%) falling below the poverty line.
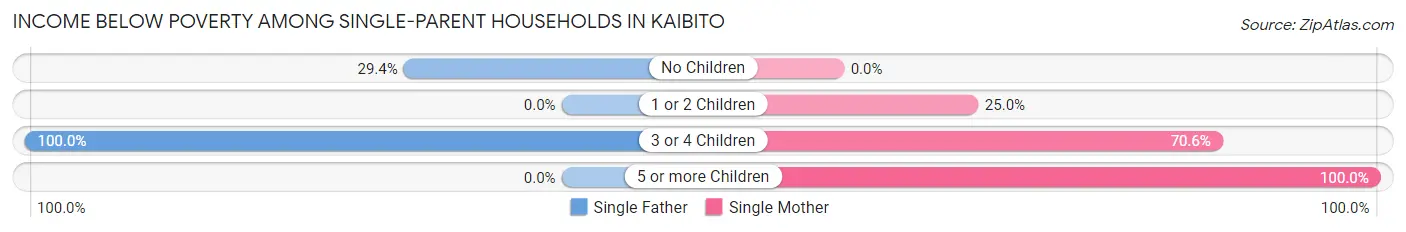
| Children | Single Father | Single Mother |
| No Children | 5 (29.4%) | 0 (0.0%) |
| 1 or 2 Children | 0 (0.0%) | 32 (25.0%) |
| 3 or 4 Children | 6 (100.0%) | 12 (70.6%) |
| 5 or more Children | 0 (0.0%) | 12 (100.0%) |
| Total | 11 (20.0%) | 56 (24.3%) |
Income Below Poverty Among Married-Couple vs Single-Parent Households in Kaibito
The poverty data for Kaibito shows that 5 of the married-couple family households (3.2%) and 67 of the single-parent households (23.5%) are living below the poverty level. Within the married-couple family households, those with no children have the highest poverty rate, with 5 households (4.7%) falling below the poverty line. Among the single-parent households, those with 5 or more children have the highest poverty rate, with 12 household (100.0%) living below poverty.
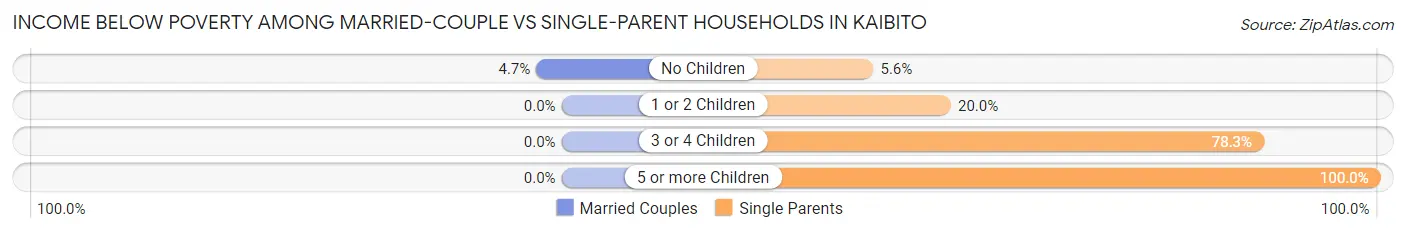
| Children | Married-Couple Families | Single-Parent Households |
| No Children | 5 (4.7%) | 5 (5.6%) |
| 1 or 2 Children | 0 (0.0%) | 32 (20.0%) |
| 3 or 4 Children | 0 (0.0%) | 18 (78.3%) |
| 5 or more Children | 0 (0.0%) | 12 (100.0%) |
| Total | 5 (3.2%) | 67 (23.5%) |
Race in Kaibito
The most populous races in Kaibito are Native / Alaskan (1,698 | 98.8%), Two or more Races (20 | 1.2%), and Hispanic or Latino (7 | 0.4%).
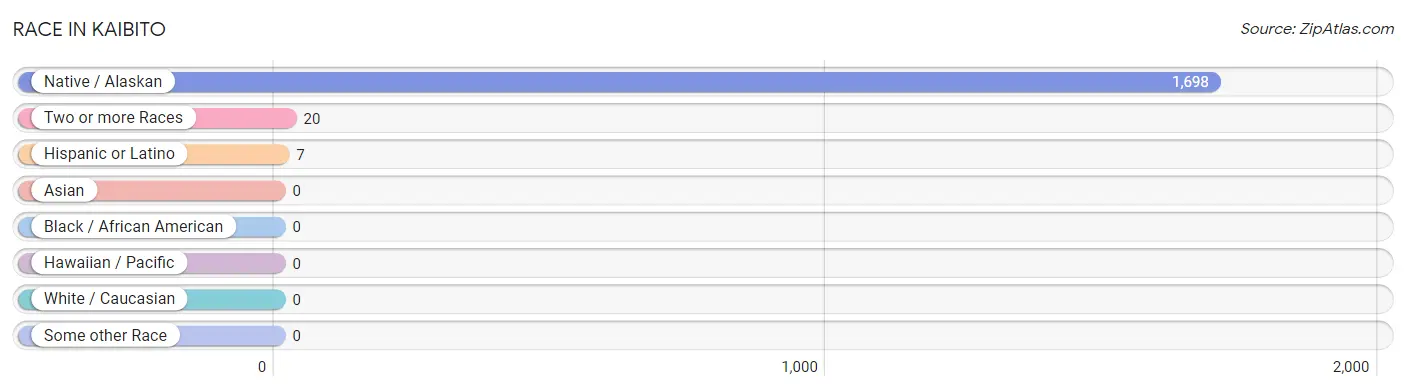
| Race | # Population | % Population |
| Asian | 0 | 0.0% |
| Black / African American | 0 | 0.0% |
| Hawaiian / Pacific | 0 | 0.0% |
| Hispanic or Latino | 7 | 0.4% |
| Native / Alaskan | 1,698 | 98.8% |
| White / Caucasian | 0 | 0.0% |
| Two or more Races | 20 | 1.2% |
| Some other Race | 0 | 0.0% |
| Total | 1,718 | 100.0% |
Ancestry in Kaibito
The most populous ancestries reported in Kaibito are Navajo (1,703 | 99.1%), Pueblo (11 | 0.6%), and Mexican (7 | 0.4%), together accounting for 100.2% of all Kaibito residents.
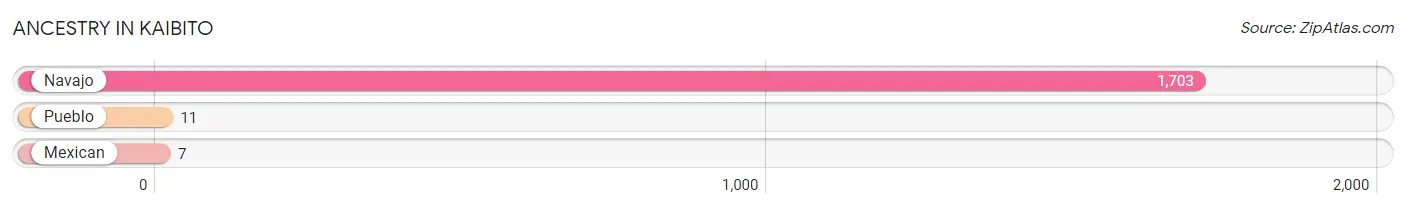
| Ancestry | # Population | % Population |
| Mexican | 7 | 0.4% |
| Navajo | 1,703 | 99.1% |
| Pueblo | 11 | 0.6% | View All 3 Rows |
Immigrants in Kaibito

| Immigration Origin | # Population | % Population | View All 0 Rows |
Sex and Age in Kaibito
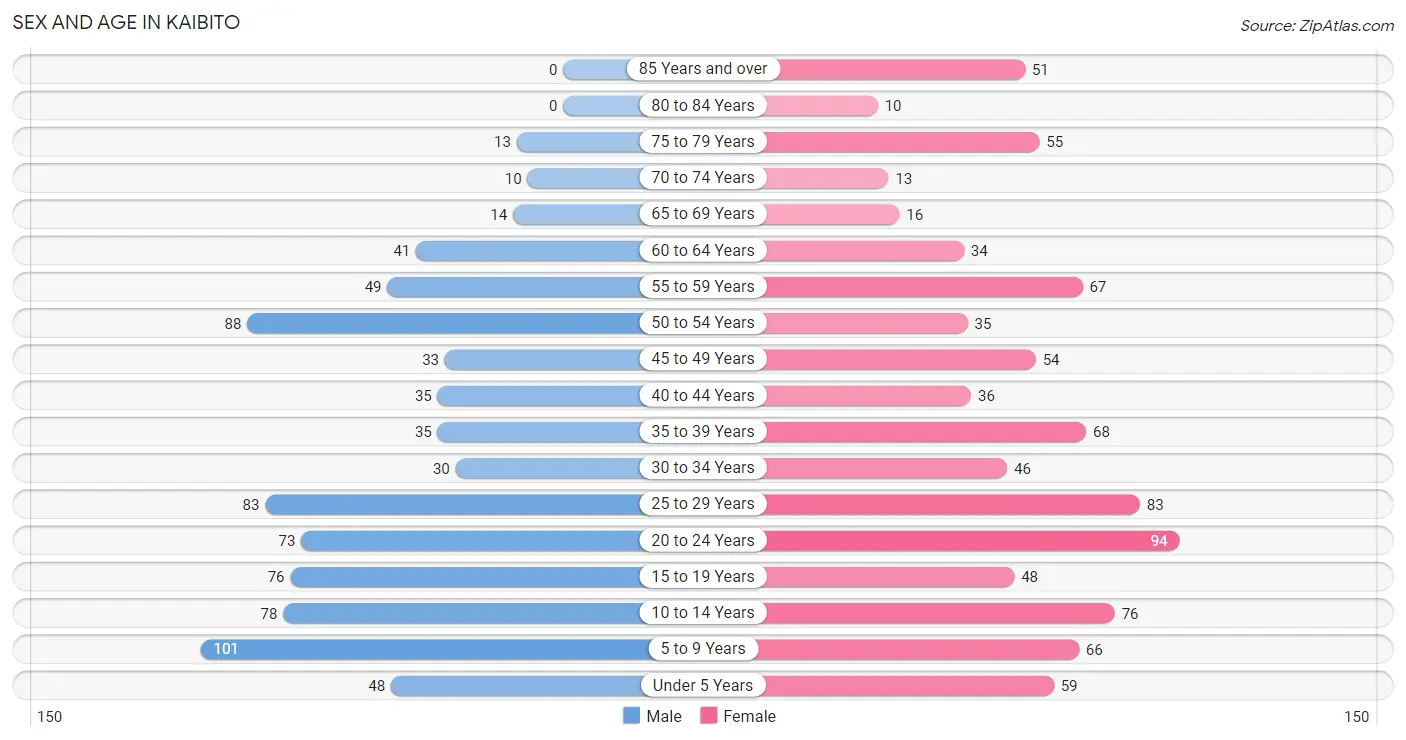
Sex and Age in Kaibito
The most populous age groups in Kaibito are 5 to 9 Years (101 | 12.5%) for men and 20 to 24 Years (94 | 10.3%) for women.
| Age Bracket | Male | Female |
| Under 5 Years | 48 (5.9%) | 59 (6.5%) |
| 5 to 9 Years | 101 (12.5%) | 66 (7.2%) |
| 10 to 14 Years | 78 (9.7%) | 76 (8.3%) |
| 15 to 19 Years | 76 (9.4%) | 48 (5.3%) |
| 20 to 24 Years | 73 (9.0%) | 94 (10.3%) |
| 25 to 29 Years | 83 (10.3%) | 83 (9.1%) |
| 30 to 34 Years | 30 (3.7%) | 46 (5.1%) |
| 35 to 39 Years | 35 (4.3%) | 68 (7.5%) |
| 40 to 44 Years | 35 (4.3%) | 36 (4.0%) |
| 45 to 49 Years | 33 (4.1%) | 54 (5.9%) |
| 50 to 54 Years | 88 (10.9%) | 35 (3.8%) |
| 55 to 59 Years | 49 (6.1%) | 67 (7.3%) |
| 60 to 64 Years | 41 (5.1%) | 34 (3.7%) |
| 65 to 69 Years | 14 (1.7%) | 16 (1.8%) |
| 70 to 74 Years | 10 (1.2%) | 13 (1.4%) |
| 75 to 79 Years | 13 (1.6%) | 55 (6.0%) |
| 80 to 84 Years | 0 (0.0%) | 10 (1.1%) |
| 85 Years and over | 0 (0.0%) | 51 (5.6%) |
| Total | 807 (100.0%) | 911 (100.0%) |
Families and Households in Kaibito
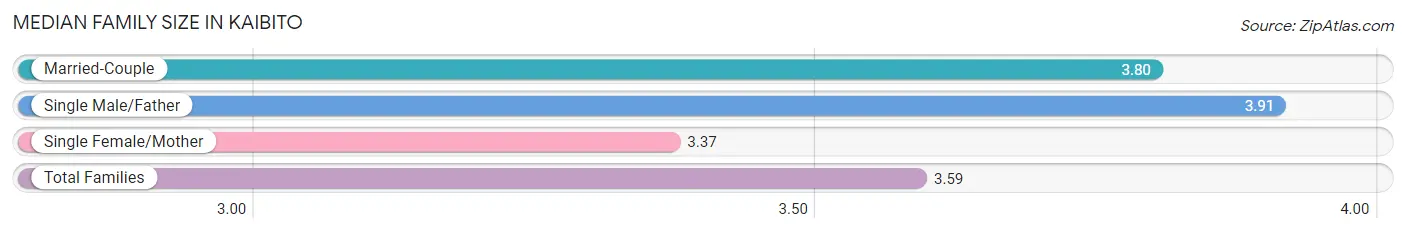
Median Family Size in Kaibito
The median family size in Kaibito is 3.59 persons per family, with single male/father families (55 | 12.5%) accounting for the largest median family size of 3.91 persons per family. On the other hand, single female/mother families (230 | 52.1%) represent the smallest median family size with 3.37 persons per family.
| Family Type | # Families | Family Size |
| Married-Couple | 156 (35.4%) | 3.80 |
| Single Male/Father | 55 (12.5%) | 3.91 |
| Single Female/Mother | 230 (52.1%) | 3.37 |
| Total Families | 441 (100.0%) | 3.59 |
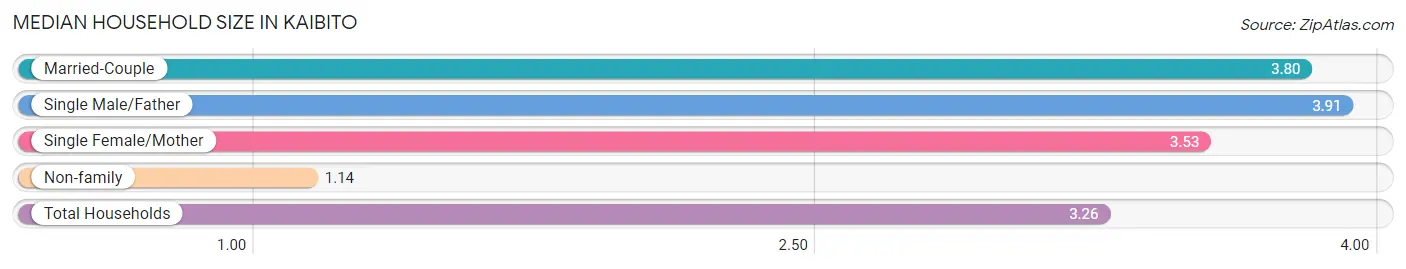
Median Household Size in Kaibito
The median household size in Kaibito is 3.26 persons per household, with single male/father households (55 | 10.4%) accounting for the largest median household size of 3.91 persons per household. non-family households (86 | 16.3%) represent the smallest median household size with 1.14 persons per household.
| Household Type | # Households | Household Size |
| Married-Couple | 156 (29.6%) | 3.80 |
| Single Male/Father | 55 (10.4%) | 3.91 |
| Single Female/Mother | 230 (43.6%) | 3.53 |
| Non-family | 86 (16.3%) | 1.14 |
| Total Households | 527 (100.0%) | 3.26 |
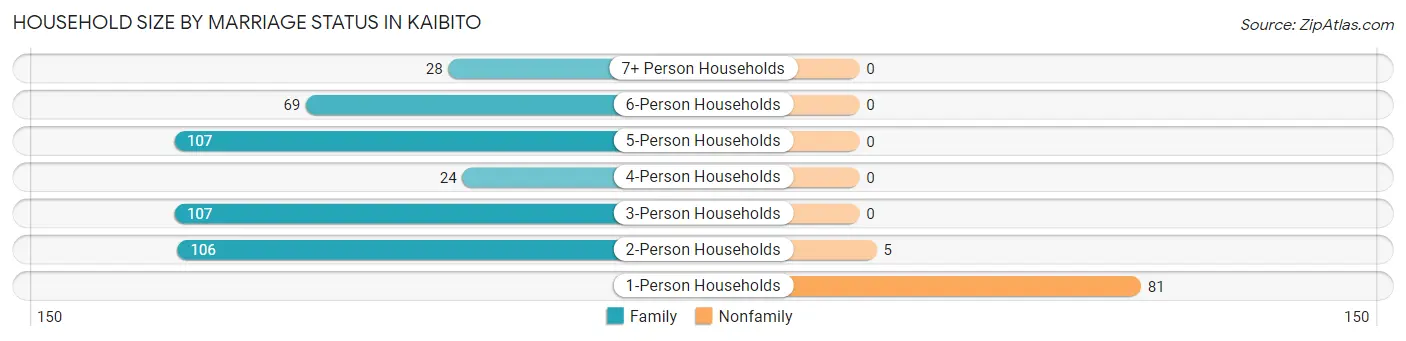
Household Size by Marriage Status in Kaibito
Out of a total of 527 households in Kaibito, 441 (83.7%) are family households, while 86 (16.3%) are nonfamily households. The most numerous type of family households are 3-person households, comprising 107, and the most common type of nonfamily households are 1-person households, comprising 81.
| Household Size | Family Households | Nonfamily Households |
| 1-Person Households | - | 81 (15.4%) |
| 2-Person Households | 106 (20.1%) | 5 (0.9%) |
| 3-Person Households | 107 (20.3%) | 0 (0.0%) |
| 4-Person Households | 24 (4.5%) | 0 (0.0%) |
| 5-Person Households | 107 (20.3%) | 0 (0.0%) |
| 6-Person Households | 69 (13.1%) | 0 (0.0%) |
| 7+ Person Households | 28 (5.3%) | 0 (0.0%) |
| Total | 441 (83.7%) | 86 (16.3%) |
Female Fertility in Kaibito
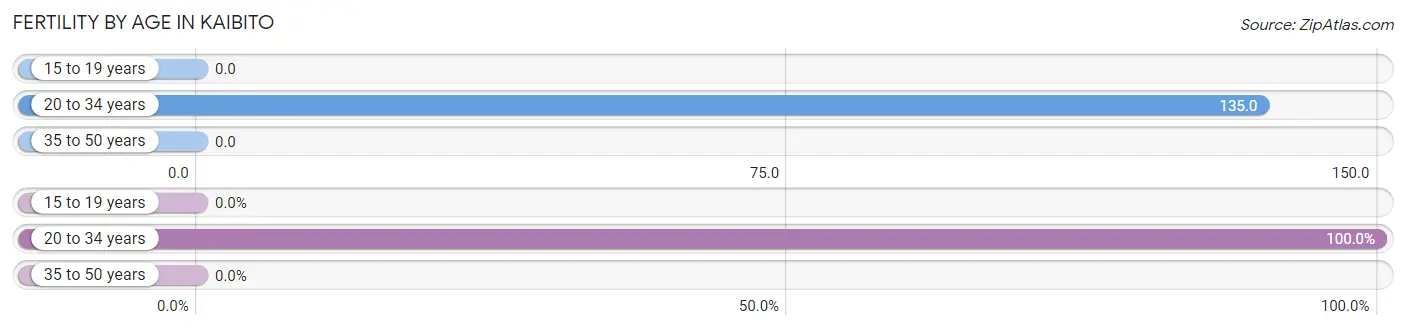
Fertility by Age in Kaibito
Average fertility rate in Kaibito is 69.0 births per 1,000 women. Women in the age bracket of 20 to 34 years have the highest fertility rate with 135.0 births per 1,000 women. Women in the age bracket of 20 to 34 years acount for 100.0% of all women with births.
| Age Bracket | Women with Births | Births / 1,000 Women |
| 15 to 19 years | 0 (0.0%) | 0.0 |
| 20 to 34 years | 30 (100.0%) | 135.0 |
| 35 to 50 years | 0 (0.0%) | 0.0 |
| Total | 30 (100.0%) | 69.0 |
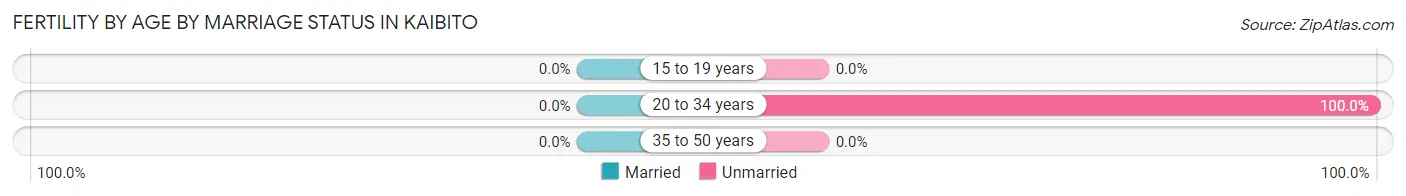
Fertility by Age by Marriage Status in Kaibito
| Age Bracket | Married | Unmarried |
| 15 to 19 years | 0 (0.0%) | 0 (0.0%) |
| 20 to 34 years | 0 (0.0%) | 30 (100.0%) |
| 35 to 50 years | 0 (0.0%) | 0 (0.0%) |
| Total | 0 (0.0%) | 30 (100.0%) |
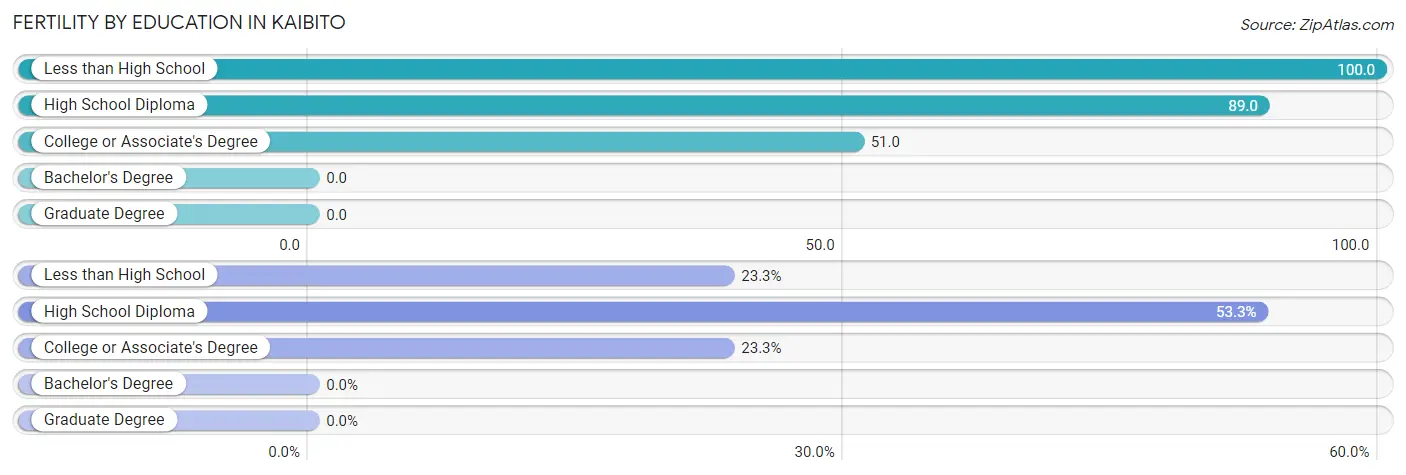
Fertility by Education in Kaibito
| Educational Attainment | Women with Births | Births / 1,000 Women |
| Less than High School | 7 (23.3%) | 100.0 |
| High School Diploma | 16 (53.3%) | 89.0 |
| College or Associate's Degree | 7 (23.3%) | 51.0 |
| Bachelor's Degree | 0 (0.0%) | 0.0 |
| Graduate Degree | 0 (0.0%) | 0.0 |
| Total | 30 (100.0%) | 69.0 |
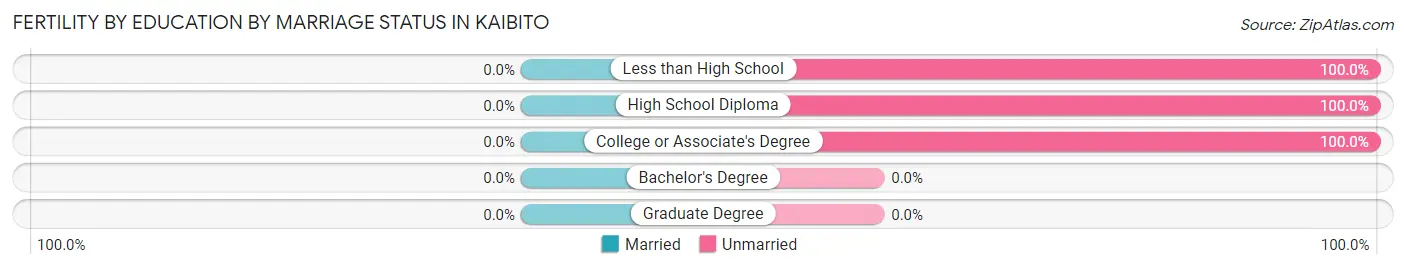
Fertility by Education by Marriage Status in Kaibito
| Educational Attainment | Married | Unmarried |
| Less than High School | 0 (0.0%) | 7 (100.0%) |
| High School Diploma | 0 (0.0%) | 16 (100.0%) |
| College or Associate's Degree | 0 (0.0%) | 7 (100.0%) |
| Bachelor's Degree | 0 (0.0%) | 0 (0.0%) |
| Graduate Degree | 0 (0.0%) | 0 (0.0%) |
| Total | 0 (0.0%) | 30 (100.0%) |
Employment Characteristics in Kaibito
Employment by Class of Employer in Kaibito
Among the 522 employed individuals in Kaibito, private company employees (357 | 68.4%), state government employees (62 | 11.9%), and local government employees (45 | 8.6%) make up the most common classes of employment.
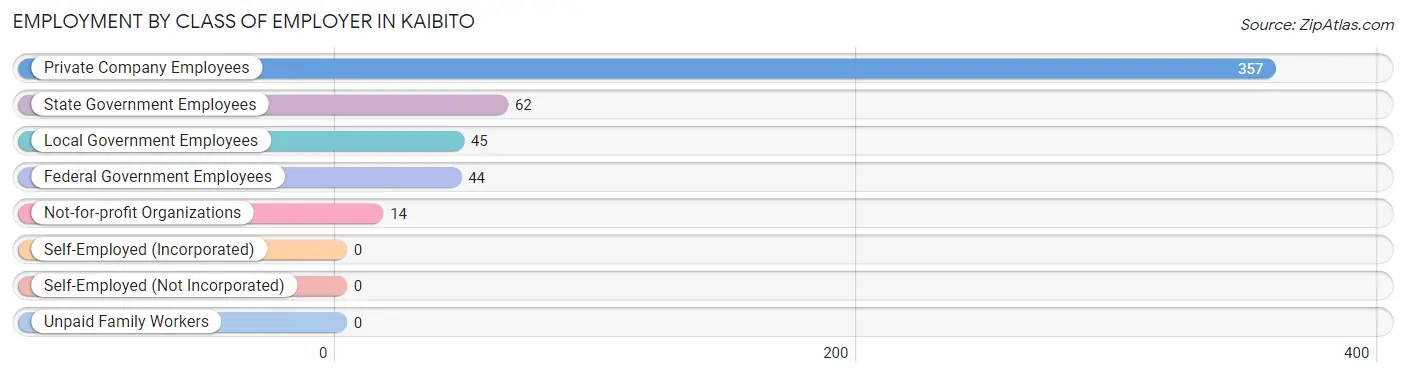
| Employer Class | # Employees | % Employees |
| Private Company Employees | 357 | 68.4% |
| Self-Employed (Incorporated) | 0 | 0.0% |
| Self-Employed (Not Incorporated) | 0 | 0.0% |
| Not-for-profit Organizations | 14 | 2.7% |
| Local Government Employees | 45 | 8.6% |
| State Government Employees | 62 | 11.9% |
| Federal Government Employees | 44 | 8.4% |
| Unpaid Family Workers | 0 | 0.0% |
| Total | 522 | 100.0% |
Employment Status by Age in Kaibito
According to the labor force statistics for Kaibito, out of the total population over 16 years of age (1,261), 49.6% or 625 individuals are in the labor force, with 16.0% or 100 of them unemployed. The age group with the highest labor force participation rate is 25 to 29 years, with 86.7% or 144 individuals in the labor force. Within the labor force, the 30 to 34 years age range has the highest percentage of unemployed individuals, with 52.5% or 21 of them being unemployed.
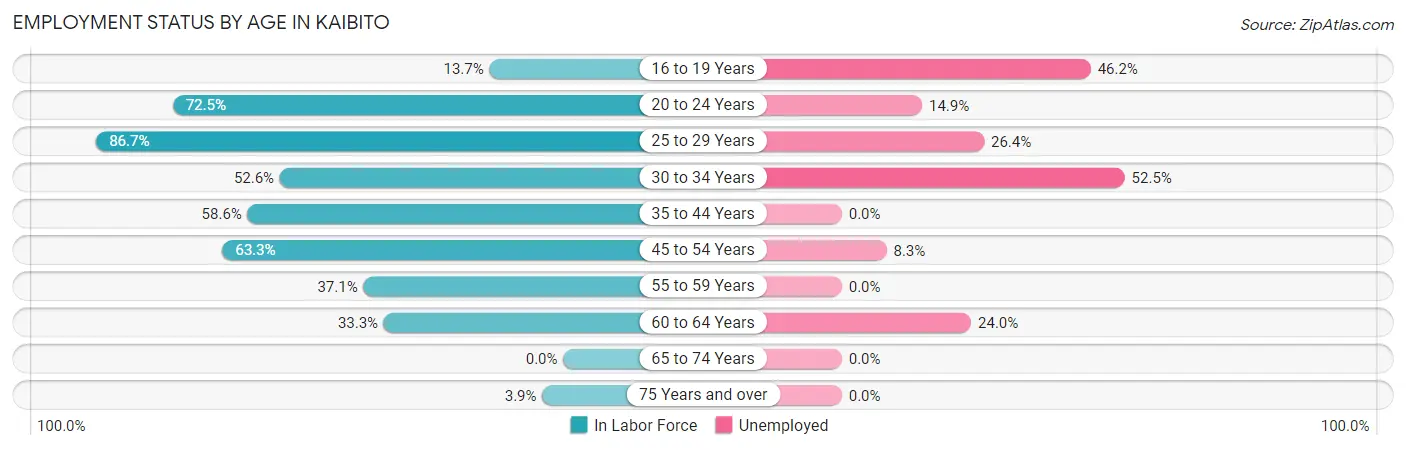
| Age Bracket | In Labor Force | Unemployed |
| 16 to 19 Years | 13 (13.7%) | 6 (46.2%) |
| 20 to 24 Years | 121 (72.5%) | 18 (14.9%) |
| 25 to 29 Years | 144 (86.7%) | 38 (26.4%) |
| 30 to 34 Years | 40 (52.6%) | 21 (52.5%) |
| 35 to 44 Years | 102 (58.6%) | 0 (0.0%) |
| 45 to 54 Years | 133 (63.3%) | 11 (8.3%) |
| 55 to 59 Years | 43 (37.1%) | 0 (0.0%) |
| 60 to 64 Years | 25 (33.3%) | 6 (24.0%) |
| 65 to 74 Years | 0 (0.0%) | 0 (0.0%) |
| 75 Years and over | 5 (3.9%) | 0 (0.0%) |
| Total | 625 (49.6%) | 100 (16.0%) |
Employment Status by Educational Attainment in Kaibito
According to labor force statistics for Kaibito, 59.6% of individuals (487) out of the total population between 25 and 64 years of age (817) are in the labor force, with 15.6% or 76 of them being unemployed. The group with the highest labor force participation rate are those with the educational attainment of bachelor's degree or higher, with 78.6% or 55 individuals in the labor force. Within the labor force, individuals with less than high school education have the highest percentage of unemployment, with 32.7% or 16 of them being unemployed.
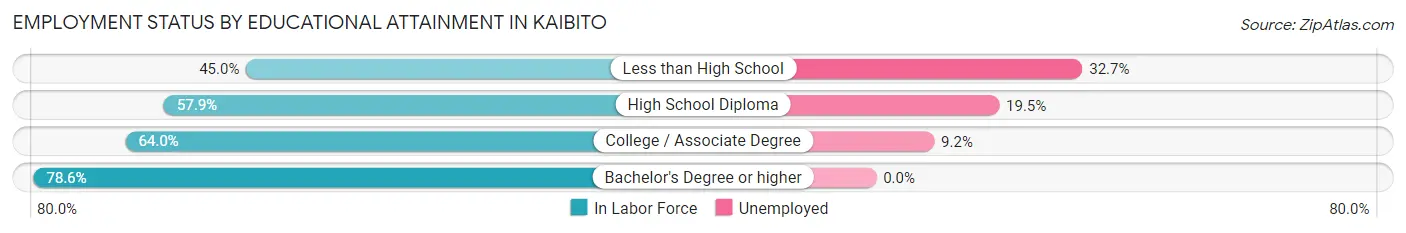
| Educational Attainment | In Labor Force | Unemployed |
| Less than High School | 49 (45.0%) | 36 (32.7%) |
| High School Diploma | 241 (57.9%) | 81 (19.5%) |
| College / Associate Degree | 142 (64.0%) | 20 (9.2%) |
| Bachelor's Degree or higher | 55 (78.6%) | 0 (0.0%) |
| Total | 487 (59.6%) | 127 (15.6%) |
Employment Occupations by Sex in Kaibito
Management, Business, Science and Arts Occupations
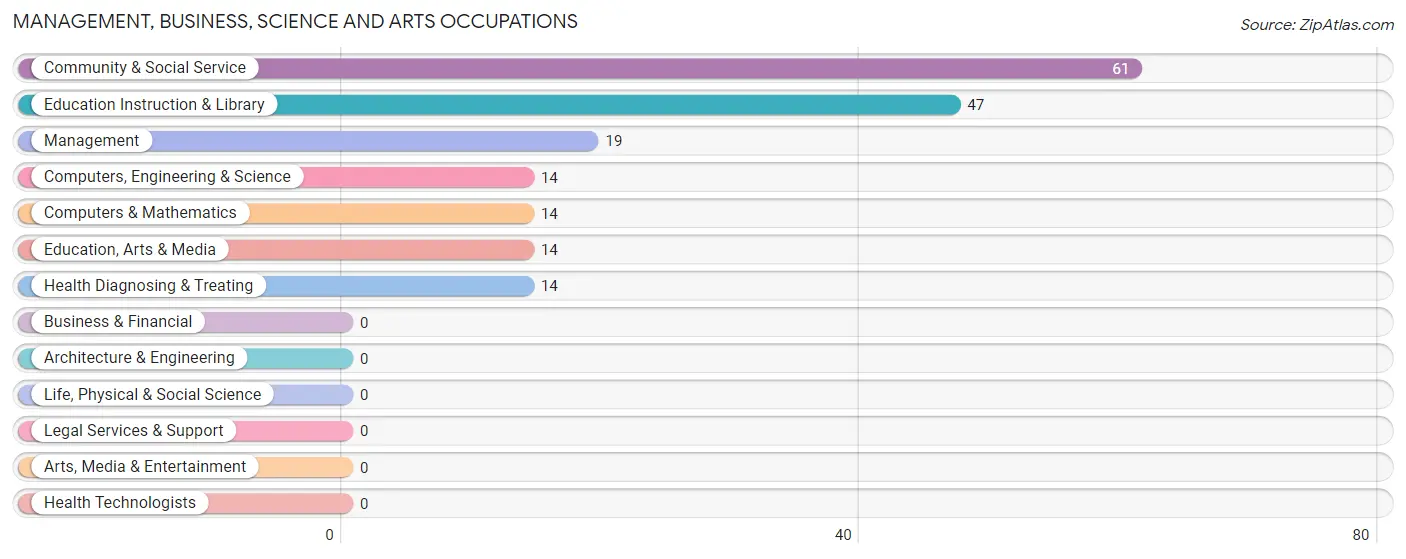
The most common Management, Business, Science and Arts occupations in Kaibito are Community & Social Service (61 | 11.6%), Education Instruction & Library (47 | 8.9%), Management (19 | 3.6%), Computers, Engineering & Science (14 | 2.7%), and Computers & Mathematics (14 | 2.7%).
Management, Business, Science and Arts Occupations by Sex
Within the Management, Business, Science and Arts occupations in Kaibito, the most male-oriented occupations are Education Instruction & Library (29.8%), Community & Social Service (23.0%), and Management (21.0%), while the most female-oriented occupations are Computers, Engineering & Science (100.0%), Computers & Mathematics (100.0%), and Education, Arts & Media (100.0%).
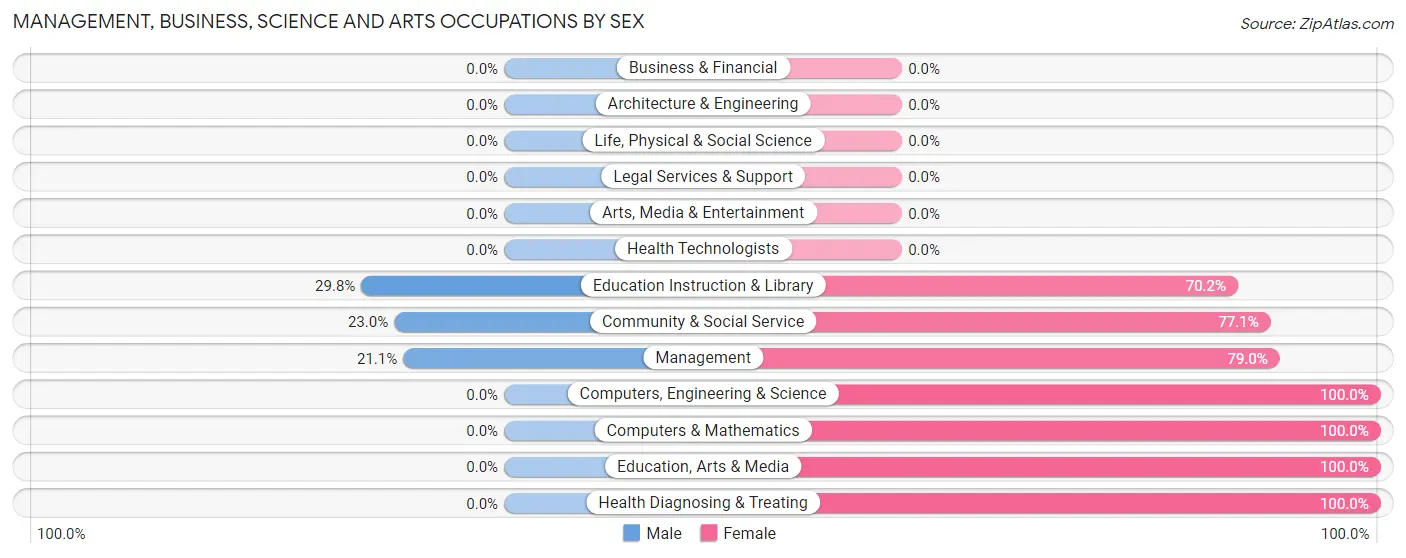
| Occupation | Male | Female |
| Management | 4 (21.0%) | 15 (78.9%) |
| Business & Financial | 0 (0.0%) | 0 (0.0%) |
| Computers, Engineering & Science | 0 (0.0%) | 14 (100.0%) |
| Computers & Mathematics | 0 (0.0%) | 14 (100.0%) |
| Architecture & Engineering | 0 (0.0%) | 0 (0.0%) |
| Life, Physical & Social Science | 0 (0.0%) | 0 (0.0%) |
| Community & Social Service | 14 (23.0%) | 47 (77.0%) |
| Education, Arts & Media | 0 (0.0%) | 14 (100.0%) |
| Legal Services & Support | 0 (0.0%) | 0 (0.0%) |
| Education Instruction & Library | 14 (29.8%) | 33 (70.2%) |
| Arts, Media & Entertainment | 0 (0.0%) | 0 (0.0%) |
| Health Diagnosing & Treating | 0 (0.0%) | 14 (100.0%) |
| Health Technologists | 0 (0.0%) | 0 (0.0%) |
| Total (Category) | 18 (16.7%) | 90 (83.3%) |
| Total (Overall) | 225 (42.8%) | 301 (57.2%) |
Services Occupations
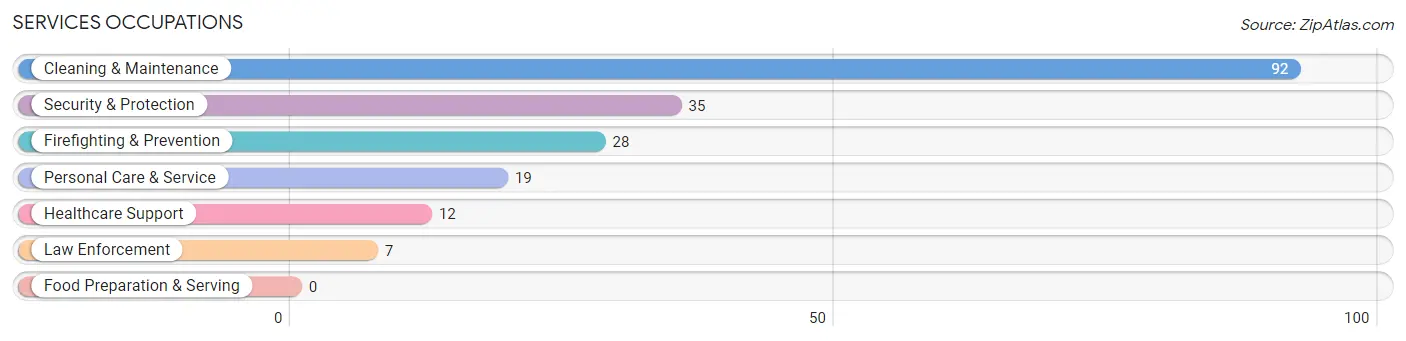
The most common Services occupations in Kaibito are Cleaning & Maintenance (92 | 17.5%), Security & Protection (35 | 6.7%), Firefighting & Prevention (28 | 5.3%), Personal Care & Service (19 | 3.6%), and Healthcare Support (12 | 2.3%).
Services Occupations by Sex
Within the Services occupations in Kaibito, the most male-oriented occupations are Law Enforcement (100.0%), Cleaning & Maintenance (59.8%), and Personal Care & Service (26.3%), while the most female-oriented occupations are Healthcare Support (100.0%), Firefighting & Prevention (100.0%), and Security & Protection (80.0%).
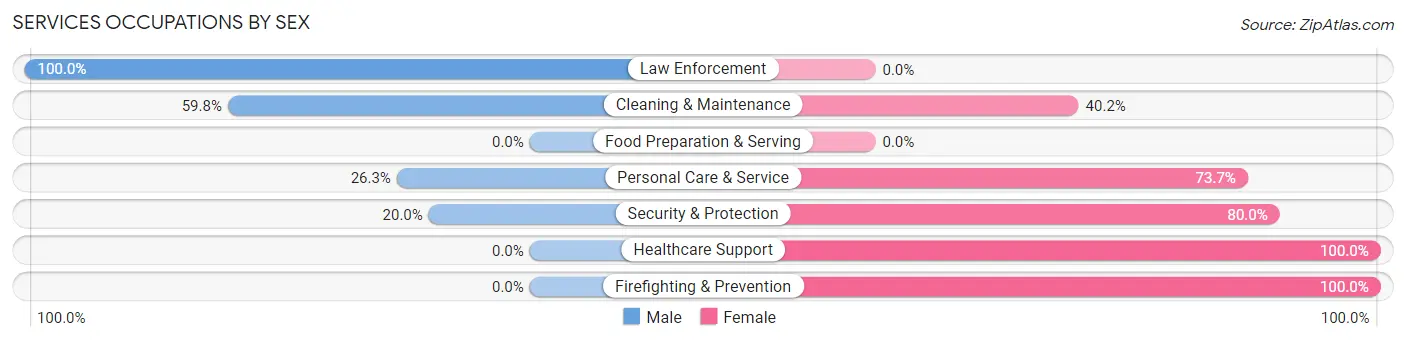
| Occupation | Male | Female |
| Healthcare Support | 0 (0.0%) | 12 (100.0%) |
| Security & Protection | 7 (20.0%) | 28 (80.0%) |
| Firefighting & Prevention | 0 (0.0%) | 28 (100.0%) |
| Law Enforcement | 7 (100.0%) | 0 (0.0%) |
| Food Preparation & Serving | 0 (0.0%) | 0 (0.0%) |
| Cleaning & Maintenance | 55 (59.8%) | 37 (40.2%) |
| Personal Care & Service | 5 (26.3%) | 14 (73.7%) |
| Total (Category) | 67 (42.4%) | 91 (57.6%) |
| Total (Overall) | 225 (42.8%) | 301 (57.2%) |
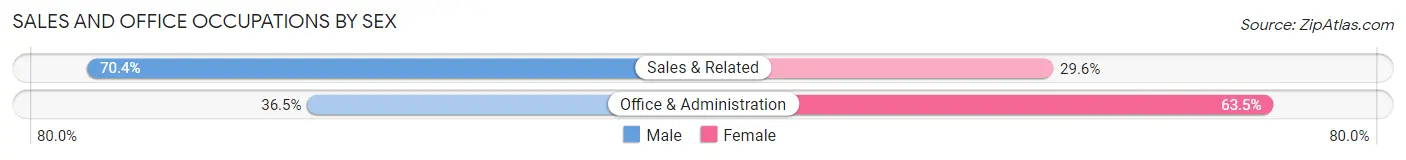
Sales and Office Occupations
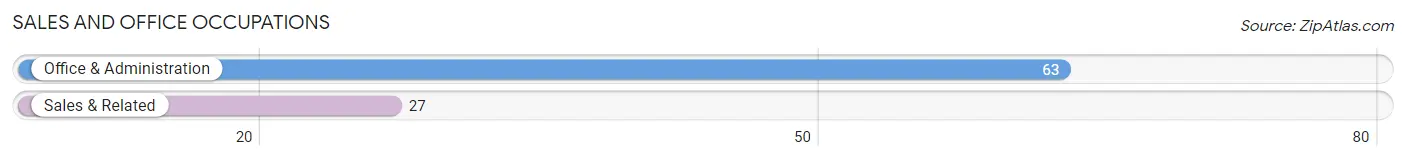
The most common Sales and Office occupations in Kaibito are Office & Administration (63 | 12.0%), and Sales & Related (27 | 5.1%).
Sales and Office Occupations by Sex
| Occupation | Male | Female |
| Sales & Related | 19 (70.4%) | 8 (29.6%) |
| Office & Administration | 23 (36.5%) | 40 (63.5%) |
| Total (Category) | 42 (46.7%) | 48 (53.3%) |
| Total (Overall) | 225 (42.8%) | 301 (57.2%) |
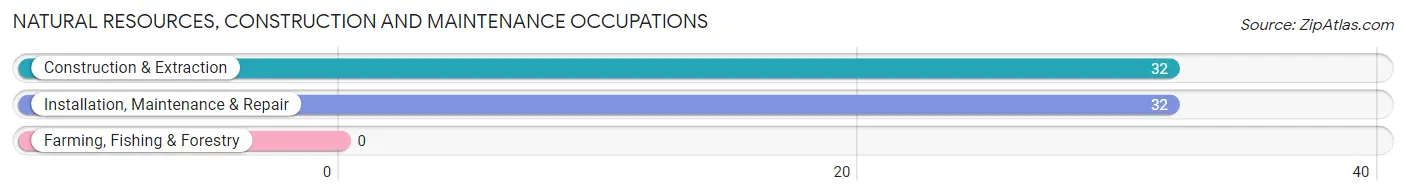
Natural Resources, Construction and Maintenance Occupations
The most common Natural Resources, Construction and Maintenance occupations in Kaibito are Construction & Extraction (32 | 6.1%), and Installation, Maintenance & Repair (32 | 6.1%).
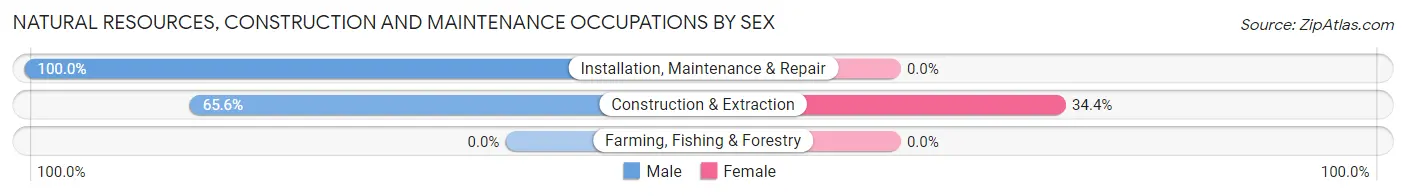
Natural Resources, Construction and Maintenance Occupations by Sex
| Occupation | Male | Female |
| Farming, Fishing & Forestry | 0 (0.0%) | 0 (0.0%) |
| Construction & Extraction | 21 (65.6%) | 11 (34.4%) |
| Installation, Maintenance & Repair | 32 (100.0%) | 0 (0.0%) |
| Total (Category) | 53 (82.8%) | 11 (17.2%) |
| Total (Overall) | 225 (42.8%) | 301 (57.2%) |
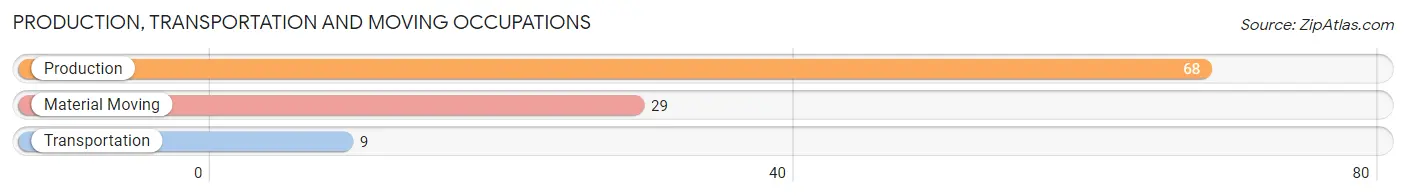
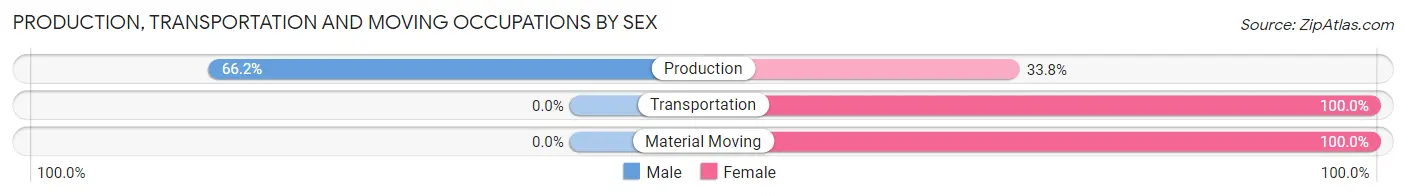
Production, Transportation and Moving Occupations
The most common Production, Transportation and Moving occupations in Kaibito are Production (68 | 12.9%), Material Moving (29 | 5.5%), and Transportation (9 | 1.7%).
Production, Transportation and Moving Occupations by Sex
| Occupation | Male | Female |
| Production | 45 (66.2%) | 23 (33.8%) |
| Transportation | 0 (0.0%) | 9 (100.0%) |
| Material Moving | 0 (0.0%) | 29 (100.0%) |
| Total (Category) | 45 (42.4%) | 61 (57.6%) |
| Total (Overall) | 225 (42.8%) | 301 (57.2%) |
Employment Industries by Sex in Kaibito
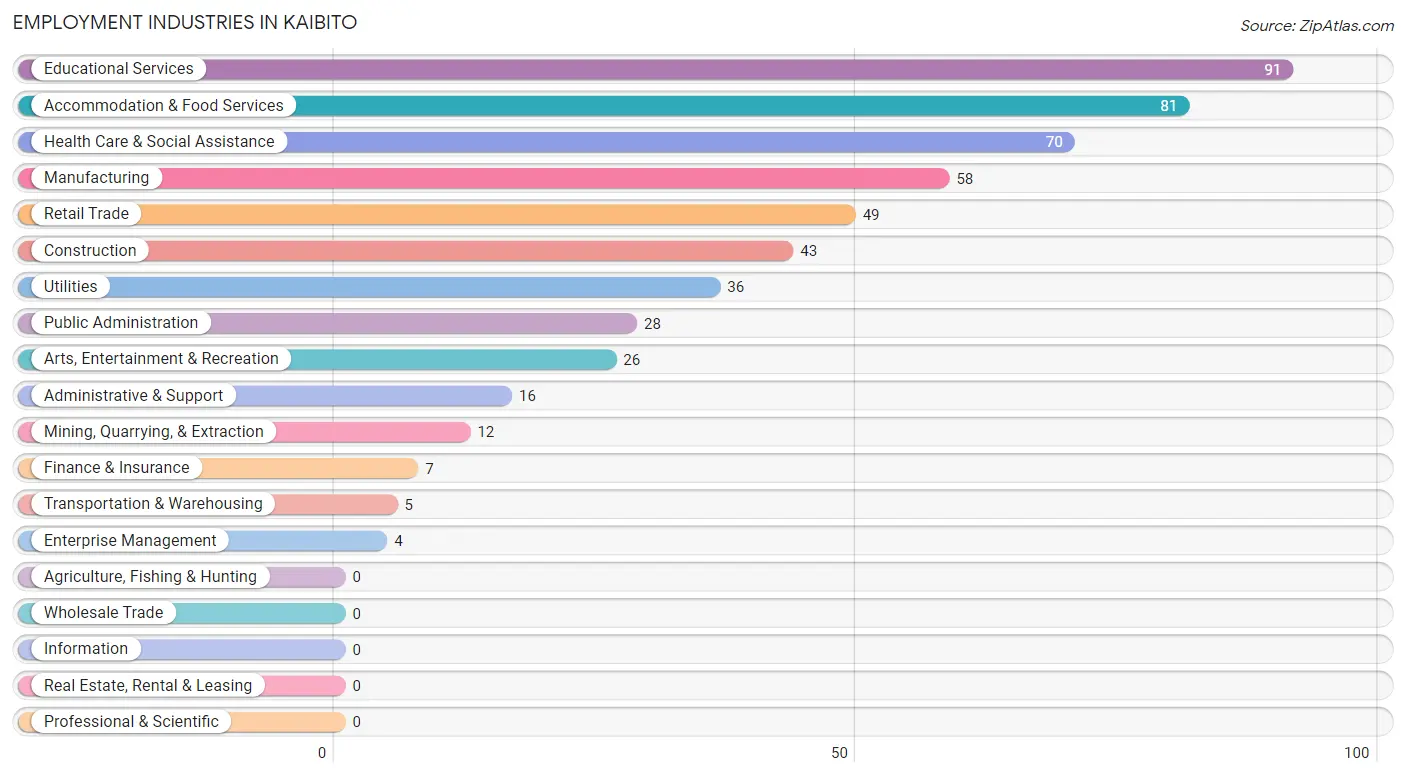
Employment Industries in Kaibito
The major employment industries in Kaibito include Educational Services (91 | 17.3%), Accommodation & Food Services (81 | 15.4%), Health Care & Social Assistance (70 | 13.3%), Manufacturing (58 | 11.0%), and Retail Trade (49 | 9.3%).
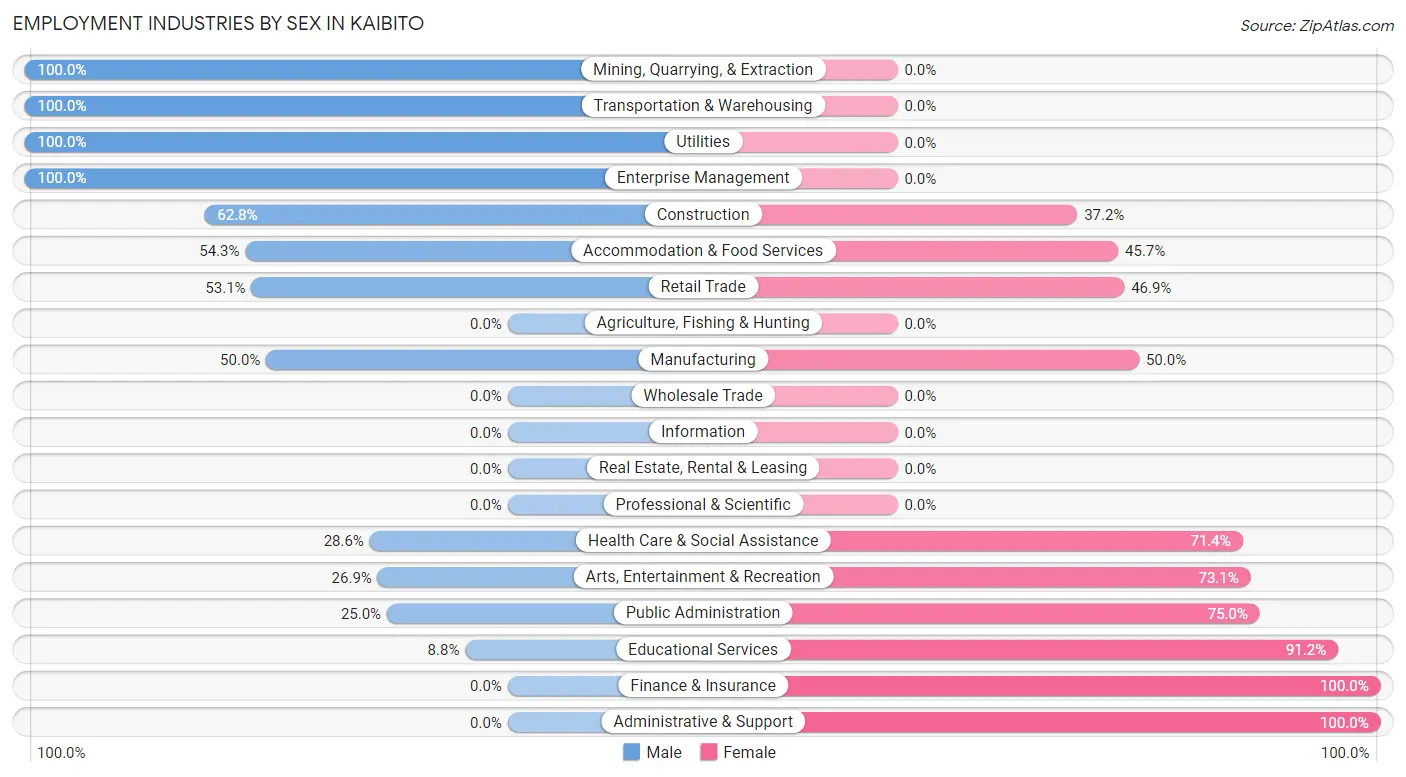
Employment Industries by Sex in Kaibito
The Kaibito industries that see more men than women are Mining, Quarrying, & Extraction (100.0%), Transportation & Warehousing (100.0%), and Utilities (100.0%), whereas the industries that tend to have a higher number of women are Finance & Insurance (100.0%), Administrative & Support (100.0%), and Educational Services (91.2%).
| Industry | Male | Female |
| Agriculture, Fishing & Hunting | 0 (0.0%) | 0 (0.0%) |
| Mining, Quarrying, & Extraction | 12 (100.0%) | 0 (0.0%) |
| Construction | 27 (62.8%) | 16 (37.2%) |
| Manufacturing | 29 (50.0%) | 29 (50.0%) |
| Wholesale Trade | 0 (0.0%) | 0 (0.0%) |
| Retail Trade | 26 (53.1%) | 23 (46.9%) |
| Transportation & Warehousing | 5 (100.0%) | 0 (0.0%) |
| Utilities | 36 (100.0%) | 0 (0.0%) |
| Information | 0 (0.0%) | 0 (0.0%) |
| Finance & Insurance | 0 (0.0%) | 7 (100.0%) |
| Real Estate, Rental & Leasing | 0 (0.0%) | 0 (0.0%) |
| Professional & Scientific | 0 (0.0%) | 0 (0.0%) |
| Enterprise Management | 4 (100.0%) | 0 (0.0%) |
| Administrative & Support | 0 (0.0%) | 16 (100.0%) |
| Educational Services | 8 (8.8%) | 83 (91.2%) |
| Health Care & Social Assistance | 20 (28.6%) | 50 (71.4%) |
| Arts, Entertainment & Recreation | 7 (26.9%) | 19 (73.1%) |
| Accommodation & Food Services | 44 (54.3%) | 37 (45.7%) |
| Public Administration | 7 (25.0%) | 21 (75.0%) |
| Total | 225 (42.8%) | 301 (57.2%) |
Education in Kaibito
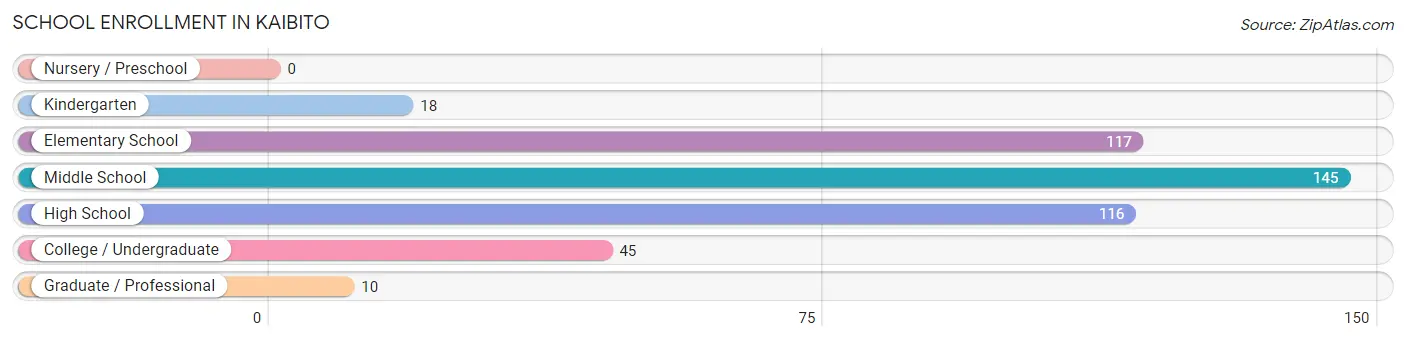
School Enrollment in Kaibito
The most common levels of schooling among the 451 students in Kaibito are middle school (145 | 32.2%), elementary school (117 | 25.9%), and high school (116 | 25.7%).
| School Level | # Students | % Students |
| Nursery / Preschool | 0 | 0.0% |
| Kindergarten | 18 | 4.0% |
| Elementary School | 117 | 25.9% |
| Middle School | 145 | 32.2% |
| High School | 116 | 25.7% |
| College / Undergraduate | 45 | 10.0% |
| Graduate / Professional | 10 | 2.2% |
| Total | 451 | 100.0% |
School Enrollment by Age by Funding Source in Kaibito
Out of a total of 451 students who are enrolled in schools in Kaibito, 17 (3.8%) attend a private institution, while the remaining 434 (96.2%) are enrolled in public schools. The age group of 5 to 9 year old has the highest likelihood of being enrolled in private schools, with 17 (11.6% in the age bracket) enrolled. Conversely, the age group of 10 to 14 year olds has the lowest likelihood of being enrolled in a private school, with 154 (100.0% in the age bracket) attending a public institution.
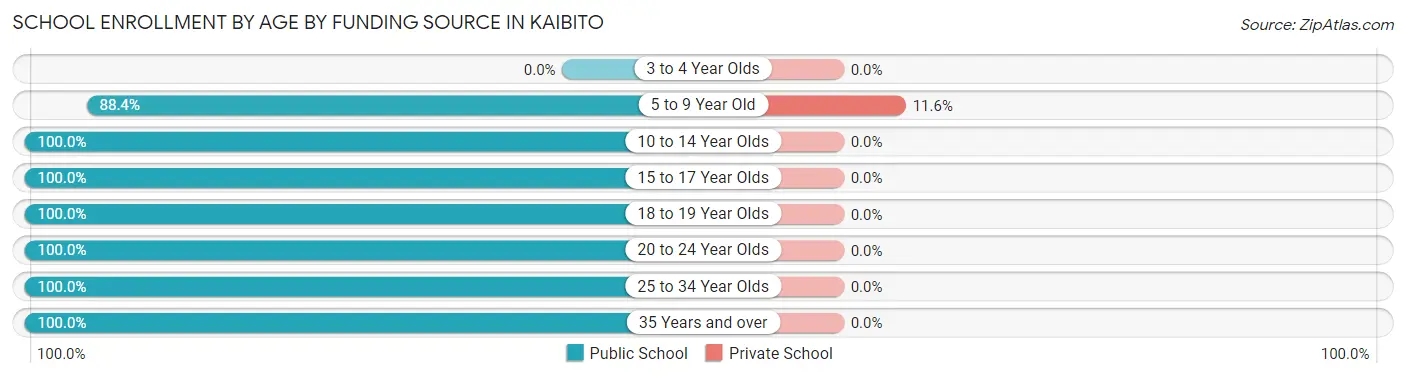
| Age Bracket | Public School | Private School |
| 3 to 4 Year Olds | 0 (0.0%) | 0 (0.0%) |
| 5 to 9 Year Old | 130 (88.4%) | 17 (11.6%) |
| 10 to 14 Year Olds | 154 (100.0%) | 0 (0.0%) |
| 15 to 17 Year Olds | 71 (100.0%) | 0 (0.0%) |
| 18 to 19 Year Olds | 35 (100.0%) | 0 (0.0%) |
| 20 to 24 Year Olds | 9 (100.0%) | 0 (0.0%) |
| 25 to 34 Year Olds | 20 (100.0%) | 0 (0.0%) |
| 35 Years and over | 15 (100.0%) | 0 (0.0%) |
| Total | 434 (96.2%) | 17 (3.8%) |
Educational Attainment by Field of Study in Kaibito
Education (19 | 24.0%), business (17 | 21.5%), science & technology (14 | 17.7%), psychology (7 | 8.9%), and arts & humanities (7 | 8.9%) are the most common fields of study among 79 individuals in Kaibito who have obtained a bachelor's degree or higher.
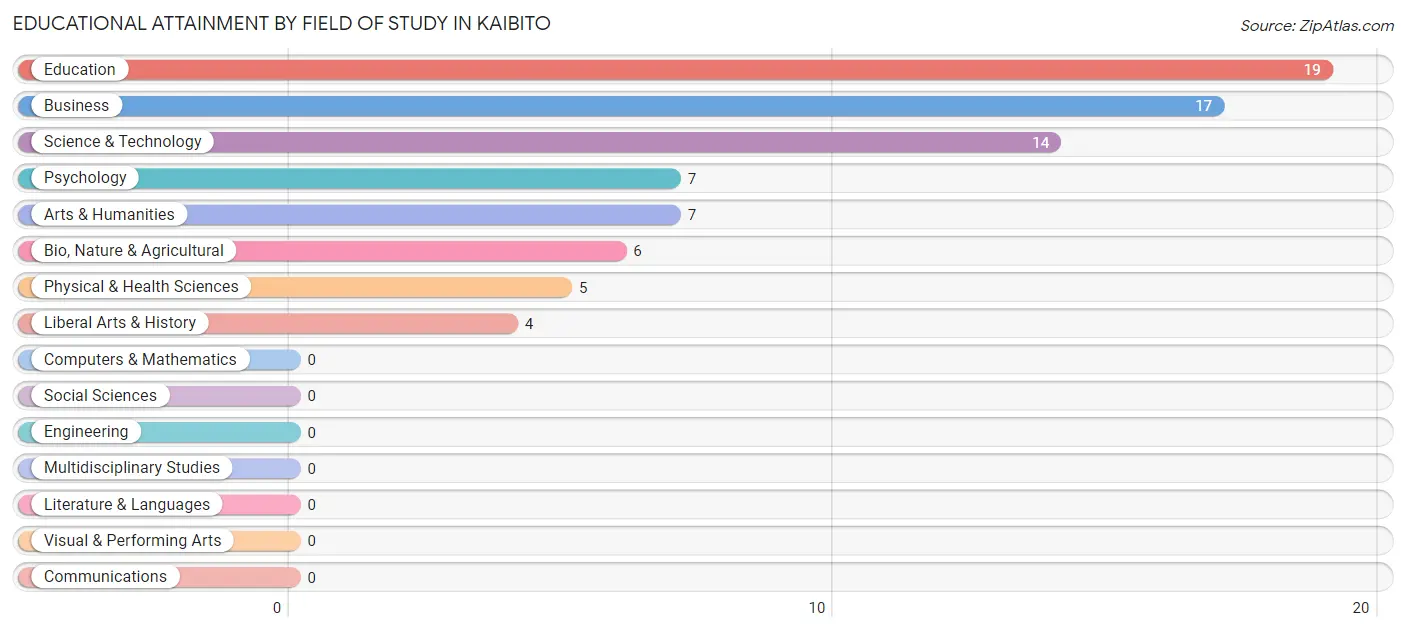
| Field of Study | # Graduates | % Graduates |
| Computers & Mathematics | 0 | 0.0% |
| Bio, Nature & Agricultural | 6 | 7.6% |
| Physical & Health Sciences | 5 | 6.3% |
| Psychology | 7 | 8.9% |
| Social Sciences | 0 | 0.0% |
| Engineering | 0 | 0.0% |
| Multidisciplinary Studies | 0 | 0.0% |
| Science & Technology | 14 | 17.7% |
| Business | 17 | 21.5% |
| Education | 19 | 24.0% |
| Literature & Languages | 0 | 0.0% |
| Liberal Arts & History | 4 | 5.1% |
| Visual & Performing Arts | 0 | 0.0% |
| Communications | 0 | 0.0% |
| Arts & Humanities | 7 | 8.9% |
| Total | 79 | 100.0% |
Transportation & Commute in Kaibito
Vehicle Availability by Sex in Kaibito
The most prevalent vehicle ownership categories in Kaibito are males with 3 vehicles (79, accounting for 35.7%) and females with 3 vehicles (90, making up 26.3%).
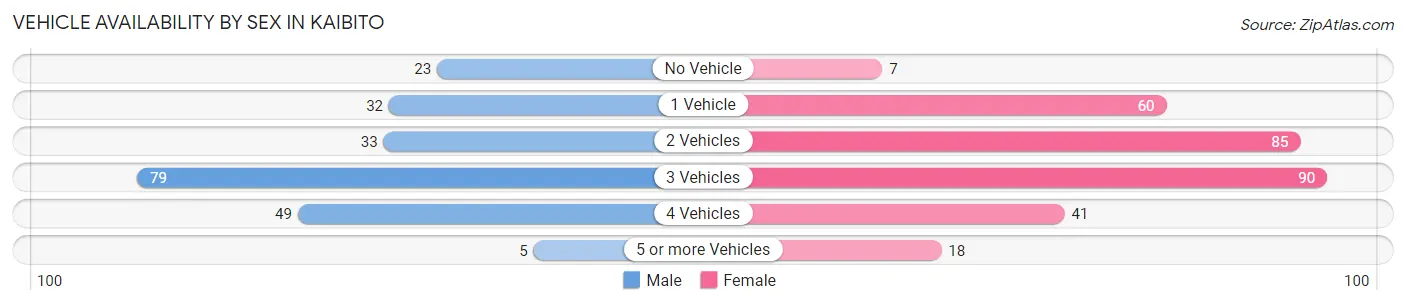
| Vehicles Available | Male | Female |
| No Vehicle | 23 (10.4%) | 7 (2.3%) |
| 1 Vehicle | 32 (14.5%) | 60 (19.9%) |
| 2 Vehicles | 33 (14.9%) | 85 (28.2%) |
| 3 Vehicles | 79 (35.7%) | 90 (29.9%) |
| 4 Vehicles | 49 (22.2%) | 41 (13.6%) |
| 5 or more Vehicles | 5 (2.3%) | 18 (6.0%) |
| Total | 221 (100.0%) | 301 (100.0%) |
Commute Time in Kaibito
The most frequently occuring commute durations in Kaibito are 45 to 59 minutes (182 commuters, 36.2%), 30 to 34 minutes (83 commuters, 16.5%), and 40 to 44 minutes (62 commuters, 12.3%).
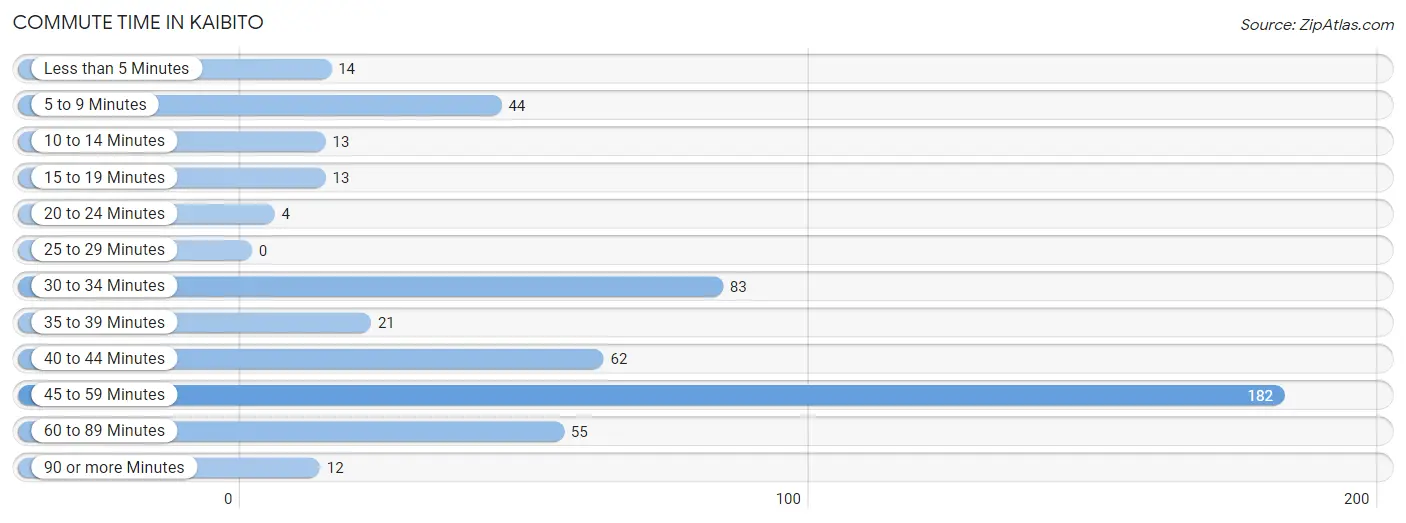
| Commute Time | # Commuters | % Commuters |
| Less than 5 Minutes | 14 | 2.8% |
| 5 to 9 Minutes | 44 | 8.7% |
| 10 to 14 Minutes | 13 | 2.6% |
| 15 to 19 Minutes | 13 | 2.6% |
| 20 to 24 Minutes | 4 | 0.8% |
| 25 to 29 Minutes | 0 | 0.0% |
| 30 to 34 Minutes | 83 | 16.5% |
| 35 to 39 Minutes | 21 | 4.2% |
| 40 to 44 Minutes | 62 | 12.3% |
| 45 to 59 Minutes | 182 | 36.2% |
| 60 to 89 Minutes | 55 | 10.9% |
| 90 or more Minutes | 12 | 2.4% |
Commute Time by Sex in Kaibito
The most common commute times in Kaibito are 45 to 59 minutes (70 commuters, 31.7%) for males and 45 to 59 minutes (112 commuters, 39.7%) for females.
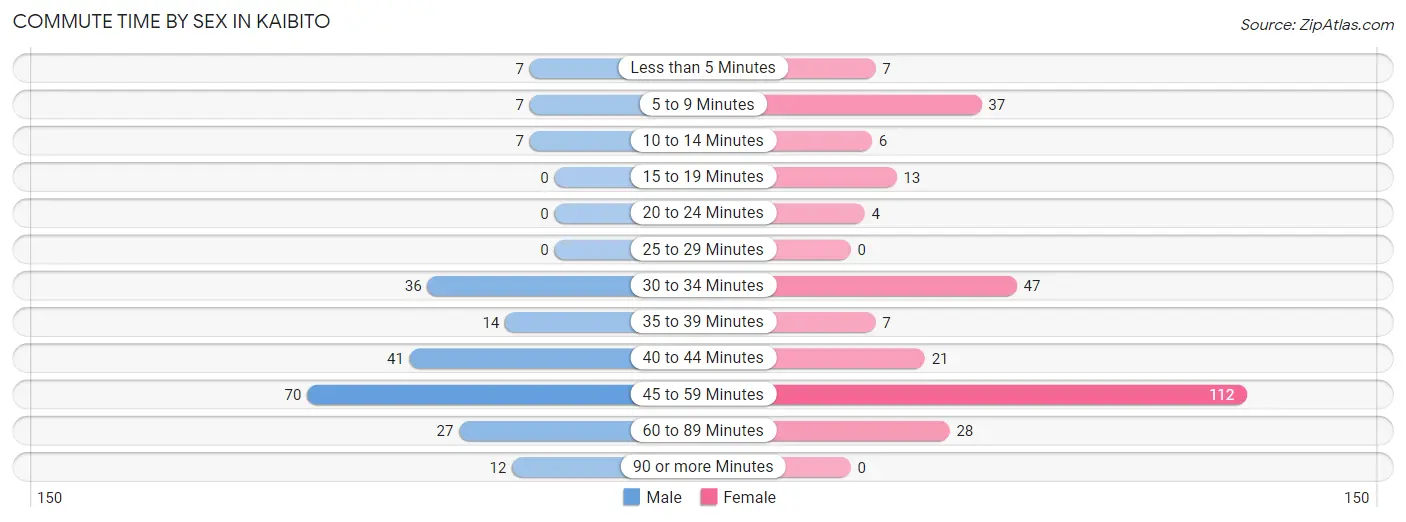
| Commute Time | Male | Female |
| Less than 5 Minutes | 7 (3.2%) | 7 (2.5%) |
| 5 to 9 Minutes | 7 (3.2%) | 37 (13.1%) |
| 10 to 14 Minutes | 7 (3.2%) | 6 (2.1%) |
| 15 to 19 Minutes | 0 (0.0%) | 13 (4.6%) |
| 20 to 24 Minutes | 0 (0.0%) | 4 (1.4%) |
| 25 to 29 Minutes | 0 (0.0%) | 0 (0.0%) |
| 30 to 34 Minutes | 36 (16.3%) | 47 (16.7%) |
| 35 to 39 Minutes | 14 (6.3%) | 7 (2.5%) |
| 40 to 44 Minutes | 41 (18.5%) | 21 (7.4%) |
| 45 to 59 Minutes | 70 (31.7%) | 112 (39.7%) |
| 60 to 89 Minutes | 27 (12.2%) | 28 (9.9%) |
| 90 or more Minutes | 12 (5.4%) | 0 (0.0%) |
Time of Departure to Work by Sex in Kaibito
The most frequent times of departure to work in Kaibito are 7:00 AM to 7:29 AM (57, 25.8%) for males and 5:00 AM to 5:29 AM (61, 21.6%) for females.
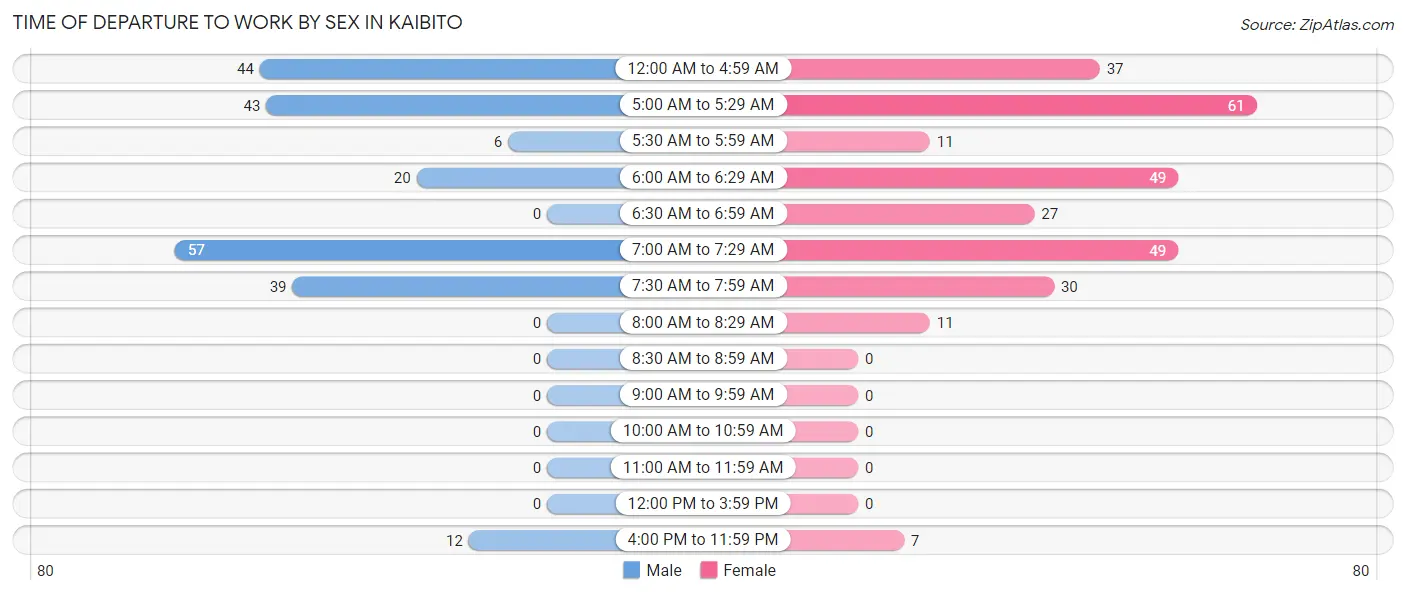
| Time of Departure | Male | Female |
| 12:00 AM to 4:59 AM | 44 (19.9%) | 37 (13.1%) |
| 5:00 AM to 5:29 AM | 43 (19.5%) | 61 (21.6%) |
| 5:30 AM to 5:59 AM | 6 (2.7%) | 11 (3.9%) |
| 6:00 AM to 6:29 AM | 20 (9.0%) | 49 (17.4%) |
| 6:30 AM to 6:59 AM | 0 (0.0%) | 27 (9.6%) |
| 7:00 AM to 7:29 AM | 57 (25.8%) | 49 (17.4%) |
| 7:30 AM to 7:59 AM | 39 (17.6%) | 30 (10.6%) |
| 8:00 AM to 8:29 AM | 0 (0.0%) | 11 (3.9%) |
| 8:30 AM to 8:59 AM | 0 (0.0%) | 0 (0.0%) |
| 9:00 AM to 9:59 AM | 0 (0.0%) | 0 (0.0%) |
| 10:00 AM to 10:59 AM | 0 (0.0%) | 0 (0.0%) |
| 11:00 AM to 11:59 AM | 0 (0.0%) | 0 (0.0%) |
| 12:00 PM to 3:59 PM | 0 (0.0%) | 0 (0.0%) |
| 4:00 PM to 11:59 PM | 12 (5.4%) | 7 (2.5%) |
| Total | 221 (100.0%) | 282 (100.0%) |
Housing Occupancy in Kaibito
Occupancy by Ownership in Kaibito
Of the total 527 dwellings in Kaibito, owner-occupied units account for 428 (81.2%), while renter-occupied units make up 99 (18.8%).
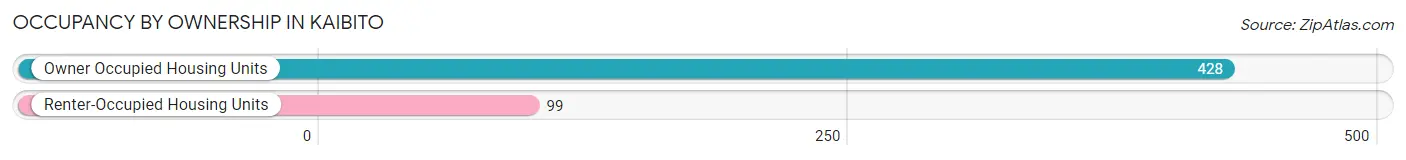
| Occupancy | # Housing Units | % Housing Units |
| Owner Occupied Housing Units | 428 | 81.2% |
| Renter-Occupied Housing Units | 99 | 18.8% |
| Total Occupied Housing Units | 527 | 100.0% |
Occupancy by Household Size in Kaibito
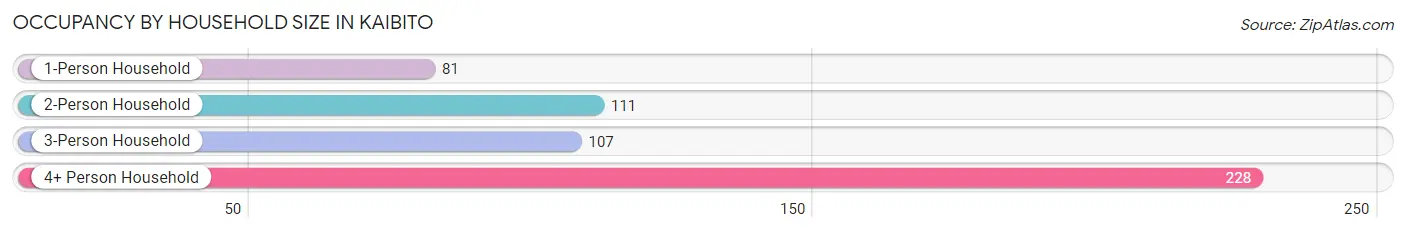
| Household Size | # Housing Units | % Housing Units |
| 1-Person Household | 81 | 15.4% |
| 2-Person Household | 111 | 21.1% |
| 3-Person Household | 107 | 20.3% |
| 4+ Person Household | 228 | 43.3% |
| Total Housing Units | 527 | 100.0% |
Occupancy by Ownership by Household Size in Kaibito
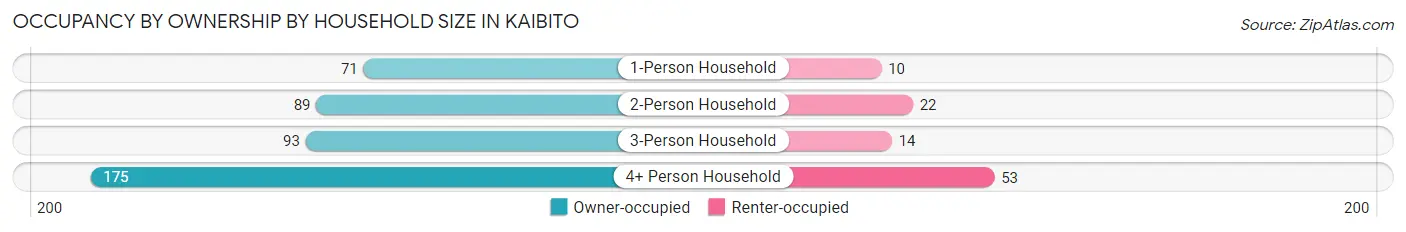
| Household Size | Owner-occupied | Renter-occupied |
| 1-Person Household | 71 (87.6%) | 10 (12.3%) |
| 2-Person Household | 89 (80.2%) | 22 (19.8%) |
| 3-Person Household | 93 (86.9%) | 14 (13.1%) |
| 4+ Person Household | 175 (76.7%) | 53 (23.3%) |
| Total Housing Units | 428 (81.2%) | 99 (18.8%) |
Occupancy by Educational Attainment in Kaibito
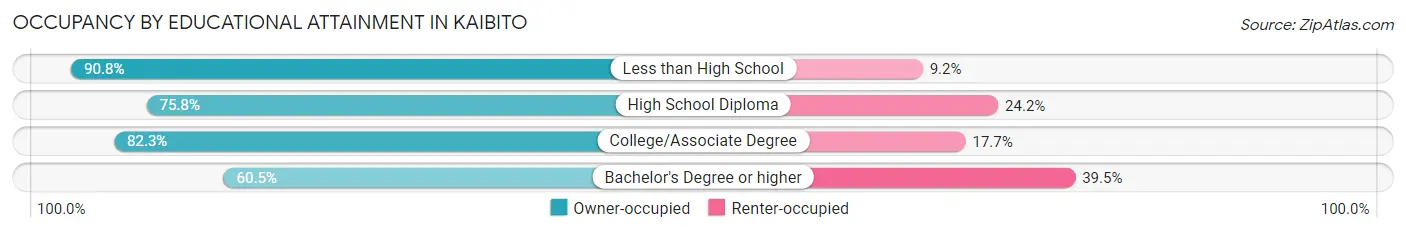
| Household Size | Owner-occupied | Renter-occupied |
| Less than High School | 177 (90.8%) | 18 (9.2%) |
| High School Diploma | 163 (75.8%) | 52 (24.2%) |
| College/Associate Degree | 65 (82.3%) | 14 (17.7%) |
| Bachelor's Degree or higher | 23 (60.5%) | 15 (39.5%) |
Occupancy by Age of Householder in Kaibito
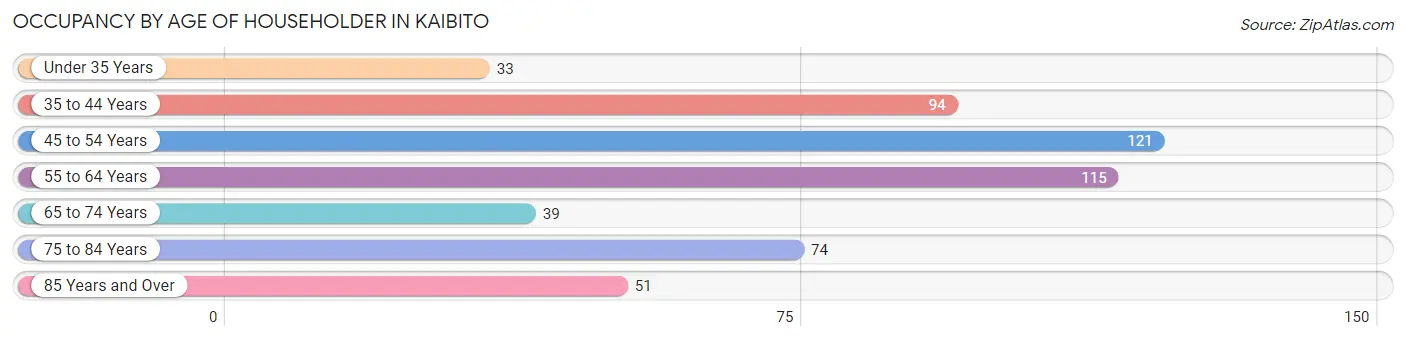
| Age Bracket | # Households | % Households |
| Under 35 Years | 33 | 6.3% |
| 35 to 44 Years | 94 | 17.8% |
| 45 to 54 Years | 121 | 23.0% |
| 55 to 64 Years | 115 | 21.8% |
| 65 to 74 Years | 39 | 7.4% |
| 75 to 84 Years | 74 | 14.0% |
| 85 Years and Over | 51 | 9.7% |
| Total | 527 | 100.0% |
Housing Finances in Kaibito
Median Income by Occupancy in Kaibito
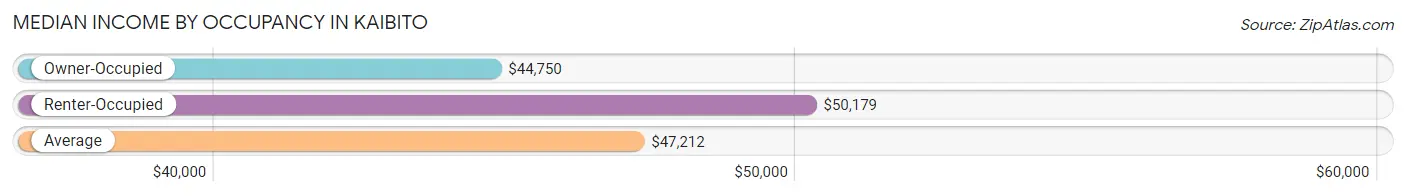
| Occupancy Type | # Households | Median Income |
| Owner-Occupied | 428 (81.2%) | $44,750 |
| Renter-Occupied | 99 (18.8%) | $50,179 |
| Average | 527 (100.0%) | $47,212 |
Occupancy by Householder Income Bracket in Kaibito
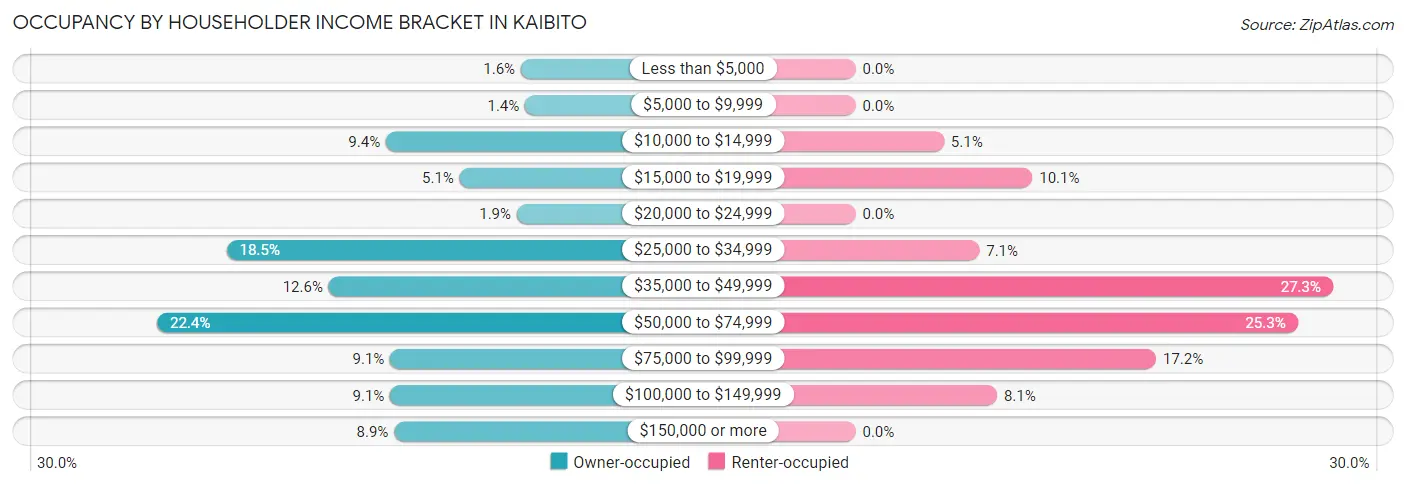
| Income Bracket | Owner-occupied | Renter-occupied |
| Less than $5,000 | 7 (1.6%) | 0 (0.0%) |
| $5,000 to $9,999 | 6 (1.4%) | 0 (0.0%) |
| $10,000 to $14,999 | 40 (9.3%) | 5 (5.1%) |
| $15,000 to $19,999 | 22 (5.1%) | 10 (10.1%) |
| $20,000 to $24,999 | 8 (1.9%) | 0 (0.0%) |
| $25,000 to $34,999 | 79 (18.5%) | 7 (7.1%) |
| $35,000 to $49,999 | 54 (12.6%) | 27 (27.3%) |
| $50,000 to $74,999 | 96 (22.4%) | 25 (25.3%) |
| $75,000 to $99,999 | 39 (9.1%) | 17 (17.2%) |
| $100,000 to $149,999 | 39 (9.1%) | 8 (8.1%) |
| $150,000 or more | 38 (8.9%) | 0 (0.0%) |
| Total | 428 (100.0%) | 99 (100.0%) |
Monthly Housing Cost Tiers in Kaibito
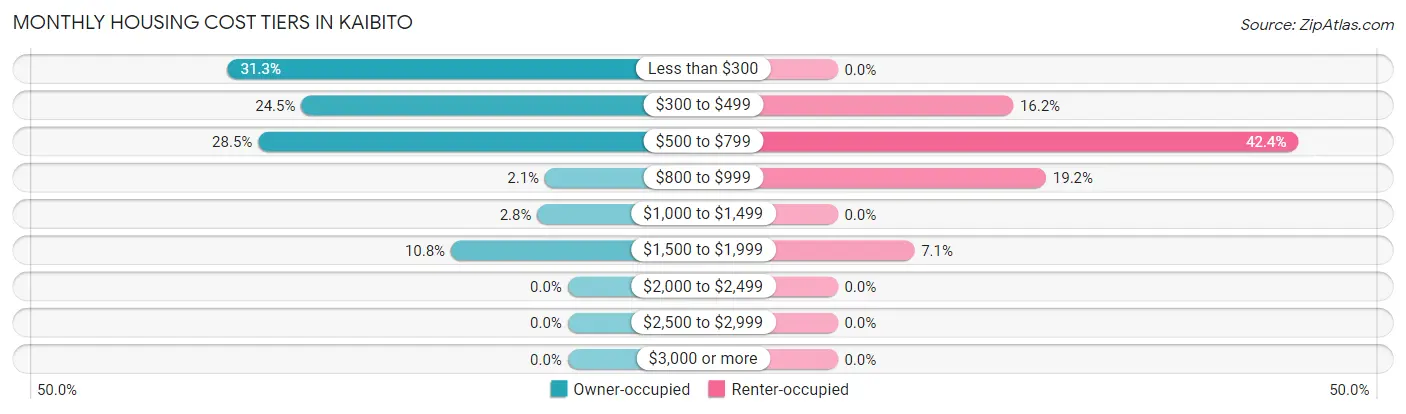
| Monthly Cost | Owner-occupied | Renter-occupied |
| Less than $300 | 134 (31.3%) | 0 (0.0%) |
| $300 to $499 | 105 (24.5%) | 16 (16.2%) |
| $500 to $799 | 122 (28.5%) | 42 (42.4%) |
| $800 to $999 | 9 (2.1%) | 19 (19.2%) |
| $1,000 to $1,499 | 12 (2.8%) | 0 (0.0%) |
| $1,500 to $1,999 | 46 (10.7%) | 7 (7.1%) |
| $2,000 to $2,499 | 0 (0.0%) | 0 (0.0%) |
| $2,500 to $2,999 | 0 (0.0%) | 0 (0.0%) |
| $3,000 or more | 0 (0.0%) | 0 (0.0%) |
| Total | 428 (100.0%) | 99 (100.0%) |
Physical Housing Characteristics in Kaibito
Housing Structures in Kaibito
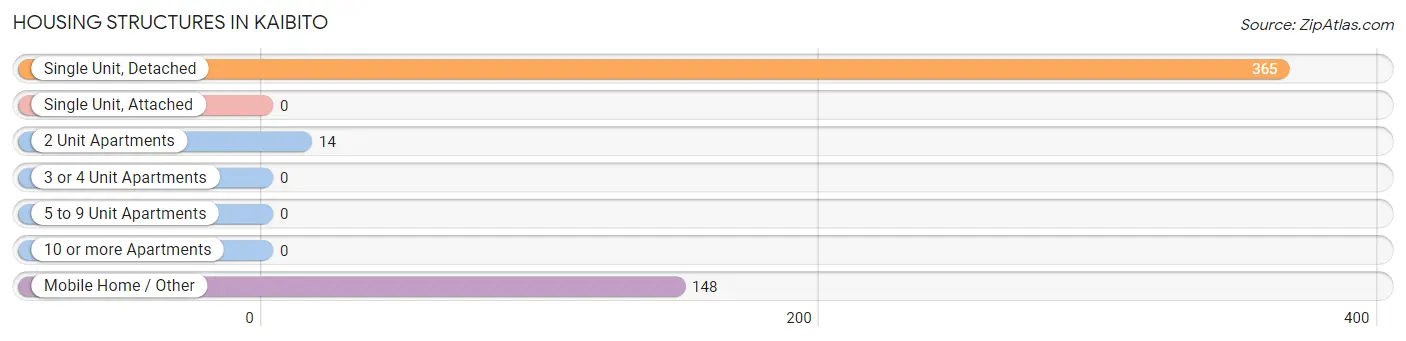
| Structure Type | # Housing Units | % Housing Units |
| Single Unit, Detached | 365 | 69.3% |
| Single Unit, Attached | 0 | 0.0% |
| 2 Unit Apartments | 14 | 2.7% |
| 3 or 4 Unit Apartments | 0 | 0.0% |
| 5 to 9 Unit Apartments | 0 | 0.0% |
| 10 or more Apartments | 0 | 0.0% |
| Mobile Home / Other | 148 | 28.1% |
| Total | 527 | 100.0% |
Housing Structures by Occupancy in Kaibito
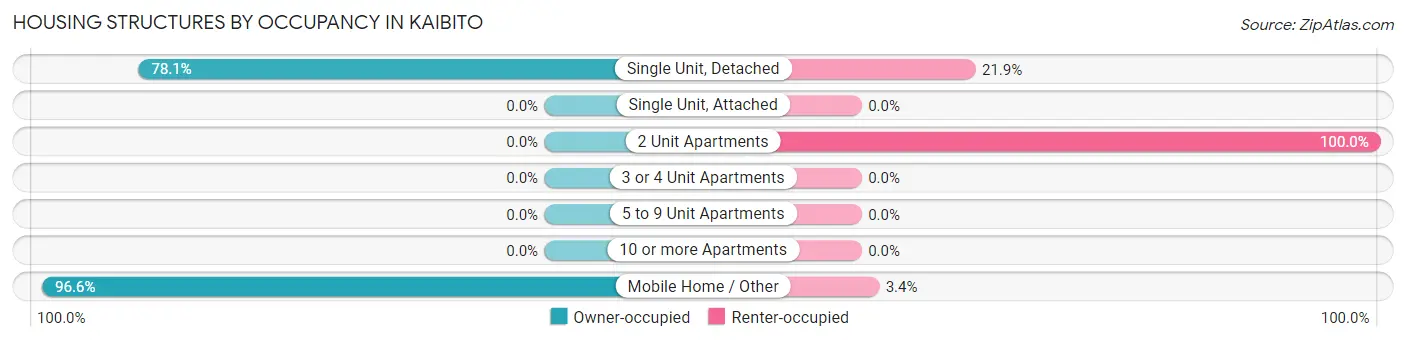
| Structure Type | Owner-occupied | Renter-occupied |
| Single Unit, Detached | 285 (78.1%) | 80 (21.9%) |
| Single Unit, Attached | 0 (0.0%) | 0 (0.0%) |
| 2 Unit Apartments | 0 (0.0%) | 14 (100.0%) |
| 3 or 4 Unit Apartments | 0 (0.0%) | 0 (0.0%) |
| 5 to 9 Unit Apartments | 0 (0.0%) | 0 (0.0%) |
| 10 or more Apartments | 0 (0.0%) | 0 (0.0%) |
| Mobile Home / Other | 143 (96.6%) | 5 (3.4%) |
| Total | 428 (81.2%) | 99 (18.8%) |
Housing Structures by Number of Rooms in Kaibito
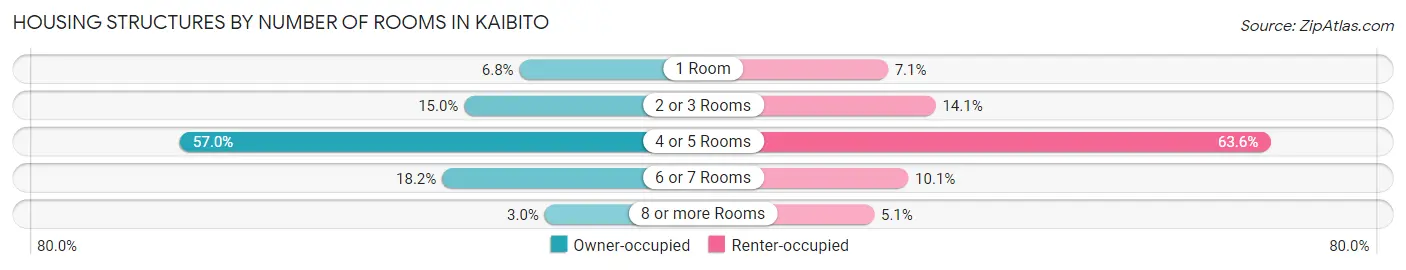
| Number of Rooms | Owner-occupied | Renter-occupied |
| 1 Room | 29 (6.8%) | 7 (7.1%) |
| 2 or 3 Rooms | 64 (14.9%) | 14 (14.1%) |
| 4 or 5 Rooms | 244 (57.0%) | 63 (63.6%) |
| 6 or 7 Rooms | 78 (18.2%) | 10 (10.1%) |
| 8 or more Rooms | 13 (3.0%) | 5 (5.1%) |
| Total | 428 (100.0%) | 99 (100.0%) |
Housing Structure by Heating Type in Kaibito
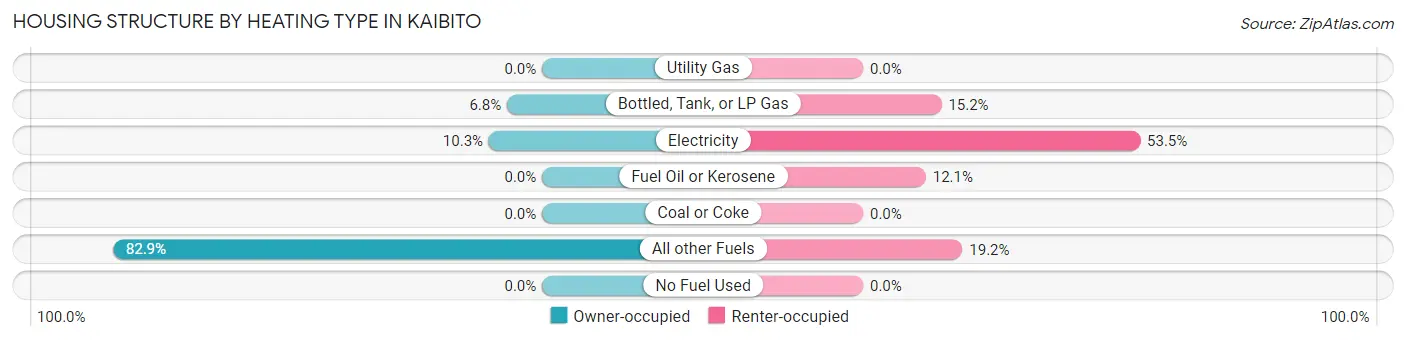
| Heating Type | Owner-occupied | Renter-occupied |
| Utility Gas | 0 (0.0%) | 0 (0.0%) |
| Bottled, Tank, or LP Gas | 29 (6.8%) | 15 (15.1%) |
| Electricity | 44 (10.3%) | 53 (53.5%) |
| Fuel Oil or Kerosene | 0 (0.0%) | 12 (12.1%) |
| Coal or Coke | 0 (0.0%) | 0 (0.0%) |
| All other Fuels | 355 (82.9%) | 19 (19.2%) |
| No Fuel Used | 0 (0.0%) | 0 (0.0%) |
| Total | 428 (100.0%) | 99 (100.0%) |
Household Vehicle Usage in Kaibito
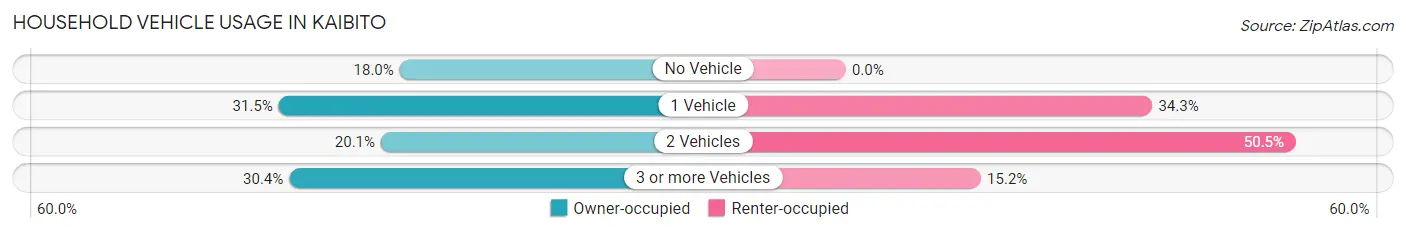
| Vehicles per Household | Owner-occupied | Renter-occupied |
| No Vehicle | 77 (18.0%) | 0 (0.0%) |
| 1 Vehicle | 135 (31.5%) | 34 (34.3%) |
| 2 Vehicles | 86 (20.1%) | 50 (50.5%) |
| 3 or more Vehicles | 130 (30.4%) | 15 (15.1%) |
| Total | 428 (100.0%) | 99 (100.0%) |
Real Estate & Mortgages in Kaibito
Real Estate and Mortgage Overview in Kaibito
| Characteristic | Without Mortgage | With Mortgage |
| Housing Units | 316 | 112 |
| Median Property Value | $82,700 | $24,600 |
| Median Household Income | $44,625 | $17 |
| Monthly Housing Costs | $335 | $0 |
| Real Estate Taxes | - | - |
Property Value by Mortgage Status in Kaibito
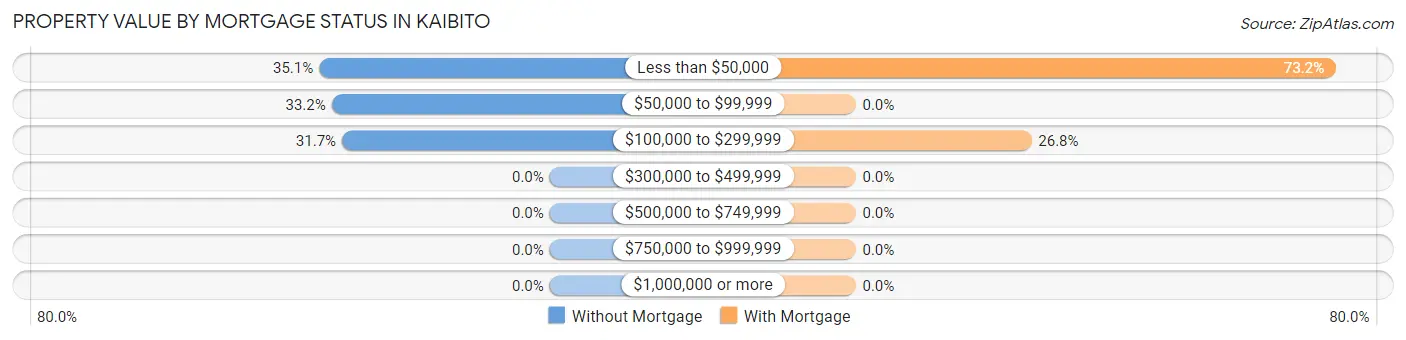
| Property Value | Without Mortgage | With Mortgage |
| Less than $50,000 | 111 (35.1%) | 82 (73.2%) |
| $50,000 to $99,999 | 105 (33.2%) | 0 (0.0%) |
| $100,000 to $299,999 | 100 (31.7%) | 30 (26.8%) |
| $300,000 to $499,999 | 0 (0.0%) | 0 (0.0%) |
| $500,000 to $749,999 | 0 (0.0%) | 0 (0.0%) |
| $750,000 to $999,999 | 0 (0.0%) | 0 (0.0%) |
| $1,000,000 or more | 0 (0.0%) | 0 (0.0%) |
| Total | 316 (100.0%) | 112 (100.0%) |
Household Income by Mortgage Status in Kaibito
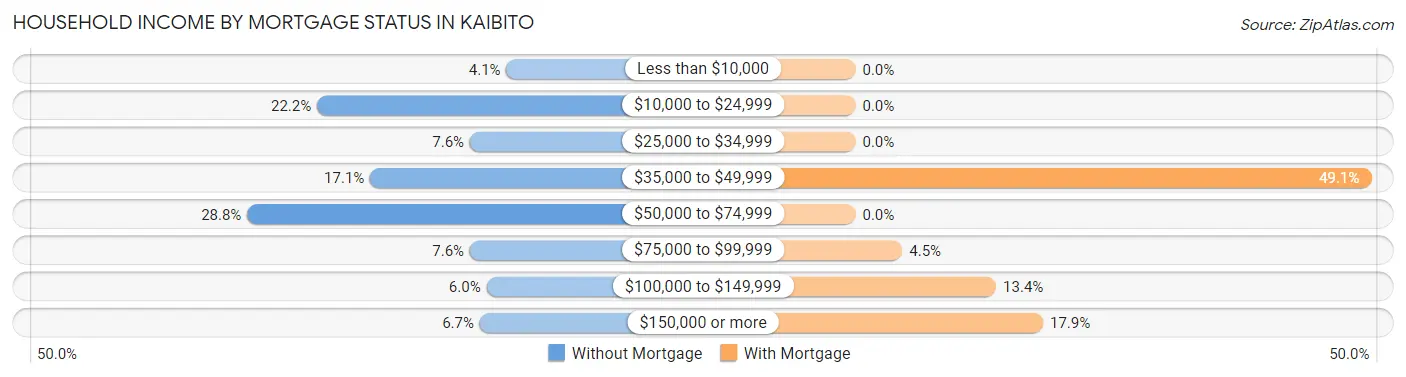
| Household Income | Without Mortgage | With Mortgage |
| Less than $10,000 | 13 (4.1%) | 0 (0.0%) |
| $10,000 to $24,999 | 70 (22.2%) | 0 (0.0%) |
| $25,000 to $34,999 | 24 (7.6%) | 0 (0.0%) |
| $35,000 to $49,999 | 54 (17.1%) | 55 (49.1%) |
| $50,000 to $74,999 | 91 (28.8%) | 0 (0.0%) |
| $75,000 to $99,999 | 24 (7.6%) | 5 (4.5%) |
| $100,000 to $149,999 | 19 (6.0%) | 15 (13.4%) |
| $150,000 or more | 21 (6.7%) | 20 (17.9%) |
| Total | 316 (100.0%) | 112 (100.0%) |
Property Value to Household Income Ratio in Kaibito
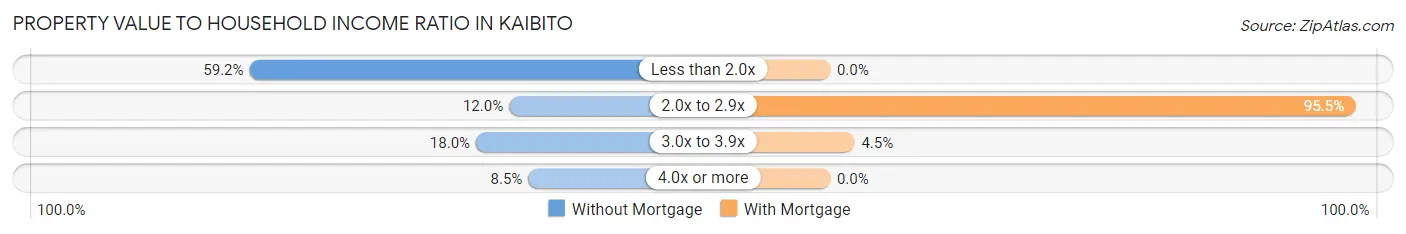
| Value-to-Income Ratio | Without Mortgage | With Mortgage |
| Less than 2.0x | 187 (59.2%) | 0 (0.0%) |
| 2.0x to 2.9x | 38 (12.0%) | 107 (95.5%) |
| 3.0x to 3.9x | 57 (18.0%) | 5 (4.5%) |
| 4.0x or more | 27 (8.5%) | 0 (0.0%) |
| Total | 316 (100.0%) | 112 (100.0%) |
Real Estate Taxes by Mortgage Status in Kaibito
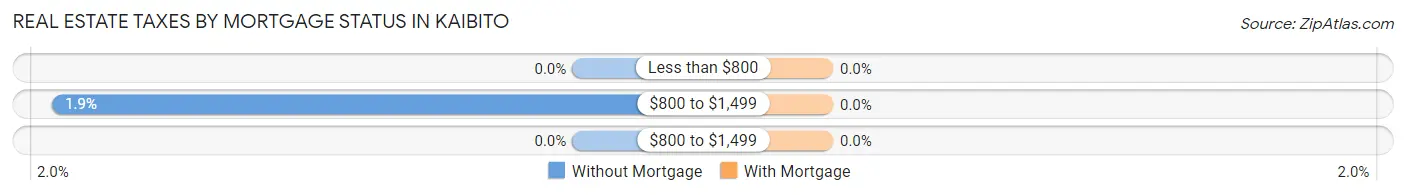
| Property Taxes | Without Mortgage | With Mortgage |
| Less than $800 | 0 (0.0%) | 0 (0.0%) |
| $800 to $1,499 | 6 (1.9%) | 0 (0.0%) |
| $800 to $1,499 | 0 (0.0%) | 0 (0.0%) |
| Total | 316 (100.0%) | 112 (100.0%) |
Health & Disability in Kaibito
Health Insurance Coverage by Age in Kaibito
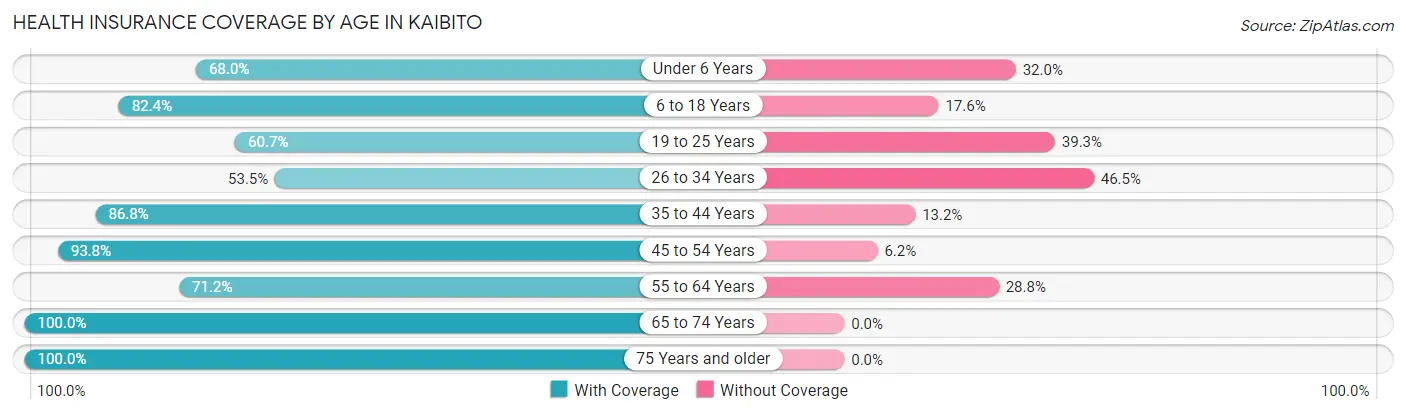
| Age Bracket | With Coverage | Without Coverage |
| Under 6 Years | 100 (68.0%) | 47 (32.0%) |
| 6 to 18 Years | 324 (82.4%) | 69 (17.6%) |
| 19 to 25 Years | 133 (60.7%) | 86 (39.3%) |
| 26 to 34 Years | 108 (53.5%) | 94 (46.5%) |
| 35 to 44 Years | 151 (86.8%) | 23 (13.2%) |
| 45 to 54 Years | 197 (93.8%) | 13 (6.2%) |
| 55 to 64 Years | 136 (71.2%) | 55 (28.8%) |
| 65 to 74 Years | 53 (100.0%) | 0 (0.0%) |
| 75 Years and older | 129 (100.0%) | 0 (0.0%) |
| Total | 1,331 (77.5%) | 387 (22.5%) |
Health Insurance Coverage by Citizenship Status in Kaibito
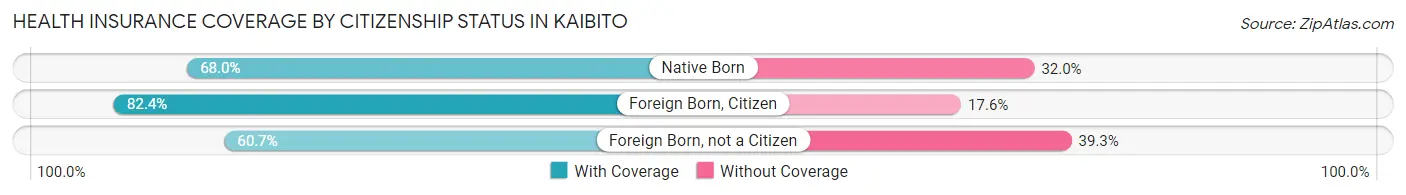
| Citizenship Status | With Coverage | Without Coverage |
| Native Born | 100 (68.0%) | 47 (32.0%) |
| Foreign Born, Citizen | 324 (82.4%) | 69 (17.6%) |
| Foreign Born, not a Citizen | 133 (60.7%) | 86 (39.3%) |
Health Insurance Coverage by Household Income in Kaibito
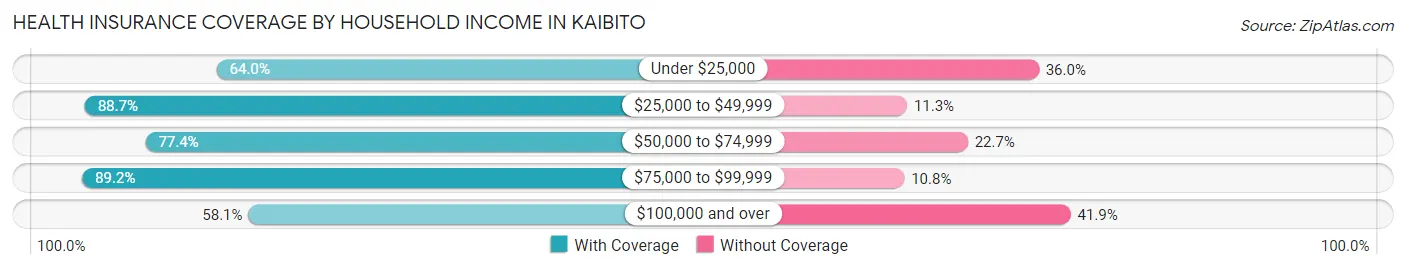
| Household Income | With Coverage | Without Coverage |
| Under $25,000 | 114 (64.0%) | 64 (36.0%) |
| $25,000 to $49,999 | 543 (88.7%) | 69 (11.3%) |
| $50,000 to $74,999 | 263 (77.3%) | 77 (22.7%) |
| $75,000 to $99,999 | 199 (89.2%) | 24 (10.8%) |
| $100,000 and over | 212 (58.1%) | 153 (41.9%) |
Public vs Private Health Insurance Coverage by Age in Kaibito
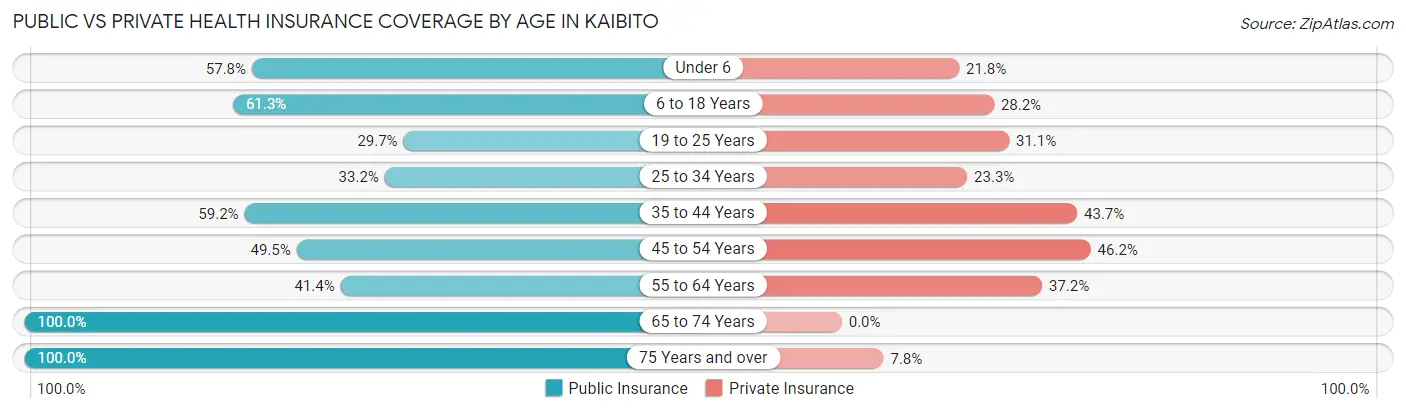
| Age Bracket | Public Insurance | Private Insurance |
| Under 6 | 85 (57.8%) | 32 (21.8%) |
| 6 to 18 Years | 241 (61.3%) | 111 (28.2%) |
| 19 to 25 Years | 65 (29.7%) | 68 (31.0%) |
| 25 to 34 Years | 67 (33.2%) | 47 (23.3%) |
| 35 to 44 Years | 103 (59.2%) | 76 (43.7%) |
| 45 to 54 Years | 104 (49.5%) | 97 (46.2%) |
| 55 to 64 Years | 79 (41.4%) | 71 (37.2%) |
| 65 to 74 Years | 53 (100.0%) | 0 (0.0%) |
| 75 Years and over | 129 (100.0%) | 10 (7.7%) |
| Total | 926 (53.9%) | 512 (29.8%) |
Disability Status by Sex by Age in Kaibito
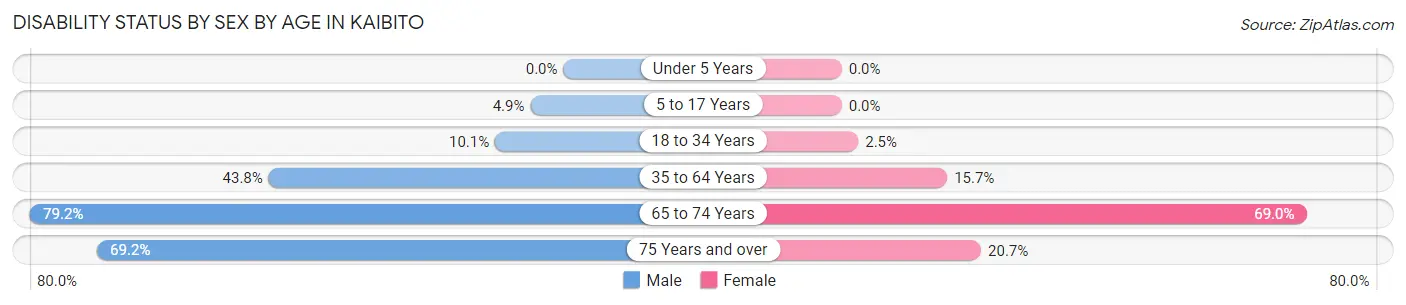
| Age Bracket | Male | Female |
| Under 5 Years | 0 (0.0%) | 0 (0.0%) |
| 5 to 17 Years | 11 (4.9%) | 0 (0.0%) |
| 18 to 34 Years | 22 (10.1%) | 6 (2.5%) |
| 35 to 64 Years | 123 (43.8%) | 46 (15.7%) |
| 65 to 74 Years | 19 (79.2%) | 20 (69.0%) |
| 75 Years and over | 9 (69.2%) | 24 (20.7%) |
Disability Class by Sex by Age in Kaibito
Disability Class: Hearing Difficulty
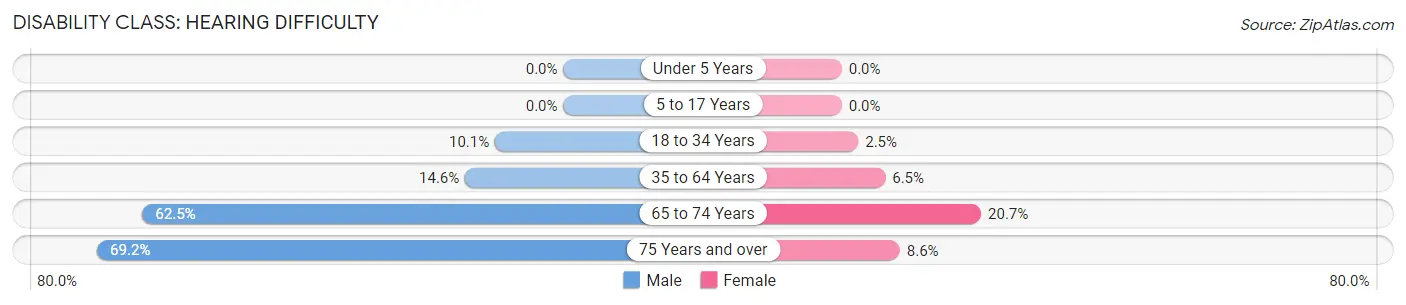
| Age Bracket | Male | Female |
| Under 5 Years | 0 (0.0%) | 0 (0.0%) |
| 5 to 17 Years | 0 (0.0%) | 0 (0.0%) |
| 18 to 34 Years | 22 (10.1%) | 6 (2.5%) |
| 35 to 64 Years | 41 (14.6%) | 19 (6.5%) |
| 65 to 74 Years | 15 (62.5%) | 6 (20.7%) |
| 75 Years and over | 9 (69.2%) | 10 (8.6%) |
Disability Class: Vision Difficulty
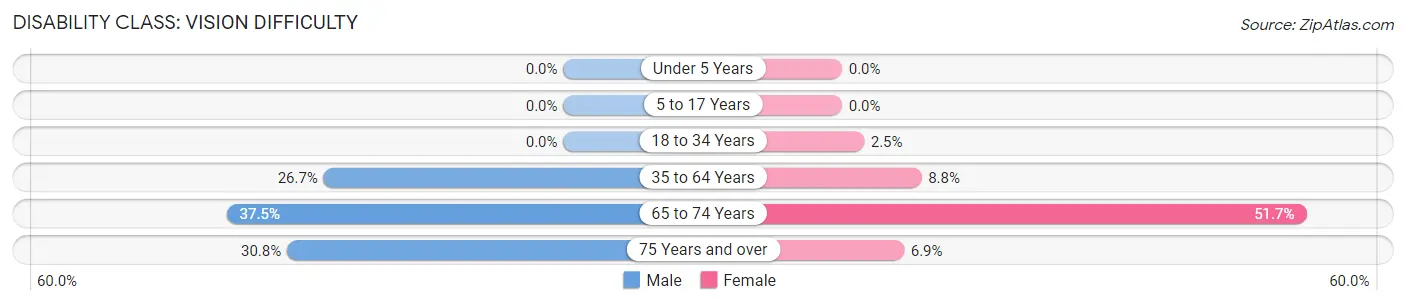
| Age Bracket | Male | Female |
| Under 5 Years | 0 (0.0%) | 0 (0.0%) |
| 5 to 17 Years | 0 (0.0%) | 0 (0.0%) |
| 18 to 34 Years | 0 (0.0%) | 6 (2.5%) |
| 35 to 64 Years | 75 (26.7%) | 26 (8.8%) |
| 65 to 74 Years | 9 (37.5%) | 15 (51.7%) |
| 75 Years and over | 4 (30.8%) | 8 (6.9%) |
Disability Class: Cognitive Difficulty
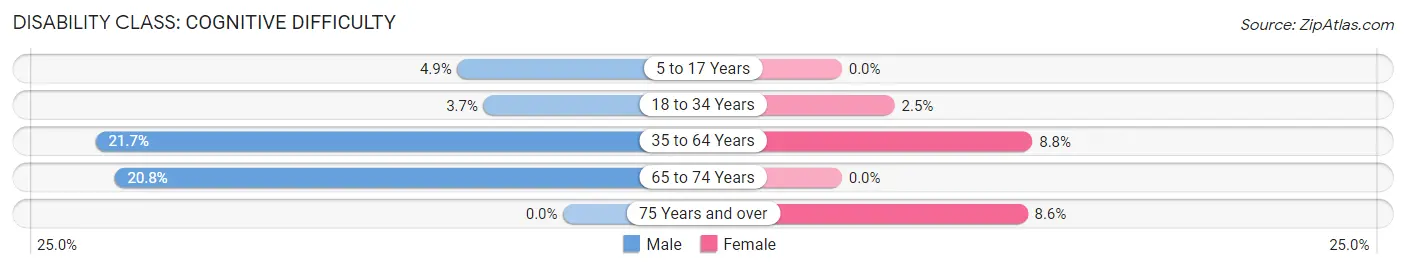
| Age Bracket | Male | Female |
| 5 to 17 Years | 11 (4.9%) | 0 (0.0%) |
| 18 to 34 Years | 8 (3.7%) | 6 (2.5%) |
| 35 to 64 Years | 61 (21.7%) | 26 (8.8%) |
| 65 to 74 Years | 5 (20.8%) | 0 (0.0%) |
| 75 Years and over | 0 (0.0%) | 10 (8.6%) |
Disability Class: Ambulatory Difficulty
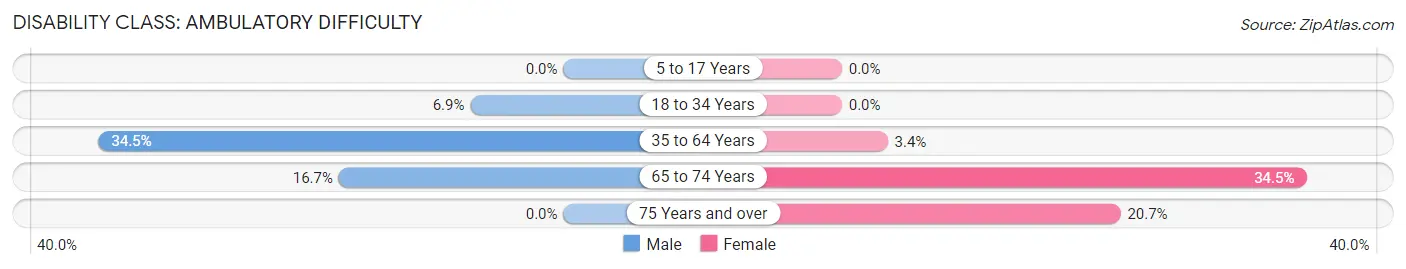
| Age Bracket | Male | Female |
| 5 to 17 Years | 0 (0.0%) | 0 (0.0%) |
| 18 to 34 Years | 15 (6.9%) | 0 (0.0%) |
| 35 to 64 Years | 97 (34.5%) | 10 (3.4%) |
| 65 to 74 Years | 4 (16.7%) | 10 (34.5%) |
| 75 Years and over | 0 (0.0%) | 24 (20.7%) |
Disability Class: Self-Care Difficulty
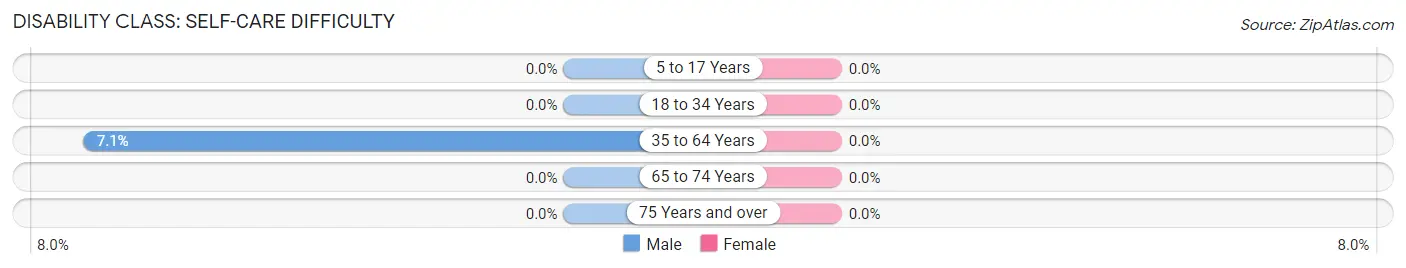
| Age Bracket | Male | Female |
| 5 to 17 Years | 0 (0.0%) | 0 (0.0%) |
| 18 to 34 Years | 0 (0.0%) | 0 (0.0%) |
| 35 to 64 Years | 20 (7.1%) | 0 (0.0%) |
| 65 to 74 Years | 0 (0.0%) | 0 (0.0%) |
| 75 Years and over | 0 (0.0%) | 0 (0.0%) |
Technology Access in Kaibito
Computing Device Access in Kaibito
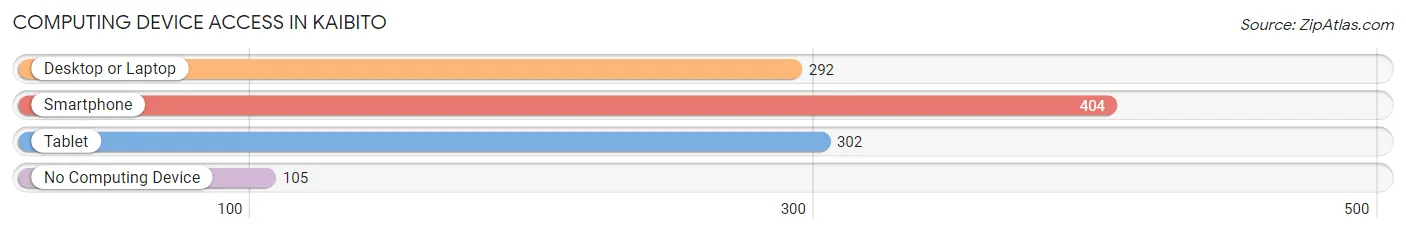
| Device Type | # Households | % Households |
| Desktop or Laptop | 292 | 55.4% |
| Smartphone | 404 | 76.7% |
| Tablet | 302 | 57.3% |
| No Computing Device | 105 | 19.9% |
| Total | 527 | 100.0% |
Internet Access in Kaibito
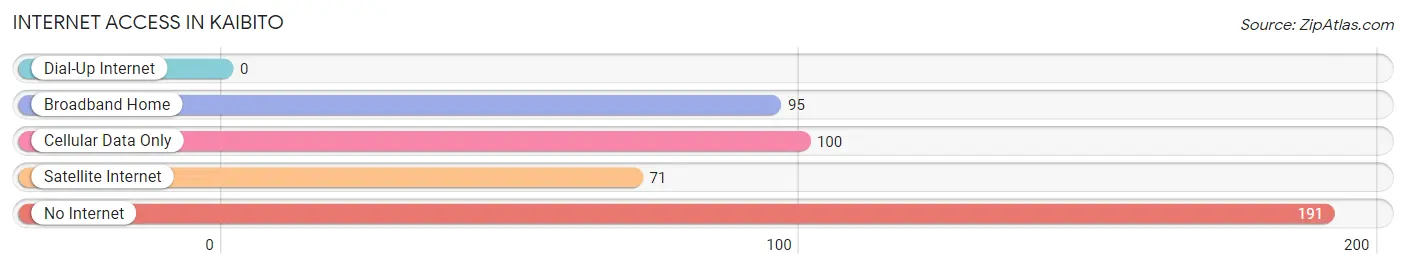
| Internet Type | # Households | % Households |
| Dial-Up Internet | 0 | 0.0% |
| Broadband Home | 95 | 18.0% |
| Cellular Data Only | 100 | 19.0% |
| Satellite Internet | 71 | 13.5% |
| No Internet | 191 | 36.2% |
| Total | 527 | 100.0% |
Kaibito Summary
Kaibito is a small unincorporated community located in Coconino County, Arizona. It is situated in the western part of the state, approximately 20 miles east of the city of Flagstaff. The population of Kaibito was estimated to be around 1,000 people in 2020.
History
The Kaibito area has been inhabited by Native American tribes for centuries. The Hopi, Navajo, and Paiute tribes all have a long history in the area. The Hopi have lived in the area since at least the 13th century, and the Navajo and Paiute have been in the area since the 16th century.
The first European settlers arrived in the area in the late 19th century. The area was originally part of the Navajo Nation, but was ceded to the United States in 1868. The area was then opened up to homesteaders, and the first settlers arrived in the late 1880s.
The town of Kaibito was established in the early 1900s. The town was named after a local Native American chief, Kaibito. The town grew slowly, but steadily, and by the 1950s it had a population of around 500 people.
Geography
Kaibito is located in the western part of Arizona, approximately 20 miles east of Flagstaff. The town is situated in a high desert area, with an elevation of around 5,000 feet. The area is characterized by rolling hills, mesas, and canyons. The climate is semi-arid, with hot summers and cold winters.
The town is located near the Little Colorado River, which is a tributary of the Colorado River. The river provides a source of water for the town and the surrounding area.
Economy
The economy of Kaibito is largely based on agriculture and tourism. The town is home to several farms, which produce a variety of crops, including alfalfa, corn, and hay. The town is also home to several tourist attractions, including the Kaibito Trading Post, which sells Native American crafts and jewelry.
The town is also home to several businesses, including a gas station, a grocery store, and a restaurant. The town is also home to a post office, a library, and a medical clinic.
Demographics
The population of Kaibito was estimated to be around 1,000 people in 2020. The town is predominantly Native American, with the majority of the population being Navajo. The town also has a small Hispanic population, as well as a small population of White Americans.
The median household income in Kaibito is around $30,000, which is lower than the national average. The poverty rate in the town is also higher than the national average, with around 25% of the population living below the poverty line.
Conclusion
Kaibito is a small unincorporated community located in Coconino County, Arizona. The town has a long history of Native American habitation, and was established in the early 1900s. The town is situated in a high desert area, and is home to several farms and tourist attractions. The population of Kaibito is predominantly Native American, with the majority of the population being Navajo. The town has a median household income of around $30,000, and a poverty rate of around 25%.
Common Questions
What is Per Capita Income in Kaibito?
Per Capita income in Kaibito is $19,100.
What is the Median Family Income in Kaibito?
Median Family Income in Kaibito is $57,861.
What is the Median Household income in Kaibito?
Median Household Income in Kaibito is $47,212.
What is Income or Wage Gap in Kaibito?
Income or Wage Gap in Kaibito is 16.1%.
Women in Kaibito earn 83.9 cents for every dollar earned by a man.
What is Inequality or Gini Index in Kaibito?
Inequality or Gini Index in Kaibito is 0.43.
What is the Total Population of Kaibito?
Total Population of Kaibito is 1,718.
What is the Total Male Population of Kaibito?
Total Male Population of Kaibito is 807.
What is the Total Female Population of Kaibito?
Total Female Population of Kaibito is 911.
What is the Ratio of Males per 100 Females in Kaibito?
There are 88.58 Males per 100 Females in Kaibito.
What is the Ratio of Females per 100 Males in Kaibito?
There are 112.89 Females per 100 Males in Kaibito.
What is the Median Population Age in Kaibito?
Median Population Age in Kaibito is 28.4 Years.
What is the Average Family Size in Kaibito
Average Family Size in Kaibito is 3.6 People.
What is the Average Household Size in Kaibito
Average Household Size in Kaibito is 3.3 People.
How Large is the Labor Force in Kaibito?
There are 625 People in the Labor Forcein in Kaibito.
What is the Percentage of People in the Labor Force in Kaibito?
49.6% of People are in the Labor Force in Kaibito.
What is the Unemployment Rate in Kaibito?
Unemployment Rate in Kaibito is 16.0%.