Douglas, AZ Map & Demographics
Douglas Map
Douglas Overview
$17,909
PER CAPITA INCOME
$50,601
AVG FAMILY INCOME
$41,594
AVG HOUSEHOLD INCOME
14.7%
WAGE / INCOME GAP [ % ]
85.3¢/ $1
WAGE / INCOME GAP [ $ ]
$12,663
FAMILY INCOME DEFICIT
0.46
INEQUALITY / GINI INDEX
16,301
TOTAL POPULATION
9,783
MALE POPULATION
6,518
FEMALE POPULATION
150.09
MALES / 100 FEMALES
66.63
FEMALES / 100 MALES
33.9
MEDIAN AGE
3.6
AVG FAMILY SIZE
2.9
AVG HOUSEHOLD SIZE
5,191
LABOR FORCE [ PEOPLE ]
39.8%
PERCENT IN LABOR FORCE
12.0%
UNEMPLOYMENT RATE
Douglas Area Codes
Income in Douglas
Income Overview in Douglas
Per Capita Income in Douglas is $17,909, while median incomes of families and households are $50,601 and $41,594 respectively.
| Characteristic | Number | Measure |
| Per Capita Income | 16,301 | $17,909 |
| Median Family Income | 3,065 | $50,601 |
| Mean Family Income | 3,065 | $63,140 |
| Median Household Income | 4,476 | $41,594 |
| Mean Household Income | 4,476 | $56,355 |
| Income Deficit | 3,065 | $12,663 |
| Wage / Income Gap (%) | 16,301 | 14.69% |
| Wage / Income Gap ($) | 16,301 | 85.31¢ per $1 |
| Gini / Inequality Index | 16,301 | 0.46 |
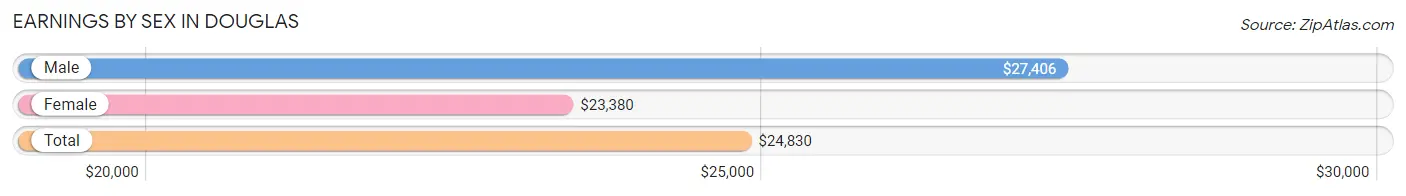
Earnings by Sex in Douglas
Average Earnings in Douglas are $24,830, $27,406 for men and $23,380 for women, a difference of 14.7%.
| Sex | Number | Average Earnings |
| Male | 4,058 (63.2%) | $27,406 |
| Female | 2,364 (36.8%) | $23,380 |
| Total | 6,422 (100.0%) | $24,830 |
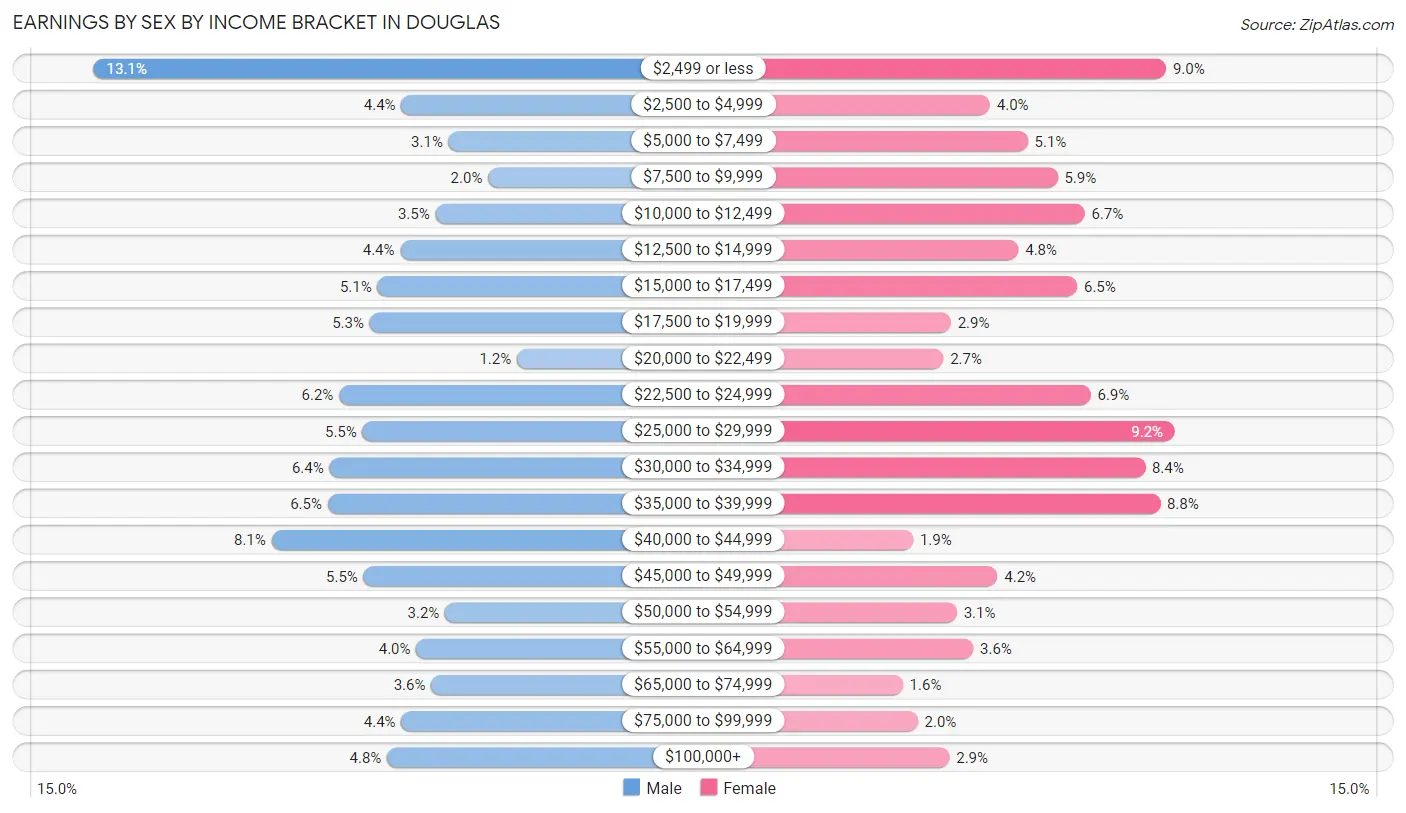
Earnings by Sex by Income Bracket in Douglas
The most common earnings brackets in Douglas are $2,499 or less for men (530 | 13.1%) and $25,000 to $29,999 for women (218 | 9.2%).
| Income | Male | Female |
| $2,499 or less | 530 (13.1%) | 212 (9.0%) |
| $2,500 to $4,999 | 179 (4.4%) | 95 (4.0%) |
| $5,000 to $7,499 | 125 (3.1%) | 120 (5.1%) |
| $7,500 to $9,999 | 80 (2.0%) | 140 (5.9%) |
| $10,000 to $12,499 | 140 (3.5%) | 158 (6.7%) |
| $12,500 to $14,999 | 180 (4.4%) | 114 (4.8%) |
| $15,000 to $17,499 | 206 (5.1%) | 153 (6.5%) |
| $17,500 to $19,999 | 215 (5.3%) | 69 (2.9%) |
| $20,000 to $22,499 | 47 (1.2%) | 64 (2.7%) |
| $22,500 to $24,999 | 250 (6.2%) | 162 (6.9%) |
| $25,000 to $29,999 | 223 (5.5%) | 218 (9.2%) |
| $30,000 to $34,999 | 261 (6.4%) | 198 (8.4%) |
| $35,000 to $39,999 | 263 (6.5%) | 208 (8.8%) |
| $40,000 to $44,999 | 327 (8.1%) | 44 (1.9%) |
| $45,000 to $49,999 | 222 (5.5%) | 100 (4.2%) |
| $50,000 to $54,999 | 129 (3.2%) | 73 (3.1%) |
| $55,000 to $64,999 | 162 (4.0%) | 84 (3.5%) |
| $65,000 to $74,999 | 145 (3.6%) | 37 (1.6%) |
| $75,000 to $99,999 | 179 (4.4%) | 47 (2.0%) |
| $100,000+ | 195 (4.8%) | 68 (2.9%) |
| Total | 4,058 (100.0%) | 2,364 (100.0%) |
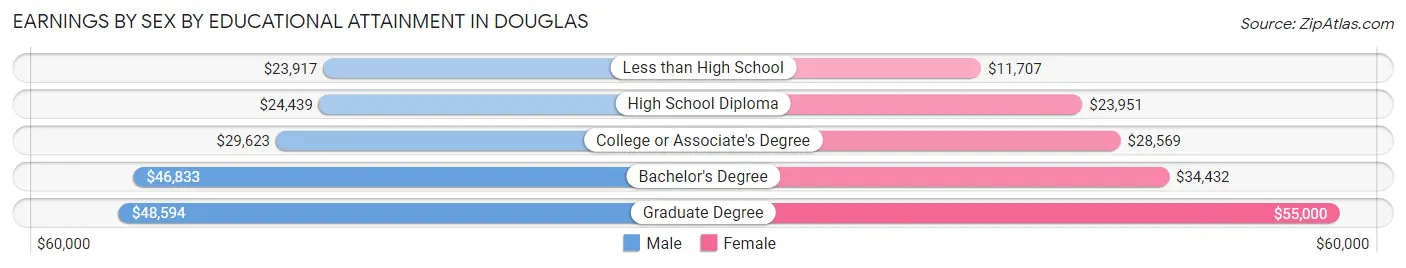
Earnings by Sex by Educational Attainment in Douglas
Average earnings in Douglas are $28,876 for men and $25,050 for women, a difference of 13.3%. Men with an educational attainment of graduate degree enjoy the highest average annual earnings of $48,594, while those with less than high school education earn the least with $23,917. Women with an educational attainment of graduate degree earn the most with the average annual earnings of $55,000, while those with less than high school education have the smallest earnings of $11,707.
| Educational Attainment | Male Income | Female Income |
| Less than High School | $23,917 | $11,707 |
| High School Diploma | $24,439 | $23,951 |
| College or Associate's Degree | $29,623 | $28,569 |
| Bachelor's Degree | $46,833 | $34,432 |
| Graduate Degree | $48,594 | $55,000 |
| Total | $28,876 | $25,050 |
Family Income in Douglas
Family Income Brackets in Douglas
According to the Douglas family income data, there are 607 families falling into the $50,000 to $74,999 income range, which is the most common income bracket and makes up 19.8% of all families. Conversely, the $200,000+ income bracket is the least frequent group with only 74 families (2.4%) belonging to this category.
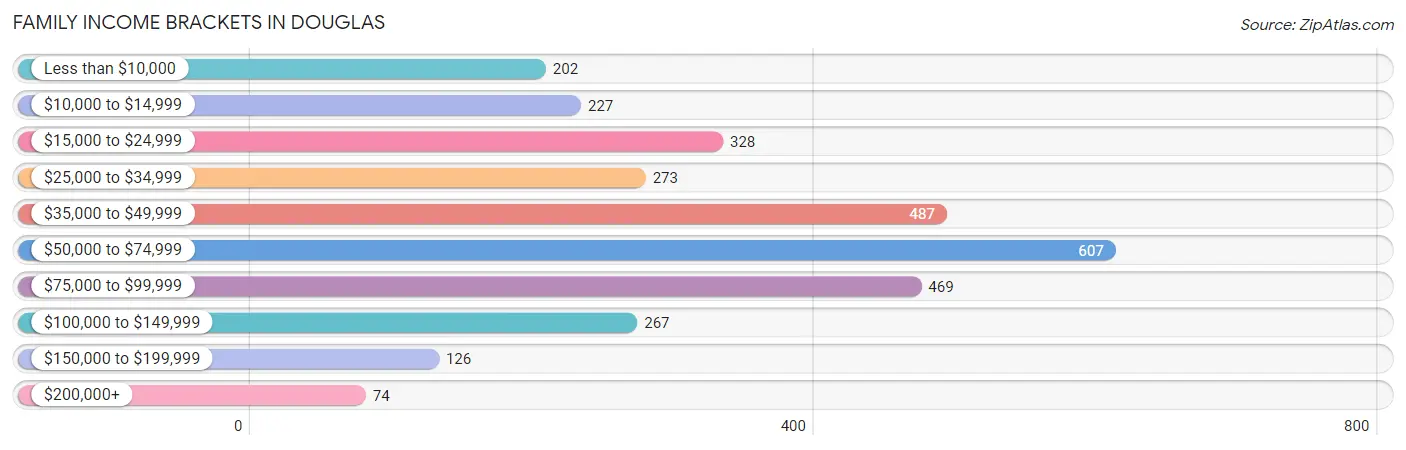
| Income Bracket | # Families | % Families |
| Less than $10,000 | 202 | 6.6% |
| $10,000 to $14,999 | 227 | 7.4% |
| $15,000 to $24,999 | 328 | 10.7% |
| $25,000 to $34,999 | 273 | 8.9% |
| $35,000 to $49,999 | 487 | 15.9% |
| $50,000 to $74,999 | 607 | 19.8% |
| $75,000 to $99,999 | 469 | 15.3% |
| $100,000 to $149,999 | 267 | 8.7% |
| $150,000 to $199,999 | 126 | 4.1% |
| $200,000+ | 74 | 2.4% |
Family Income by Famaliy Size in Douglas
5-person families (149 | 4.9%) account for the highest median family income in Douglas with $79,013 per family, while 2-person families (1,099 | 35.9%) have the highest median income of $28,044 per family member.
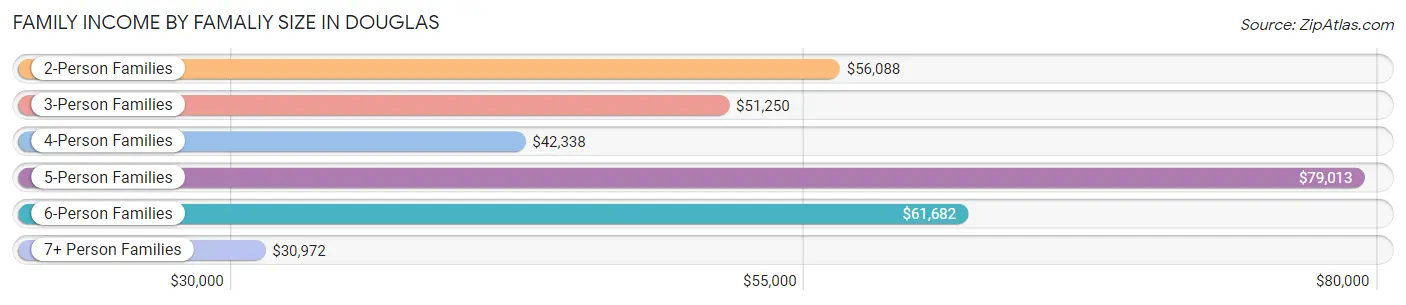
| Income Bracket | # Families | Median Income |
| 2-Person Families | 1,099 (35.9%) | $56,088 |
| 3-Person Families | 674 (22.0%) | $51,250 |
| 4-Person Families | 892 (29.1%) | $42,338 |
| 5-Person Families | 149 (4.9%) | $79,013 |
| 6-Person Families | 142 (4.6%) | $61,682 |
| 7+ Person Families | 109 (3.6%) | $30,972 |
| Total | 3,065 (100.0%) | $50,601 |
Family Income by Number of Earners in Douglas
The median family income in Douglas is $50,601, with families comprising 3+ earners (314) having the highest median family income of $90,000, while families with no earners (731) have the lowest median family income of $26,588, accounting for 10.2% and 23.8% of families, respectively.
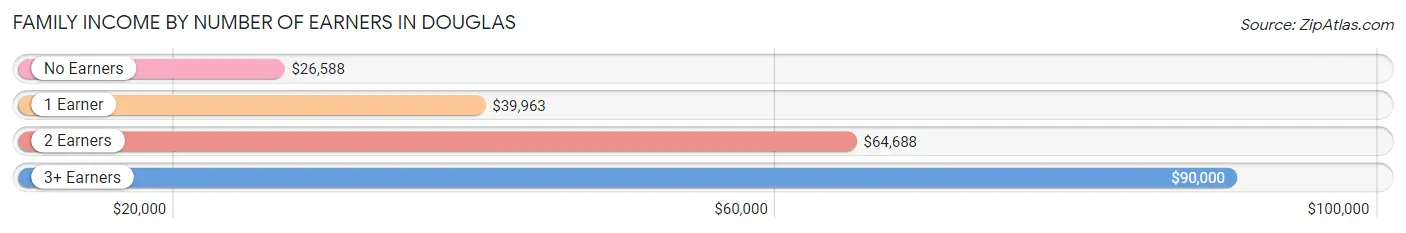
| Number of Earners | # Families | Median Income |
| No Earners | 731 (23.8%) | $26,588 |
| 1 Earner | 1,206 (39.4%) | $39,963 |
| 2 Earners | 814 (26.6%) | $64,688 |
| 3+ Earners | 314 (10.2%) | $90,000 |
| Total | 3,065 (100.0%) | $50,601 |
Household Income in Douglas
Household Income Brackets in Douglas
With 783 households falling in the category, the $50,000 to $74,999 income range is the most frequent in Douglas, accounting for 17.5% of all households. In contrast, only 121 households (2.7%) fall into the $150,000 to $199,999 income bracket, making it the least populous group.
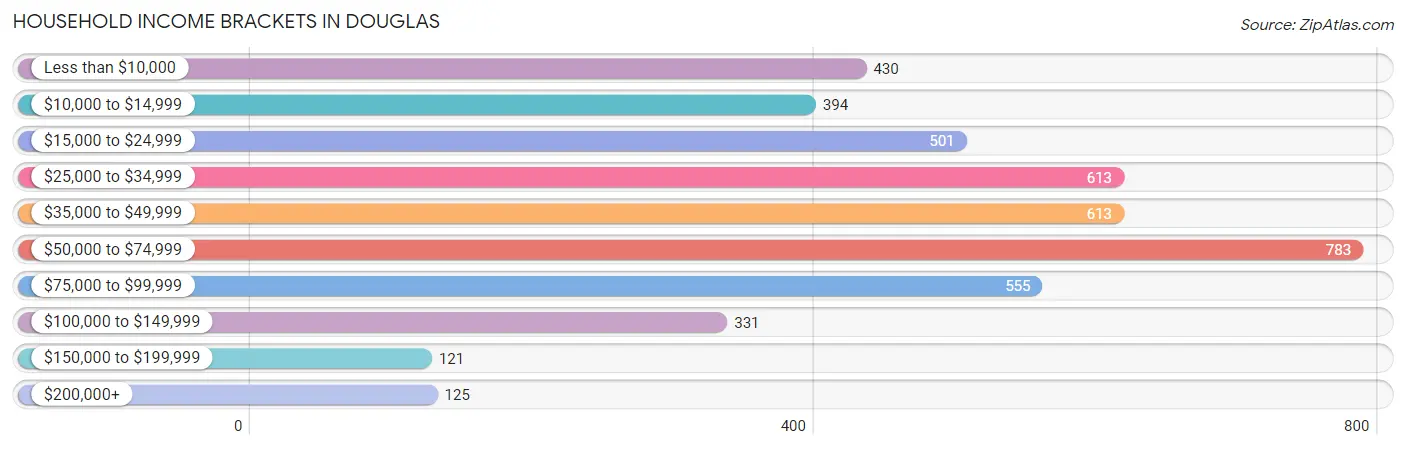
| Income Bracket | # Households | % Households |
| Less than $10,000 | 430 | 9.6% |
| $10,000 to $14,999 | 394 | 8.8% |
| $15,000 to $24,999 | 501 | 11.2% |
| $25,000 to $34,999 | 613 | 13.7% |
| $35,000 to $49,999 | 613 | 13.7% |
| $50,000 to $74,999 | 783 | 17.5% |
| $75,000 to $99,999 | 555 | 12.4% |
| $100,000 to $149,999 | 331 | 7.4% |
| $150,000 to $199,999 | 121 | 2.7% |
| $200,000+ | 125 | 2.8% |
Household Income by Householder Age in Douglas
The median household income in Douglas is $41,594, with the highest median household income of $49,190 found in the 25 to 44 years age bracket for the primary householder. A total of 1,507 households (33.7%) fall into this category. Meanwhile, the 65+ years age bracket for the primary householder has the lowest median household income of $27,301, with 1,385 households (30.9%) in this group.
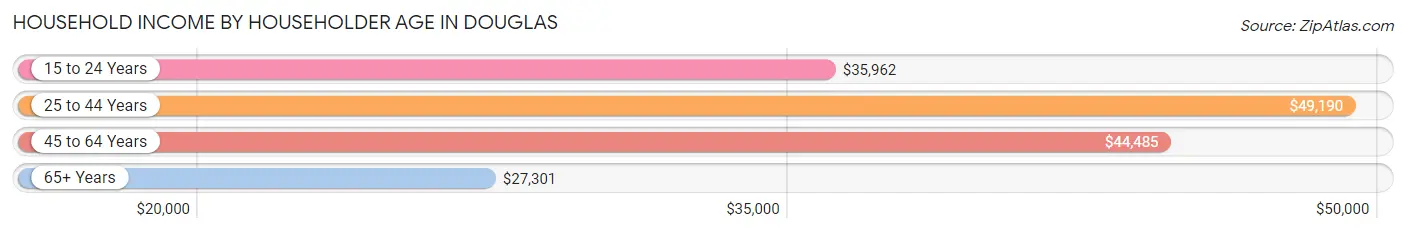
| Income Bracket | # Households | Median Income |
| 15 to 24 Years | 214 (4.8%) | $35,962 |
| 25 to 44 Years | 1,507 (33.7%) | $49,190 |
| 45 to 64 Years | 1,370 (30.6%) | $44,485 |
| 65+ Years | 1,385 (30.9%) | $27,301 |
| Total | 4,476 (100.0%) | $41,594 |
Poverty in Douglas
Income Below Poverty by Sex and Age in Douglas
With 27.2% poverty level for males and 30.9% for females among the residents of Douglas, 5 year old males and 15 year old females are the most vulnerable to poverty, with 33 males (80.5%) and 48 females (57.8%) in their respective age groups living below the poverty level.
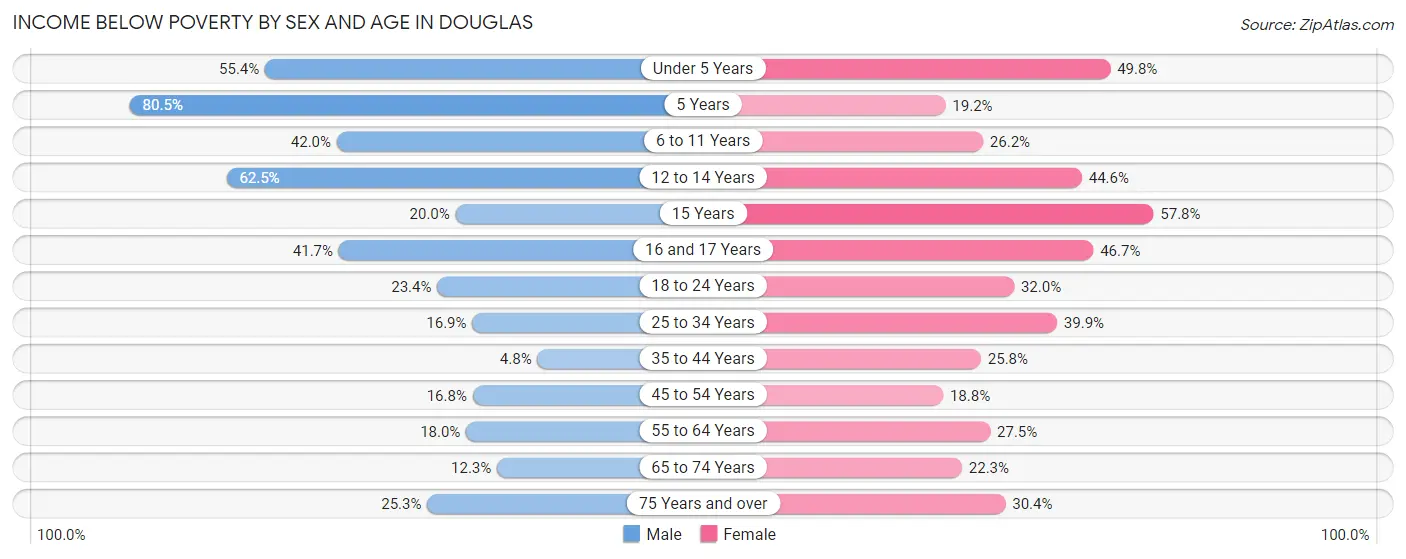
| Age Bracket | Male | Female |
| Under 5 Years | 413 (55.4%) | 274 (49.8%) |
| 5 Years | 33 (80.5%) | 20 (19.2%) |
| 6 to 11 Years | 190 (42.0%) | 154 (26.2%) |
| 12 to 14 Years | 227 (62.5%) | 98 (44.6%) |
| 15 Years | 19 (20.0%) | 48 (57.8%) |
| 16 and 17 Years | 115 (41.7%) | 63 (46.7%) |
| 18 to 24 Years | 227 (23.4%) | 218 (32.0%) |
| 25 to 34 Years | 177 (16.9%) | 325 (39.9%) |
| 35 to 44 Years | 26 (4.8%) | 168 (25.8%) |
| 45 to 54 Years | 72 (16.8%) | 132 (18.8%) |
| 55 to 64 Years | 132 (18.0%) | 207 (27.5%) |
| 65 to 74 Years | 61 (12.3%) | 179 (22.3%) |
| 75 Years and over | 99 (25.3%) | 122 (30.3%) |
| Total | 1,791 (27.2%) | 2,008 (30.9%) |
Income Above Poverty by Sex and Age in Douglas
According to the poverty statistics in Douglas, males aged 35 to 44 years and females aged 45 to 54 years are the age groups that are most secure financially, with 95.2% of males and 81.2% of females in these age groups living above the poverty line.
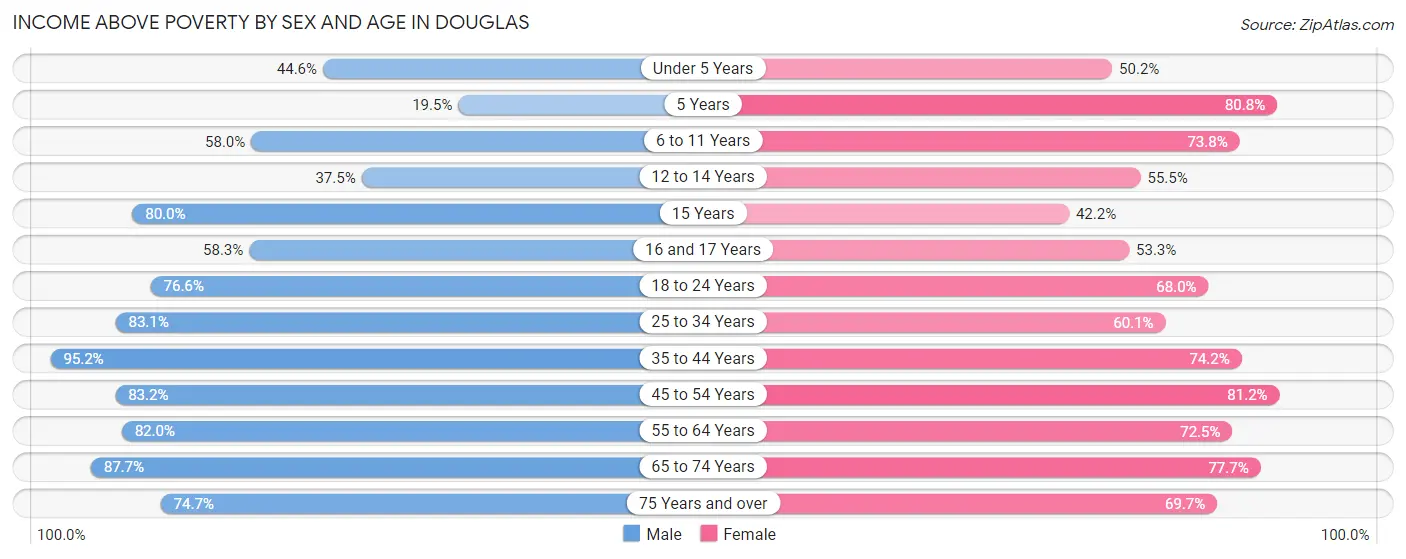
| Age Bracket | Male | Female |
| Under 5 Years | 333 (44.6%) | 276 (50.2%) |
| 5 Years | 8 (19.5%) | 84 (80.8%) |
| 6 to 11 Years | 262 (58.0%) | 434 (73.8%) |
| 12 to 14 Years | 136 (37.5%) | 122 (55.4%) |
| 15 Years | 76 (80.0%) | 35 (42.2%) |
| 16 and 17 Years | 161 (58.3%) | 72 (53.3%) |
| 18 to 24 Years | 743 (76.6%) | 464 (68.0%) |
| 25 to 34 Years | 871 (83.1%) | 489 (60.1%) |
| 35 to 44 Years | 516 (95.2%) | 483 (74.2%) |
| 45 to 54 Years | 356 (83.2%) | 571 (81.2%) |
| 55 to 64 Years | 600 (82.0%) | 545 (72.5%) |
| 65 to 74 Years | 435 (87.7%) | 624 (77.7%) |
| 75 Years and over | 293 (74.7%) | 280 (69.7%) |
| Total | 4,790 (72.8%) | 4,479 (69.1%) |
Income Below Poverty Among Married-Couple Families in Douglas
The poverty statistics for married-couple families in Douglas show that 13.5% or 239 of the total 1,769 families live below the poverty line. Families with 1 or 2 children have the highest poverty rate of 22.4%, comprising of 140 families. On the other hand, families with 3 or 4 children have the lowest poverty rate of 8.4%, which includes 13 families.
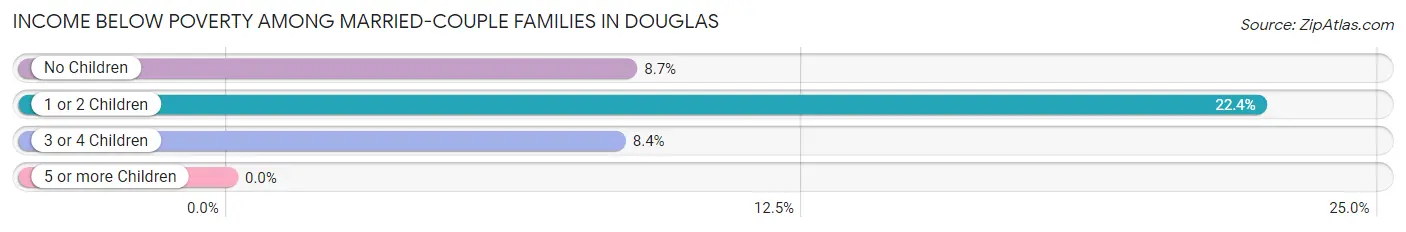
| Children | Above Poverty | Below Poverty |
| No Children | 904 (91.3%) | 86 (8.7%) |
| 1 or 2 Children | 485 (77.6%) | 140 (22.4%) |
| 3 or 4 Children | 141 (91.6%) | 13 (8.4%) |
| 5 or more Children | 0 (0.0%) | 0 (0.0%) |
| Total | 1,530 (86.5%) | 239 (13.5%) |
Income Below Poverty Among Single-Parent Households in Douglas
According to the poverty data in Douglas, 27.9% or 108 single-father households and 44.9% or 408 single-mother households are living below the poverty line. Among single-father households, those with 3 or 4 children have the highest poverty rate, with 22 households (100.0%) experiencing poverty. Likewise, among single-mother households, those with 5 or more children have the highest poverty rate, with 13 households (100.0%) falling below the poverty line.
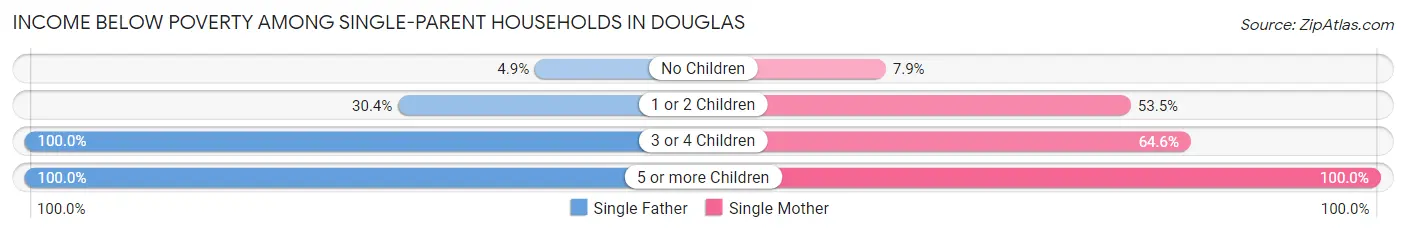
| Children | Single Father | Single Mother |
| No Children | 7 (4.9%) | 18 (7.9%) |
| 1 or 2 Children | 63 (30.4%) | 260 (53.5%) |
| 3 or 4 Children | 22 (100.0%) | 117 (64.6%) |
| 5 or more Children | 16 (100.0%) | 13 (100.0%) |
| Total | 108 (27.9%) | 408 (44.9%) |
Income Below Poverty Among Married-Couple vs Single-Parent Households in Douglas
The poverty data for Douglas shows that 239 of the married-couple family households (13.5%) and 516 of the single-parent households (39.8%) are living below the poverty level. Within the married-couple family households, those with 1 or 2 children have the highest poverty rate, with 140 households (22.4%) falling below the poverty line. Among the single-parent households, those with 5 or more children have the highest poverty rate, with 29 household (100.0%) living below poverty.
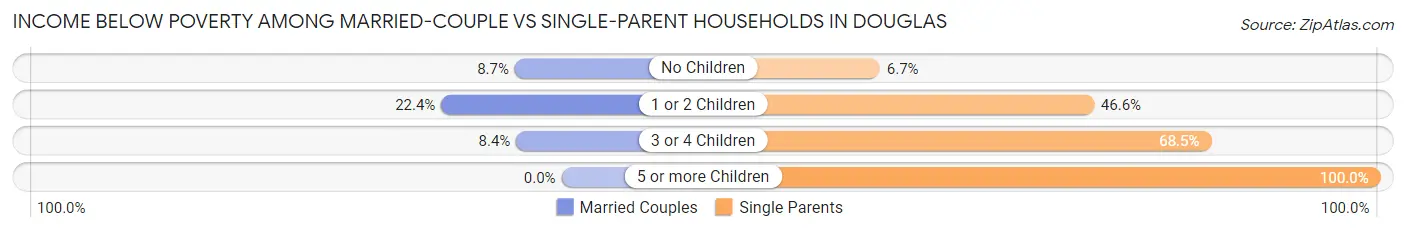
| Children | Married-Couple Families | Single-Parent Households |
| No Children | 86 (8.7%) | 25 (6.7%) |
| 1 or 2 Children | 140 (22.4%) | 323 (46.6%) |
| 3 or 4 Children | 13 (8.4%) | 139 (68.5%) |
| 5 or more Children | 0 (0.0%) | 29 (100.0%) |
| Total | 239 (13.5%) | 516 (39.8%) |
Race in Douglas
The most populous races in Douglas are Hispanic or Latino (13,791 | 84.6%), White / Caucasian (8,172 | 50.1%), and Two or more Races (5,441 | 33.4%).
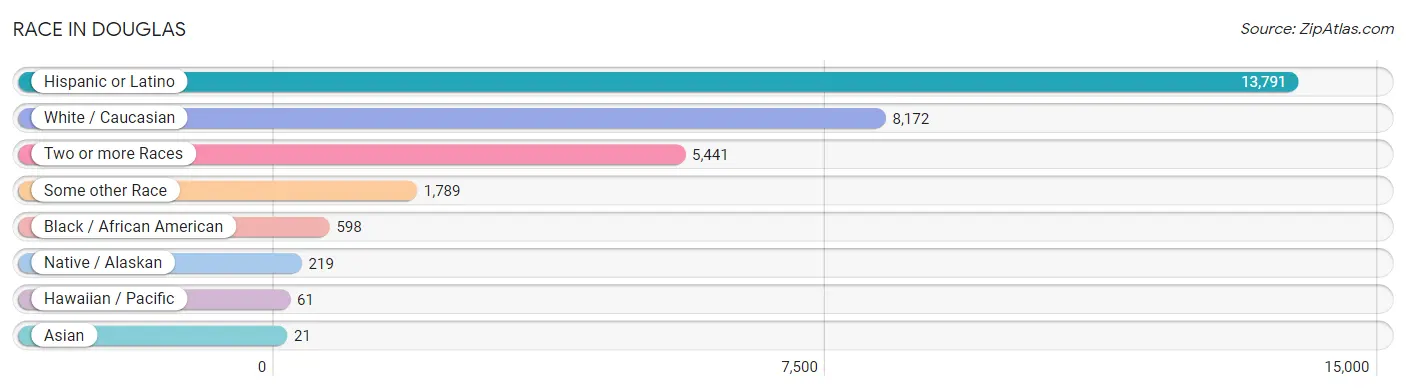
| Race | # Population | % Population |
| Asian | 21 | 0.1% |
| Black / African American | 598 | 3.7% |
| Hawaiian / Pacific | 61 | 0.4% |
| Hispanic or Latino | 13,791 | 84.6% |
| Native / Alaskan | 219 | 1.3% |
| White / Caucasian | 8,172 | 50.1% |
| Two or more Races | 5,441 | 33.4% |
| Some other Race | 1,789 | 11.0% |
| Total | 16,301 | 100.0% |
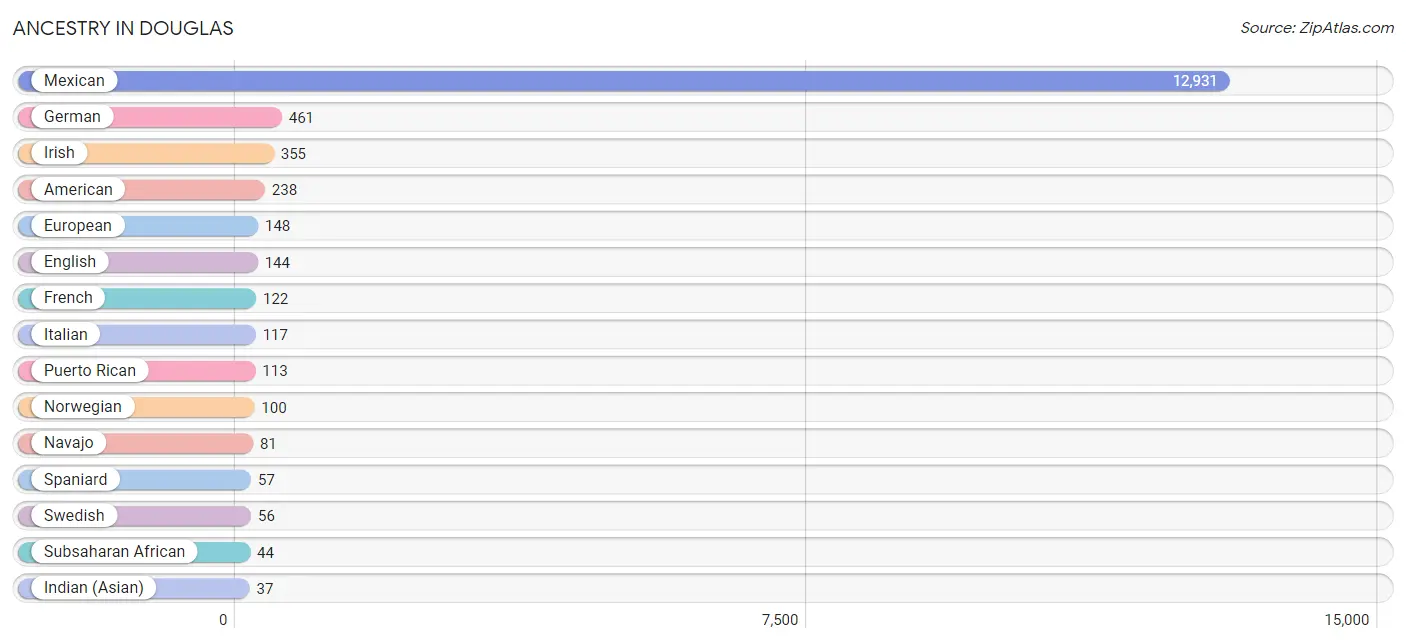
Ancestry in Douglas
The most populous ancestries reported in Douglas are Mexican (12,931 | 79.3%), German (461 | 2.8%), Irish (355 | 2.2%), American (238 | 1.5%), and European (148 | 0.9%), together accounting for 86.7% of all Douglas residents.
| Ancestry | # Population | % Population |
| African | 34 | 0.2% |
| American | 238 | 1.5% |
| Apache | 27 | 0.2% |
| Arab | 10 | 0.1% |
| Armenian | 2 | 0.0% |
| Austrian | 23 | 0.1% |
| British | 17 | 0.1% |
| Canadian | 8 | 0.1% |
| Central American | 28 | 0.2% |
| Croatian | 10 | 0.1% |
| Cuban | 25 | 0.2% |
| Czech | 10 | 0.1% |
| Danish | 11 | 0.1% |
| Dominican | 26 | 0.2% |
| Dutch | 23 | 0.1% |
| Eastern European | 24 | 0.2% |
| English | 144 | 0.9% |
| Ethiopian | 10 | 0.1% |
| European | 148 | 0.9% |
| French | 122 | 0.7% |
| French Canadian | 2 | 0.0% |
| German | 461 | 2.8% |
| Greek | 6 | 0.0% |
| Guamanian / Chamorro | 20 | 0.1% |
| Honduran | 28 | 0.2% |
| Hungarian | 14 | 0.1% |
| Indian (Asian) | 37 | 0.2% |
| Irish | 355 | 2.2% |
| Italian | 117 | 0.7% |
| Jamaican | 7 | 0.0% |
| Korean | 7 | 0.0% |
| Lithuanian | 14 | 0.1% |
| Mexican | 12,931 | 79.3% |
| Mexican American Indian | 21 | 0.1% |
| Navajo | 81 | 0.5% |
| Northern European | 7 | 0.0% |
| Norwegian | 100 | 0.6% |
| Pima | 20 | 0.1% |
| Polish | 30 | 0.2% |
| Pueblo | 6 | 0.0% |
| Puerto Rican | 113 | 0.7% |
| Russian | 23 | 0.1% |
| Scandinavian | 10 | 0.1% |
| Scottish | 18 | 0.1% |
| Spaniard | 57 | 0.4% |
| Spanish | 6 | 0.0% |
| Subsaharan African | 44 | 0.3% |
| Swedish | 56 | 0.3% |
| Swiss | 5 | 0.0% |
| Syrian | 10 | 0.1% |
| Thai | 21 | 0.1% |
| Tohono O'Odham | 6 | 0.0% |
| Ukrainian | 15 | 0.1% |
| Welsh | 10 | 0.1% | View All 54 Rows |
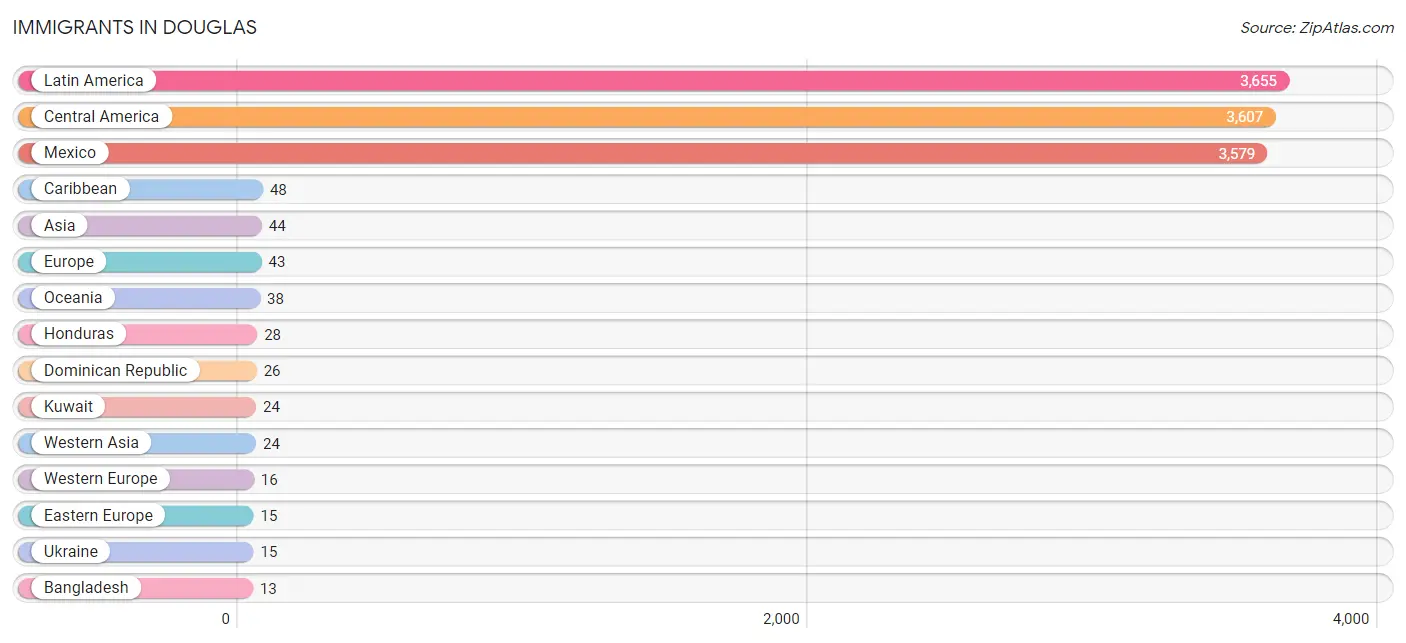
Immigrants in Douglas
The most numerous immigrant groups reported in Douglas came from Latin America (3,655 | 22.4%), Central America (3,607 | 22.1%), Mexico (3,579 | 22.0%), Caribbean (48 | 0.3%), and Asia (44 | 0.3%), together accounting for 67.1% of all Douglas residents.
| Immigration Origin | # Population | % Population |
| Africa | 3 | 0.0% |
| Asia | 44 | 0.3% |
| Australia | 7 | 0.0% |
| Bangladesh | 13 | 0.1% |
| Belgium | 8 | 0.1% |
| Caribbean | 48 | 0.3% |
| Central America | 3,607 | 22.1% |
| Cuba | 13 | 0.1% |
| Dominican Republic | 26 | 0.2% |
| Eastern Africa | 3 | 0.0% |
| Eastern Europe | 15 | 0.1% |
| England | 12 | 0.1% |
| Ethiopia | 3 | 0.0% |
| Europe | 43 | 0.3% |
| Germany | 8 | 0.1% |
| Honduras | 28 | 0.2% |
| Jamaica | 9 | 0.1% |
| Kuwait | 24 | 0.2% |
| Latin America | 3,655 | 22.4% |
| Mexico | 3,579 | 22.0% |
| Northern Europe | 12 | 0.1% |
| Oceania | 38 | 0.2% |
| Philippines | 7 | 0.0% |
| South Central Asia | 13 | 0.1% |
| South Eastern Asia | 7 | 0.0% |
| Ukraine | 15 | 0.1% |
| Western Asia | 24 | 0.2% |
| Western Europe | 16 | 0.1% | View All 28 Rows |
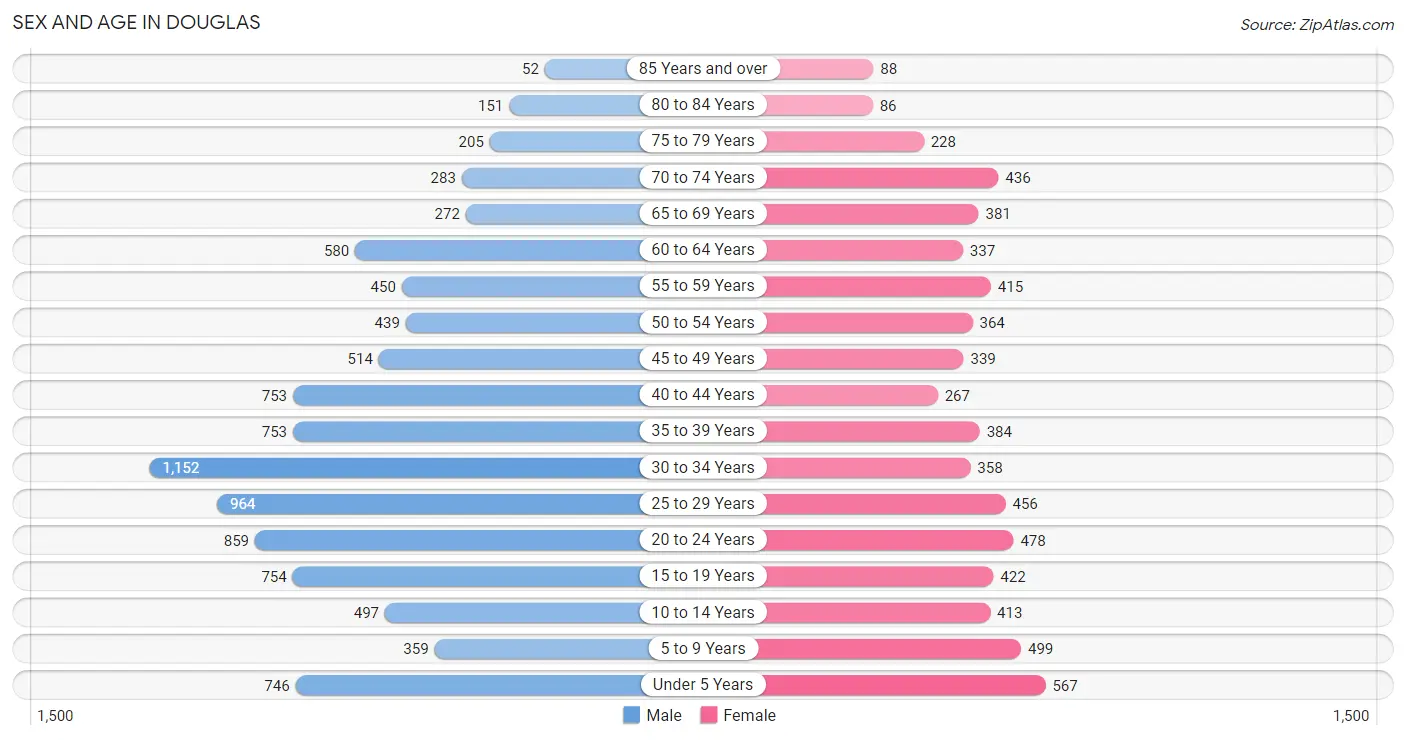
Sex and Age in Douglas
Sex and Age in Douglas
The most populous age groups in Douglas are 30 to 34 Years (1,152 | 11.8%) for men and Under 5 Years (567 | 8.7%) for women.
| Age Bracket | Male | Female |
| Under 5 Years | 746 (7.6%) | 567 (8.7%) |
| 5 to 9 Years | 359 (3.7%) | 499 (7.7%) |
| 10 to 14 Years | 497 (5.1%) | 413 (6.3%) |
| 15 to 19 Years | 754 (7.7%) | 422 (6.5%) |
| 20 to 24 Years | 859 (8.8%) | 478 (7.3%) |
| 25 to 29 Years | 964 (9.9%) | 456 (7.0%) |
| 30 to 34 Years | 1,152 (11.8%) | 358 (5.5%) |
| 35 to 39 Years | 753 (7.7%) | 384 (5.9%) |
| 40 to 44 Years | 753 (7.7%) | 267 (4.1%) |
| 45 to 49 Years | 514 (5.2%) | 339 (5.2%) |
| 50 to 54 Years | 439 (4.5%) | 364 (5.6%) |
| 55 to 59 Years | 450 (4.6%) | 415 (6.4%) |
| 60 to 64 Years | 580 (5.9%) | 337 (5.2%) |
| 65 to 69 Years | 272 (2.8%) | 381 (5.9%) |
| 70 to 74 Years | 283 (2.9%) | 436 (6.7%) |
| 75 to 79 Years | 205 (2.1%) | 228 (3.5%) |
| 80 to 84 Years | 151 (1.5%) | 86 (1.3%) |
| 85 Years and over | 52 (0.5%) | 88 (1.3%) |
| Total | 9,783 (100.0%) | 6,518 (100.0%) |
Families and Households in Douglas
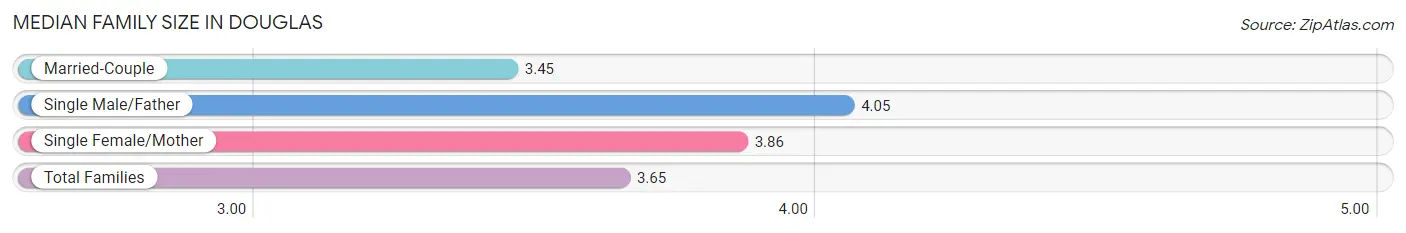
Median Family Size in Douglas
The median family size in Douglas is 3.65 persons per family, with single male/father families (387 | 12.6%) accounting for the largest median family size of 4.05 persons per family. On the other hand, married-couple families (1,769 | 57.7%) represent the smallest median family size with 3.45 persons per family.
| Family Type | # Families | Family Size |
| Married-Couple | 1,769 (57.7%) | 3.45 |
| Single Male/Father | 387 (12.6%) | 4.05 |
| Single Female/Mother | 909 (29.7%) | 3.86 |
| Total Families | 3,065 (100.0%) | 3.65 |
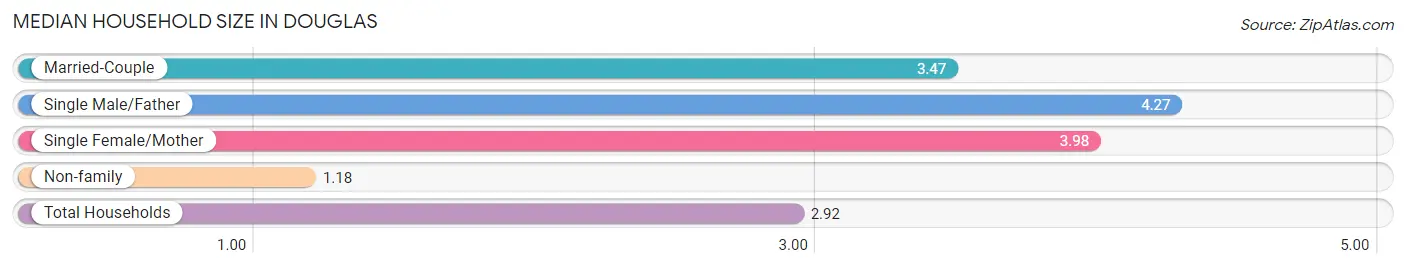
Median Household Size in Douglas
The median household size in Douglas is 2.92 persons per household, with single male/father households (387 | 8.6%) accounting for the largest median household size of 4.27 persons per household. non-family households (1,411 | 31.5%) represent the smallest median household size with 1.18 persons per household.
| Household Type | # Households | Household Size |
| Married-Couple | 1,769 (39.5%) | 3.47 |
| Single Male/Father | 387 (8.6%) | 4.27 |
| Single Female/Mother | 909 (20.3%) | 3.98 |
| Non-family | 1,411 (31.5%) | 1.18 |
| Total Households | 4,476 (100.0%) | 2.92 |
Household Size by Marriage Status in Douglas
Out of a total of 4,476 households in Douglas, 3,065 (68.5%) are family households, while 1,411 (31.5%) are nonfamily households. The most numerous type of family households are 2-person households, comprising 1,030, and the most common type of nonfamily households are 1-person households, comprising 1,275.
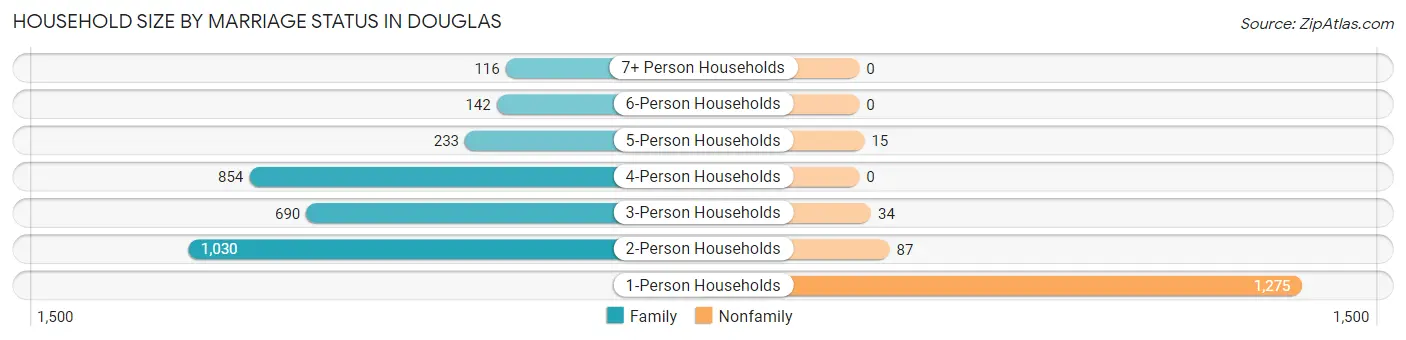
| Household Size | Family Households | Nonfamily Households |
| 1-Person Households | - | 1,275 (28.5%) |
| 2-Person Households | 1,030 (23.0%) | 87 (1.9%) |
| 3-Person Households | 690 (15.4%) | 34 (0.8%) |
| 4-Person Households | 854 (19.1%) | 0 (0.0%) |
| 5-Person Households | 233 (5.2%) | 15 (0.3%) |
| 6-Person Households | 142 (3.2%) | 0 (0.0%) |
| 7+ Person Households | 116 (2.6%) | 0 (0.0%) |
| Total | 3,065 (68.5%) | 1,411 (31.5%) |
Female Fertility in Douglas
Fertility by Age in Douglas
Average fertility rate in Douglas is 67.0 births per 1,000 women. Women in the age bracket of 20 to 34 years have the highest fertility rate with 103.0 births per 1,000 women. Women in the age bracket of 20 to 34 years acount for 72.3% of all women with births.
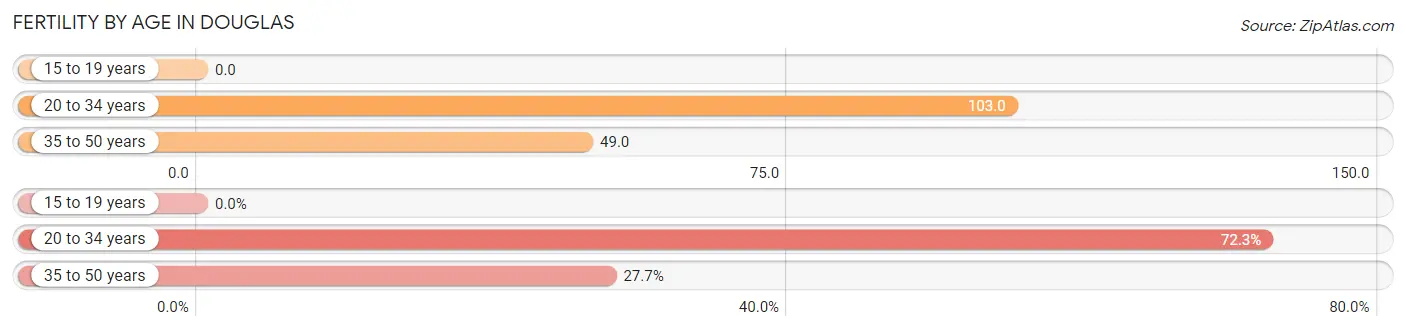
| Age Bracket | Women with Births | Births / 1,000 Women |
| 15 to 19 years | 0 (0.0%) | 0.0 |
| 20 to 34 years | 133 (72.3%) | 103.0 |
| 35 to 50 years | 51 (27.7%) | 49.0 |
| Total | 184 (100.0%) | 67.0 |
Fertility by Age by Marriage Status in Douglas
47.8% of women with births (184) in Douglas are married. The highest percentage of unmarried women with births falls into 35 to 50 years age bracket with 86.3% of them unmarried at the time of birth, while the lowest percentage of unmarried women with births belong to 20 to 34 years age bracket with 39.1% of them unmarried.
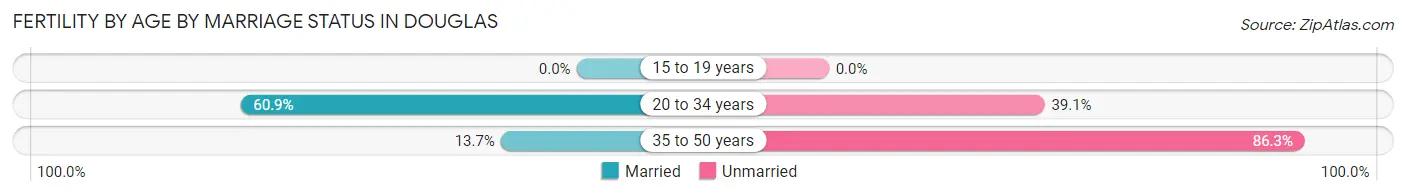
| Age Bracket | Married | Unmarried |
| 15 to 19 years | 0 (0.0%) | 0 (0.0%) |
| 20 to 34 years | 81 (60.9%) | 52 (39.1%) |
| 35 to 50 years | 7 (13.7%) | 44 (86.3%) |
| Total | 88 (47.8%) | 96 (52.2%) |
Fertility by Education in Douglas
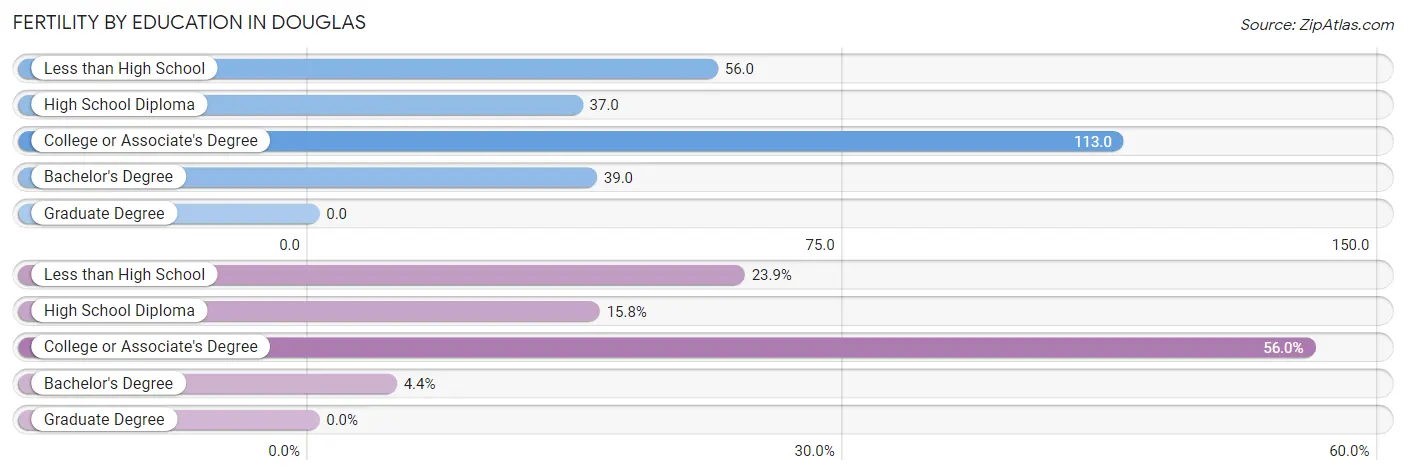
| Educational Attainment | Women with Births | Births / 1,000 Women |
| Less than High School | 44 (23.9%) | 56.0 |
| High School Diploma | 29 (15.8%) | 37.0 |
| College or Associate's Degree | 103 (56.0%) | 113.0 |
| Bachelor's Degree | 8 (4.3%) | 39.0 |
| Graduate Degree | 0 (0.0%) | 0.0 |
| Total | 184 (100.0%) | 67.0 |
Fertility by Education by Marriage Status in Douglas
52.2% of women with births in Douglas are unmarried. Women with the educational attainment of less than high school are most likely to be married with 100.0% of them married at childbirth, while women with the educational attainment of bachelor's degree are least likely to be married with 100.0% of them unmarried at childbirth.
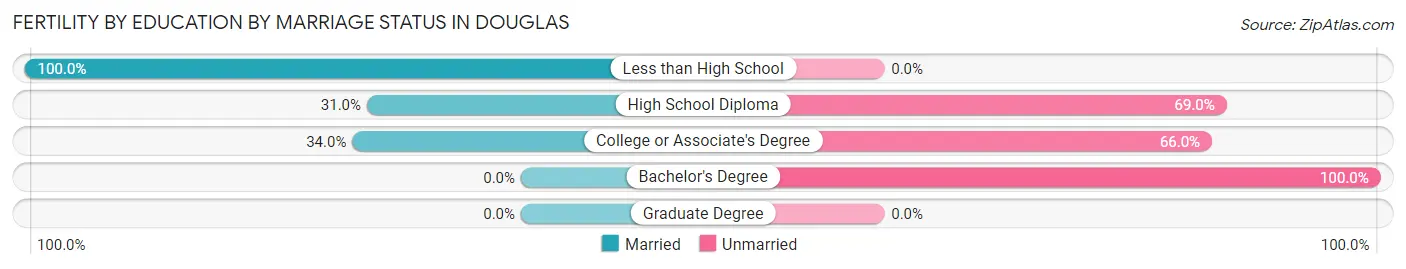
| Educational Attainment | Married | Unmarried |
| Less than High School | 44 (100.0%) | 0 (0.0%) |
| High School Diploma | 9 (31.0%) | 20 (69.0%) |
| College or Associate's Degree | 35 (34.0%) | 68 (66.0%) |
| Bachelor's Degree | 0 (0.0%) | 8 (100.0%) |
| Graduate Degree | 0 (0.0%) | 0 (0.0%) |
| Total | 88 (47.8%) | 96 (52.2%) |
Employment Characteristics in Douglas
Employment by Class of Employer in Douglas
Among the 4,212 employed individuals in Douglas, private company employees (2,190 | 52.0%), self-employed (not incorporated) (572 | 13.6%), and state government employees (503 | 11.9%) make up the most common classes of employment.
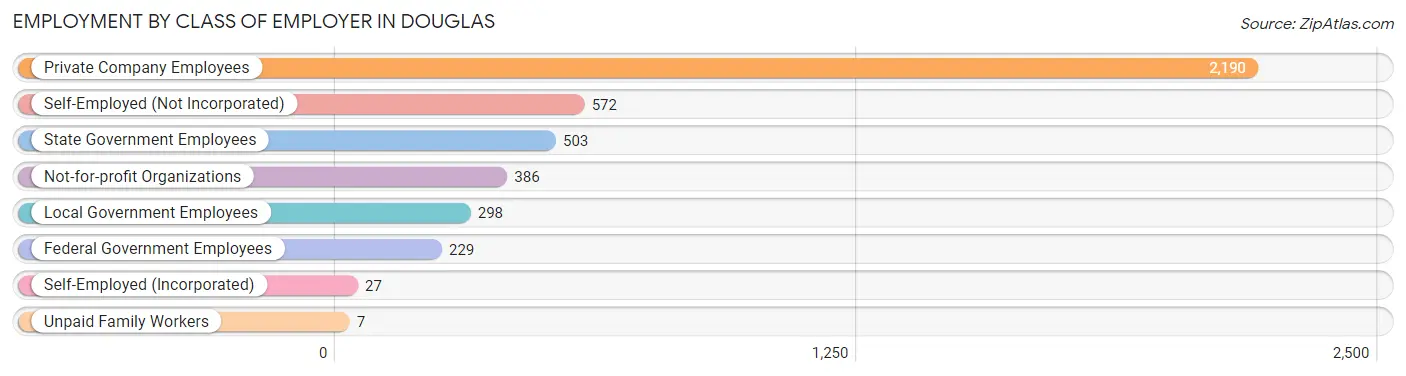
| Employer Class | # Employees | % Employees |
| Private Company Employees | 2,190 | 52.0% |
| Self-Employed (Incorporated) | 27 | 0.6% |
| Self-Employed (Not Incorporated) | 572 | 13.6% |
| Not-for-profit Organizations | 386 | 9.2% |
| Local Government Employees | 298 | 7.1% |
| State Government Employees | 503 | 11.9% |
| Federal Government Employees | 229 | 5.4% |
| Unpaid Family Workers | 7 | 0.2% |
| Total | 4,212 | 100.0% |
Employment Status by Age in Douglas
According to the labor force statistics for Douglas, out of the total population over 16 years of age (13,042), 39.8% or 5,191 individuals are in the labor force, with 12.0% or 623 of them unemployed. The age group with the highest labor force participation rate is 25 to 29 years, with 57.3% or 814 individuals in the labor force. Within the labor force, the 16 to 19 years age range has the highest percentage of unemployed individuals, with 30.0% or 117 of them being unemployed.
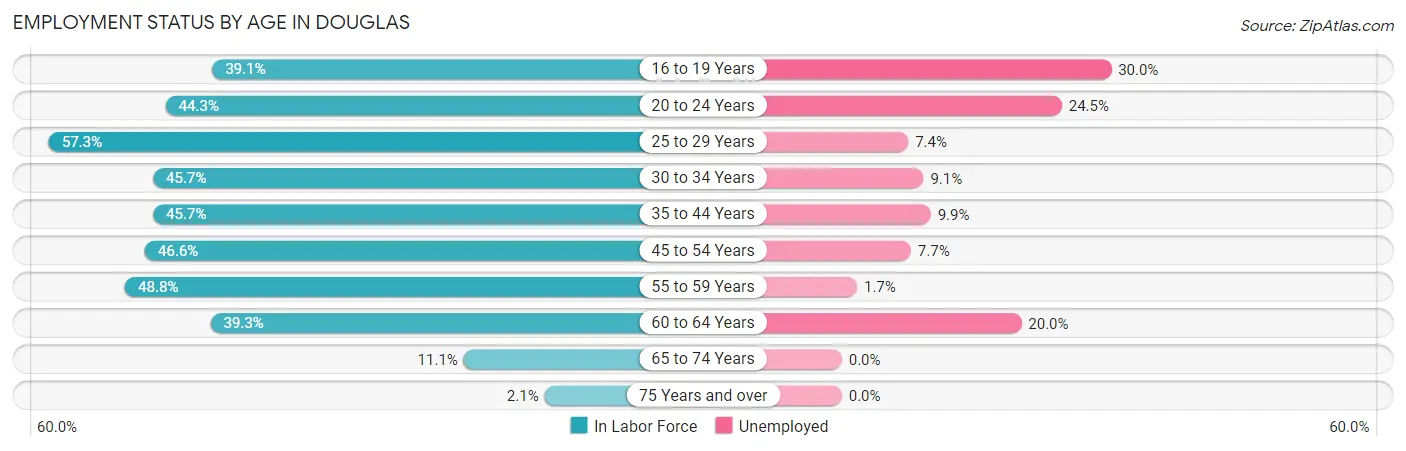
| Age Bracket | In Labor Force | Unemployed |
| 16 to 19 Years | 390 (39.1%) | 117 (30.0%) |
| 20 to 24 Years | 592 (44.3%) | 145 (24.5%) |
| 25 to 29 Years | 814 (57.3%) | 60 (7.4%) |
| 30 to 34 Years | 690 (45.7%) | 63 (9.1%) |
| 35 to 44 Years | 986 (45.7%) | 98 (9.9%) |
| 45 to 54 Years | 772 (46.6%) | 59 (7.7%) |
| 55 to 59 Years | 422 (48.8%) | 7 (1.7%) |
| 60 to 64 Years | 360 (39.3%) | 72 (20.0%) |
| 65 to 74 Years | 152 (11.1%) | 0 (0.0%) |
| 75 Years and over | 17 (2.1%) | 0 (0.0%) |
| Total | 5,191 (39.8%) | 623 (12.0%) |
Employment Status by Educational Attainment in Douglas
According to labor force statistics for Douglas, 47.4% of individuals (4,041) out of the total population between 25 and 64 years of age (8,525) are in the labor force, with 8.9% or 360 of them being unemployed. The group with the highest labor force participation rate are those with the educational attainment of bachelor's degree or higher, with 81.8% or 680 individuals in the labor force. Within the labor force, individuals with less than high school education have the highest percentage of unemployment, with 21.4% or 137 of them being unemployed.
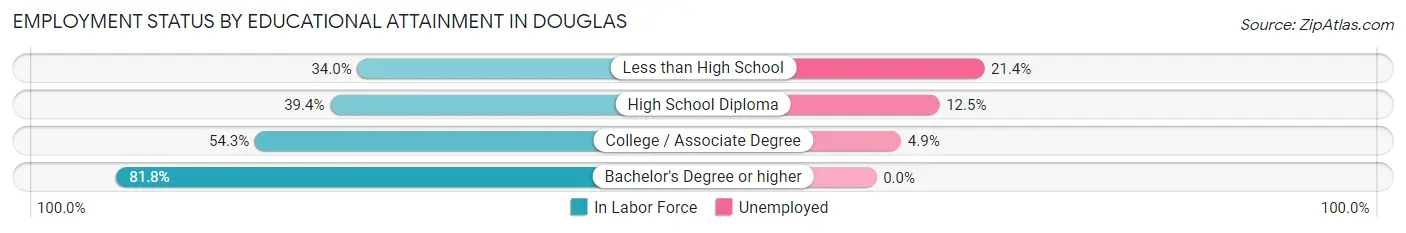
| Educational Attainment | In Labor Force | Unemployed |
| Less than High School | 639 (34.0%) | 402 (21.4%) |
| High School Diploma | 1,156 (39.4%) | 367 (12.5%) |
| College / Associate Degree | 1,564 (54.3%) | 141 (4.9%) |
| Bachelor's Degree or higher | 680 (81.8%) | 0 (0.0%) |
| Total | 4,041 (47.4%) | 759 (8.9%) |
Employment Occupations by Sex in Douglas
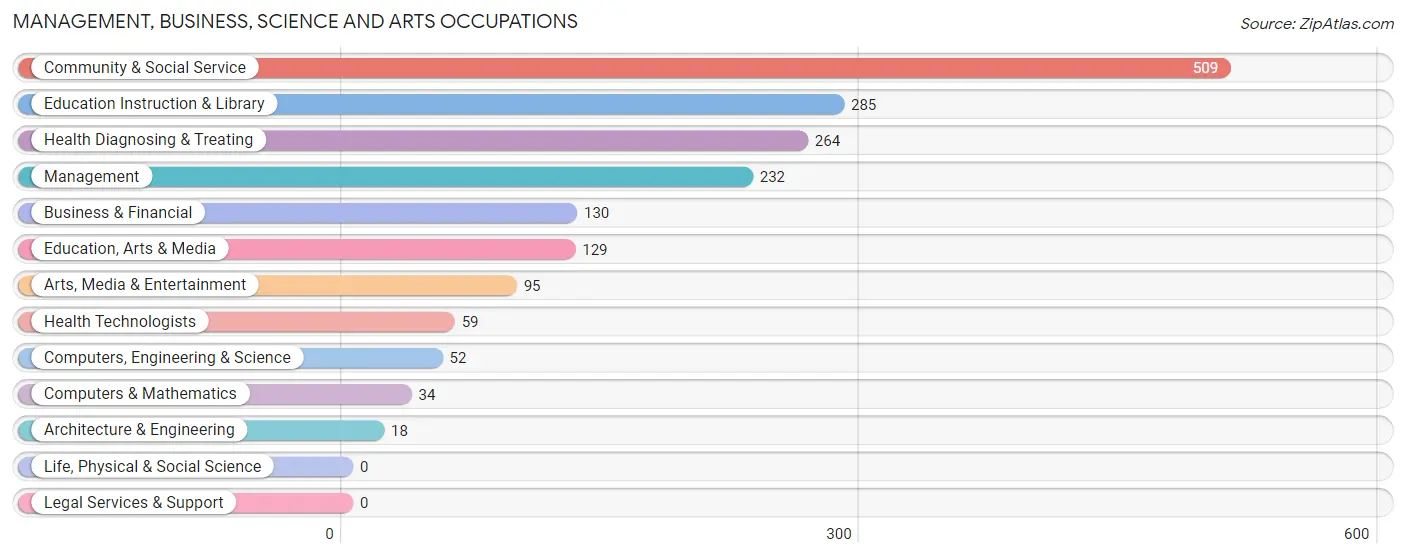
Management, Business, Science and Arts Occupations
The most common Management, Business, Science and Arts occupations in Douglas are Community & Social Service (509 | 11.1%), Education Instruction & Library (285 | 6.2%), Health Diagnosing & Treating (264 | 5.8%), Management (232 | 5.1%), and Business & Financial (130 | 2.8%).
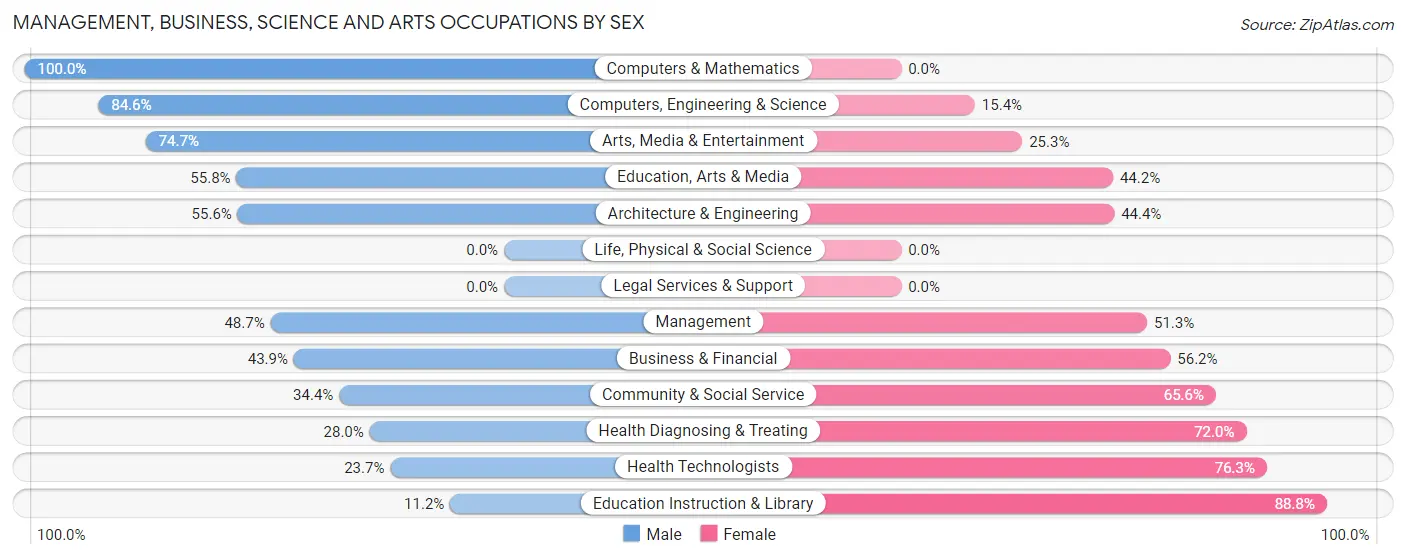
Management, Business, Science and Arts Occupations by Sex
Within the Management, Business, Science and Arts occupations in Douglas, the most male-oriented occupations are Computers & Mathematics (100.0%), Computers, Engineering & Science (84.6%), and Arts, Media & Entertainment (74.7%), while the most female-oriented occupations are Education Instruction & Library (88.8%), Health Technologists (76.3%), and Health Diagnosing & Treating (72.0%).
| Occupation | Male | Female |
| Management | 113 (48.7%) | 119 (51.3%) |
| Business & Financial | 57 (43.9%) | 73 (56.1%) |
| Computers, Engineering & Science | 44 (84.6%) | 8 (15.4%) |
| Computers & Mathematics | 34 (100.0%) | 0 (0.0%) |
| Architecture & Engineering | 10 (55.6%) | 8 (44.4%) |
| Life, Physical & Social Science | 0 (0.0%) | 0 (0.0%) |
| Community & Social Service | 175 (34.4%) | 334 (65.6%) |
| Education, Arts & Media | 72 (55.8%) | 57 (44.2%) |
| Legal Services & Support | 0 (0.0%) | 0 (0.0%) |
| Education Instruction & Library | 32 (11.2%) | 253 (88.8%) |
| Arts, Media & Entertainment | 71 (74.7%) | 24 (25.3%) |
| Health Diagnosing & Treating | 74 (28.0%) | 190 (72.0%) |
| Health Technologists | 14 (23.7%) | 45 (76.3%) |
| Total (Category) | 463 (39.0%) | 724 (61.0%) |
| Total (Overall) | 2,474 (54.1%) | 2,098 (45.9%) |
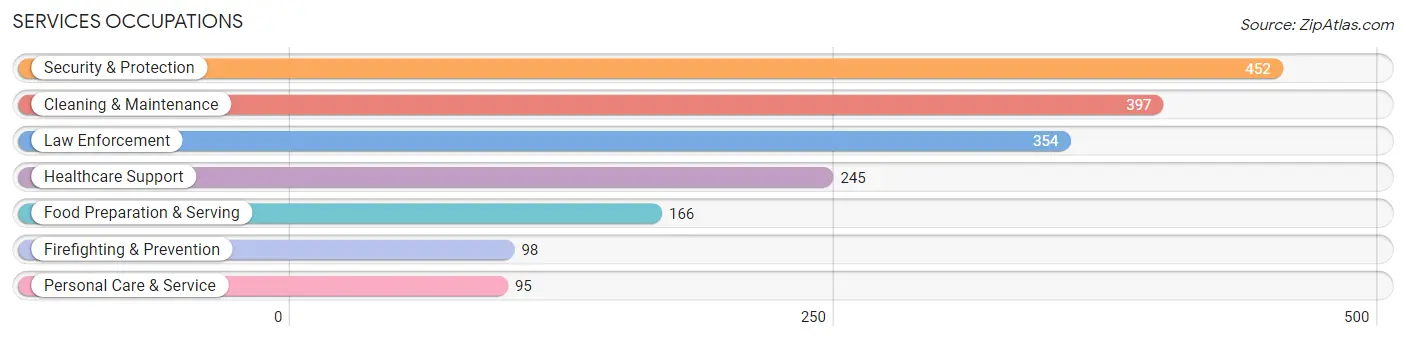
Services Occupations
The most common Services occupations in Douglas are Security & Protection (452 | 9.9%), Cleaning & Maintenance (397 | 8.7%), Law Enforcement (354 | 7.7%), Healthcare Support (245 | 5.4%), and Food Preparation & Serving (166 | 3.6%).
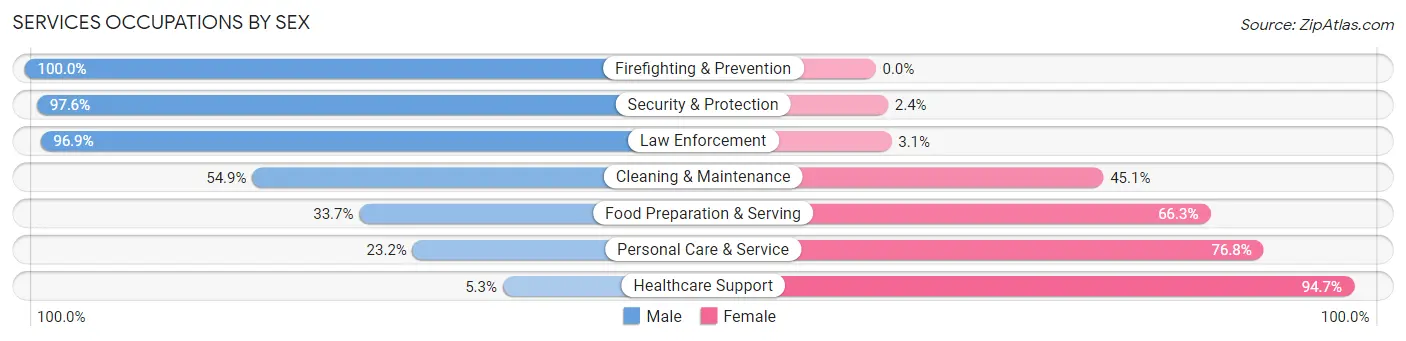
Services Occupations by Sex
Within the Services occupations in Douglas, the most male-oriented occupations are Firefighting & Prevention (100.0%), Security & Protection (97.6%), and Law Enforcement (96.9%), while the most female-oriented occupations are Healthcare Support (94.7%), Personal Care & Service (76.8%), and Food Preparation & Serving (66.3%).
| Occupation | Male | Female |
| Healthcare Support | 13 (5.3%) | 232 (94.7%) |
| Security & Protection | 441 (97.6%) | 11 (2.4%) |
| Firefighting & Prevention | 98 (100.0%) | 0 (0.0%) |
| Law Enforcement | 343 (96.9%) | 11 (3.1%) |
| Food Preparation & Serving | 56 (33.7%) | 110 (66.3%) |
| Cleaning & Maintenance | 218 (54.9%) | 179 (45.1%) |
| Personal Care & Service | 22 (23.2%) | 73 (76.8%) |
| Total (Category) | 750 (55.3%) | 605 (44.7%) |
| Total (Overall) | 2,474 (54.1%) | 2,098 (45.9%) |
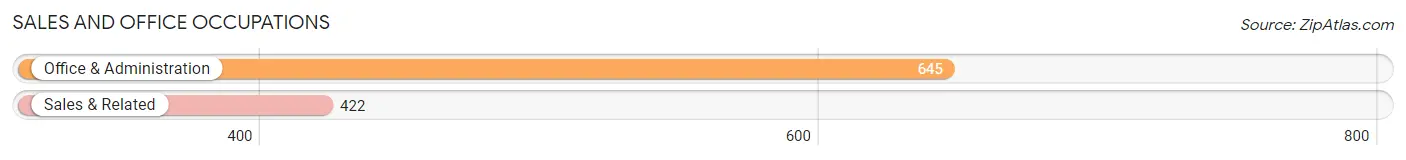
Sales and Office Occupations
The most common Sales and Office occupations in Douglas are Office & Administration (645 | 14.1%), and Sales & Related (422 | 9.2%).
Sales and Office Occupations by Sex
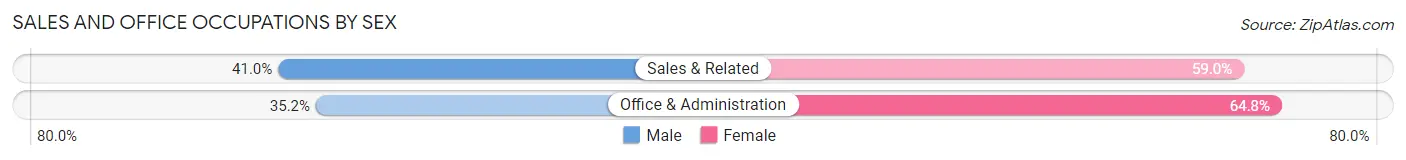
| Occupation | Male | Female |
| Sales & Related | 173 (41.0%) | 249 (59.0%) |
| Office & Administration | 227 (35.2%) | 418 (64.8%) |
| Total (Category) | 400 (37.5%) | 667 (62.5%) |
| Total (Overall) | 2,474 (54.1%) | 2,098 (45.9%) |
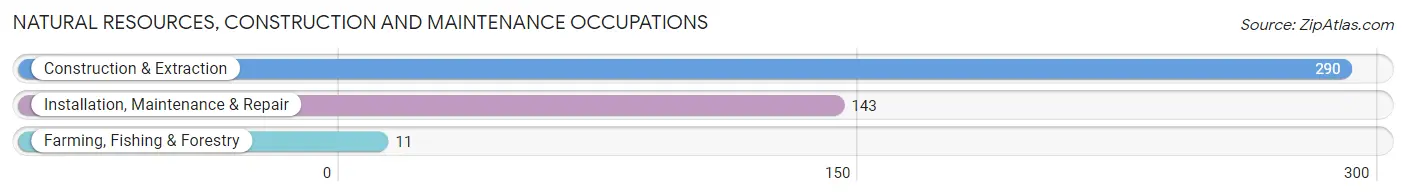
Natural Resources, Construction and Maintenance Occupations
The most common Natural Resources, Construction and Maintenance occupations in Douglas are Construction & Extraction (290 | 6.3%), Installation, Maintenance & Repair (143 | 3.1%), and Farming, Fishing & Forestry (11 | 0.2%).
Natural Resources, Construction and Maintenance Occupations by Sex
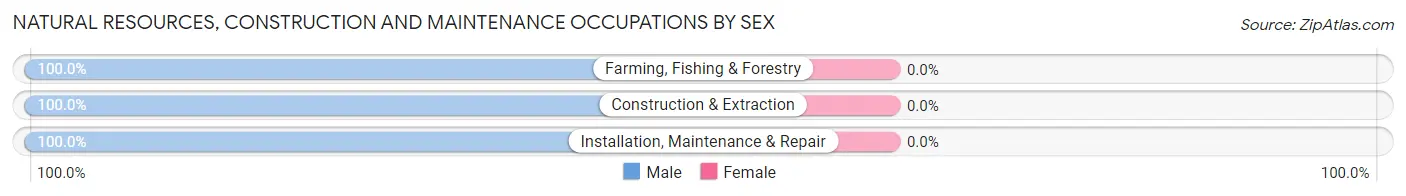
| Occupation | Male | Female |
| Farming, Fishing & Forestry | 11 (100.0%) | 0 (0.0%) |
| Construction & Extraction | 290 (100.0%) | 0 (0.0%) |
| Installation, Maintenance & Repair | 143 (100.0%) | 0 (0.0%) |
| Total (Category) | 444 (100.0%) | 0 (0.0%) |
| Total (Overall) | 2,474 (54.1%) | 2,098 (45.9%) |
Production, Transportation and Moving Occupations
The most common Production, Transportation and Moving occupations in Douglas are Production (178 | 3.9%), Material Moving (174 | 3.8%), and Transportation (167 | 3.6%).
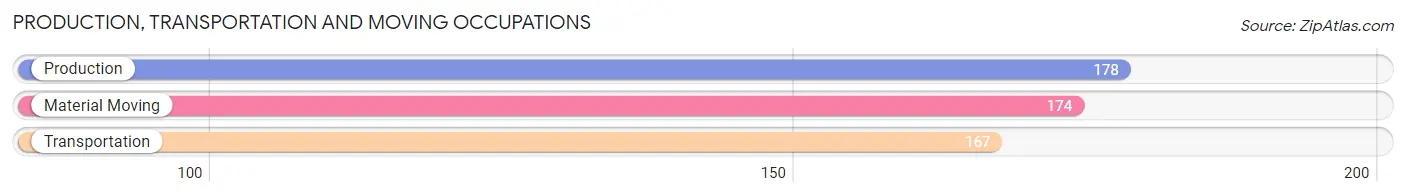
Production, Transportation and Moving Occupations by Sex
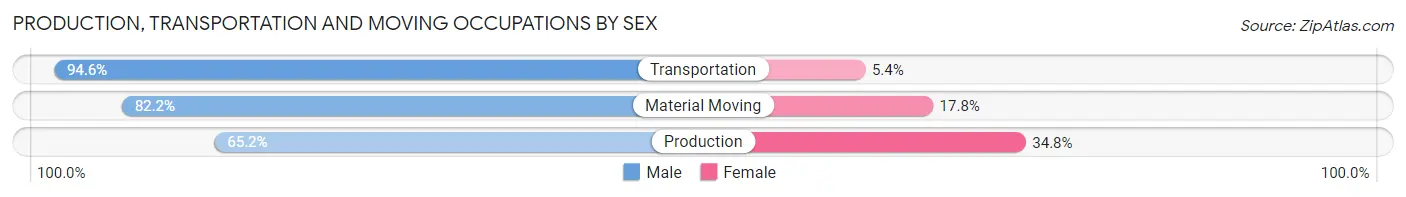
| Occupation | Male | Female |
| Production | 116 (65.2%) | 62 (34.8%) |
| Transportation | 158 (94.6%) | 9 (5.4%) |
| Material Moving | 143 (82.2%) | 31 (17.8%) |
| Total (Category) | 417 (80.3%) | 102 (19.7%) |
| Total (Overall) | 2,474 (54.1%) | 2,098 (45.9%) |
Employment Industries by Sex in Douglas
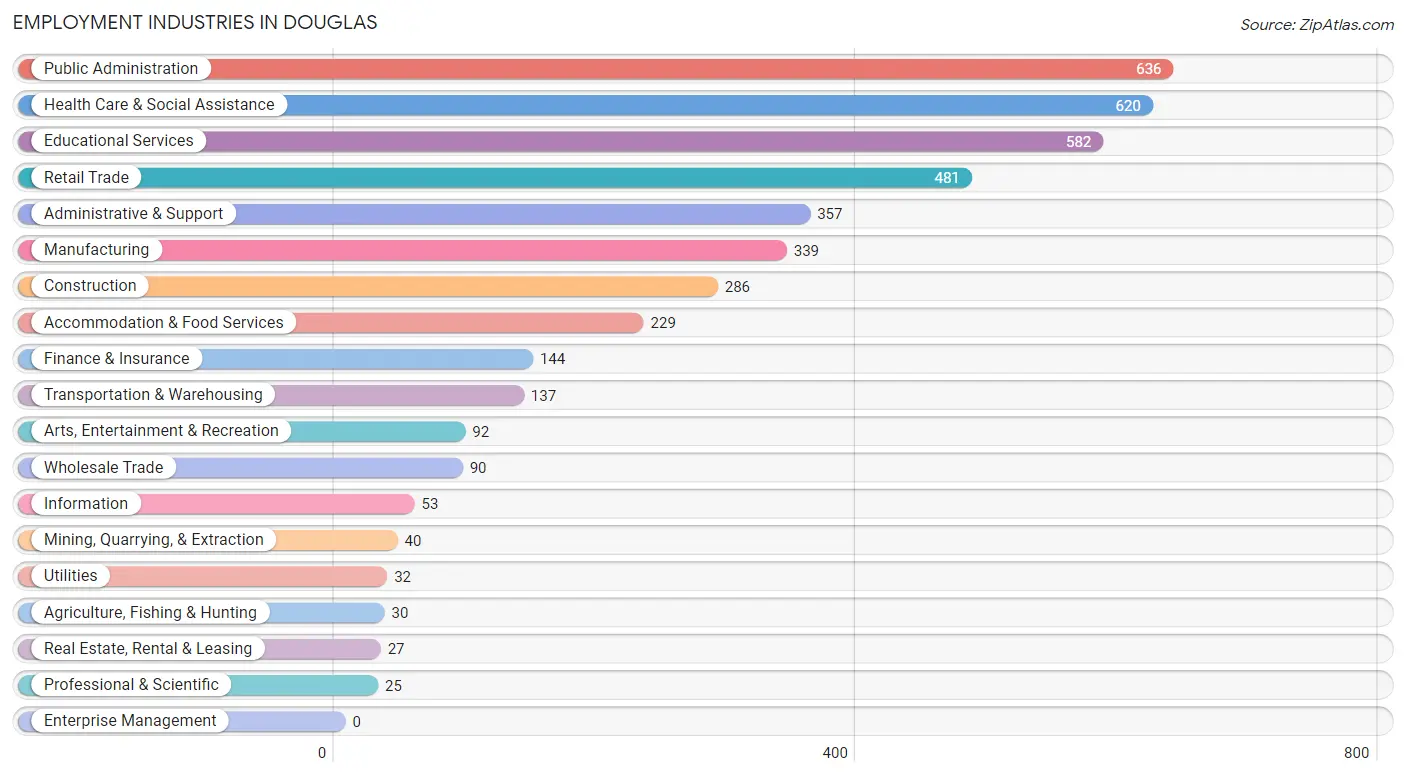
Employment Industries in Douglas
The major employment industries in Douglas include Public Administration (636 | 13.9%), Health Care & Social Assistance (620 | 13.6%), Educational Services (582 | 12.7%), Retail Trade (481 | 10.5%), and Administrative & Support (357 | 7.8%).
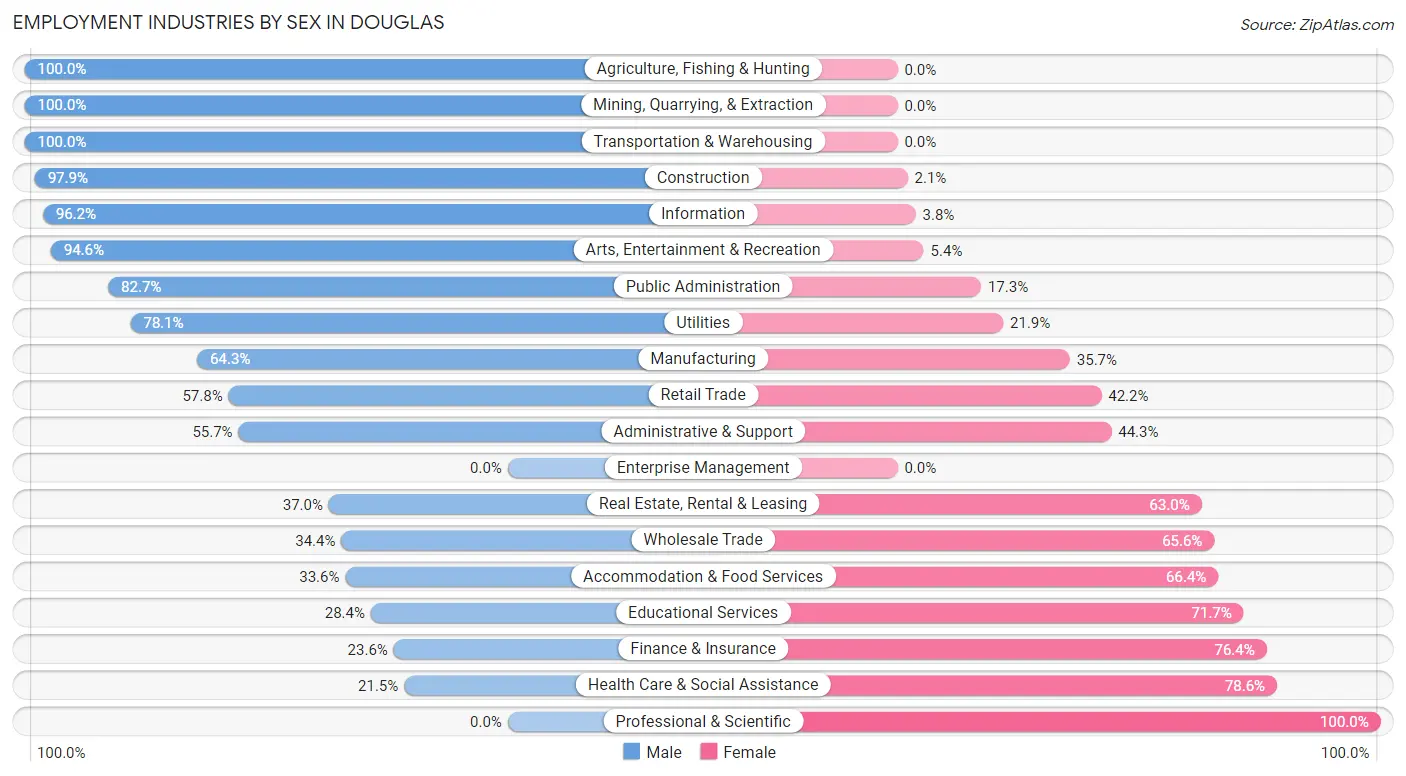
Employment Industries by Sex in Douglas
The Douglas industries that see more men than women are Agriculture, Fishing & Hunting (100.0%), Mining, Quarrying, & Extraction (100.0%), and Transportation & Warehousing (100.0%), whereas the industries that tend to have a higher number of women are Professional & Scientific (100.0%), Health Care & Social Assistance (78.5%), and Finance & Insurance (76.4%).
| Industry | Male | Female |
| Agriculture, Fishing & Hunting | 30 (100.0%) | 0 (0.0%) |
| Mining, Quarrying, & Extraction | 40 (100.0%) | 0 (0.0%) |
| Construction | 280 (97.9%) | 6 (2.1%) |
| Manufacturing | 218 (64.3%) | 121 (35.7%) |
| Wholesale Trade | 31 (34.4%) | 59 (65.6%) |
| Retail Trade | 278 (57.8%) | 203 (42.2%) |
| Transportation & Warehousing | 137 (100.0%) | 0 (0.0%) |
| Utilities | 25 (78.1%) | 7 (21.9%) |
| Information | 51 (96.2%) | 2 (3.8%) |
| Finance & Insurance | 34 (23.6%) | 110 (76.4%) |
| Real Estate, Rental & Leasing | 10 (37.0%) | 17 (63.0%) |
| Professional & Scientific | 0 (0.0%) | 25 (100.0%) |
| Enterprise Management | 0 (0.0%) | 0 (0.0%) |
| Administrative & Support | 199 (55.7%) | 158 (44.3%) |
| Educational Services | 165 (28.3%) | 417 (71.7%) |
| Health Care & Social Assistance | 133 (21.4%) | 487 (78.5%) |
| Arts, Entertainment & Recreation | 87 (94.6%) | 5 (5.4%) |
| Accommodation & Food Services | 77 (33.6%) | 152 (66.4%) |
| Public Administration | 526 (82.7%) | 110 (17.3%) |
| Total | 2,474 (54.1%) | 2,098 (45.9%) |
Education in Douglas
School Enrollment in Douglas
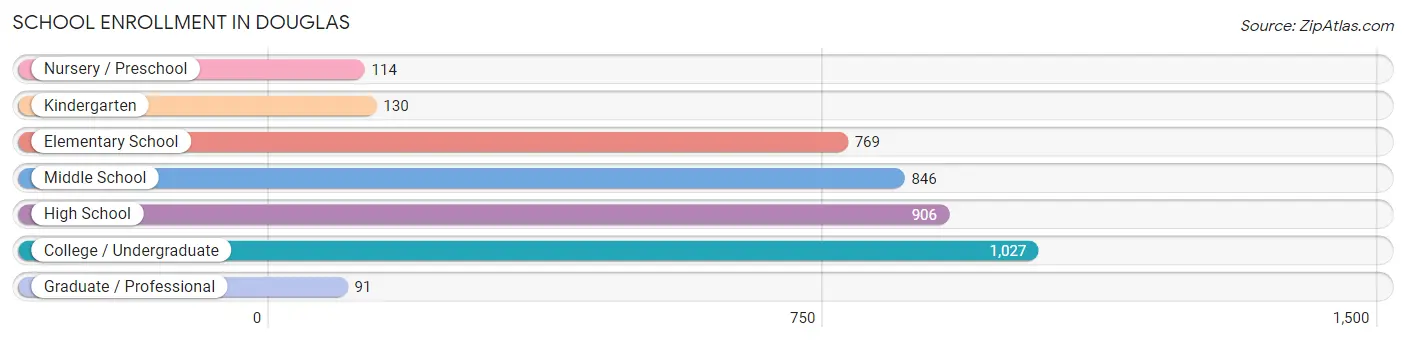
The most common levels of schooling among the 3,883 students in Douglas are college / undergraduate (1,027 | 26.5%), high school (906 | 23.3%), and middle school (846 | 21.8%).
| School Level | # Students | % Students |
| Nursery / Preschool | 114 | 2.9% |
| Kindergarten | 130 | 3.4% |
| Elementary School | 769 | 19.8% |
| Middle School | 846 | 21.8% |
| High School | 906 | 23.3% |
| College / Undergraduate | 1,027 | 26.5% |
| Graduate / Professional | 91 | 2.3% |
| Total | 3,883 | 100.0% |
School Enrollment by Age by Funding Source in Douglas
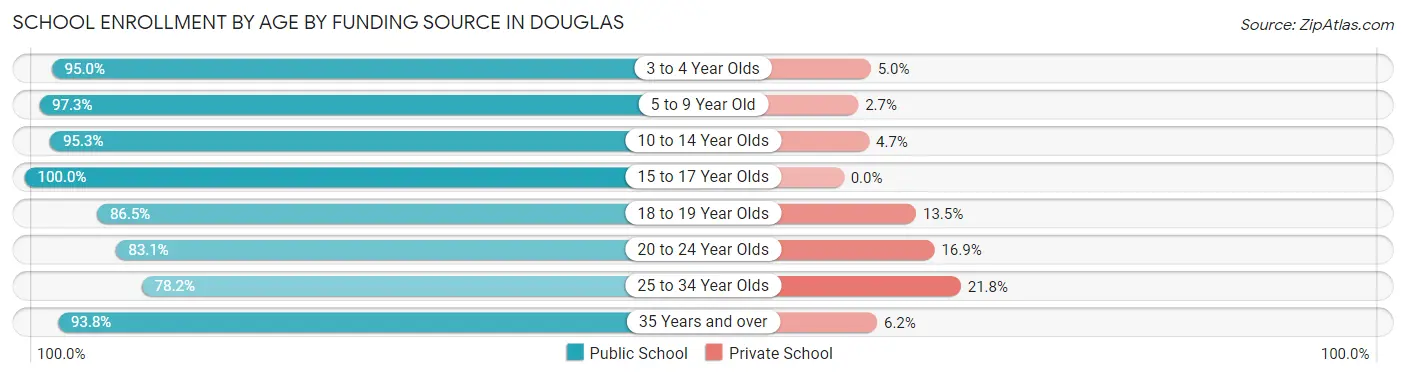
Out of a total of 3,883 students who are enrolled in schools in Douglas, 287 (7.4%) attend a private institution, while the remaining 3,596 (92.6%) are enrolled in public schools. The age group of 25 to 34 year olds has the highest likelihood of being enrolled in private schools, with 53 (21.8% in the age bracket) enrolled. Conversely, the age group of 15 to 17 year olds has the lowest likelihood of being enrolled in a private school, with 584 (100.0% in the age bracket) attending a public institution.
| Age Bracket | Public School | Private School |
| 3 to 4 Year Olds | 113 (95.0%) | 6 (5.0%) |
| 5 to 9 Year Old | 791 (97.3%) | 22 (2.7%) |
| 10 to 14 Year Olds | 845 (95.3%) | 42 (4.7%) |
| 15 to 17 Year Olds | 584 (100.0%) | 0 (0.0%) |
| 18 to 19 Year Olds | 308 (86.5%) | 48 (13.5%) |
| 20 to 24 Year Olds | 491 (83.1%) | 100 (16.9%) |
| 25 to 34 Year Olds | 190 (78.2%) | 53 (21.8%) |
| 35 Years and over | 272 (93.8%) | 18 (6.2%) |
| Total | 3,596 (92.6%) | 287 (7.4%) |
Educational Attainment by Field of Study in Douglas
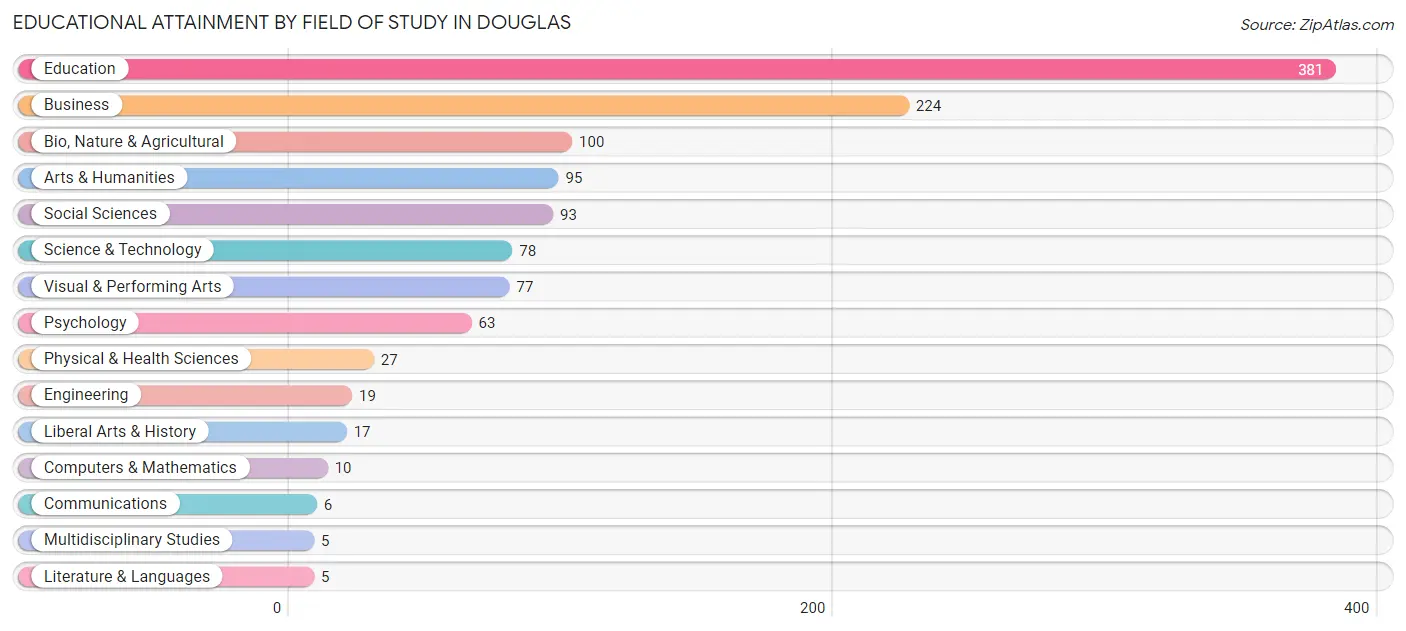
Education (381 | 31.8%), business (224 | 18.7%), bio, nature & agricultural (100 | 8.3%), arts & humanities (95 | 7.9%), and social sciences (93 | 7.7%) are the most common fields of study among 1,200 individuals in Douglas who have obtained a bachelor's degree or higher.
| Field of Study | # Graduates | % Graduates |
| Computers & Mathematics | 10 | 0.8% |
| Bio, Nature & Agricultural | 100 | 8.3% |
| Physical & Health Sciences | 27 | 2.2% |
| Psychology | 63 | 5.2% |
| Social Sciences | 93 | 7.7% |
| Engineering | 19 | 1.6% |
| Multidisciplinary Studies | 5 | 0.4% |
| Science & Technology | 78 | 6.5% |
| Business | 224 | 18.7% |
| Education | 381 | 31.8% |
| Literature & Languages | 5 | 0.4% |
| Liberal Arts & History | 17 | 1.4% |
| Visual & Performing Arts | 77 | 6.4% |
| Communications | 6 | 0.5% |
| Arts & Humanities | 95 | 7.9% |
| Total | 1,200 | 100.0% |
Transportation & Commute in Douglas
Vehicle Availability by Sex in Douglas
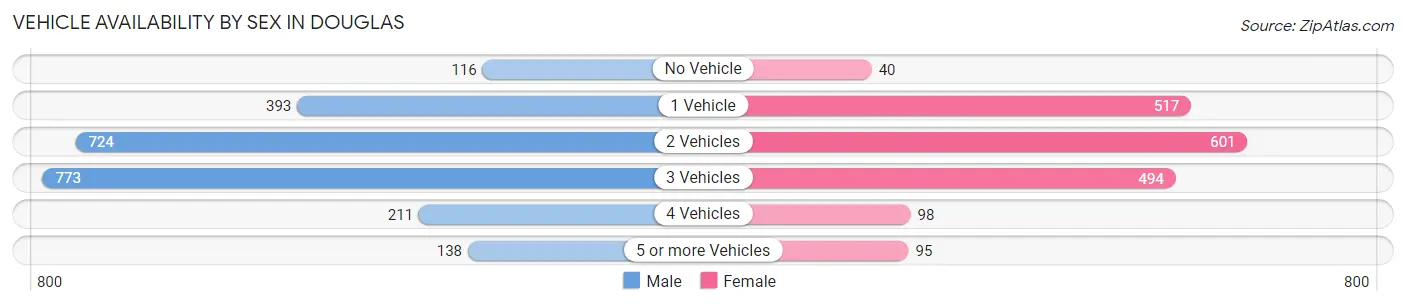
The most prevalent vehicle ownership categories in Douglas are males with 3 vehicles (773, accounting for 32.8%) and females with 3 vehicles (494, making up 41.9%).
| Vehicles Available | Male | Female |
| No Vehicle | 116 (4.9%) | 40 (2.2%) |
| 1 Vehicle | 393 (16.7%) | 517 (28.0%) |
| 2 Vehicles | 724 (30.7%) | 601 (32.6%) |
| 3 Vehicles | 773 (32.8%) | 494 (26.8%) |
| 4 Vehicles | 211 (9.0%) | 98 (5.3%) |
| 5 or more Vehicles | 138 (5.9%) | 95 (5.1%) |
| Total | 2,355 (100.0%) | 1,845 (100.0%) |
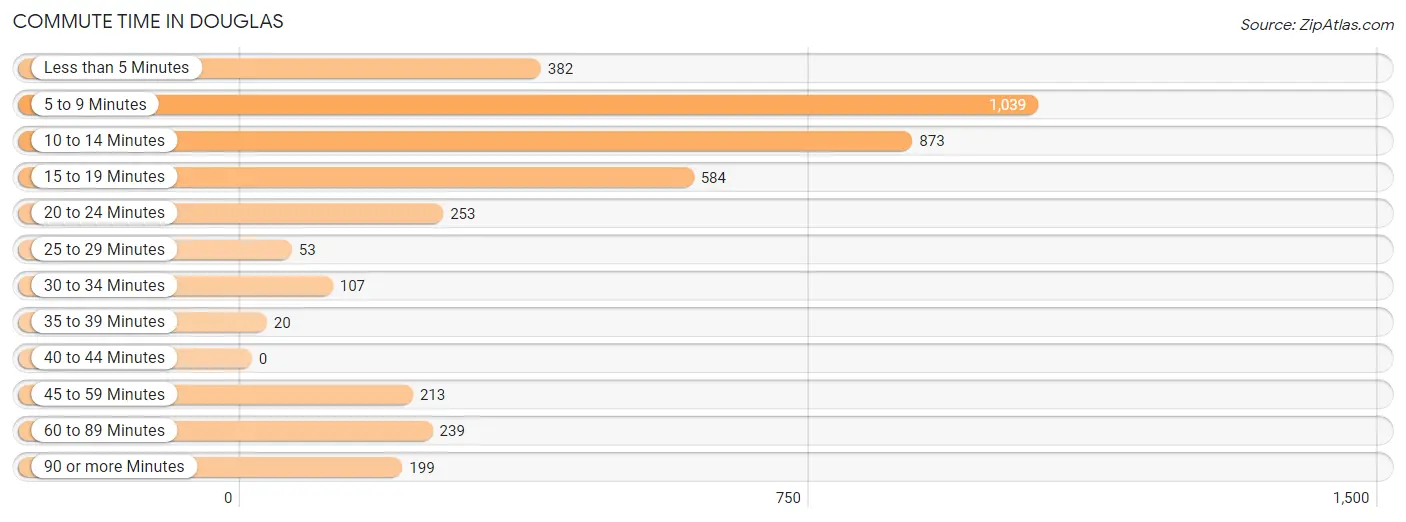
Commute Time in Douglas
The most frequently occuring commute durations in Douglas are 5 to 9 minutes (1,039 commuters, 26.2%), 10 to 14 minutes (873 commuters, 22.0%), and 15 to 19 minutes (584 commuters, 14.7%).
| Commute Time | # Commuters | % Commuters |
| Less than 5 Minutes | 382 | 9.6% |
| 5 to 9 Minutes | 1,039 | 26.2% |
| 10 to 14 Minutes | 873 | 22.0% |
| 15 to 19 Minutes | 584 | 14.7% |
| 20 to 24 Minutes | 253 | 6.4% |
| 25 to 29 Minutes | 53 | 1.3% |
| 30 to 34 Minutes | 107 | 2.7% |
| 35 to 39 Minutes | 20 | 0.5% |
| 40 to 44 Minutes | 0 | 0.0% |
| 45 to 59 Minutes | 213 | 5.4% |
| 60 to 89 Minutes | 239 | 6.0% |
| 90 or more Minutes | 199 | 5.0% |
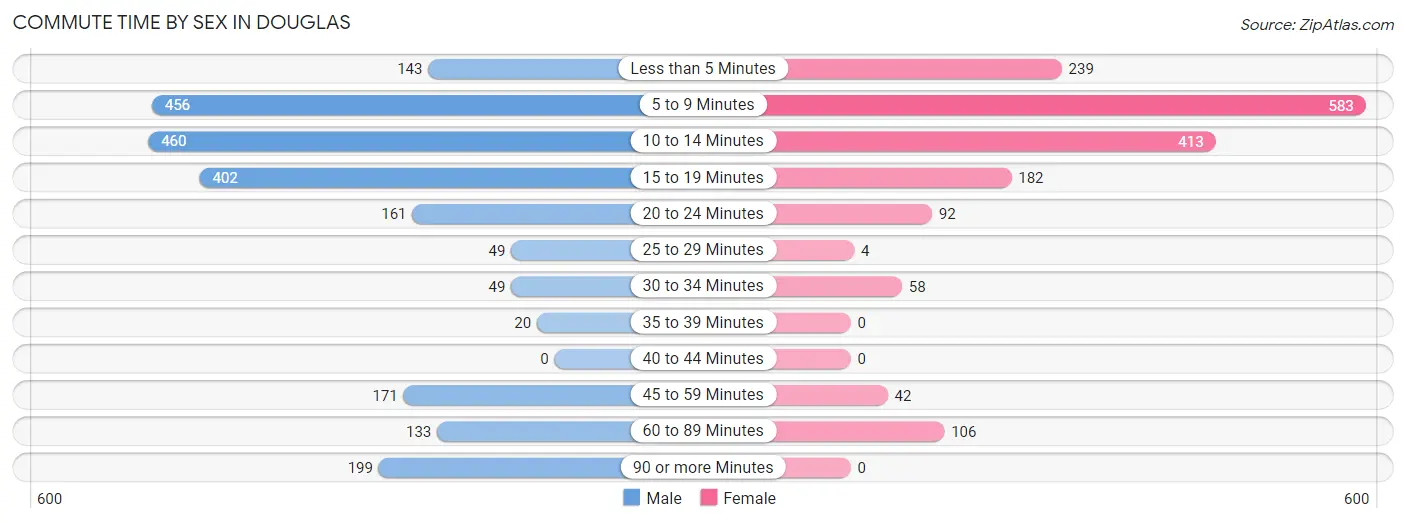
Commute Time by Sex in Douglas
The most common commute times in Douglas are 10 to 14 minutes (460 commuters, 20.5%) for males and 5 to 9 minutes (583 commuters, 33.9%) for females.
| Commute Time | Male | Female |
| Less than 5 Minutes | 143 (6.4%) | 239 (13.9%) |
| 5 to 9 Minutes | 456 (20.3%) | 583 (33.9%) |
| 10 to 14 Minutes | 460 (20.5%) | 413 (24.0%) |
| 15 to 19 Minutes | 402 (17.9%) | 182 (10.6%) |
| 20 to 24 Minutes | 161 (7.2%) | 92 (5.3%) |
| 25 to 29 Minutes | 49 (2.2%) | 4 (0.2%) |
| 30 to 34 Minutes | 49 (2.2%) | 58 (3.4%) |
| 35 to 39 Minutes | 20 (0.9%) | 0 (0.0%) |
| 40 to 44 Minutes | 0 (0.0%) | 0 (0.0%) |
| 45 to 59 Minutes | 171 (7.6%) | 42 (2.4%) |
| 60 to 89 Minutes | 133 (5.9%) | 106 (6.2%) |
| 90 or more Minutes | 199 (8.9%) | 0 (0.0%) |
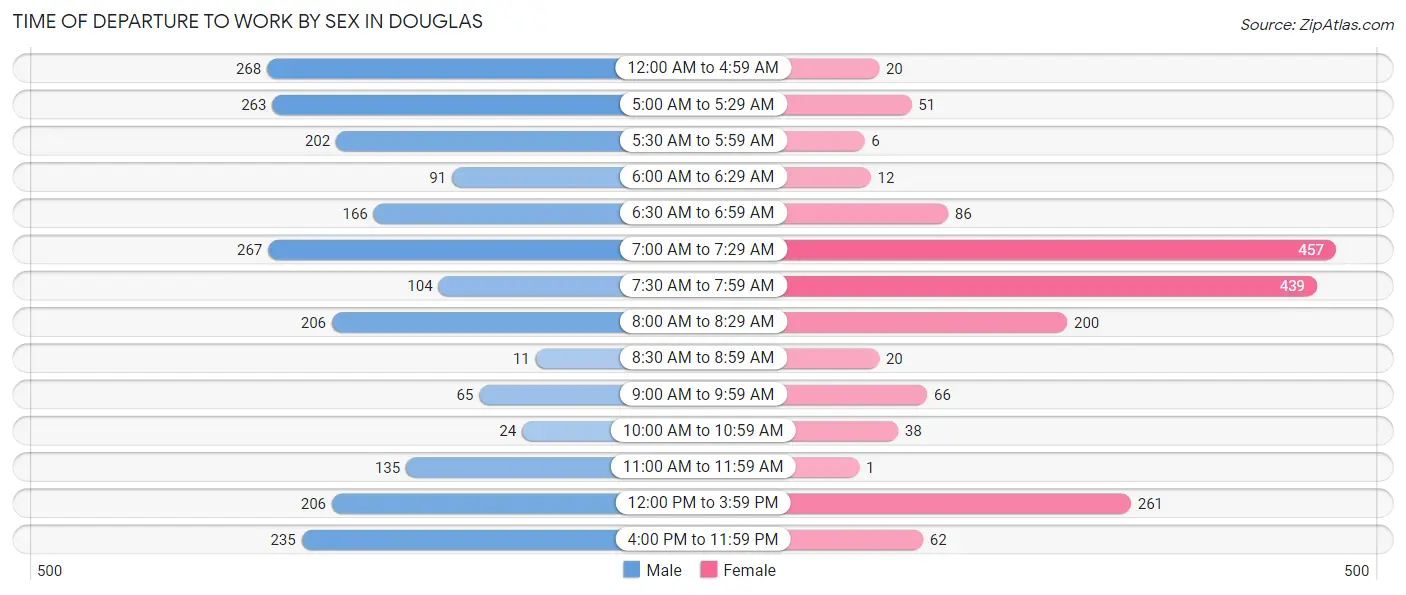
Time of Departure to Work by Sex in Douglas
The most frequent times of departure to work in Douglas are 12:00 AM to 4:59 AM (268, 11.9%) for males and 7:00 AM to 7:29 AM (457, 26.6%) for females.
| Time of Departure | Male | Female |
| 12:00 AM to 4:59 AM | 268 (11.9%) | 20 (1.2%) |
| 5:00 AM to 5:29 AM | 263 (11.7%) | 51 (3.0%) |
| 5:30 AM to 5:59 AM | 202 (9.0%) | 6 (0.4%) |
| 6:00 AM to 6:29 AM | 91 (4.1%) | 12 (0.7%) |
| 6:30 AM to 6:59 AM | 166 (7.4%) | 86 (5.0%) |
| 7:00 AM to 7:29 AM | 267 (11.9%) | 457 (26.6%) |
| 7:30 AM to 7:59 AM | 104 (4.6%) | 439 (25.5%) |
| 8:00 AM to 8:29 AM | 206 (9.2%) | 200 (11.6%) |
| 8:30 AM to 8:59 AM | 11 (0.5%) | 20 (1.2%) |
| 9:00 AM to 9:59 AM | 65 (2.9%) | 66 (3.8%) |
| 10:00 AM to 10:59 AM | 24 (1.1%) | 38 (2.2%) |
| 11:00 AM to 11:59 AM | 135 (6.0%) | 1 (0.1%) |
| 12:00 PM to 3:59 PM | 206 (9.2%) | 261 (15.2%) |
| 4:00 PM to 11:59 PM | 235 (10.5%) | 62 (3.6%) |
| Total | 2,243 (100.0%) | 1,719 (100.0%) |
Housing Occupancy in Douglas
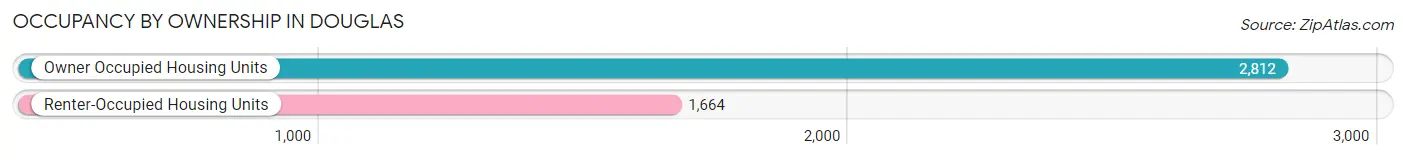
Occupancy by Ownership in Douglas
Of the total 4,476 dwellings in Douglas, owner-occupied units account for 2,812 (62.8%), while renter-occupied units make up 1,664 (37.2%).
| Occupancy | # Housing Units | % Housing Units |
| Owner Occupied Housing Units | 2,812 | 62.8% |
| Renter-Occupied Housing Units | 1,664 | 37.2% |
| Total Occupied Housing Units | 4,476 | 100.0% |
Occupancy by Household Size in Douglas
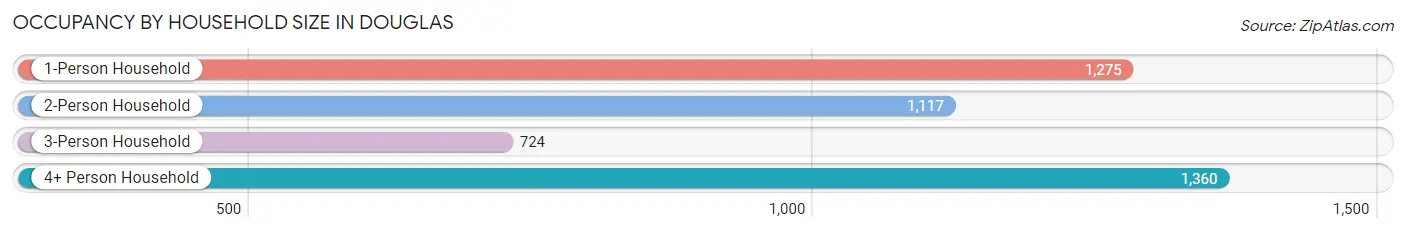
| Household Size | # Housing Units | % Housing Units |
| 1-Person Household | 1,275 | 28.5% |
| 2-Person Household | 1,117 | 25.0% |
| 3-Person Household | 724 | 16.2% |
| 4+ Person Household | 1,360 | 30.4% |
| Total Housing Units | 4,476 | 100.0% |
Occupancy by Ownership by Household Size in Douglas
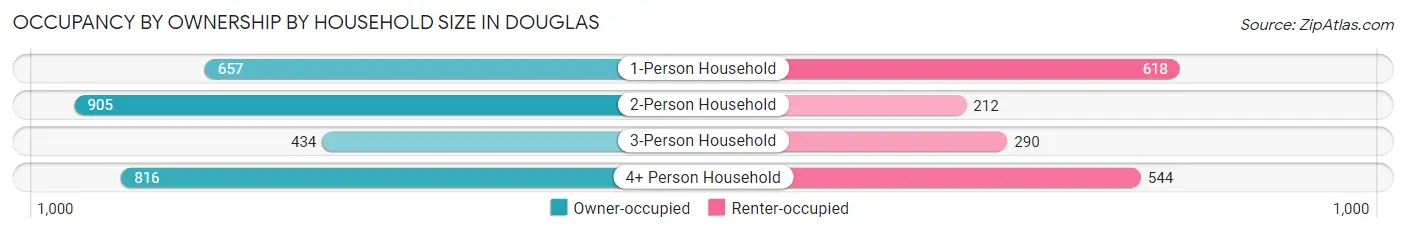
| Household Size | Owner-occupied | Renter-occupied |
| 1-Person Household | 657 (51.5%) | 618 (48.5%) |
| 2-Person Household | 905 (81.0%) | 212 (19.0%) |
| 3-Person Household | 434 (59.9%) | 290 (40.1%) |
| 4+ Person Household | 816 (60.0%) | 544 (40.0%) |
| Total Housing Units | 2,812 (62.8%) | 1,664 (37.2%) |
Occupancy by Educational Attainment in Douglas
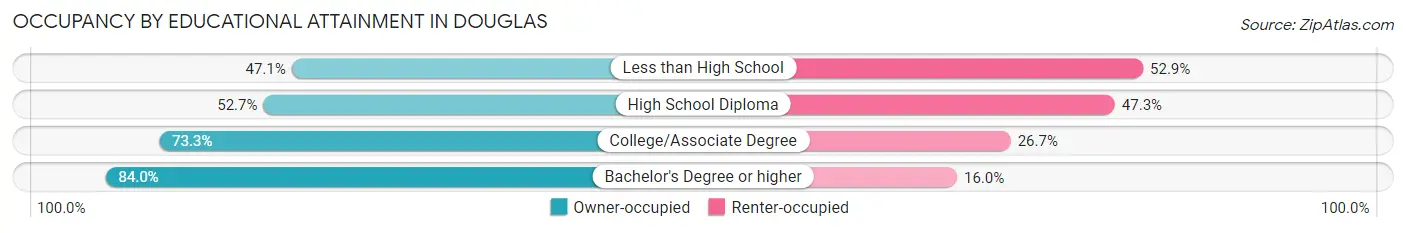
| Household Size | Owner-occupied | Renter-occupied |
| Less than High School | 531 (47.1%) | 597 (52.9%) |
| High School Diploma | 621 (52.7%) | 558 (47.3%) |
| College/Associate Degree | 1,110 (73.3%) | 404 (26.7%) |
| Bachelor's Degree or higher | 550 (84.0%) | 105 (16.0%) |
Occupancy by Age of Householder in Douglas
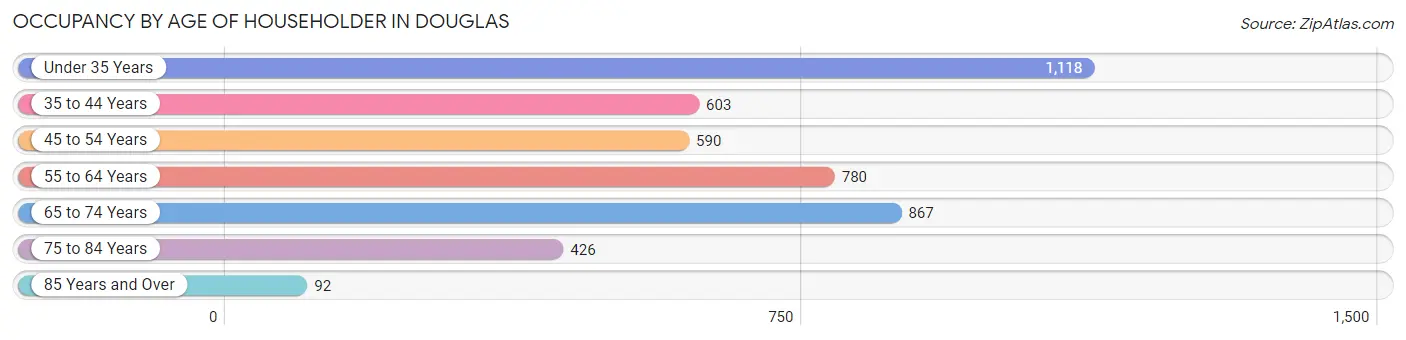
| Age Bracket | # Households | % Households |
| Under 35 Years | 1,118 | 25.0% |
| 35 to 44 Years | 603 | 13.5% |
| 45 to 54 Years | 590 | 13.2% |
| 55 to 64 Years | 780 | 17.4% |
| 65 to 74 Years | 867 | 19.4% |
| 75 to 84 Years | 426 | 9.5% |
| 85 Years and Over | 92 | 2.1% |
| Total | 4,476 | 100.0% |
Housing Finances in Douglas
Median Income by Occupancy in Douglas
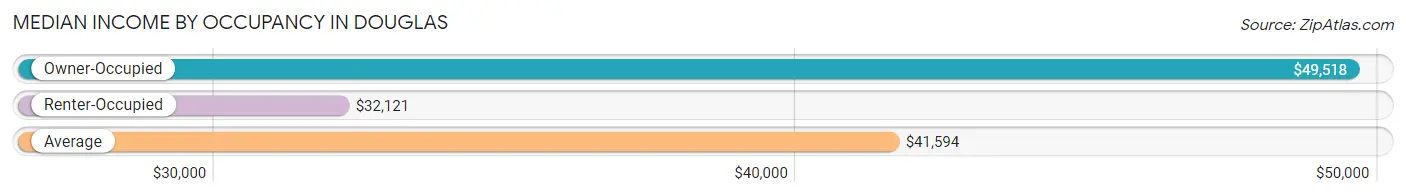
| Occupancy Type | # Households | Median Income |
| Owner-Occupied | 2,812 (62.8%) | $49,518 |
| Renter-Occupied | 1,664 (37.2%) | $32,121 |
| Average | 4,476 (100.0%) | $41,594 |
Occupancy by Householder Income Bracket in Douglas
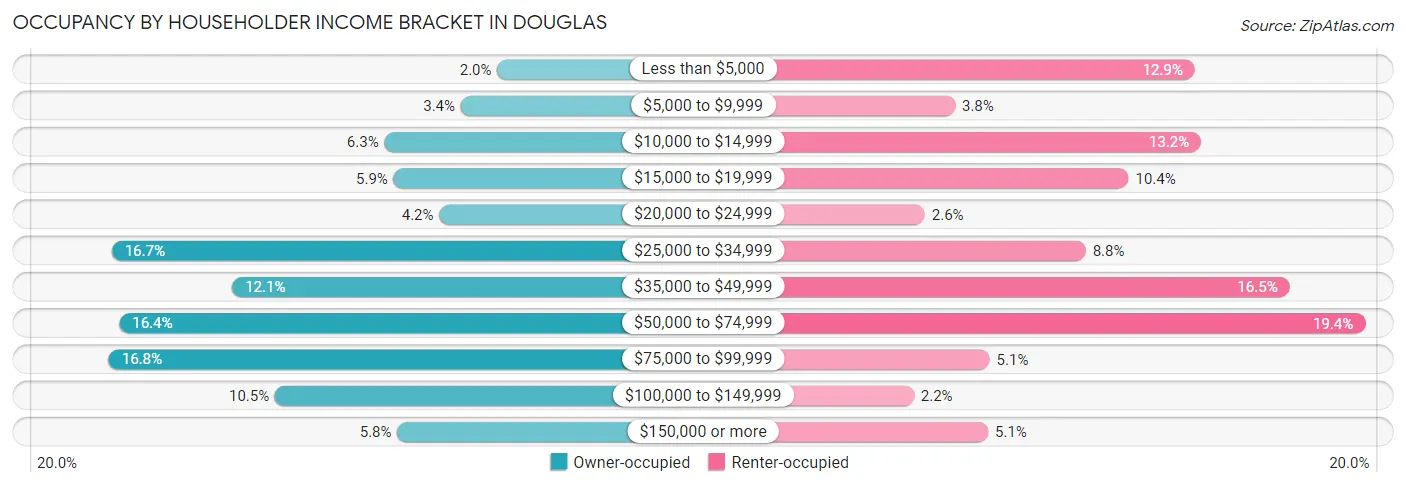
| Income Bracket | Owner-occupied | Renter-occupied |
| Less than $5,000 | 56 (2.0%) | 215 (12.9%) |
| $5,000 to $9,999 | 95 (3.4%) | 63 (3.8%) |
| $10,000 to $14,999 | 177 (6.3%) | 219 (13.2%) |
| $15,000 to $19,999 | 167 (5.9%) | 173 (10.4%) |
| $20,000 to $24,999 | 118 (4.2%) | 44 (2.6%) |
| $25,000 to $34,999 | 469 (16.7%) | 146 (8.8%) |
| $35,000 to $49,999 | 340 (12.1%) | 275 (16.5%) |
| $50,000 to $74,999 | 461 (16.4%) | 323 (19.4%) |
| $75,000 to $99,999 | 472 (16.8%) | 85 (5.1%) |
| $100,000 to $149,999 | 294 (10.5%) | 37 (2.2%) |
| $150,000 or more | 163 (5.8%) | 84 (5.1%) |
| Total | 2,812 (100.0%) | 1,664 (100.0%) |
Monthly Housing Cost Tiers in Douglas
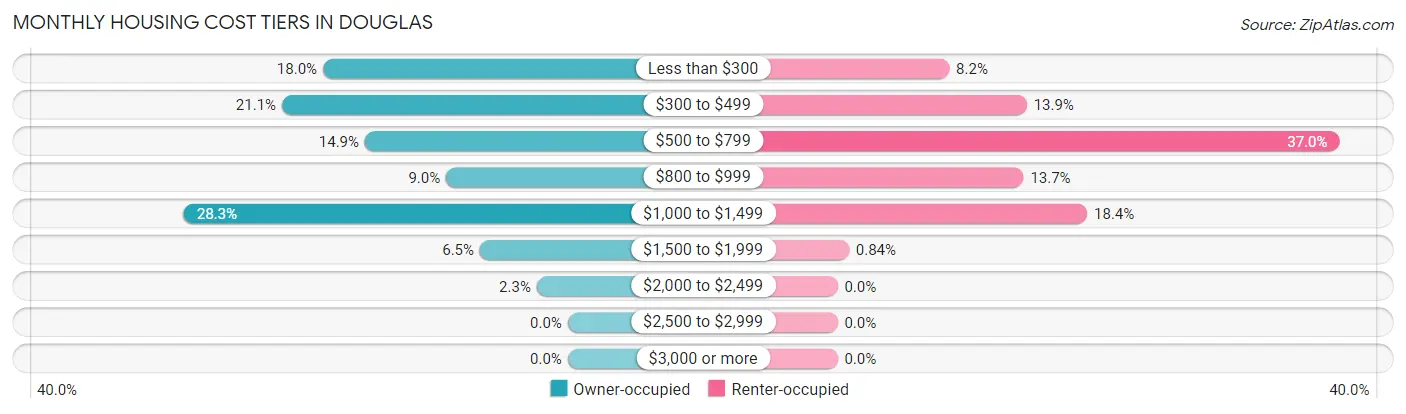
| Monthly Cost | Owner-occupied | Renter-occupied |
| Less than $300 | 507 (18.0%) | 137 (8.2%) |
| $300 to $499 | 592 (21.0%) | 232 (13.9%) |
| $500 to $799 | 420 (14.9%) | 615 (37.0%) |
| $800 to $999 | 252 (9.0%) | 228 (13.7%) |
| $1,000 to $1,499 | 795 (28.3%) | 306 (18.4%) |
| $1,500 to $1,999 | 182 (6.5%) | 14 (0.8%) |
| $2,000 to $2,499 | 64 (2.3%) | 0 (0.0%) |
| $2,500 to $2,999 | 0 (0.0%) | 0 (0.0%) |
| $3,000 or more | 0 (0.0%) | 0 (0.0%) |
| Total | 2,812 (100.0%) | 1,664 (100.0%) |
Physical Housing Characteristics in Douglas
Housing Structures in Douglas
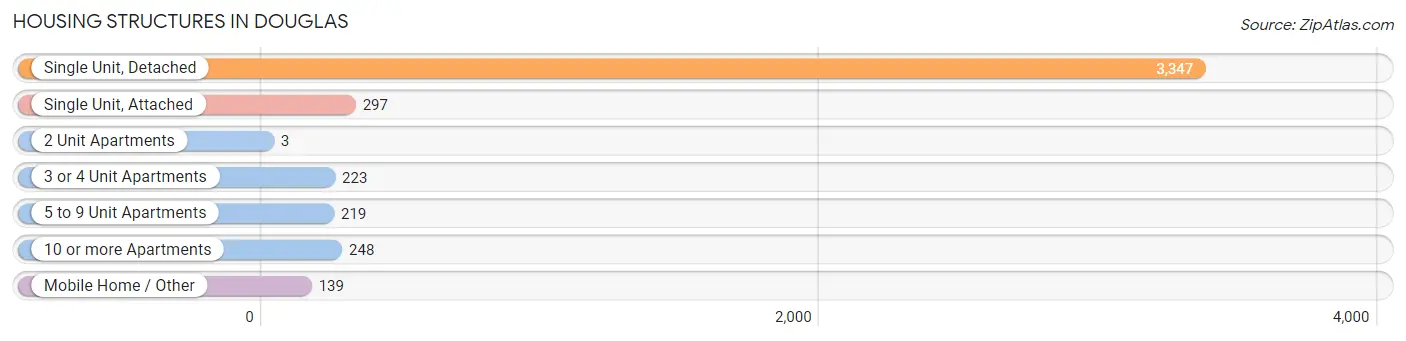
| Structure Type | # Housing Units | % Housing Units |
| Single Unit, Detached | 3,347 | 74.8% |
| Single Unit, Attached | 297 | 6.6% |
| 2 Unit Apartments | 3 | 0.1% |
| 3 or 4 Unit Apartments | 223 | 5.0% |
| 5 to 9 Unit Apartments | 219 | 4.9% |
| 10 or more Apartments | 248 | 5.5% |
| Mobile Home / Other | 139 | 3.1% |
| Total | 4,476 | 100.0% |
Housing Structures by Occupancy in Douglas
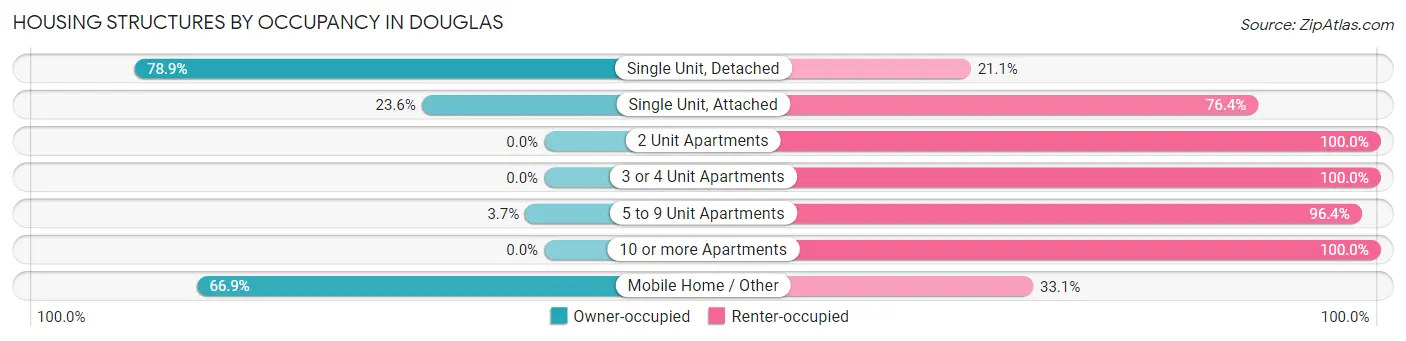
| Structure Type | Owner-occupied | Renter-occupied |
| Single Unit, Detached | 2,641 (78.9%) | 706 (21.1%) |
| Single Unit, Attached | 70 (23.6%) | 227 (76.4%) |
| 2 Unit Apartments | 0 (0.0%) | 3 (100.0%) |
| 3 or 4 Unit Apartments | 0 (0.0%) | 223 (100.0%) |
| 5 to 9 Unit Apartments | 8 (3.6%) | 211 (96.4%) |
| 10 or more Apartments | 0 (0.0%) | 248 (100.0%) |
| Mobile Home / Other | 93 (66.9%) | 46 (33.1%) |
| Total | 2,812 (62.8%) | 1,664 (37.2%) |
Housing Structures by Number of Rooms in Douglas
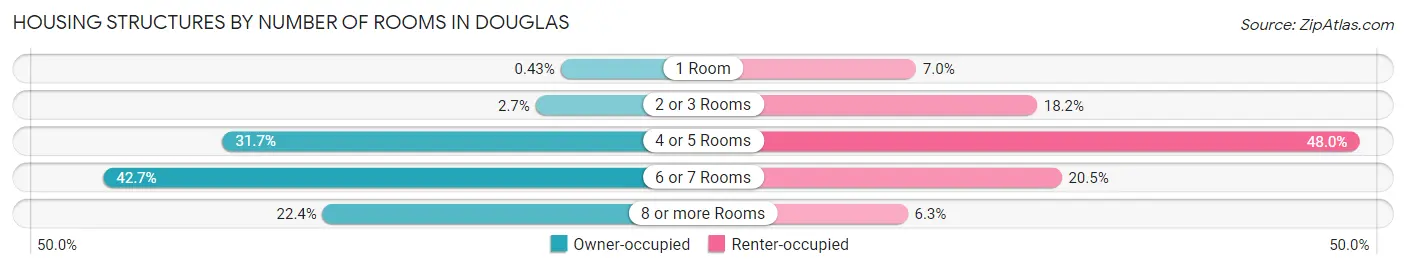
| Number of Rooms | Owner-occupied | Renter-occupied |
| 1 Room | 12 (0.4%) | 117 (7.0%) |
| 2 or 3 Rooms | 77 (2.7%) | 303 (18.2%) |
| 4 or 5 Rooms | 891 (31.7%) | 799 (48.0%) |
| 6 or 7 Rooms | 1,201 (42.7%) | 341 (20.5%) |
| 8 or more Rooms | 631 (22.4%) | 104 (6.2%) |
| Total | 2,812 (100.0%) | 1,664 (100.0%) |
Housing Structure by Heating Type in Douglas
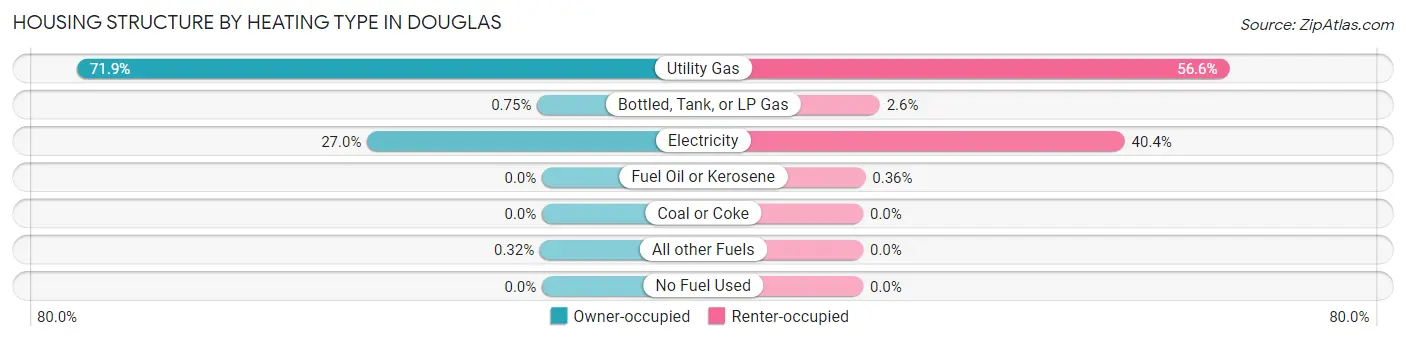
| Heating Type | Owner-occupied | Renter-occupied |
| Utility Gas | 2,022 (71.9%) | 942 (56.6%) |
| Bottled, Tank, or LP Gas | 21 (0.7%) | 43 (2.6%) |
| Electricity | 760 (27.0%) | 673 (40.4%) |
| Fuel Oil or Kerosene | 0 (0.0%) | 6 (0.4%) |
| Coal or Coke | 0 (0.0%) | 0 (0.0%) |
| All other Fuels | 9 (0.3%) | 0 (0.0%) |
| No Fuel Used | 0 (0.0%) | 0 (0.0%) |
| Total | 2,812 (100.0%) | 1,664 (100.0%) |
Household Vehicle Usage in Douglas
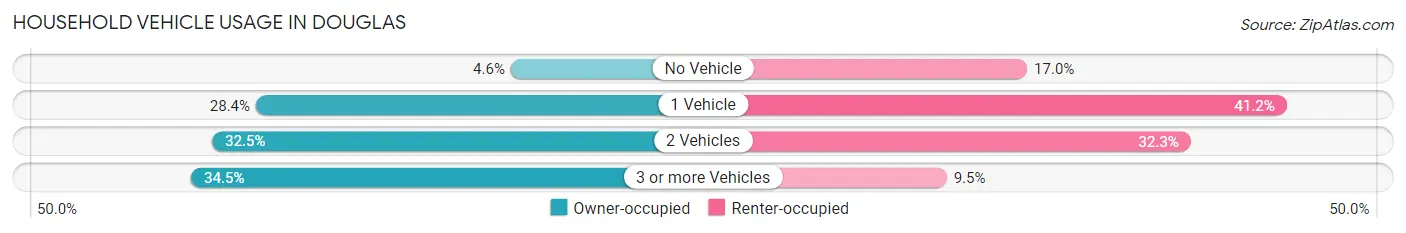
| Vehicles per Household | Owner-occupied | Renter-occupied |
| No Vehicle | 130 (4.6%) | 283 (17.0%) |
| 1 Vehicle | 799 (28.4%) | 686 (41.2%) |
| 2 Vehicles | 914 (32.5%) | 537 (32.3%) |
| 3 or more Vehicles | 969 (34.5%) | 158 (9.5%) |
| Total | 2,812 (100.0%) | 1,664 (100.0%) |
Real Estate & Mortgages in Douglas
Real Estate and Mortgage Overview in Douglas
| Characteristic | Without Mortgage | With Mortgage |
| Housing Units | 1,346 | 1,466 |
| Median Property Value | $107,800 | $140,900 |
| Median Household Income | $40,517 | $110 |
| Monthly Housing Costs | $337 | $0 |
| Real Estate Taxes | $862 | $27 |
Property Value by Mortgage Status in Douglas
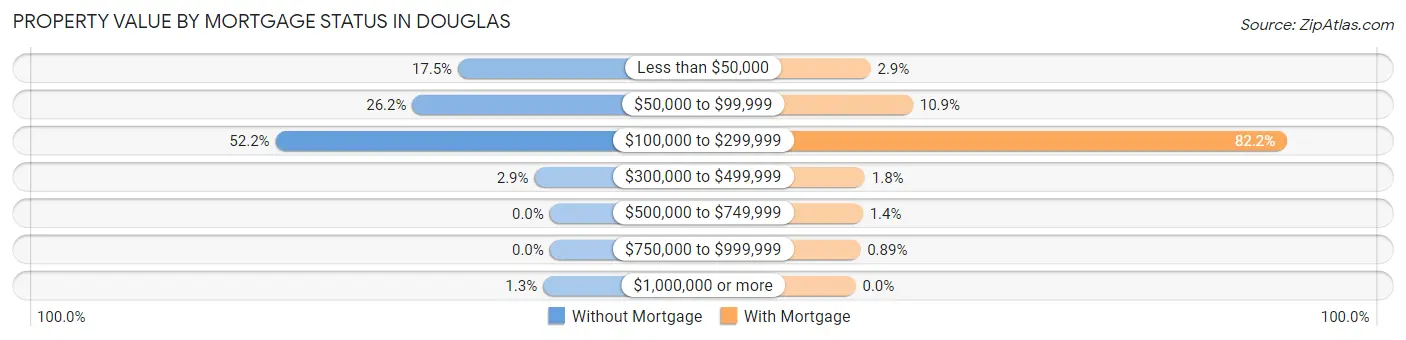
| Property Value | Without Mortgage | With Mortgage |
| Less than $50,000 | 235 (17.5%) | 42 (2.9%) |
| $50,000 to $99,999 | 352 (26.2%) | 160 (10.9%) |
| $100,000 to $299,999 | 703 (52.2%) | 1,205 (82.2%) |
| $300,000 to $499,999 | 39 (2.9%) | 26 (1.8%) |
| $500,000 to $749,999 | 0 (0.0%) | 20 (1.4%) |
| $750,000 to $999,999 | 0 (0.0%) | 13 (0.9%) |
| $1,000,000 or more | 17 (1.3%) | 0 (0.0%) |
| Total | 1,346 (100.0%) | 1,466 (100.0%) |
Household Income by Mortgage Status in Douglas
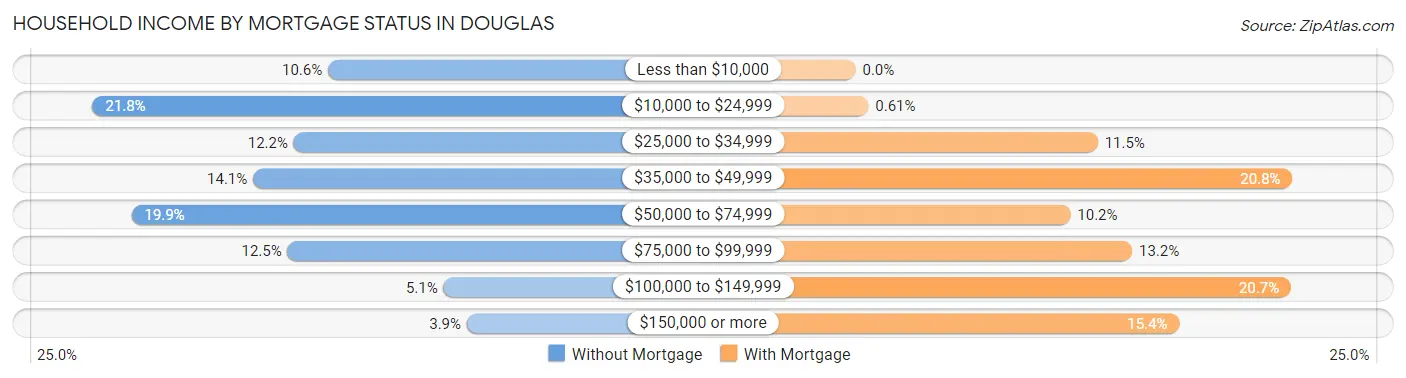
| Household Income | Without Mortgage | With Mortgage |
| Less than $10,000 | 142 (10.5%) | 0 (0.0%) |
| $10,000 to $24,999 | 293 (21.8%) | 9 (0.6%) |
| $25,000 to $34,999 | 164 (12.2%) | 169 (11.5%) |
| $35,000 to $49,999 | 190 (14.1%) | 305 (20.8%) |
| $50,000 to $74,999 | 268 (19.9%) | 150 (10.2%) |
| $75,000 to $99,999 | 168 (12.5%) | 193 (13.2%) |
| $100,000 to $149,999 | 68 (5.1%) | 304 (20.7%) |
| $150,000 or more | 53 (3.9%) | 226 (15.4%) |
| Total | 1,346 (100.0%) | 1,466 (100.0%) |
Property Value to Household Income Ratio in Douglas
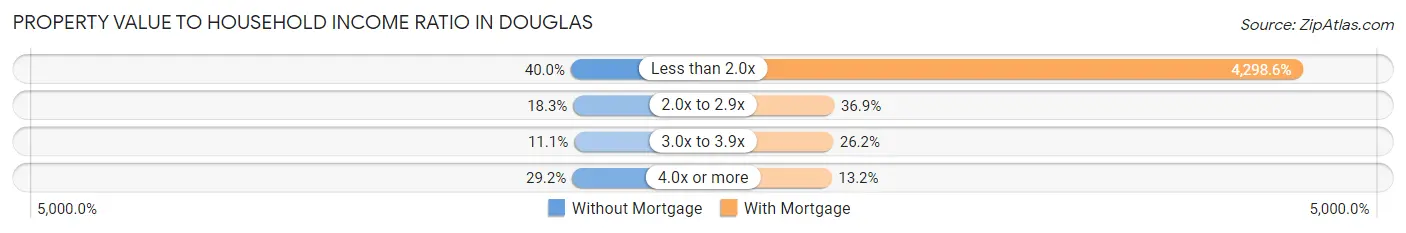
| Value-to-Income Ratio | Without Mortgage | With Mortgage |
| Less than 2.0x | 539 (40.0%) | 63,017 (4,298.6%) |
| 2.0x to 2.9x | 246 (18.3%) | 541 (36.9%) |
| 3.0x to 3.9x | 149 (11.1%) | 384 (26.2%) |
| 4.0x or more | 393 (29.2%) | 193 (13.2%) |
| Total | 1,346 (100.0%) | 1,466 (100.0%) |
Real Estate Taxes by Mortgage Status in Douglas
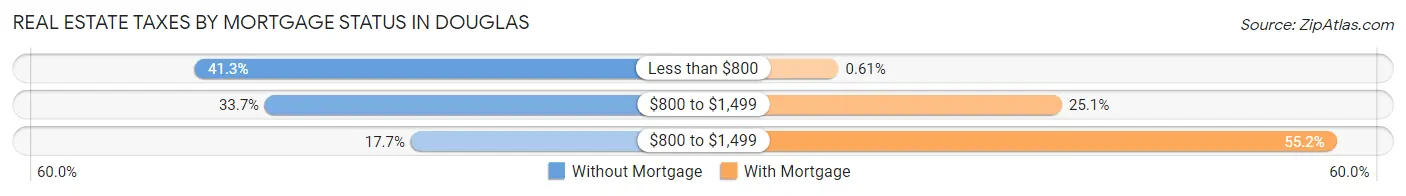
| Property Taxes | Without Mortgage | With Mortgage |
| Less than $800 | 556 (41.3%) | 9 (0.6%) |
| $800 to $1,499 | 453 (33.7%) | 368 (25.1%) |
| $800 to $1,499 | 238 (17.7%) | 809 (55.2%) |
| Total | 1,346 (100.0%) | 1,466 (100.0%) |
Health & Disability in Douglas
Health Insurance Coverage by Age in Douglas
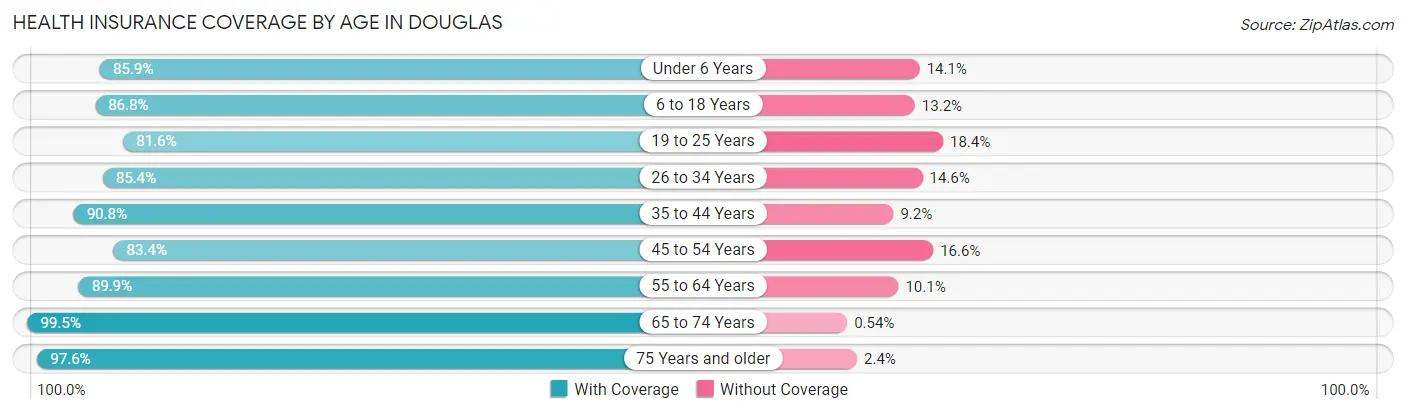
| Age Bracket | With Coverage | Without Coverage |
| Under 6 Years | 1,253 (85.9%) | 205 (14.1%) |
| 6 to 18 Years | 2,261 (86.8%) | 343 (13.2%) |
| 19 to 25 Years | 1,161 (81.6%) | 262 (18.4%) |
| 26 to 34 Years | 1,469 (85.4%) | 251 (14.6%) |
| 35 to 44 Years | 1,089 (90.8%) | 110 (9.2%) |
| 45 to 54 Years | 946 (83.4%) | 188 (16.6%) |
| 55 to 64 Years | 1,334 (89.9%) | 150 (10.1%) |
| 65 to 74 Years | 1,292 (99.5%) | 7 (0.5%) |
| 75 Years and older | 775 (97.6%) | 19 (2.4%) |
| Total | 11,580 (88.3%) | 1,535 (11.7%) |
Health Insurance Coverage by Citizenship Status in Douglas
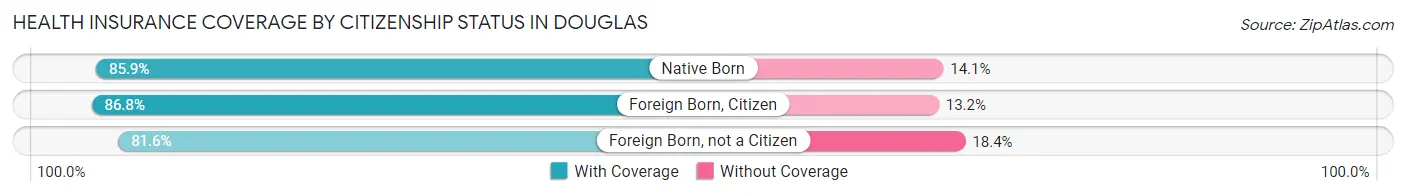
| Citizenship Status | With Coverage | Without Coverage |
| Native Born | 1,253 (85.9%) | 205 (14.1%) |
| Foreign Born, Citizen | 2,261 (86.8%) | 343 (13.2%) |
| Foreign Born, not a Citizen | 1,161 (81.6%) | 262 (18.4%) |
Health Insurance Coverage by Household Income in Douglas
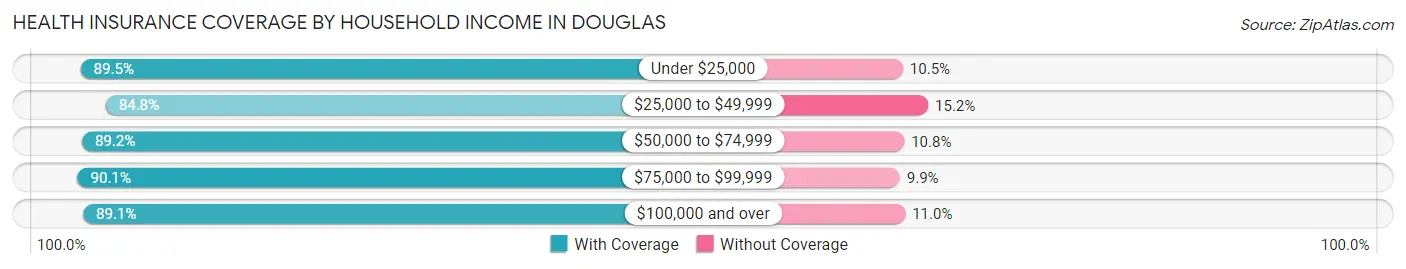
| Household Income | With Coverage | Without Coverage |
| Under $25,000 | 3,047 (89.5%) | 358 (10.5%) |
| $25,000 to $49,999 | 2,778 (84.8%) | 499 (15.2%) |
| $50,000 to $74,999 | 2,314 (89.2%) | 279 (10.8%) |
| $75,000 to $99,999 | 1,649 (90.1%) | 182 (9.9%) |
| $100,000 and over | 1,749 (89.0%) | 215 (11.0%) |
Public vs Private Health Insurance Coverage by Age in Douglas
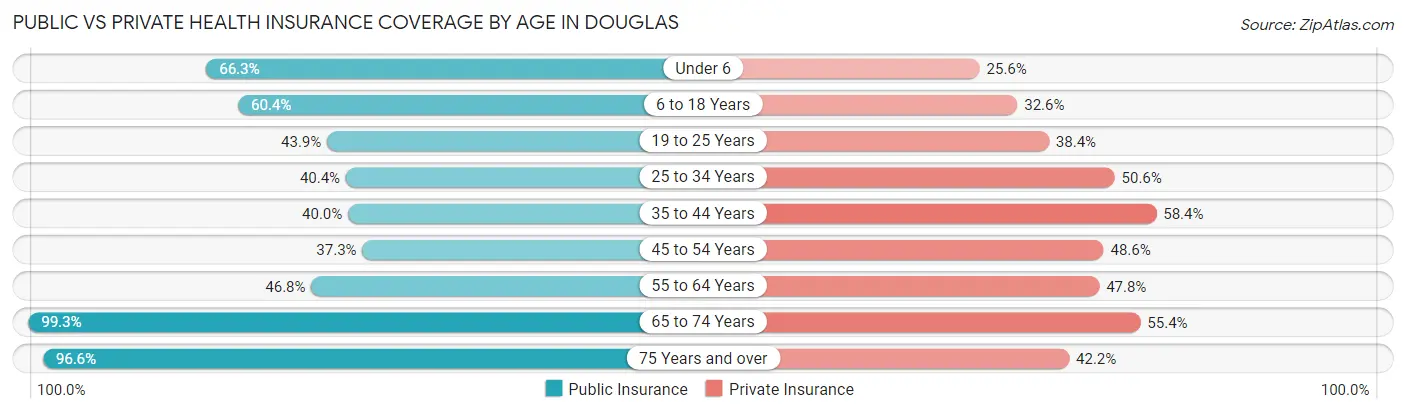
| Age Bracket | Public Insurance | Private Insurance |
| Under 6 | 966 (66.3%) | 373 (25.6%) |
| 6 to 18 Years | 1,572 (60.4%) | 848 (32.6%) |
| 19 to 25 Years | 624 (43.9%) | 547 (38.4%) |
| 25 to 34 Years | 694 (40.4%) | 871 (50.6%) |
| 35 to 44 Years | 479 (40.0%) | 700 (58.4%) |
| 45 to 54 Years | 423 (37.3%) | 551 (48.6%) |
| 55 to 64 Years | 694 (46.8%) | 709 (47.8%) |
| 65 to 74 Years | 1,290 (99.3%) | 720 (55.4%) |
| 75 Years and over | 767 (96.6%) | 335 (42.2%) |
| Total | 7,509 (57.3%) | 5,654 (43.1%) |
Disability Status by Sex by Age in Douglas
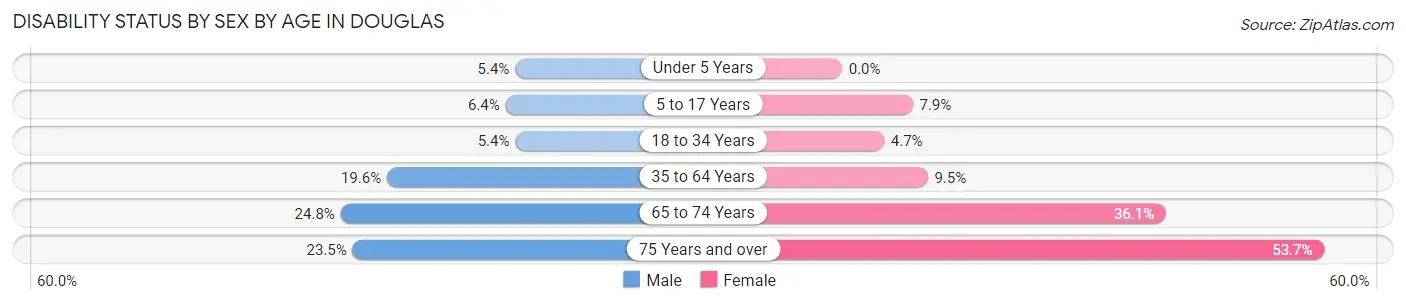
| Age Bracket | Male | Female |
| Under 5 Years | 40 (5.4%) | 0 (0.0%) |
| 5 to 17 Years | 79 (6.4%) | 89 (7.9%) |
| 18 to 34 Years | 109 (5.3%) | 70 (4.7%) |
| 35 to 64 Years | 336 (19.6%) | 201 (9.5%) |
| 65 to 74 Years | 123 (24.8%) | 290 (36.1%) |
| 75 Years and over | 92 (23.5%) | 216 (53.7%) |
Disability Class by Sex by Age in Douglas
Disability Class: Hearing Difficulty
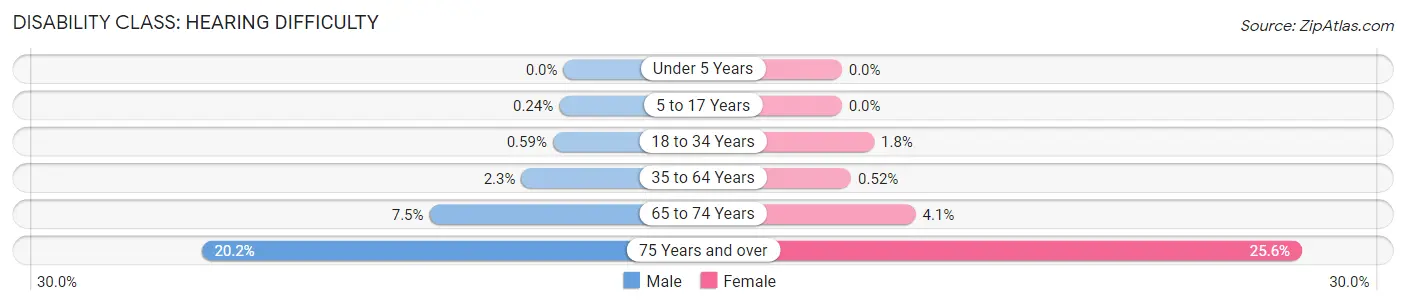
| Age Bracket | Male | Female |
| Under 5 Years | 0 (0.0%) | 0 (0.0%) |
| 5 to 17 Years | 3 (0.2%) | 0 (0.0%) |
| 18 to 34 Years | 12 (0.6%) | 27 (1.8%) |
| 35 to 64 Years | 40 (2.3%) | 11 (0.5%) |
| 65 to 74 Years | 37 (7.5%) | 33 (4.1%) |
| 75 Years and over | 79 (20.2%) | 103 (25.6%) |
Disability Class: Vision Difficulty
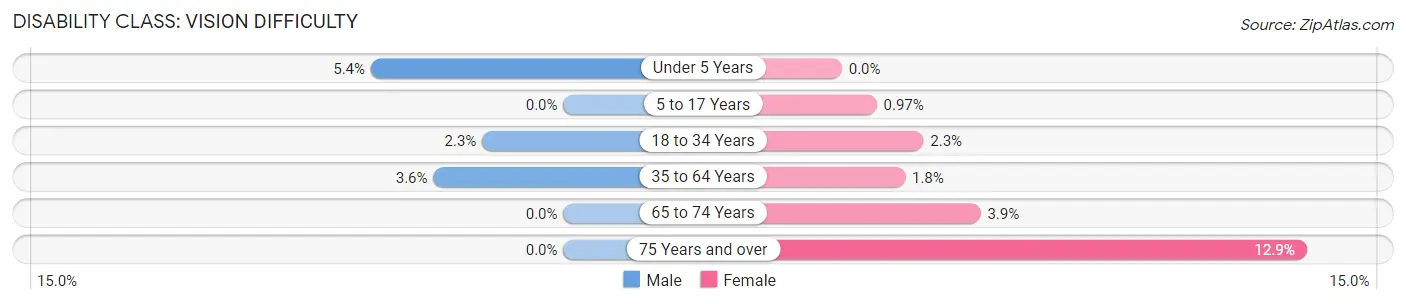
| Age Bracket | Male | Female |
| Under 5 Years | 40 (5.4%) | 0 (0.0%) |
| 5 to 17 Years | 0 (0.0%) | 11 (1.0%) |
| 18 to 34 Years | 46 (2.3%) | 34 (2.3%) |
| 35 to 64 Years | 62 (3.6%) | 37 (1.8%) |
| 65 to 74 Years | 0 (0.0%) | 31 (3.9%) |
| 75 Years and over | 0 (0.0%) | 52 (12.9%) |
Disability Class: Cognitive Difficulty
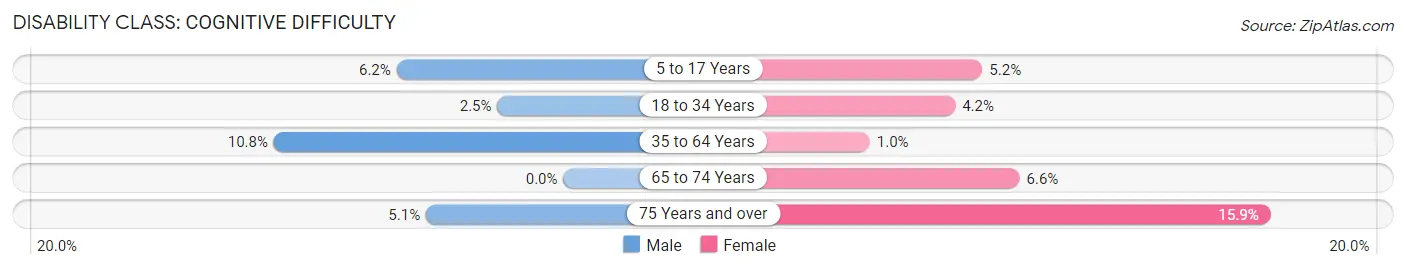
| Age Bracket | Male | Female |
| 5 to 17 Years | 76 (6.2%) | 59 (5.2%) |
| 18 to 34 Years | 50 (2.5%) | 63 (4.2%) |
| 35 to 64 Years | 184 (10.7%) | 22 (1.0%) |
| 65 to 74 Years | 0 (0.0%) | 53 (6.6%) |
| 75 Years and over | 20 (5.1%) | 64 (15.9%) |
Disability Class: Ambulatory Difficulty
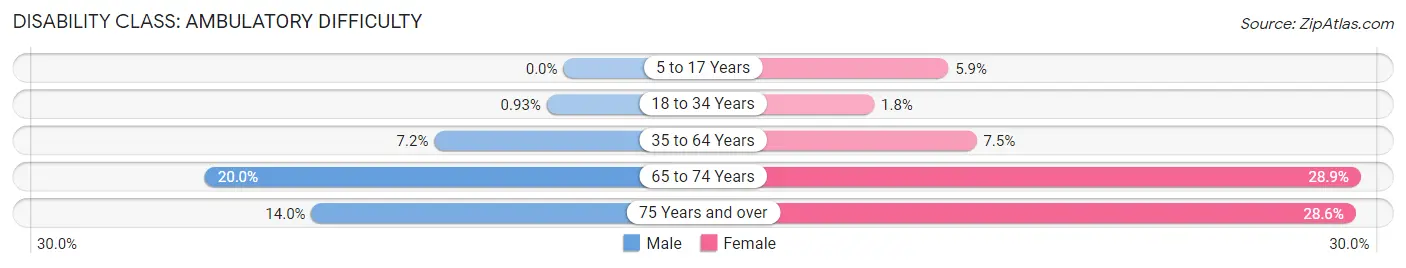
| Age Bracket | Male | Female |
| 5 to 17 Years | 0 (0.0%) | 67 (5.9%) |
| 18 to 34 Years | 19 (0.9%) | 27 (1.8%) |
| 35 to 64 Years | 123 (7.2%) | 158 (7.5%) |
| 65 to 74 Years | 99 (20.0%) | 232 (28.9%) |
| 75 Years and over | 55 (14.0%) | 115 (28.6%) |
Disability Class: Self-Care Difficulty
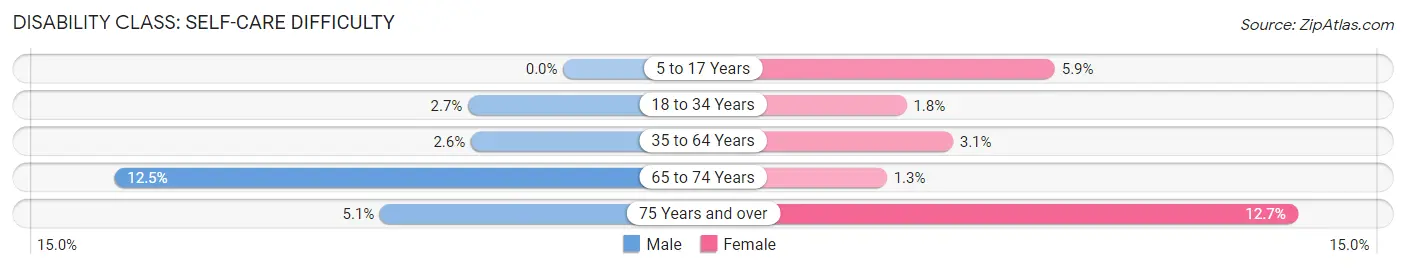
| Age Bracket | Male | Female |
| 5 to 17 Years | 0 (0.0%) | 67 (5.9%) |
| 18 to 34 Years | 54 (2.6%) | 27 (1.8%) |
| 35 to 64 Years | 44 (2.6%) | 65 (3.1%) |
| 65 to 74 Years | 62 (12.5%) | 10 (1.3%) |
| 75 Years and over | 20 (5.1%) | 51 (12.7%) |
Technology Access in Douglas
Computing Device Access in Douglas
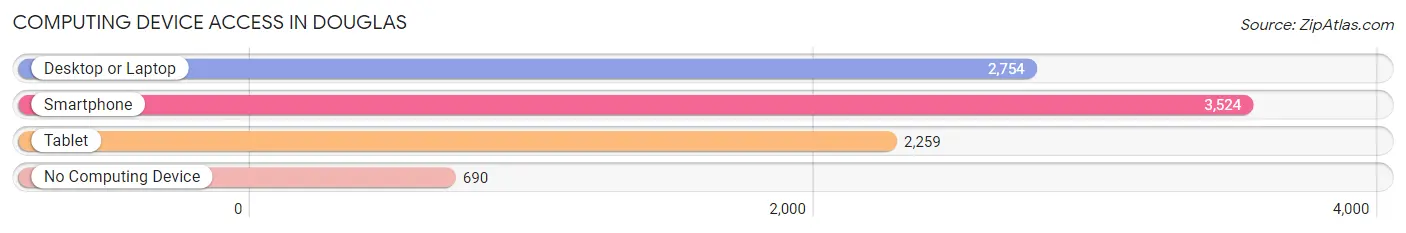
| Device Type | # Households | % Households |
| Desktop or Laptop | 2,754 | 61.5% |
| Smartphone | 3,524 | 78.7% |
| Tablet | 2,259 | 50.5% |
| No Computing Device | 690 | 15.4% |
| Total | 4,476 | 100.0% |
Internet Access in Douglas
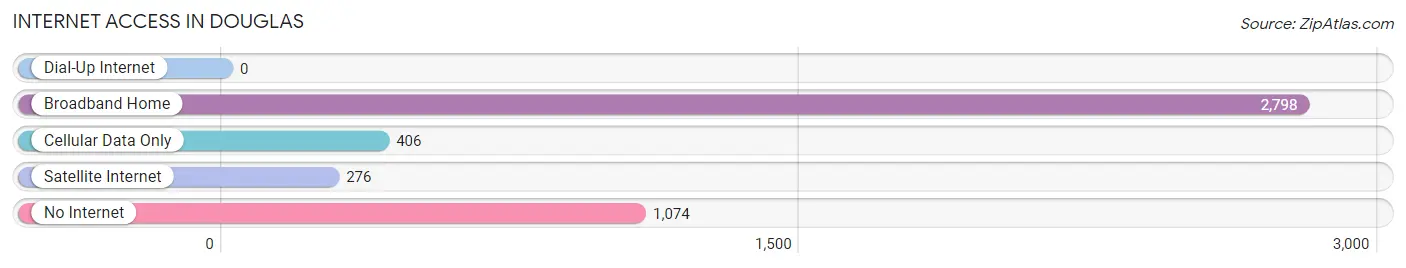
| Internet Type | # Households | % Households |
| Dial-Up Internet | 0 | 0.0% |
| Broadband Home | 2,798 | 62.5% |
| Cellular Data Only | 406 | 9.1% |
| Satellite Internet | 276 | 6.2% |
| No Internet | 1,074 | 24.0% |
| Total | 4,476 | 100.0% |
Douglas Summary
Douglas, Arizona is a city located in Cochise County in the southeastern corner of the state. It is situated on the U.S.-Mexico border, approximately 85 miles southeast of Tucson and 110 miles east of Phoenix. The city was founded in 1901 and named after Dr. James Douglas, a Canadian-born mining engineer who was instrumental in the development of the copper industry in the area. As of the 2010 census, the population of Douglas was 17,378.
Geography
Douglas is located in the Sulphur Springs Valley, which is part of the Basin and Range Province. The city is situated at an elevation of 4,093 feet and is surrounded by the Chiricahua Mountains to the east, the Peloncillo Mountains to the west, and the Huachuca Mountains to the south. The San Bernardino Valley lies to the north of the city. The climate in Douglas is semi-arid, with hot summers and mild winters. The average annual precipitation is 11.5 inches.
Economy
Douglas has a diversified economy that is largely based on agriculture, manufacturing, and tourism. The city is home to several large agricultural operations, including cattle ranches, cotton farms, and citrus groves. The manufacturing sector is dominated by the copper industry, which has been a major employer in the area since the early 1900s. The city is also home to several tourist attractions, including the historic Gadsden Hotel, the San Bernardino National Wildlife Refuge, and the Chiricahua National Monument.
Demographics
As of the 2010 census, the population of Douglas was 17,378. The racial makeup of the city was 73.3% White, 0.7% African American, 0.9% Native American, 0.3% Asian, 0.1% Pacific Islander, 22.2% from other races, and 2.5% from two or more races. Hispanic or Latino of any race were 64.2% of the population. The median household income was $25,945 and the median family income was $30,917.
Conclusion
Douglas, Arizona is a city located in Cochise County in the southeastern corner of the state. It is situated on the U.S.-Mexico border and has a population of 17,378 as of the 2010 census. The city has a diversified economy that is largely based on agriculture, manufacturing, and tourism. The racial makeup of the city is 73.3% White, 0.7% African American, 0.9% Native American, 0.3% Asian, 0.1% Pacific Islander, 22.2% from other races, and 2.5% from two or more races. Hispanic or Latino of any race were 64.2% of the population. Douglas is a vibrant city with a rich history and a bright future.
Common Questions
What is Per Capita Income in Douglas?
Per Capita income in Douglas is $17,909.
What is the Median Family Income in Douglas?
Median Family Income in Douglas is $50,601.
What is the Median Household income in Douglas?
Median Household Income in Douglas is $41,594.
What is Income or Wage Gap in Douglas?
Income or Wage Gap in Douglas is 14.7%.
Women in Douglas earn 85.3 cents for every dollar earned by a man.
What is Family Income Deficit in Douglas?
Family Income Deficit in Douglas is $12,663.
Families that are below poverty line in Douglas earn $12,663 less on average than the poverty threshold level.
What is Inequality or Gini Index in Douglas?
Inequality or Gini Index in Douglas is 0.46.
What is the Total Population of Douglas?
Total Population of Douglas is 16,301.
What is the Total Male Population of Douglas?
Total Male Population of Douglas is 9,783.
What is the Total Female Population of Douglas?
Total Female Population of Douglas is 6,518.
What is the Ratio of Males per 100 Females in Douglas?
There are 150.09 Males per 100 Females in Douglas.
What is the Ratio of Females per 100 Males in Douglas?
There are 66.63 Females per 100 Males in Douglas.
What is the Median Population Age in Douglas?
Median Population Age in Douglas is 33.9 Years.
What is the Average Family Size in Douglas
Average Family Size in Douglas is 3.6 People.
What is the Average Household Size in Douglas
Average Household Size in Douglas is 2.9 People.
How Large is the Labor Force in Douglas?
There are 5,191 People in the Labor Forcein in Douglas.
What is the Percentage of People in the Labor Force in Douglas?
39.8% of People are in the Labor Force in Douglas.
What is the Unemployment Rate in Douglas?
Unemployment Rate in Douglas is 12.0%.