Taylor, AZ Map & Demographics
Taylor Map
Taylor Overview
$24,464
PER CAPITA INCOME
$84,220
AVG FAMILY INCOME
$75,125
AVG HOUSEHOLD INCOME
35.6%
WAGE / INCOME GAP [ % ]
64.4¢/ $1
WAGE / INCOME GAP [ $ ]
$12,838
FAMILY INCOME DEFICIT
0.38
INEQUALITY / GINI INDEX
4,062
TOTAL POPULATION
1,918
MALE POPULATION
2,144
FEMALE POPULATION
89.46
MALES / 100 FEMALES
111.78
FEMALES / 100 MALES
35.5
MEDIAN AGE
3.5
AVG FAMILY SIZE
2.9
AVG HOUSEHOLD SIZE
1,497
LABOR FORCE [ PEOPLE ]
53.2%
PERCENT IN LABOR FORCE
4.9%
UNEMPLOYMENT RATE
Taylor Zip Codes
Taylor Area Codes
Income in Taylor
Income Overview in Taylor
Per Capita Income in Taylor is $24,464, while median incomes of families and households are $84,220 and $75,125 respectively.
| Characteristic | Number | Measure |
| Per Capita Income | 4,062 | $24,464 |
| Median Family Income | 1,075 | $84,220 |
| Mean Family Income | 1,075 | $86,988 |
| Median Household Income | 1,397 | $75,125 |
| Mean Household Income | 1,397 | $73,731 |
| Income Deficit | 1,075 | $12,838 |
| Wage / Income Gap (%) | 4,062 | 35.62% |
| Wage / Income Gap ($) | 4,062 | 64.38¢ per $1 |
| Gini / Inequality Index | 4,062 | 0.38 |
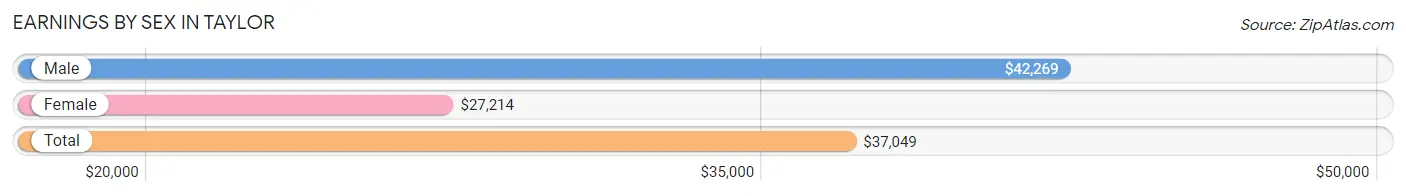
Earnings by Sex in Taylor
Average Earnings in Taylor are $37,049, $42,269 for men and $27,214 for women, a difference of 35.6%.
| Sex | Number | Average Earnings |
| Male | 897 (58.9%) | $42,269 |
| Female | 627 (41.1%) | $27,214 |
| Total | 1,524 (100.0%) | $37,049 |
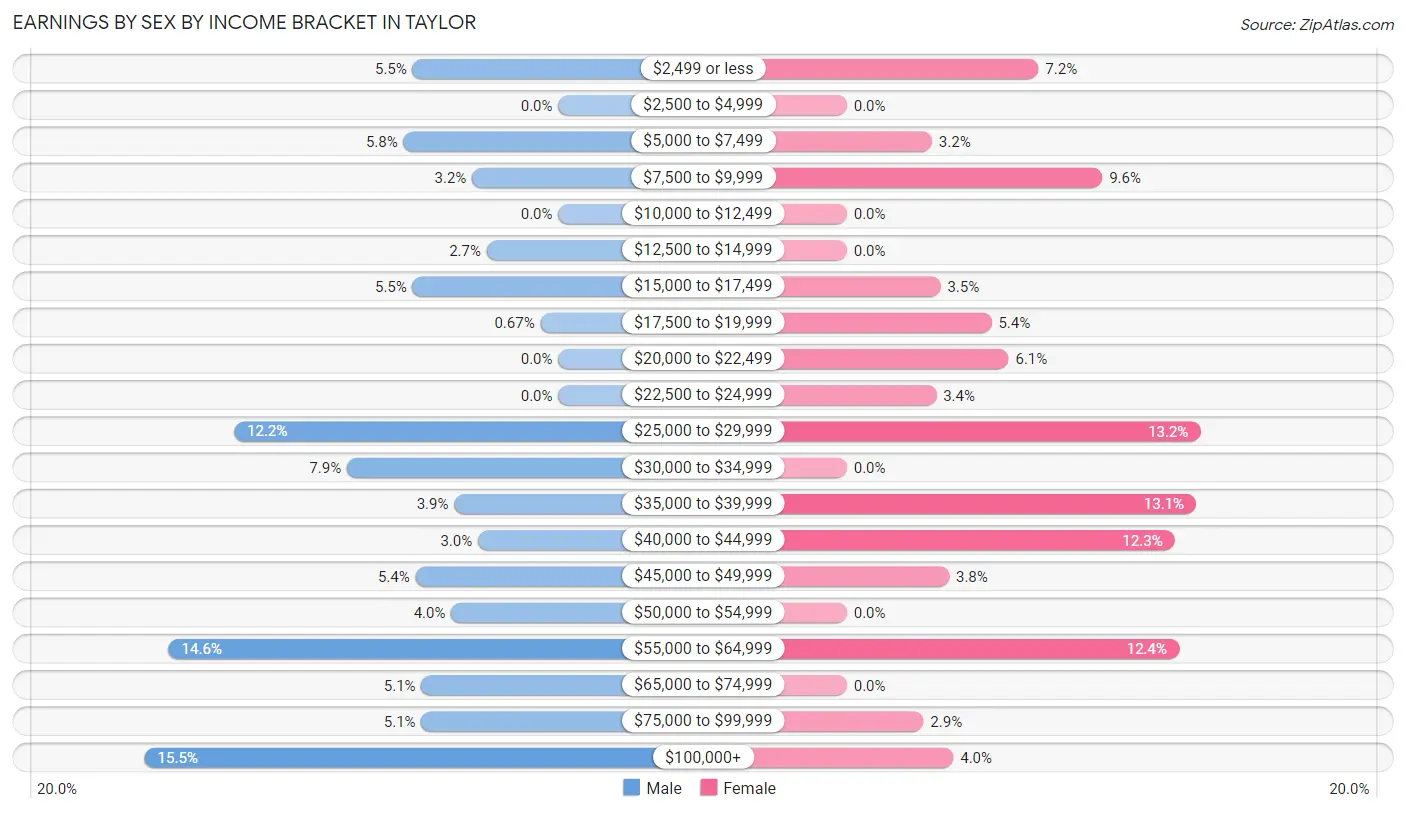
Earnings by Sex by Income Bracket in Taylor
The most common earnings brackets in Taylor are $100,000+ for men (139 | 15.5%) and $25,000 to $29,999 for women (83 | 13.2%).
| Income | Male | Female |
| $2,499 or less | 49 (5.5%) | 45 (7.2%) |
| $2,500 to $4,999 | 0 (0.0%) | 0 (0.0%) |
| $5,000 to $7,499 | 52 (5.8%) | 20 (3.2%) |
| $7,500 to $9,999 | 29 (3.2%) | 60 (9.6%) |
| $10,000 to $12,499 | 0 (0.0%) | 0 (0.0%) |
| $12,500 to $14,999 | 24 (2.7%) | 0 (0.0%) |
| $15,000 to $17,499 | 49 (5.5%) | 22 (3.5%) |
| $17,500 to $19,999 | 6 (0.7%) | 34 (5.4%) |
| $20,000 to $22,499 | 0 (0.0%) | 38 (6.1%) |
| $22,500 to $24,999 | 0 (0.0%) | 21 (3.4%) |
| $25,000 to $29,999 | 109 (12.1%) | 83 (13.2%) |
| $30,000 to $34,999 | 71 (7.9%) | 0 (0.0%) |
| $35,000 to $39,999 | 35 (3.9%) | 82 (13.1%) |
| $40,000 to $44,999 | 27 (3.0%) | 77 (12.3%) |
| $45,000 to $49,999 | 48 (5.3%) | 24 (3.8%) |
| $50,000 to $54,999 | 36 (4.0%) | 0 (0.0%) |
| $55,000 to $64,999 | 131 (14.6%) | 78 (12.4%) |
| $65,000 to $74,999 | 46 (5.1%) | 0 (0.0%) |
| $75,000 to $99,999 | 46 (5.1%) | 18 (2.9%) |
| $100,000+ | 139 (15.5%) | 25 (4.0%) |
| Total | 897 (100.0%) | 627 (100.0%) |
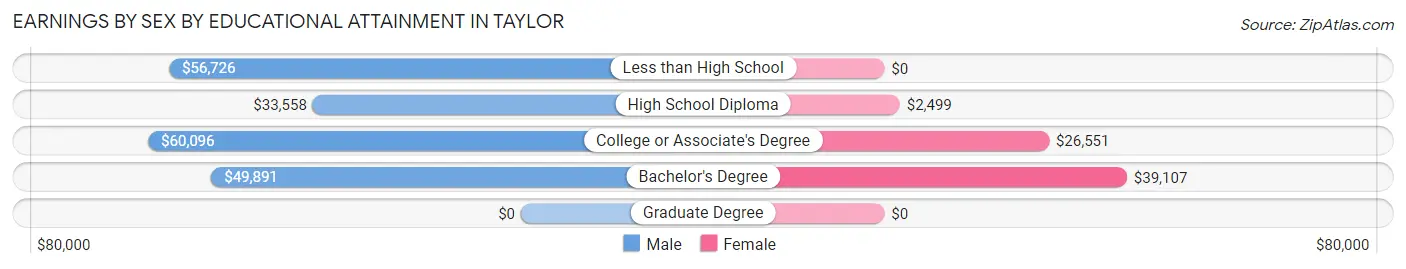
Earnings by Sex by Educational Attainment in Taylor
Average earnings in Taylor are $52,240 for men and $37,213 for women, a difference of 28.8%. Men with an educational attainment of college or associate's degree enjoy the highest average annual earnings of $60,096, while those with high school diploma education earn the least with $33,558. Women with an educational attainment of bachelor's degree earn the most with the average annual earnings of $39,107, while those with high school diploma education have the smallest earnings of $2,499.
| Educational Attainment | Male Income | Female Income |
| Less than High School | $56,726 | $0 |
| High School Diploma | $33,558 | $2,499 |
| College or Associate's Degree | $60,096 | $26,551 |
| Bachelor's Degree | $49,891 | $39,107 |
| Graduate Degree | - | - |
| Total | $52,240 | $37,213 |
Family Income in Taylor
Family Income Brackets in Taylor
According to the Taylor family income data, there are 312 families falling into the $100,000 to $149,999 income range, which is the most common income bracket and makes up 29.0% of all families.
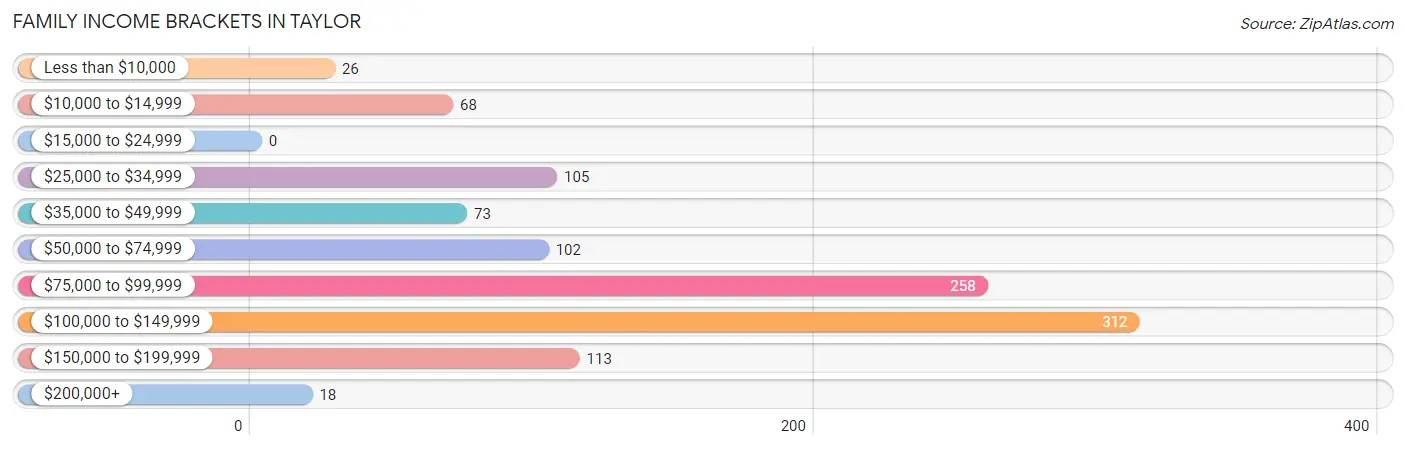
| Income Bracket | # Families | % Families |
| Less than $10,000 | 26 | 2.4% |
| $10,000 to $14,999 | 68 | 6.3% |
| $15,000 to $24,999 | 0 | 0.0% |
| $25,000 to $34,999 | 105 | 9.8% |
| $35,000 to $49,999 | 73 | 6.8% |
| $50,000 to $74,999 | 102 | 9.5% |
| $75,000 to $99,999 | 258 | 24.0% |
| $100,000 to $149,999 | 312 | 29.0% |
| $150,000 to $199,999 | 113 | 10.5% |
| $200,000+ | 18 | 1.7% |
Family Income by Famaliy Size in Taylor
6-person families (75 | 7.0%) account for the highest median family income in Taylor with $118,894 per family, while 2-person families (533 | 49.6%) have the highest median income of $37,962 per family member.
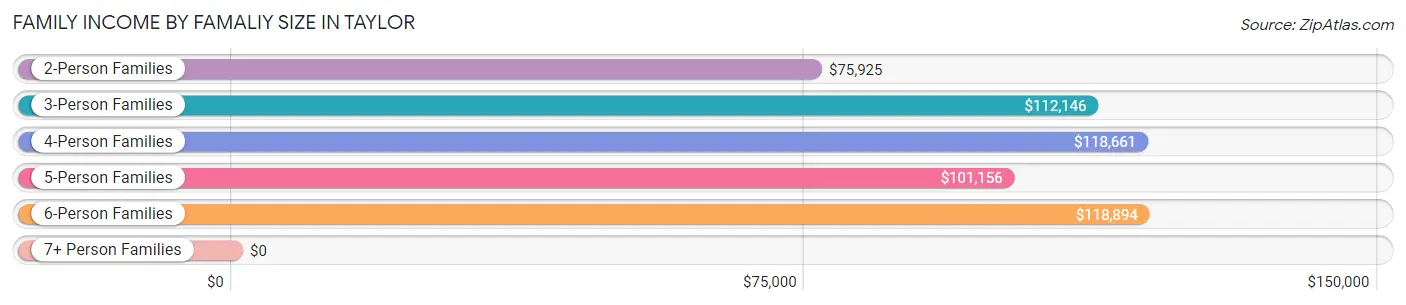
| Income Bracket | # Families | Median Income |
| 2-Person Families | 533 (49.6%) | $75,925 |
| 3-Person Families | 91 (8.5%) | $112,146 |
| 4-Person Families | 113 (10.5%) | $118,661 |
| 5-Person Families | 179 (16.7%) | $101,156 |
| 6-Person Families | 75 (7.0%) | $118,894 |
| 7+ Person Families | 84 (7.8%) | $0 |
| Total | 1,075 (100.0%) | $84,220 |
Family Income by Number of Earners in Taylor
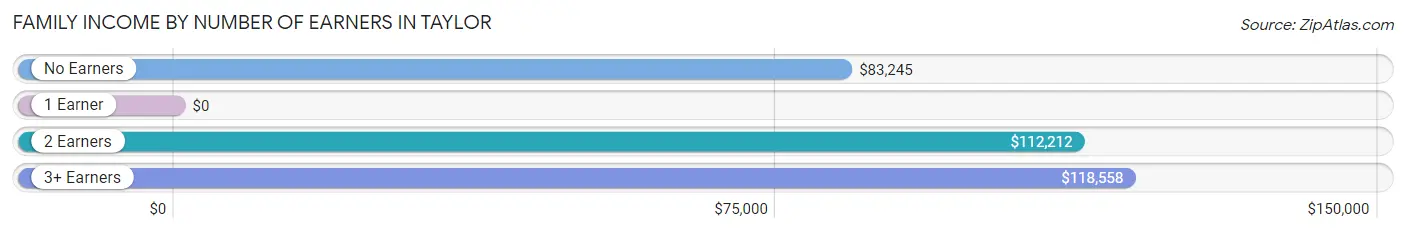
| Number of Earners | # Families | Median Income |
| No Earners | 281 (26.1%) | $83,245 |
| 1 Earner | 348 (32.4%) | $0 |
| 2 Earners | 278 (25.9%) | $112,212 |
| 3+ Earners | 168 (15.6%) | $118,558 |
| Total | 1,075 (100.0%) | $84,220 |
Household Income in Taylor
Household Income Brackets in Taylor
With 312 households falling in the category, the $100,000 to $149,999 income range is the most frequent in Taylor, accounting for 22.3% of all households. In contrast, only 18 households (1.3%) fall into the $200,000+ income bracket, making it the least populous group.
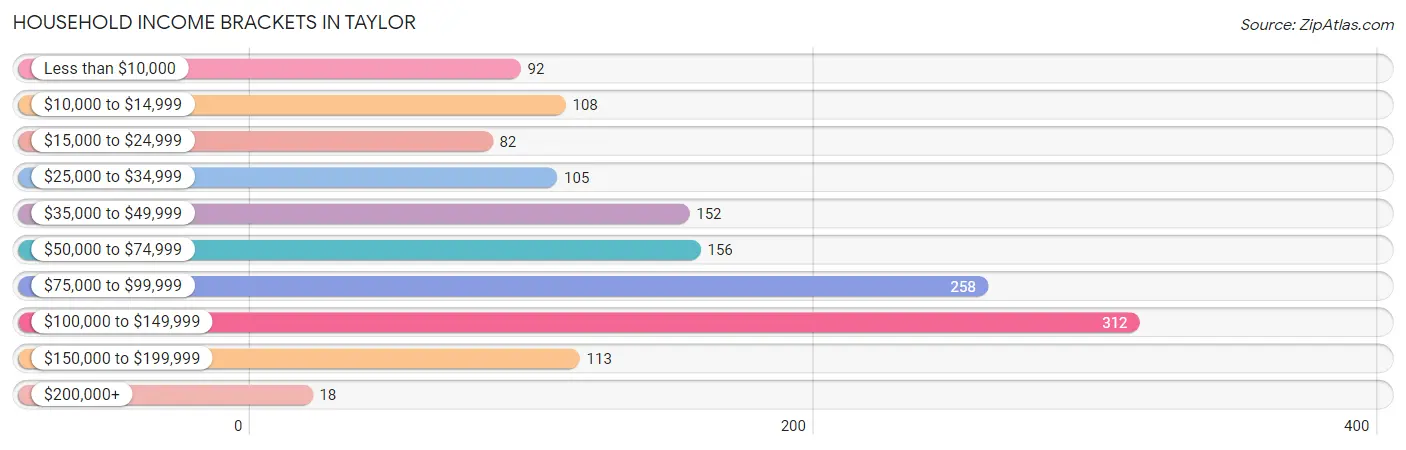
| Income Bracket | # Households | % Households |
| Less than $10,000 | 92 | 6.6% |
| $10,000 to $14,999 | 108 | 7.7% |
| $15,000 to $24,999 | 82 | 5.9% |
| $25,000 to $34,999 | 105 | 7.5% |
| $35,000 to $49,999 | 152 | 10.9% |
| $50,000 to $74,999 | 156 | 11.2% |
| $75,000 to $99,999 | 258 | 18.5% |
| $100,000 to $149,999 | 312 | 22.3% |
| $150,000 to $199,999 | 113 | 8.1% |
| $200,000+ | 18 | 1.3% |
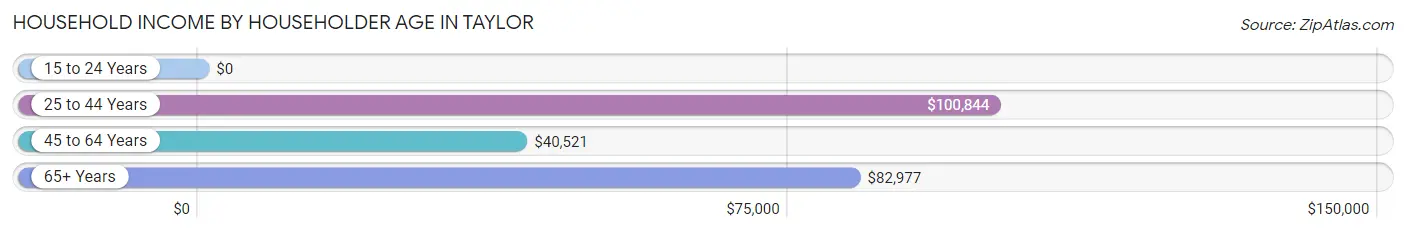
Household Income by Householder Age in Taylor
The median household income in Taylor is $75,125, with the highest median household income of $100,844 found in the 25 to 44 years age bracket for the primary householder. A total of 439 households (31.4%) fall into this category. Meanwhile, the 15 to 24 years age bracket for the primary householder has the lowest median household income of $0, with 63 households (4.5%) in this group.
| Income Bracket | # Households | Median Income |
| 15 to 24 Years | 63 (4.5%) | $0 |
| 25 to 44 Years | 439 (31.4%) | $100,844 |
| 45 to 64 Years | 486 (34.8%) | $40,521 |
| 65+ Years | 409 (29.3%) | $82,977 |
| Total | 1,397 (100.0%) | $75,125 |
Poverty in Taylor
Income Below Poverty by Sex and Age in Taylor
With 13.2% poverty level for males and 15.2% for females among the residents of Taylor, 15 year old males and 25 to 34 year old females are the most vulnerable to poverty, with 28 males (50.0%) and 76 females (49.0%) in their respective age groups living below the poverty level.
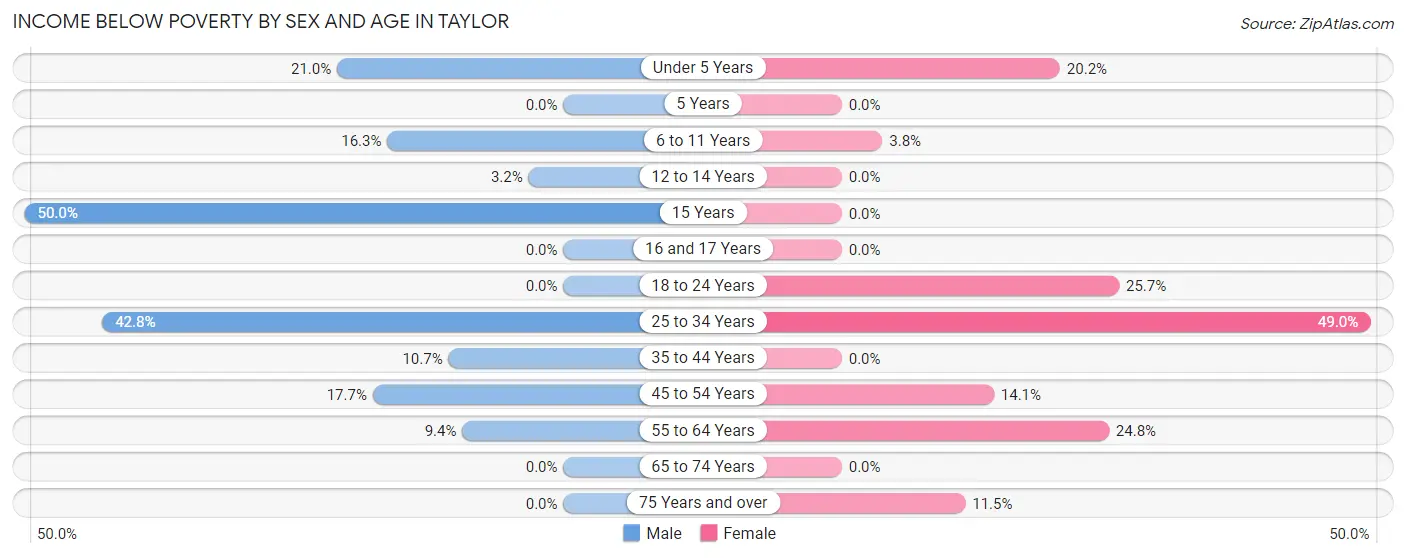
| Age Bracket | Male | Female |
| Under 5 Years | 21 (21.0%) | 67 (20.2%) |
| 5 Years | 0 (0.0%) | 0 (0.0%) |
| 6 to 11 Years | 33 (16.3%) | 8 (3.8%) |
| 12 to 14 Years | 7 (3.2%) | 0 (0.0%) |
| 15 Years | 28 (50.0%) | 0 (0.0%) |
| 16 and 17 Years | 0 (0.0%) | 0 (0.0%) |
| 18 to 24 Years | 0 (0.0%) | 44 (25.7%) |
| 25 to 34 Years | 89 (42.8%) | 76 (49.0%) |
| 35 to 44 Years | 26 (10.7%) | 0 (0.0%) |
| 45 to 54 Years | 26 (17.7%) | 23 (14.1%) |
| 55 to 64 Years | 24 (9.4%) | 89 (24.8%) |
| 65 to 74 Years | 0 (0.0%) | 0 (0.0%) |
| 75 Years and over | 0 (0.0%) | 18 (11.5%) |
| Total | 254 (13.2%) | 325 (15.2%) |
Income Above Poverty by Sex and Age in Taylor
According to the poverty statistics in Taylor, males aged 5 years and females aged 5 years are the age groups that are most secure financially, with 100.0% of males and 100.0% of females in these age groups living above the poverty line.
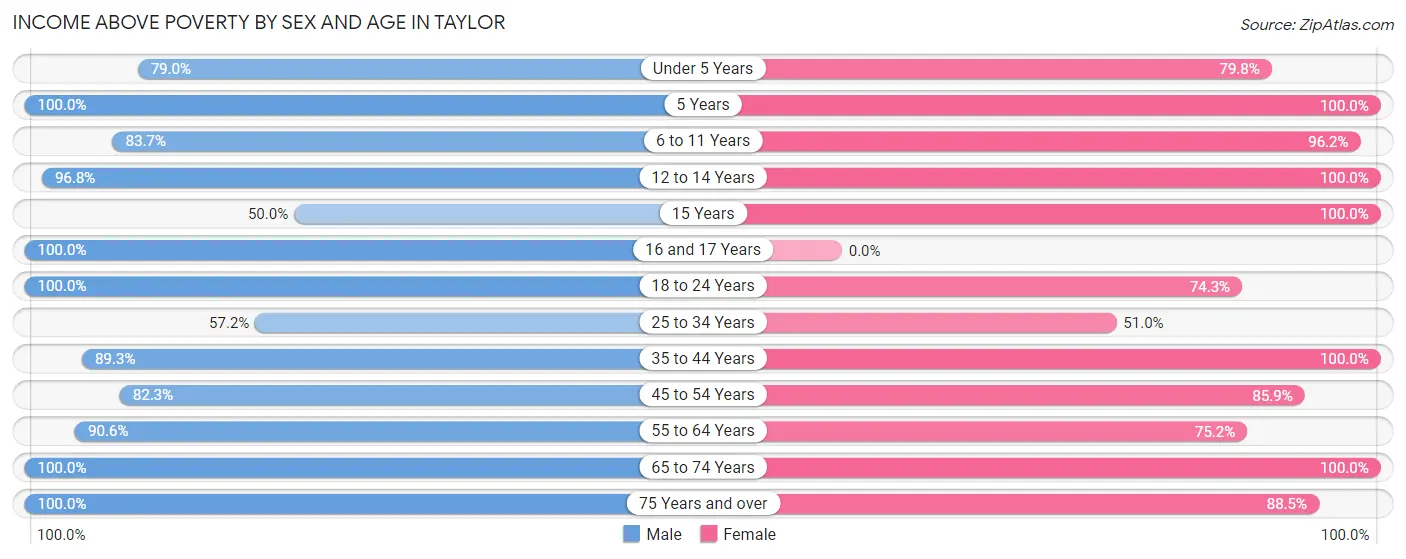
| Age Bracket | Male | Female |
| Under 5 Years | 79 (79.0%) | 264 (79.8%) |
| 5 Years | 21 (100.0%) | 38 (100.0%) |
| 6 to 11 Years | 169 (83.7%) | 205 (96.2%) |
| 12 to 14 Years | 210 (96.8%) | 50 (100.0%) |
| 15 Years | 28 (50.0%) | 20 (100.0%) |
| 16 and 17 Years | 57 (100.0%) | 0 (0.0%) |
| 18 to 24 Years | 192 (100.0%) | 127 (74.3%) |
| 25 to 34 Years | 119 (57.2%) | 79 (51.0%) |
| 35 to 44 Years | 218 (89.3%) | 193 (100.0%) |
| 45 to 54 Years | 121 (82.3%) | 140 (85.9%) |
| 55 to 64 Years | 232 (90.6%) | 270 (75.2%) |
| 65 to 74 Years | 37 (100.0%) | 294 (100.0%) |
| 75 Years and over | 181 (100.0%) | 139 (88.5%) |
| Total | 1,664 (86.8%) | 1,819 (84.8%) |
Income Below Poverty Among Married-Couple Families in Taylor
The poverty statistics for married-couple families in Taylor show that 12.5% or 127 of the total 1,019 families live below the poverty line. Families with 3 or 4 children have the highest poverty rate of 19.8%, comprising of 22 families. On the other hand, families with 1 or 2 children have the lowest poverty rate of 10.0%, which includes 26 families.
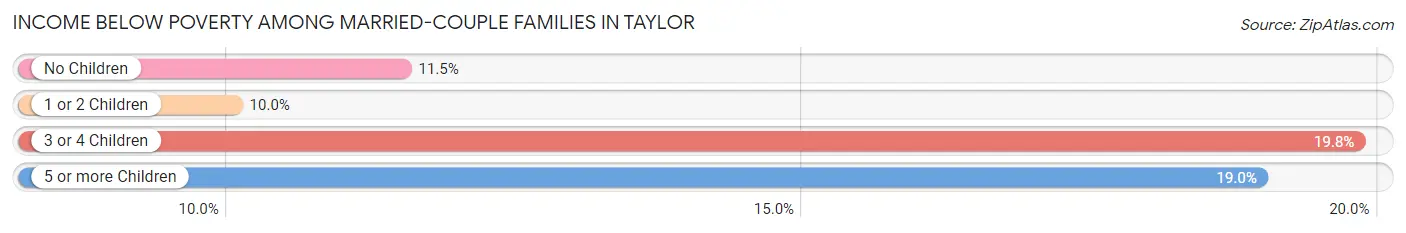
| Children | Above Poverty | Below Poverty |
| No Children | 523 (88.5%) | 68 (11.5%) |
| 1 or 2 Children | 233 (90.0%) | 26 (10.0%) |
| 3 or 4 Children | 89 (80.2%) | 22 (19.8%) |
| 5 or more Children | 47 (81.0%) | 11 (19.0%) |
| Total | 892 (87.5%) | 127 (12.5%) |
Income Below Poverty Among Single-Parent Households in Taylor
| Children | Single Father | Single Mother |
| No Children | 0 (0.0%) | 0 (0.0%) |
| 1 or 2 Children | 0 (0.0%) | 0 (0.0%) |
| 3 or 4 Children | 0 (0.0%) | 0 (0.0%) |
| 5 or more Children | 0 (0.0%) | 0 (0.0%) |
| Total | 0 (0.0%) | 0 (0.0%) |
Income Below Poverty Among Married-Couple vs Single-Parent Households in Taylor
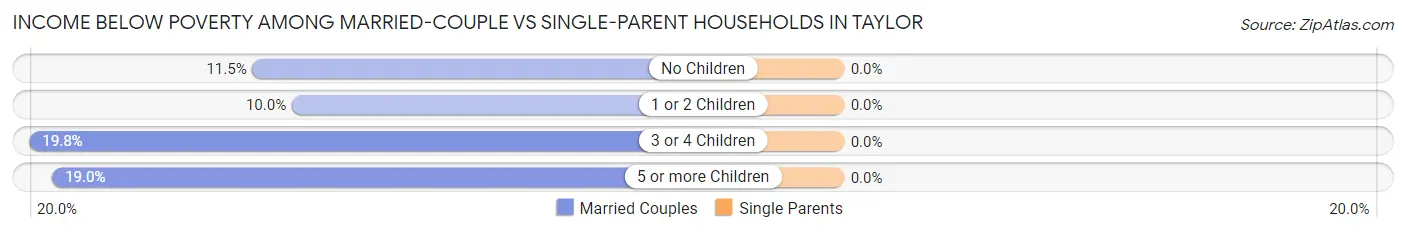
| Children | Married-Couple Families | Single-Parent Households |
| No Children | 68 (11.5%) | 0 (0.0%) |
| 1 or 2 Children | 26 (10.0%) | 0 (0.0%) |
| 3 or 4 Children | 22 (19.8%) | 0 (0.0%) |
| 5 or more Children | 11 (19.0%) | 0 (0.0%) |
| Total | 127 (12.5%) | 0 (0.0%) |
Race in Taylor
The most populous races in Taylor are White / Caucasian (3,592 | 88.4%), Hispanic or Latino (337 | 8.3%), and Two or more Races (151 | 3.7%).
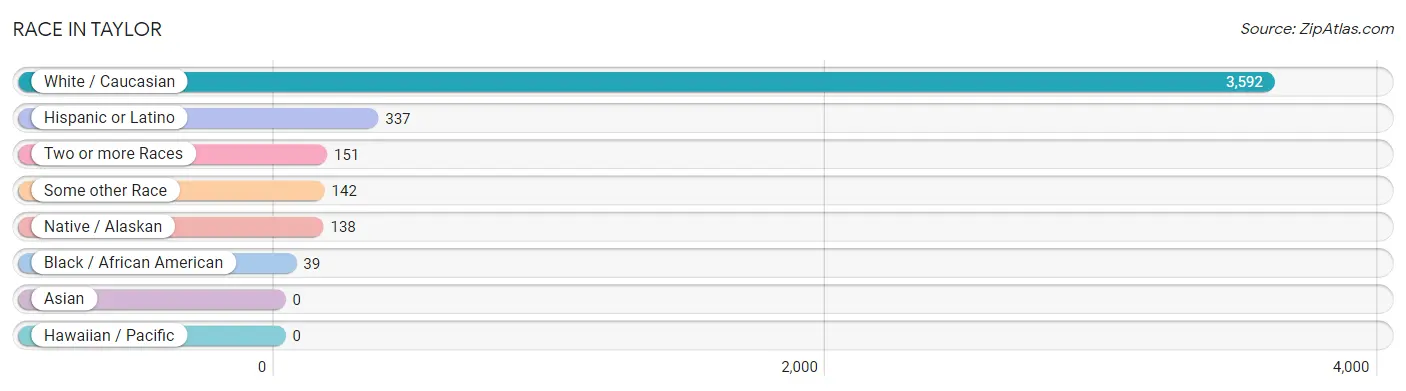
| Race | # Population | % Population |
| Asian | 0 | 0.0% |
| Black / African American | 39 | 1.0% |
| Hawaiian / Pacific | 0 | 0.0% |
| Hispanic or Latino | 337 | 8.3% |
| Native / Alaskan | 138 | 3.4% |
| White / Caucasian | 3,592 | 88.4% |
| Two or more Races | 151 | 3.7% |
| Some other Race | 142 | 3.5% |
| Total | 4,062 | 100.0% |
Ancestry in Taylor
The most populous ancestries reported in Taylor are English (948 | 23.3%), German (664 | 16.4%), Irish (496 | 12.2%), American (417 | 10.3%), and Mexican (296 | 7.3%), together accounting for 69.5% of all Taylor residents.
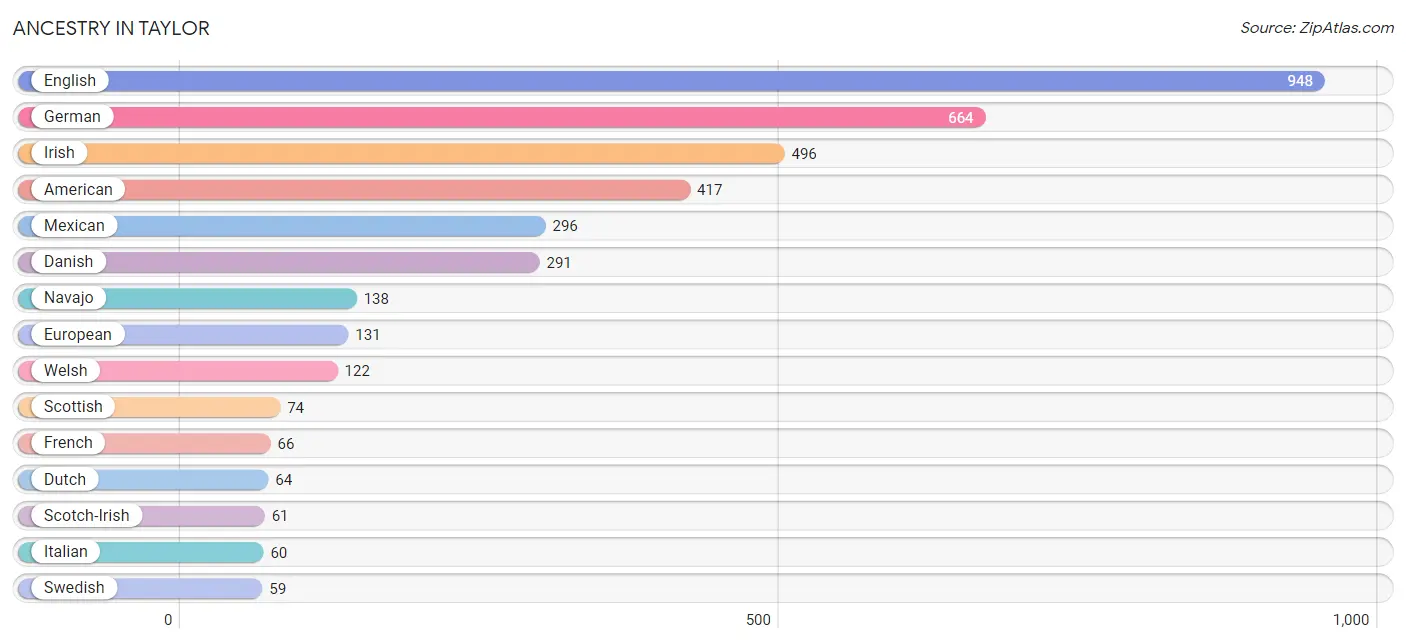
| Ancestry | # Population | % Population |
| American | 417 | 10.3% |
| Danish | 291 | 7.2% |
| Dutch | 64 | 1.6% |
| English | 948 | 23.3% |
| European | 131 | 3.2% |
| French | 66 | 1.6% |
| German | 664 | 16.4% |
| Irish | 496 | 12.2% |
| Italian | 60 | 1.5% |
| Mexican | 296 | 7.3% |
| Navajo | 138 | 3.4% |
| Norwegian | 23 | 0.6% |
| Scotch-Irish | 61 | 1.5% |
| Scottish | 74 | 1.8% |
| Spaniard | 41 | 1.0% |
| Swedish | 59 | 1.5% |
| Swiss | 19 | 0.5% |
| Welsh | 122 | 3.0% | View All 18 Rows |
Immigrants in Taylor
The most numerous immigrant groups reported in Taylor came from Central America (73 | 1.8%), Latin America (73 | 1.8%), Mexico (73 | 1.8%), and Canada (22 | 0.5%), together accounting for 5.9% of all Taylor residents.
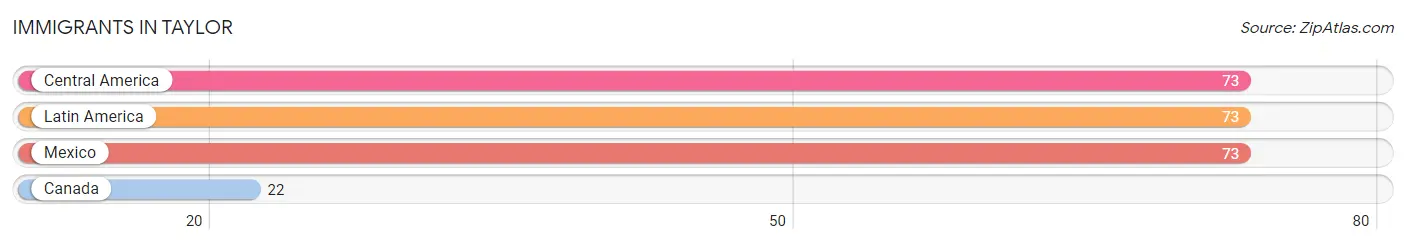
| Immigration Origin | # Population | % Population |
| Canada | 22 | 0.5% |
| Central America | 73 | 1.8% |
| Latin America | 73 | 1.8% |
| Mexico | 73 | 1.8% | View All 4 Rows |
Sex and Age in Taylor
Sex and Age in Taylor
The most populous age groups in Taylor are 10 to 14 Years (267 | 13.9%) for men and Under 5 Years (331 | 15.4%) for women.
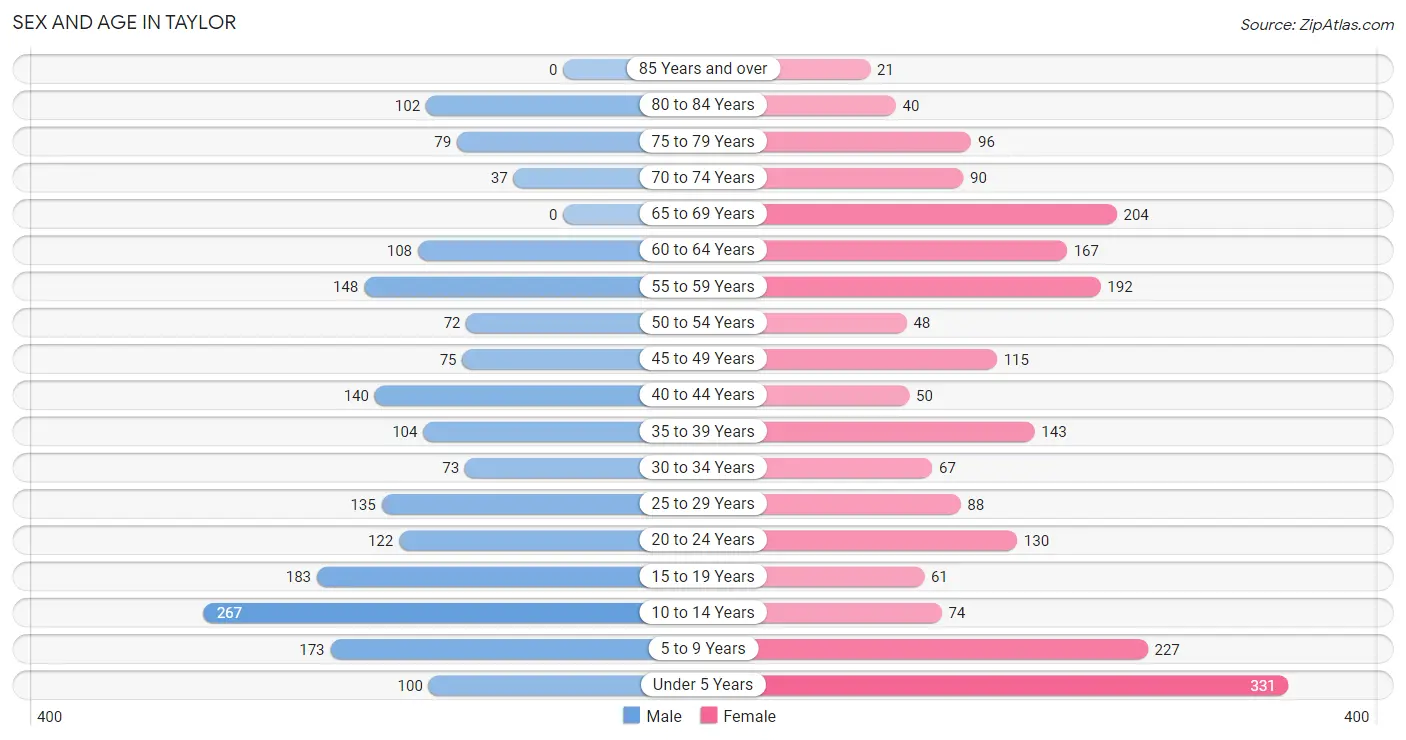
| Age Bracket | Male | Female |
| Under 5 Years | 100 (5.2%) | 331 (15.4%) |
| 5 to 9 Years | 173 (9.0%) | 227 (10.6%) |
| 10 to 14 Years | 267 (13.9%) | 74 (3.5%) |
| 15 to 19 Years | 183 (9.5%) | 61 (2.9%) |
| 20 to 24 Years | 122 (6.4%) | 130 (6.1%) |
| 25 to 29 Years | 135 (7.0%) | 88 (4.1%) |
| 30 to 34 Years | 73 (3.8%) | 67 (3.1%) |
| 35 to 39 Years | 104 (5.4%) | 143 (6.7%) |
| 40 to 44 Years | 140 (7.3%) | 50 (2.3%) |
| 45 to 49 Years | 75 (3.9%) | 115 (5.4%) |
| 50 to 54 Years | 72 (3.7%) | 48 (2.2%) |
| 55 to 59 Years | 148 (7.7%) | 192 (9.0%) |
| 60 to 64 Years | 108 (5.6%) | 167 (7.8%) |
| 65 to 69 Years | 0 (0.0%) | 204 (9.5%) |
| 70 to 74 Years | 37 (1.9%) | 90 (4.2%) |
| 75 to 79 Years | 79 (4.1%) | 96 (4.5%) |
| 80 to 84 Years | 102 (5.3%) | 40 (1.9%) |
| 85 Years and over | 0 (0.0%) | 21 (1.0%) |
| Total | 1,918 (100.0%) | 2,144 (100.0%) |
Families and Households in Taylor
Median Family Size in Taylor
The median family size in Taylor is 3.46 persons per family, with single male/father families (23 | 2.1%) accounting for the largest median family size of 5.96 persons per family. On the other hand, single female/mother families (33 | 3.1%) represent the smallest median family size with 3.18 persons per family.
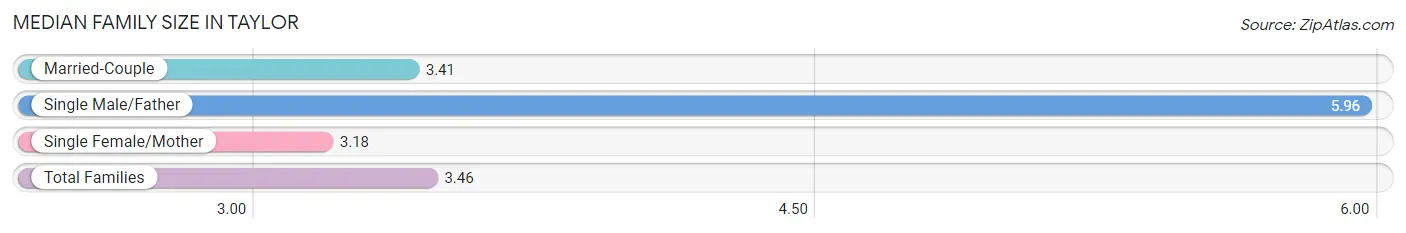
| Family Type | # Families | Family Size |
| Married-Couple | 1,019 (94.8%) | 3.41 |
| Single Male/Father | 23 (2.1%) | 5.96 |
| Single Female/Mother | 33 (3.1%) | 3.18 |
| Total Families | 1,075 (100.0%) | 3.46 |
Median Household Size in Taylor
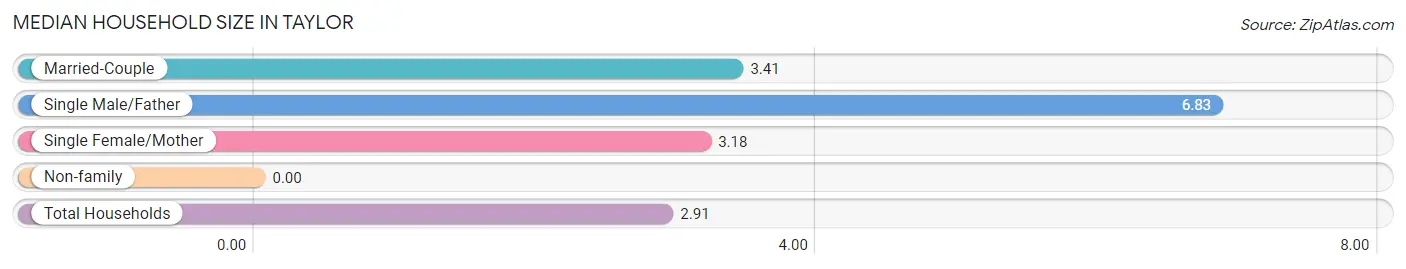
| Household Type | # Households | Household Size |
| Married-Couple | 1,019 (72.9%) | 3.41 |
| Single Male/Father | 23 (1.7%) | 6.83 |
| Single Female/Mother | 33 (2.4%) | 3.18 |
| Non-family | 322 (23.1%) | - |
| Total Households | 1,397 (100.0%) | 2.91 |
Household Size by Marriage Status in Taylor
Out of a total of 1,397 households in Taylor, 1,075 (76.9%) are family households, while 322 (23.1%) are nonfamily households. The most numerous type of family households are 2-person households, comprising 533, and the most common type of nonfamily households are 1-person households, comprising 322.
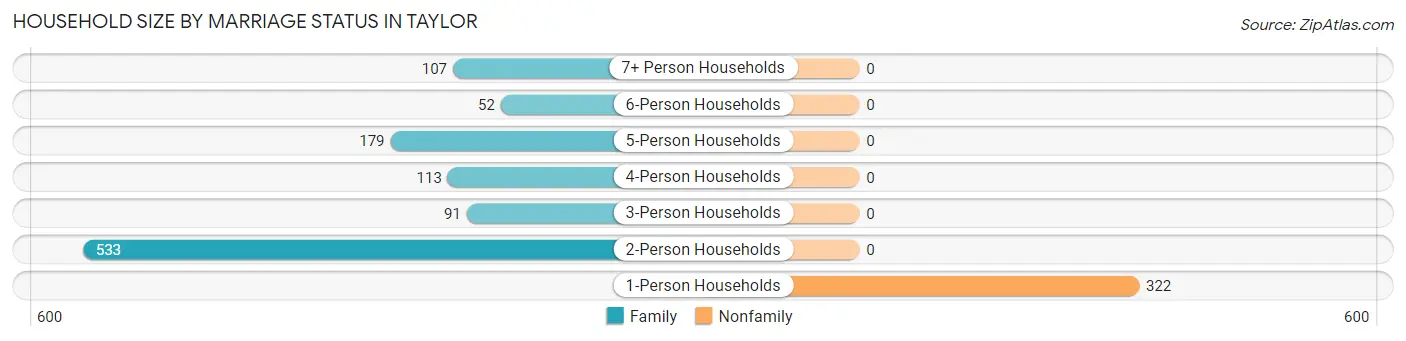
| Household Size | Family Households | Nonfamily Households |
| 1-Person Households | - | 322 (23.1%) |
| 2-Person Households | 533 (38.2%) | 0 (0.0%) |
| 3-Person Households | 91 (6.5%) | 0 (0.0%) |
| 4-Person Households | 113 (8.1%) | 0 (0.0%) |
| 5-Person Households | 179 (12.8%) | 0 (0.0%) |
| 6-Person Households | 52 (3.7%) | 0 (0.0%) |
| 7+ Person Households | 107 (7.7%) | 0 (0.0%) |
| Total | 1,075 (76.9%) | 322 (23.1%) |
Female Fertility in Taylor
Fertility by Age in Taylor
Average fertility rate in Taylor is 34.0 births per 1,000 women. Women in the age bracket of 20 to 34 years have the highest fertility rate with 77.0 births per 1,000 women. Women in the age bracket of 20 to 34 years acount for 100.0% of all women with births.
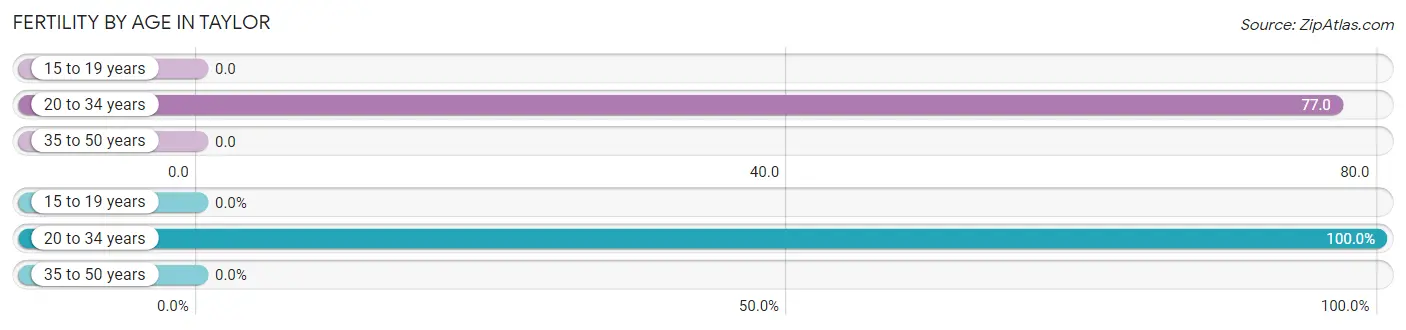
| Age Bracket | Women with Births | Births / 1,000 Women |
| 15 to 19 years | 0 (0.0%) | 0.0 |
| 20 to 34 years | 22 (100.0%) | 77.0 |
| 35 to 50 years | 0 (0.0%) | 0.0 |
| Total | 22 (100.0%) | 34.0 |
Fertility by Age by Marriage Status in Taylor
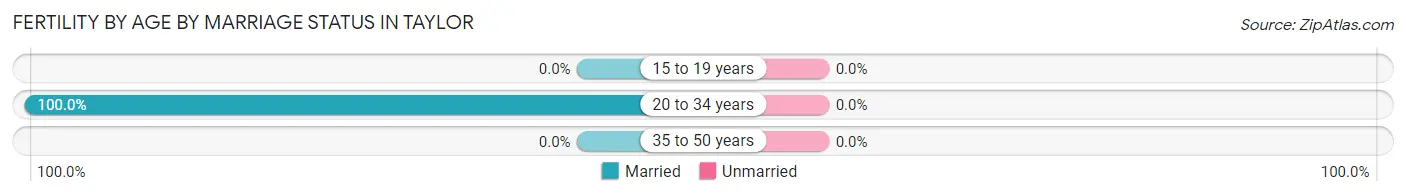
| Age Bracket | Married | Unmarried |
| 15 to 19 years | 0 (0.0%) | 0 (0.0%) |
| 20 to 34 years | 22 (100.0%) | 0 (0.0%) |
| 35 to 50 years | 0 (0.0%) | 0 (0.0%) |
| Total | 22 (100.0%) | 0 (0.0%) |
Fertility by Education in Taylor
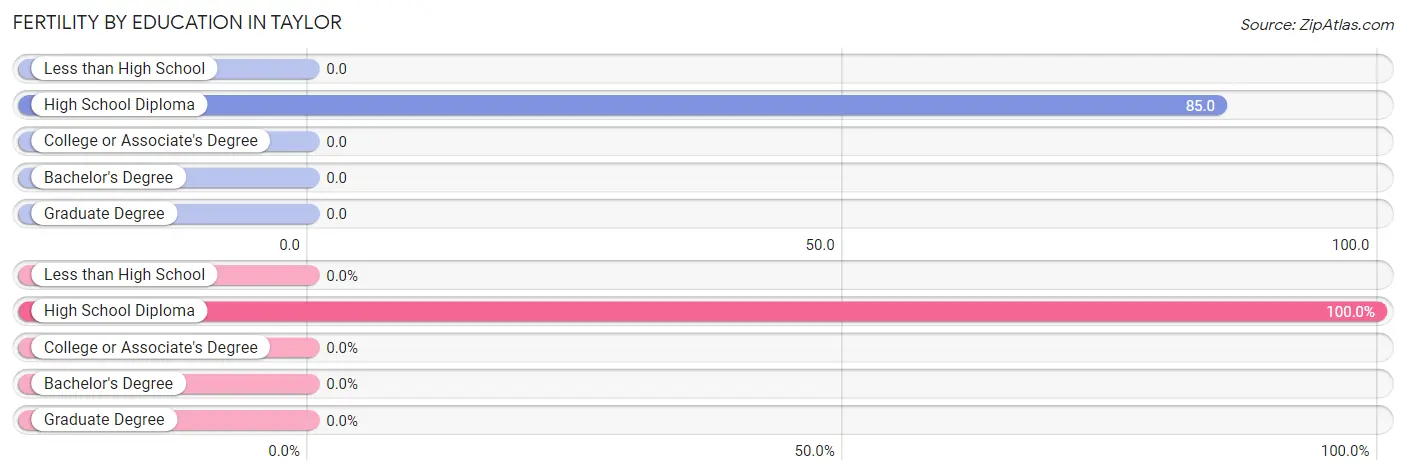
| Educational Attainment | Women with Births | Births / 1,000 Women |
| Less than High School | 0 (0.0%) | 0.0 |
| High School Diploma | 22 (100.0%) | 85.0 |
| College or Associate's Degree | 0 (0.0%) | 0.0 |
| Bachelor's Degree | 0 (0.0%) | 0.0 |
| Graduate Degree | 0 (0.0%) | 0.0 |
| Total | 22 (100.0%) | 34.0 |
Fertility by Education by Marriage Status in Taylor
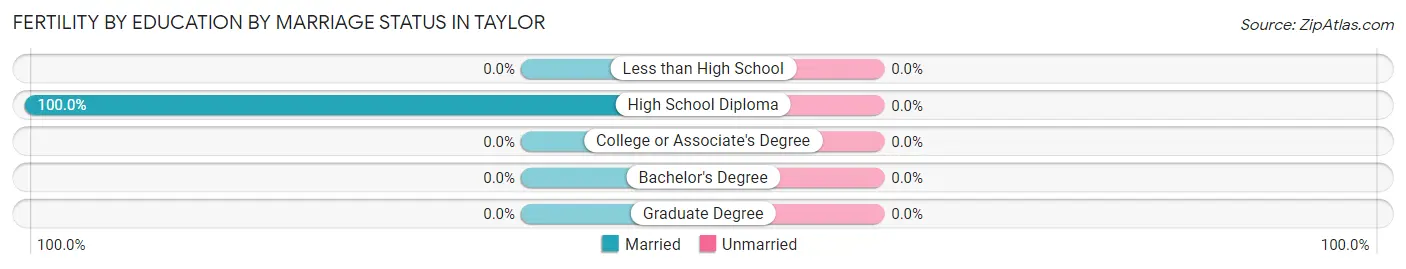
| Educational Attainment | Married | Unmarried |
| Less than High School | 0 (0.0%) | 0 (0.0%) |
| High School Diploma | 22 (100.0%) | 0 (0.0%) |
| College or Associate's Degree | 0 (0.0%) | 0 (0.0%) |
| Bachelor's Degree | 0 (0.0%) | 0 (0.0%) |
| Graduate Degree | 0 (0.0%) | 0 (0.0%) |
| Total | 22 (100.0%) | 0 (0.0%) |
Employment Characteristics in Taylor
Employment by Class of Employer in Taylor
Among the 1,357 employed individuals in Taylor, private company employees (902 | 66.5%), self-employed (not incorporated) (163 | 12.0%), and local government employees (104 | 7.7%) make up the most common classes of employment.
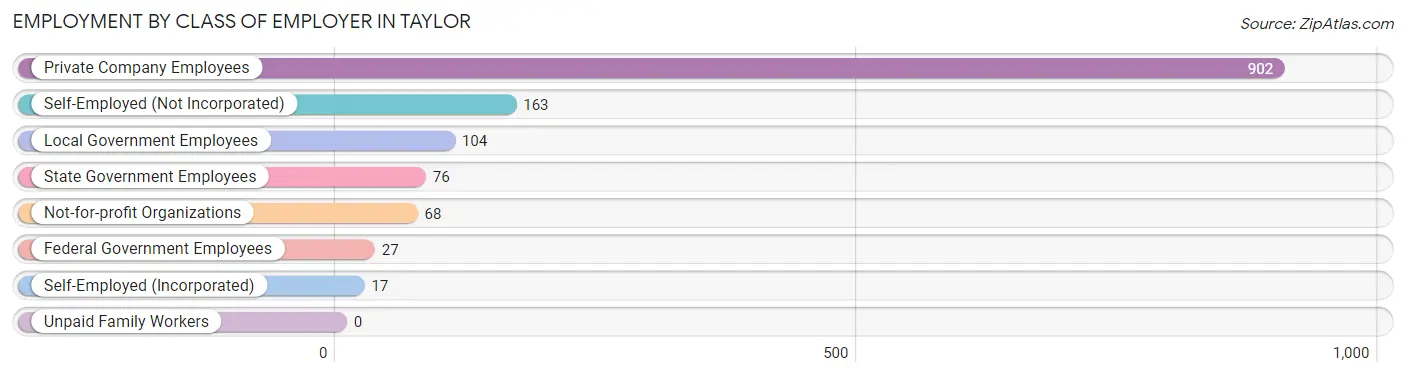
| Employer Class | # Employees | % Employees |
| Private Company Employees | 902 | 66.5% |
| Self-Employed (Incorporated) | 17 | 1.3% |
| Self-Employed (Not Incorporated) | 163 | 12.0% |
| Not-for-profit Organizations | 68 | 5.0% |
| Local Government Employees | 104 | 7.7% |
| State Government Employees | 76 | 5.6% |
| Federal Government Employees | 27 | 2.0% |
| Unpaid Family Workers | 0 | 0.0% |
| Total | 1,357 | 100.0% |
Employment Status by Age in Taylor
According to the labor force statistics for Taylor, out of the total population over 16 years of age (2,814), 53.2% or 1,497 individuals are in the labor force, with 4.9% or 73 of them unemployed. The age group with the highest labor force participation rate is 20 to 24 years, with 90.9% or 229 individuals in the labor force. Within the labor force, the 16 to 19 years age range has the highest percentage of unemployed individuals, with 16.9% or 21 of them being unemployed.
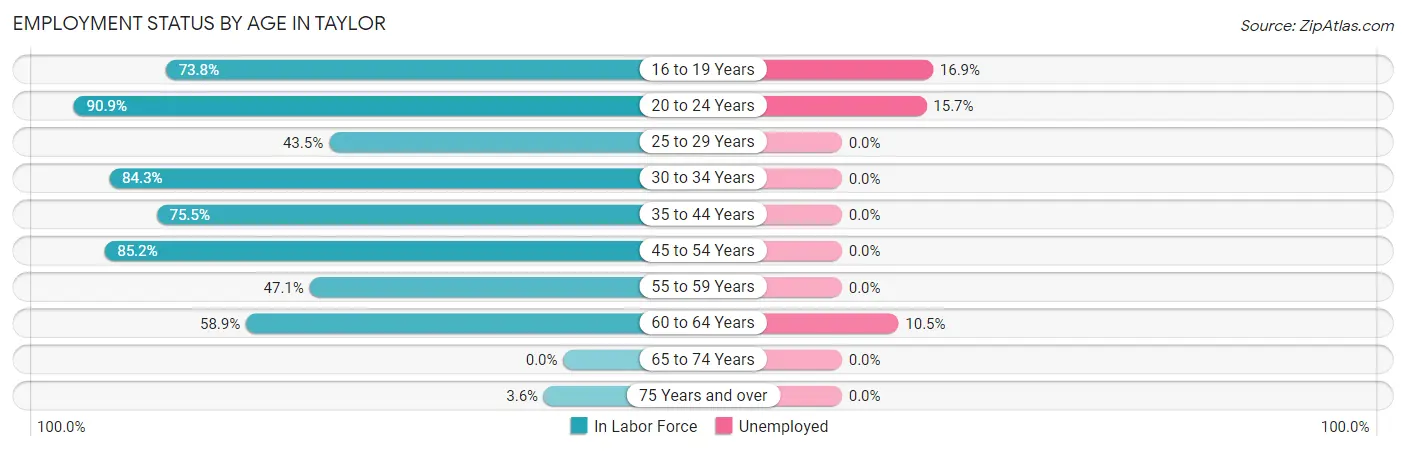
| Age Bracket | In Labor Force | Unemployed |
| 16 to 19 Years | 124 (73.8%) | 21 (16.9%) |
| 20 to 24 Years | 229 (90.9%) | 36 (15.7%) |
| 25 to 29 Years | 97 (43.5%) | 0 (0.0%) |
| 30 to 34 Years | 118 (84.3%) | 0 (0.0%) |
| 35 to 44 Years | 330 (75.5%) | 0 (0.0%) |
| 45 to 54 Years | 264 (85.2%) | 0 (0.0%) |
| 55 to 59 Years | 160 (47.1%) | 0 (0.0%) |
| 60 to 64 Years | 162 (58.9%) | 17 (10.5%) |
| 65 to 74 Years | 0 (0.0%) | 0 (0.0%) |
| 75 Years and over | 12 (3.6%) | 0 (0.0%) |
| Total | 1,497 (53.2%) | 73 (4.9%) |
Employment Status by Educational Attainment in Taylor
According to labor force statistics for Taylor, 65.6% of individuals (1,132) out of the total population between 25 and 64 years of age (1,725) are in the labor force, with 1.5% or 17 of them being unemployed. The group with the highest labor force participation rate are those with the educational attainment of bachelor's degree or higher, with 86.1% or 415 individuals in the labor force. Within the labor force, individuals with college / associate degree education have the highest percentage of unemployment, with 3.3% or 17 of them being unemployed.
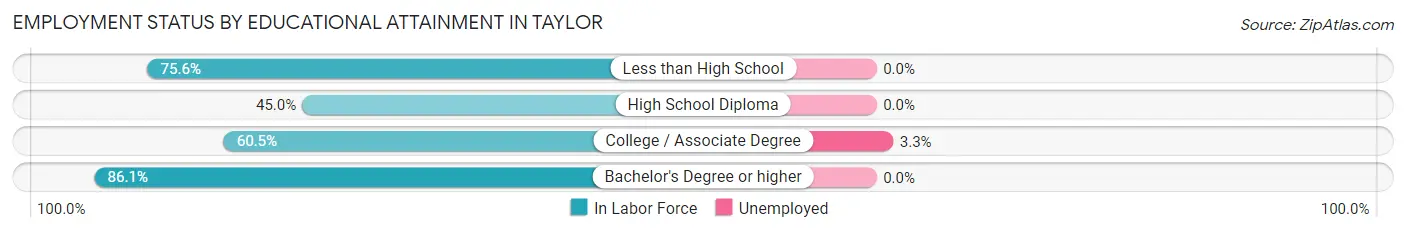
| Educational Attainment | In Labor Force | Unemployed |
| Less than High School | 59 (75.6%) | 0 (0.0%) |
| High School Diploma | 138 (45.0%) | 0 (0.0%) |
| College / Associate Degree | 519 (60.5%) | 28 (3.3%) |
| Bachelor's Degree or higher | 415 (86.1%) | 0 (0.0%) |
| Total | 1,132 (65.6%) | 26 (1.5%) |
Employment Occupations by Sex in Taylor
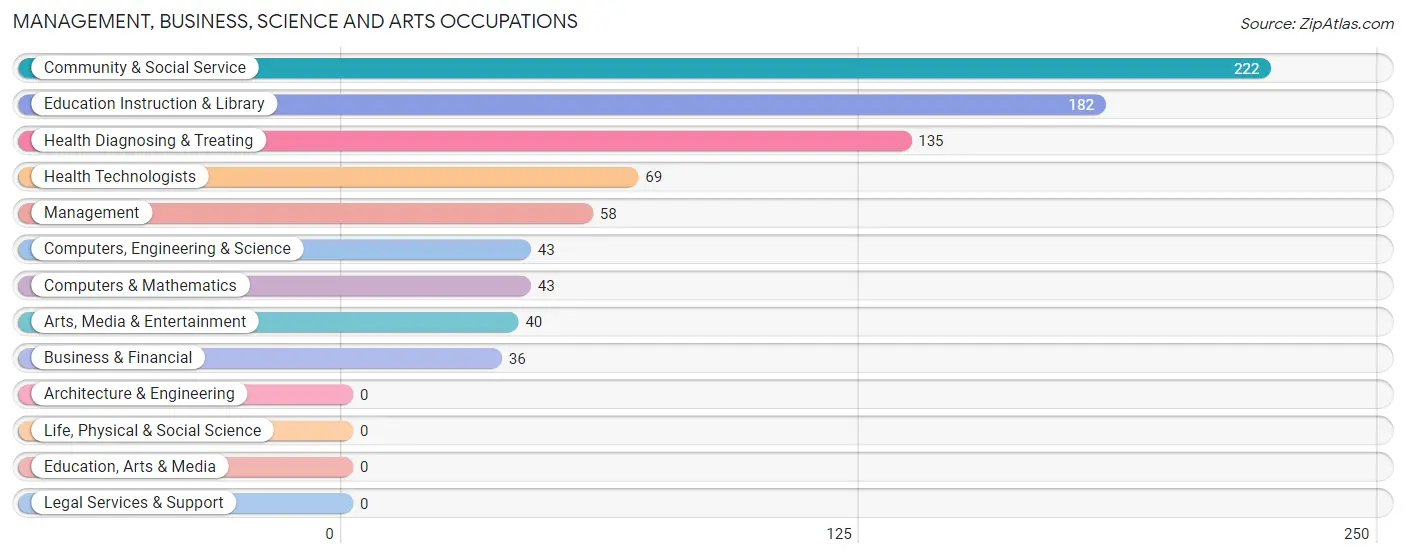
Management, Business, Science and Arts Occupations
The most common Management, Business, Science and Arts occupations in Taylor are Community & Social Service (222 | 15.6%), Education Instruction & Library (182 | 12.8%), Health Diagnosing & Treating (135 | 9.5%), Health Technologists (69 | 4.9%), and Management (58 | 4.1%).
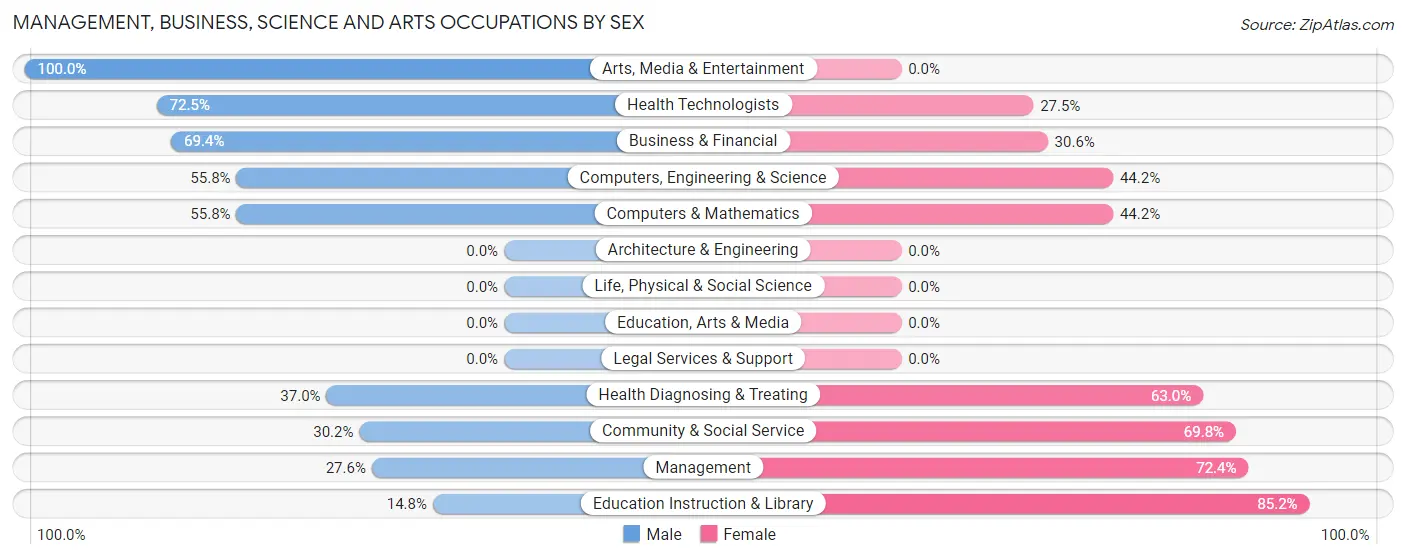
Management, Business, Science and Arts Occupations by Sex
Within the Management, Business, Science and Arts occupations in Taylor, the most male-oriented occupations are Arts, Media & Entertainment (100.0%), Health Technologists (72.5%), and Business & Financial (69.4%), while the most female-oriented occupations are Education Instruction & Library (85.2%), Management (72.4%), and Community & Social Service (69.8%).
| Occupation | Male | Female |
| Management | 16 (27.6%) | 42 (72.4%) |
| Business & Financial | 25 (69.4%) | 11 (30.6%) |
| Computers, Engineering & Science | 24 (55.8%) | 19 (44.2%) |
| Computers & Mathematics | 24 (55.8%) | 19 (44.2%) |
| Architecture & Engineering | 0 (0.0%) | 0 (0.0%) |
| Life, Physical & Social Science | 0 (0.0%) | 0 (0.0%) |
| Community & Social Service | 67 (30.2%) | 155 (69.8%) |
| Education, Arts & Media | 0 (0.0%) | 0 (0.0%) |
| Legal Services & Support | 0 (0.0%) | 0 (0.0%) |
| Education Instruction & Library | 27 (14.8%) | 155 (85.2%) |
| Arts, Media & Entertainment | 40 (100.0%) | 0 (0.0%) |
| Health Diagnosing & Treating | 50 (37.0%) | 85 (63.0%) |
| Health Technologists | 50 (72.5%) | 19 (27.5%) |
| Total (Category) | 182 (36.8%) | 312 (63.2%) |
| Total (Overall) | 818 (57.5%) | 604 (42.5%) |
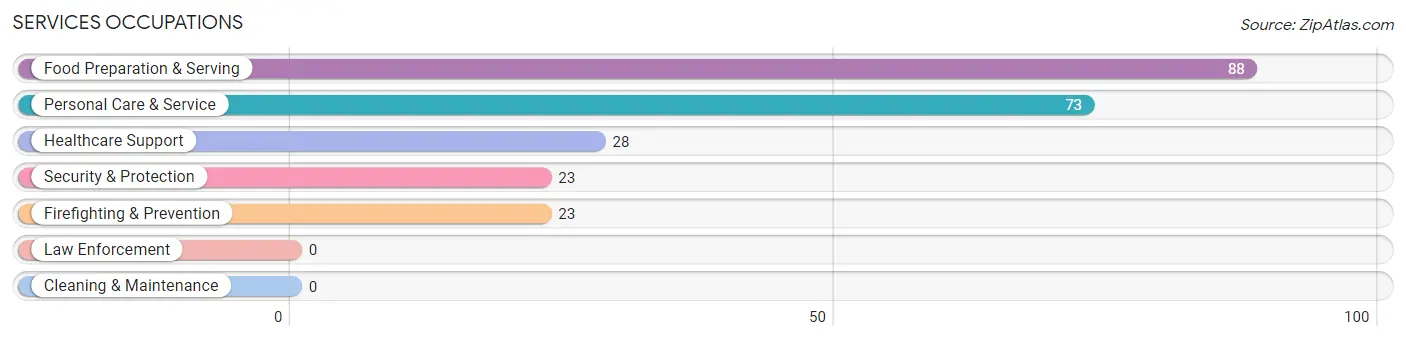
Services Occupations
The most common Services occupations in Taylor are Food Preparation & Serving (88 | 6.2%), Personal Care & Service (73 | 5.1%), Healthcare Support (28 | 2.0%), Security & Protection (23 | 1.6%), and Firefighting & Prevention (23 | 1.6%).
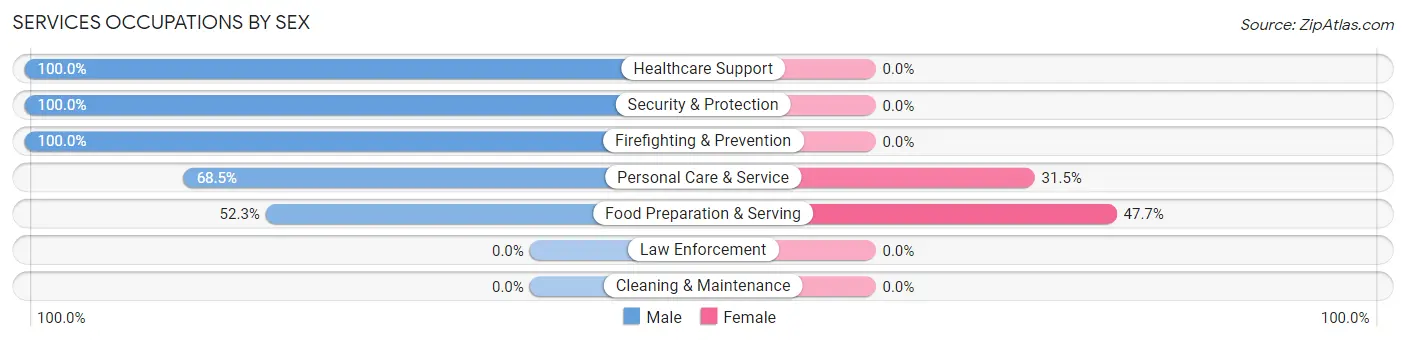
Services Occupations by Sex
Within the Services occupations in Taylor, the most male-oriented occupations are Healthcare Support (100.0%), Security & Protection (100.0%), and Firefighting & Prevention (100.0%), while the most female-oriented occupations are Food Preparation & Serving (47.7%), and Personal Care & Service (31.5%).
| Occupation | Male | Female |
| Healthcare Support | 28 (100.0%) | 0 (0.0%) |
| Security & Protection | 23 (100.0%) | 0 (0.0%) |
| Firefighting & Prevention | 23 (100.0%) | 0 (0.0%) |
| Law Enforcement | 0 (0.0%) | 0 (0.0%) |
| Food Preparation & Serving | 46 (52.3%) | 42 (47.7%) |
| Cleaning & Maintenance | 0 (0.0%) | 0 (0.0%) |
| Personal Care & Service | 50 (68.5%) | 23 (31.5%) |
| Total (Category) | 147 (69.3%) | 65 (30.7%) |
| Total (Overall) | 818 (57.5%) | 604 (42.5%) |
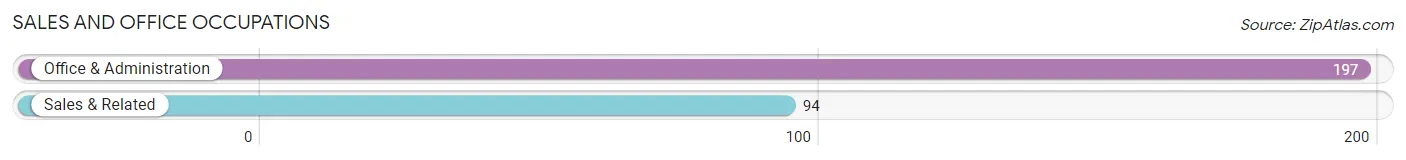
Sales and Office Occupations
The most common Sales and Office occupations in Taylor are Office & Administration (197 | 13.9%), and Sales & Related (94 | 6.6%).
Sales and Office Occupations by Sex
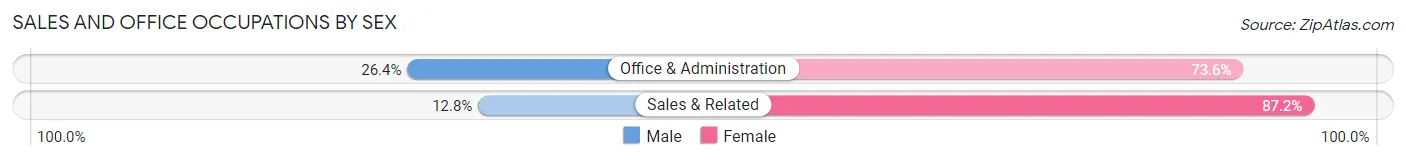
| Occupation | Male | Female |
| Sales & Related | 12 (12.8%) | 82 (87.2%) |
| Office & Administration | 52 (26.4%) | 145 (73.6%) |
| Total (Category) | 64 (22.0%) | 227 (78.0%) |
| Total (Overall) | 818 (57.5%) | 604 (42.5%) |
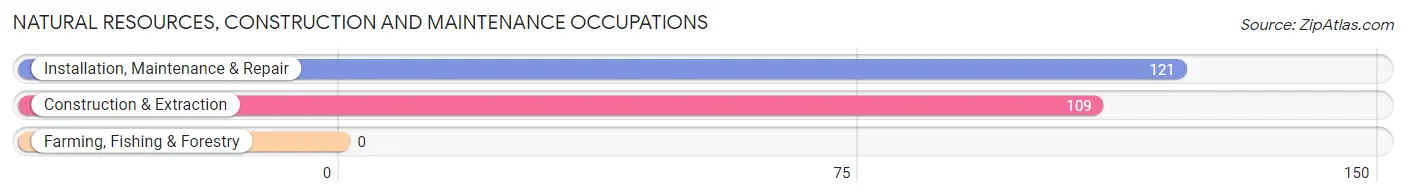
Natural Resources, Construction and Maintenance Occupations
The most common Natural Resources, Construction and Maintenance occupations in Taylor are Installation, Maintenance & Repair (121 | 8.5%), and Construction & Extraction (109 | 7.7%).
Natural Resources, Construction and Maintenance Occupations by Sex
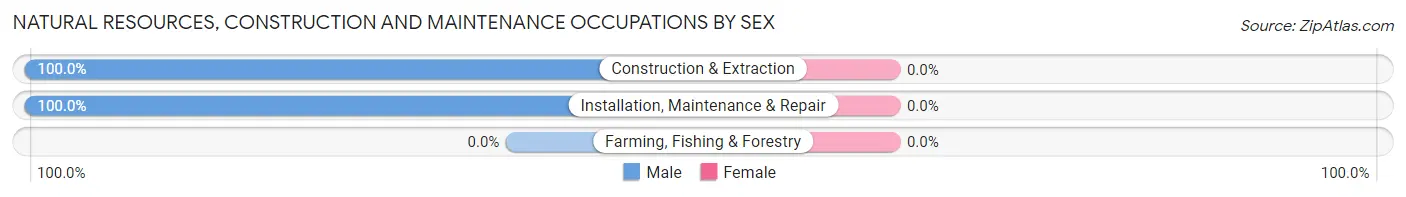
| Occupation | Male | Female |
| Farming, Fishing & Forestry | 0 (0.0%) | 0 (0.0%) |
| Construction & Extraction | 109 (100.0%) | 0 (0.0%) |
| Installation, Maintenance & Repair | 121 (100.0%) | 0 (0.0%) |
| Total (Category) | 230 (100.0%) | 0 (0.0%) |
| Total (Overall) | 818 (57.5%) | 604 (42.5%) |
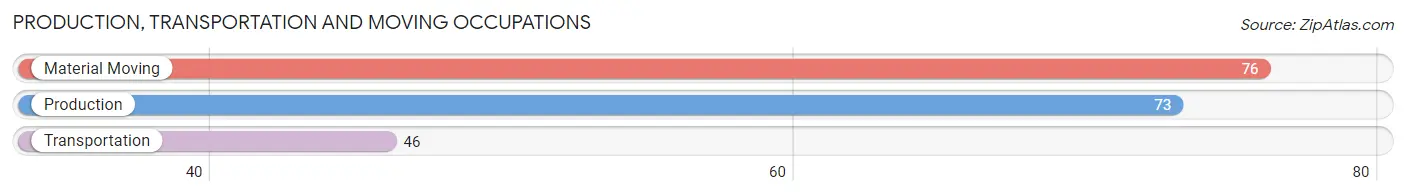
Production, Transportation and Moving Occupations
The most common Production, Transportation and Moving occupations in Taylor are Material Moving (76 | 5.3%), Production (73 | 5.1%), and Transportation (46 | 3.2%).
Production, Transportation and Moving Occupations by Sex
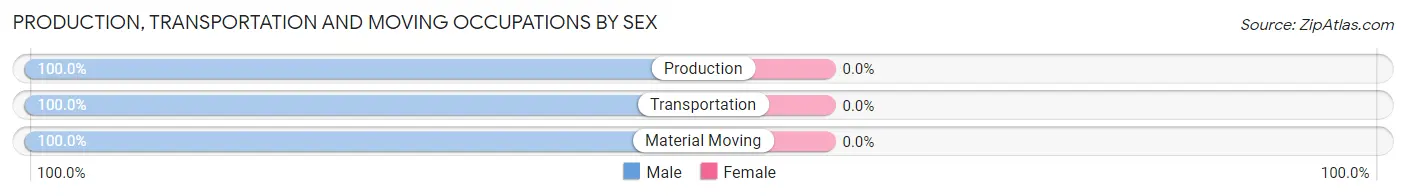
| Occupation | Male | Female |
| Production | 73 (100.0%) | 0 (0.0%) |
| Transportation | 46 (100.0%) | 0 (0.0%) |
| Material Moving | 76 (100.0%) | 0 (0.0%) |
| Total (Category) | 195 (100.0%) | 0 (0.0%) |
| Total (Overall) | 818 (57.5%) | 604 (42.5%) |
Employment Industries by Sex in Taylor
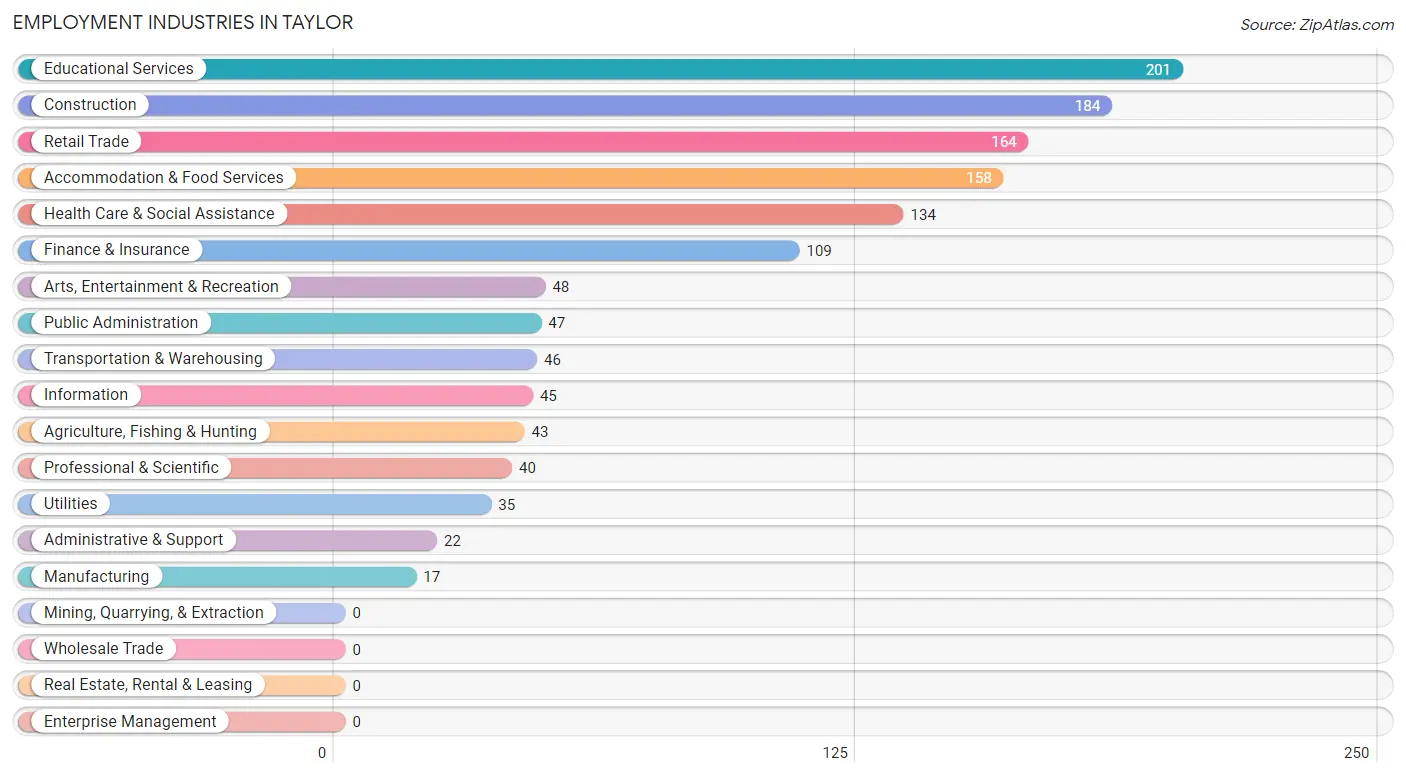
Employment Industries in Taylor
The major employment industries in Taylor include Educational Services (201 | 14.1%), Construction (184 | 12.9%), Retail Trade (164 | 11.5%), Accommodation & Food Services (158 | 11.1%), and Health Care & Social Assistance (134 | 9.4%).
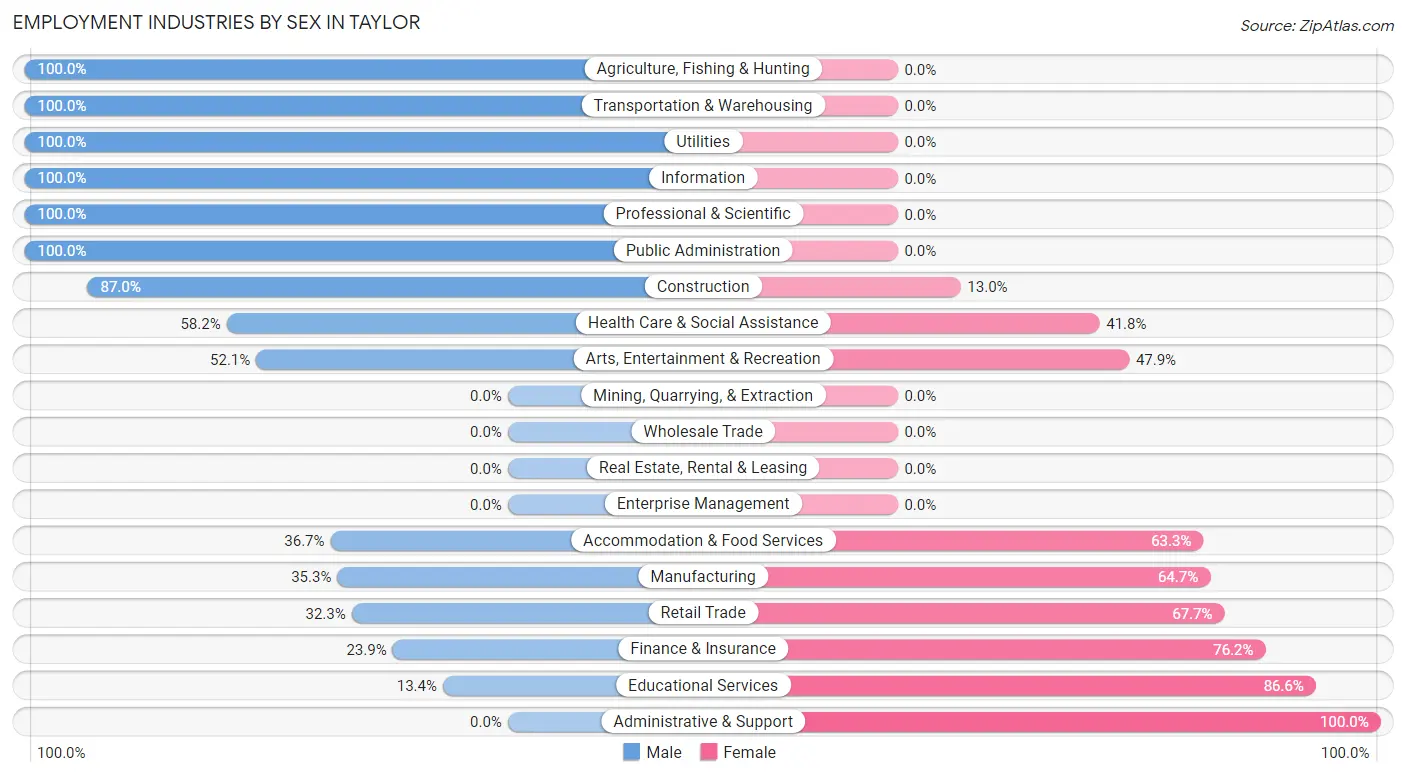
Employment Industries by Sex in Taylor
The Taylor industries that see more men than women are Agriculture, Fishing & Hunting (100.0%), Transportation & Warehousing (100.0%), and Utilities (100.0%), whereas the industries that tend to have a higher number of women are Administrative & Support (100.0%), Educational Services (86.6%), and Finance & Insurance (76.1%).
| Industry | Male | Female |
| Agriculture, Fishing & Hunting | 43 (100.0%) | 0 (0.0%) |
| Mining, Quarrying, & Extraction | 0 (0.0%) | 0 (0.0%) |
| Construction | 160 (87.0%) | 24 (13.0%) |
| Manufacturing | 6 (35.3%) | 11 (64.7%) |
| Wholesale Trade | 0 (0.0%) | 0 (0.0%) |
| Retail Trade | 53 (32.3%) | 111 (67.7%) |
| Transportation & Warehousing | 46 (100.0%) | 0 (0.0%) |
| Utilities | 35 (100.0%) | 0 (0.0%) |
| Information | 45 (100.0%) | 0 (0.0%) |
| Finance & Insurance | 26 (23.8%) | 83 (76.1%) |
| Real Estate, Rental & Leasing | 0 (0.0%) | 0 (0.0%) |
| Professional & Scientific | 40 (100.0%) | 0 (0.0%) |
| Enterprise Management | 0 (0.0%) | 0 (0.0%) |
| Administrative & Support | 0 (0.0%) | 22 (100.0%) |
| Educational Services | 27 (13.4%) | 174 (86.6%) |
| Health Care & Social Assistance | 78 (58.2%) | 56 (41.8%) |
| Arts, Entertainment & Recreation | 25 (52.1%) | 23 (47.9%) |
| Accommodation & Food Services | 58 (36.7%) | 100 (63.3%) |
| Public Administration | 47 (100.0%) | 0 (0.0%) |
| Total | 818 (57.5%) | 604 (42.5%) |
Education in Taylor
School Enrollment in Taylor
The most common levels of schooling among the 930 students in Taylor are elementary school (342 | 36.8%), middle school (295 | 31.7%), and high school (174 | 18.7%).
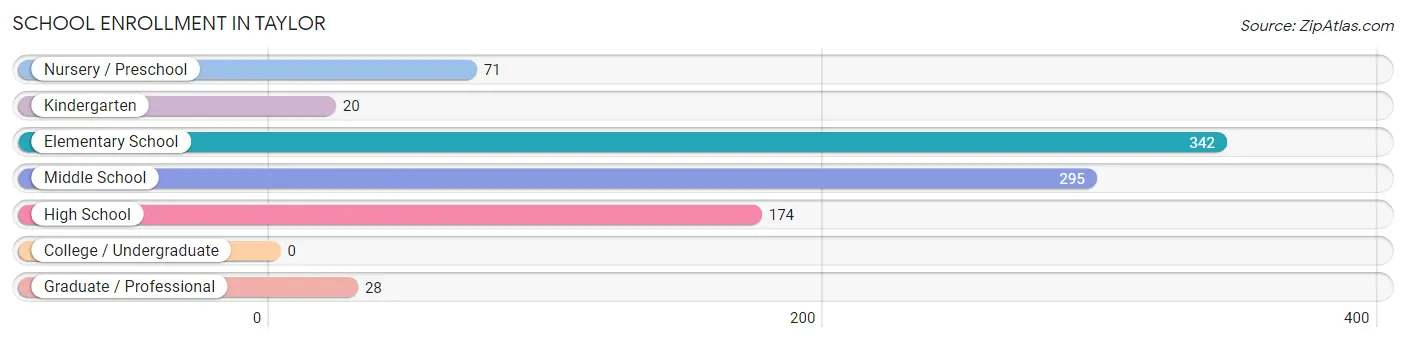
| School Level | # Students | % Students |
| Nursery / Preschool | 71 | 7.6% |
| Kindergarten | 20 | 2.1% |
| Elementary School | 342 | 36.8% |
| Middle School | 295 | 31.7% |
| High School | 174 | 18.7% |
| College / Undergraduate | 0 | 0.0% |
| Graduate / Professional | 28 | 3.0% |
| Total | 930 | 100.0% |
School Enrollment by Age by Funding Source in Taylor
Out of a total of 930 students who are enrolled in schools in Taylor, 192 (20.6%) attend a private institution, while the remaining 738 (79.4%) are enrolled in public schools. The age group of 35 years and over has the highest likelihood of being enrolled in private schools, with 28 (100.0% in the age bracket) enrolled. Conversely, the age group of 3 to 4 year olds has the lowest likelihood of being enrolled in a private school, with 33 (100.0% in the age bracket) attending a public institution.
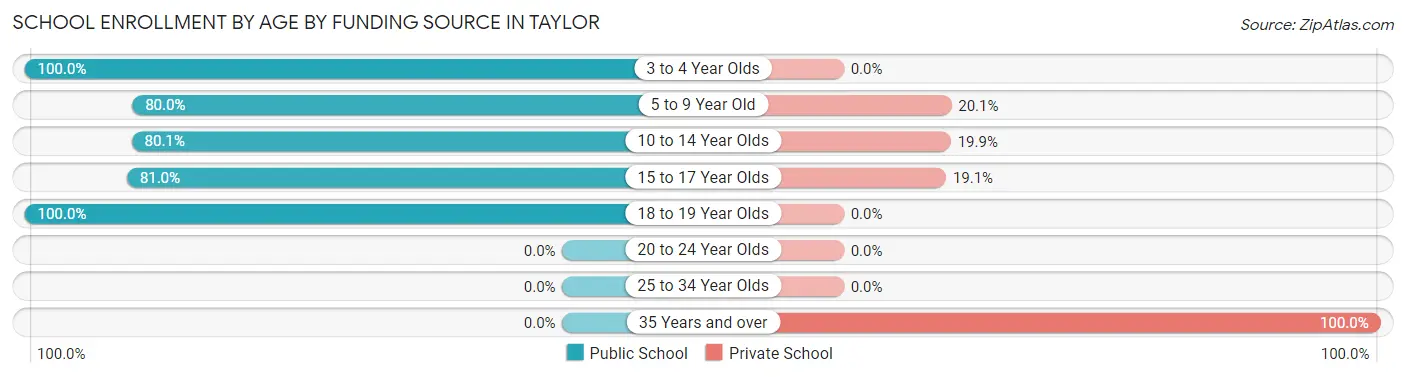
| Age Bracket | Public School | Private School |
| 3 to 4 Year Olds | 33 (100.0%) | 0 (0.0%) |
| 5 to 9 Year Old | 303 (79.9%) | 76 (20.1%) |
| 10 to 14 Year Olds | 273 (80.1%) | 68 (19.9%) |
| 15 to 17 Year Olds | 85 (80.9%) | 20 (19.1%) |
| 18 to 19 Year Olds | 44 (100.0%) | 0 (0.0%) |
| 20 to 24 Year Olds | 0 (0.0%) | 0 (0.0%) |
| 25 to 34 Year Olds | 0 (0.0%) | 0 (0.0%) |
| 35 Years and over | 0 (0.0%) | 28 (100.0%) |
| Total | 738 (79.4%) | 192 (20.6%) |
Educational Attainment by Field of Study in Taylor
Education (143 | 26.3%), science & technology (117 | 21.5%), psychology (78 | 14.3%), arts & humanities (57 | 10.5%), and visual & performing arts (48 | 8.8%) are the most common fields of study among 544 individuals in Taylor who have obtained a bachelor's degree or higher.
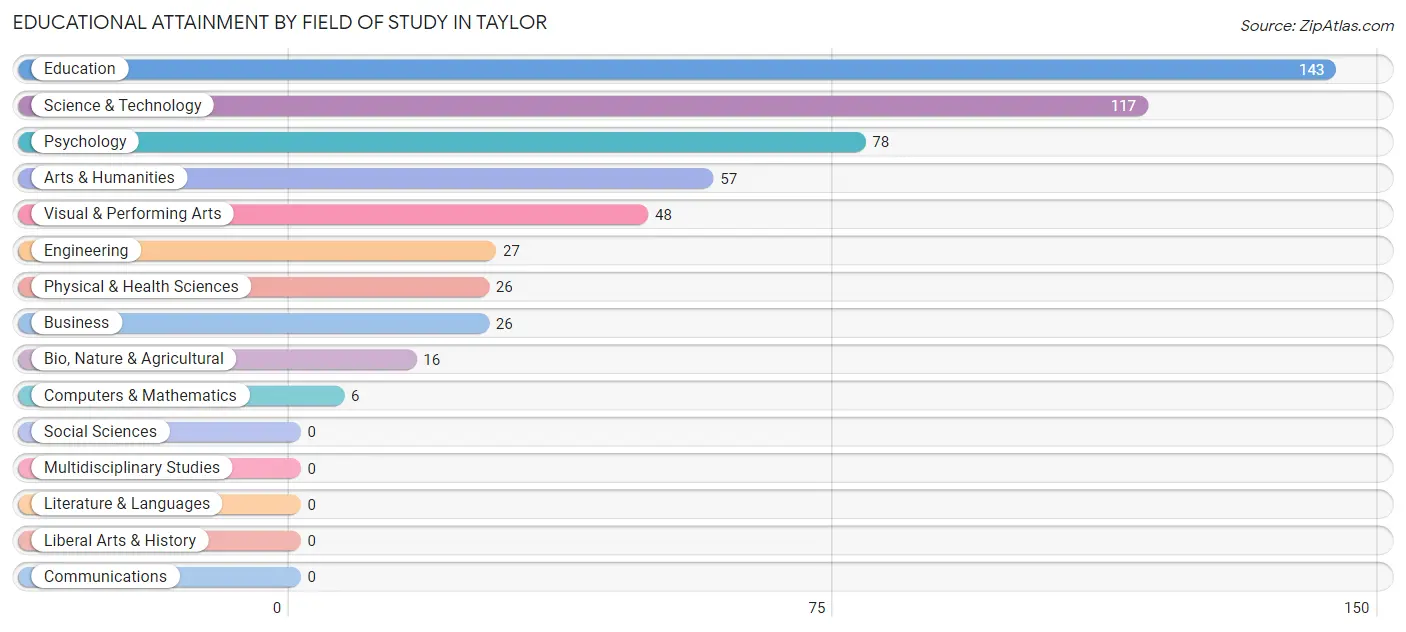
| Field of Study | # Graduates | % Graduates |
| Computers & Mathematics | 6 | 1.1% |
| Bio, Nature & Agricultural | 16 | 2.9% |
| Physical & Health Sciences | 26 | 4.8% |
| Psychology | 78 | 14.3% |
| Social Sciences | 0 | 0.0% |
| Engineering | 27 | 5.0% |
| Multidisciplinary Studies | 0 | 0.0% |
| Science & Technology | 117 | 21.5% |
| Business | 26 | 4.8% |
| Education | 143 | 26.3% |
| Literature & Languages | 0 | 0.0% |
| Liberal Arts & History | 0 | 0.0% |
| Visual & Performing Arts | 48 | 8.8% |
| Communications | 0 | 0.0% |
| Arts & Humanities | 57 | 10.5% |
| Total | 544 | 100.0% |
Transportation & Commute in Taylor
Vehicle Availability by Sex in Taylor
The most prevalent vehicle ownership categories in Taylor are males with 2 vehicles (216, accounting for 27.9%) and females with 2 vehicles (143, making up 37.1%).
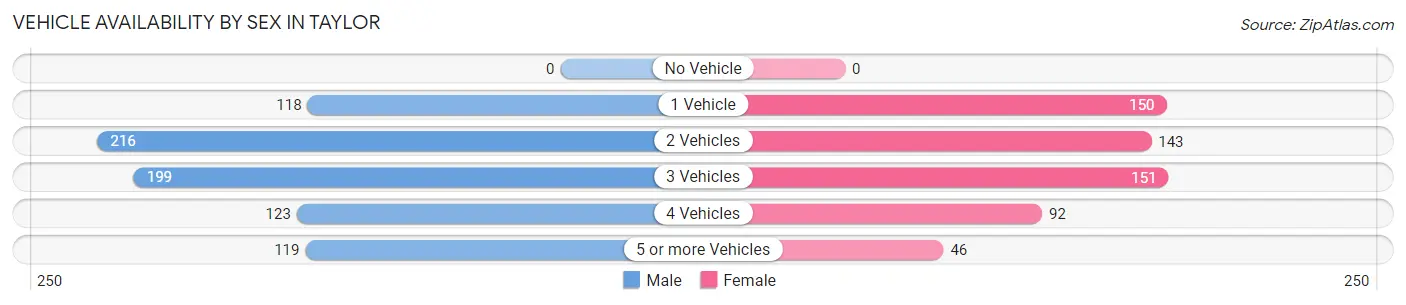
| Vehicles Available | Male | Female |
| No Vehicle | 0 (0.0%) | 0 (0.0%) |
| 1 Vehicle | 118 (15.2%) | 150 (25.8%) |
| 2 Vehicles | 216 (27.9%) | 143 (24.6%) |
| 3 Vehicles | 199 (25.7%) | 151 (26.0%) |
| 4 Vehicles | 123 (15.9%) | 92 (15.8%) |
| 5 or more Vehicles | 119 (15.3%) | 46 (7.9%) |
| Total | 775 (100.0%) | 582 (100.0%) |
Commute Time in Taylor
The most frequently occuring commute durations in Taylor are 30 to 34 minutes (317 commuters, 26.8%), 5 to 9 minutes (205 commuters, 17.3%), and 15 to 19 minutes (175 commuters, 14.8%).
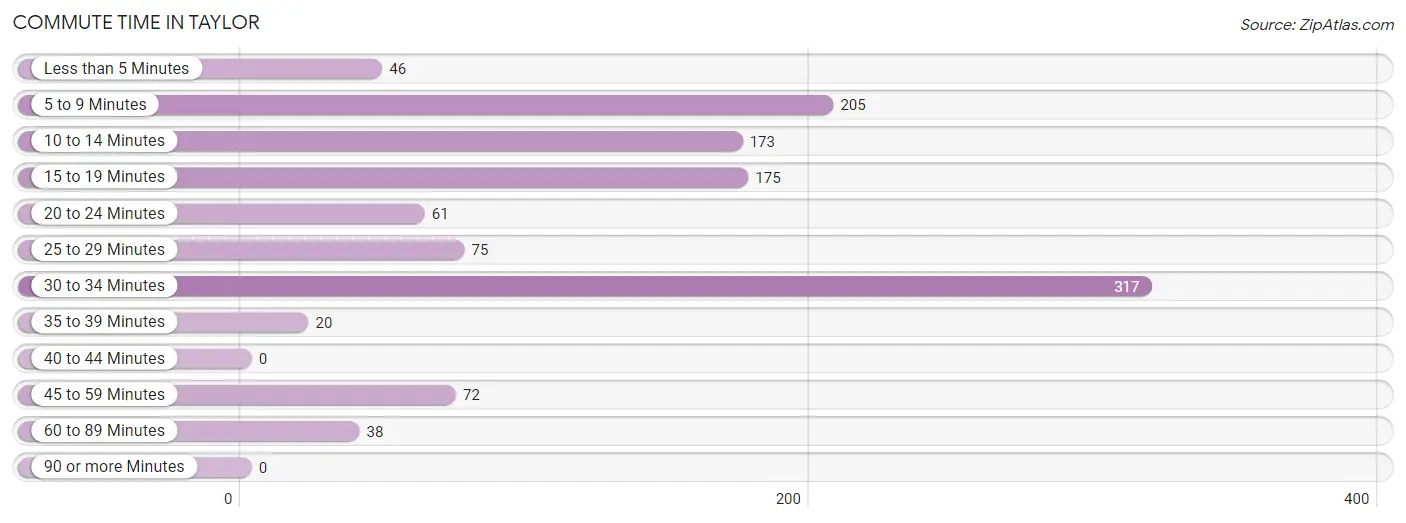
| Commute Time | # Commuters | % Commuters |
| Less than 5 Minutes | 46 | 3.9% |
| 5 to 9 Minutes | 205 | 17.3% |
| 10 to 14 Minutes | 173 | 14.6% |
| 15 to 19 Minutes | 175 | 14.8% |
| 20 to 24 Minutes | 61 | 5.2% |
| 25 to 29 Minutes | 75 | 6.4% |
| 30 to 34 Minutes | 317 | 26.8% |
| 35 to 39 Minutes | 20 | 1.7% |
| 40 to 44 Minutes | 0 | 0.0% |
| 45 to 59 Minutes | 72 | 6.1% |
| 60 to 89 Minutes | 38 | 3.2% |
| 90 or more Minutes | 0 | 0.0% |
Commute Time by Sex in Taylor
The most common commute times in Taylor are 30 to 34 minutes (155 commuters, 21.5%) for males and 30 to 34 minutes (162 commuters, 35.2%) for females.
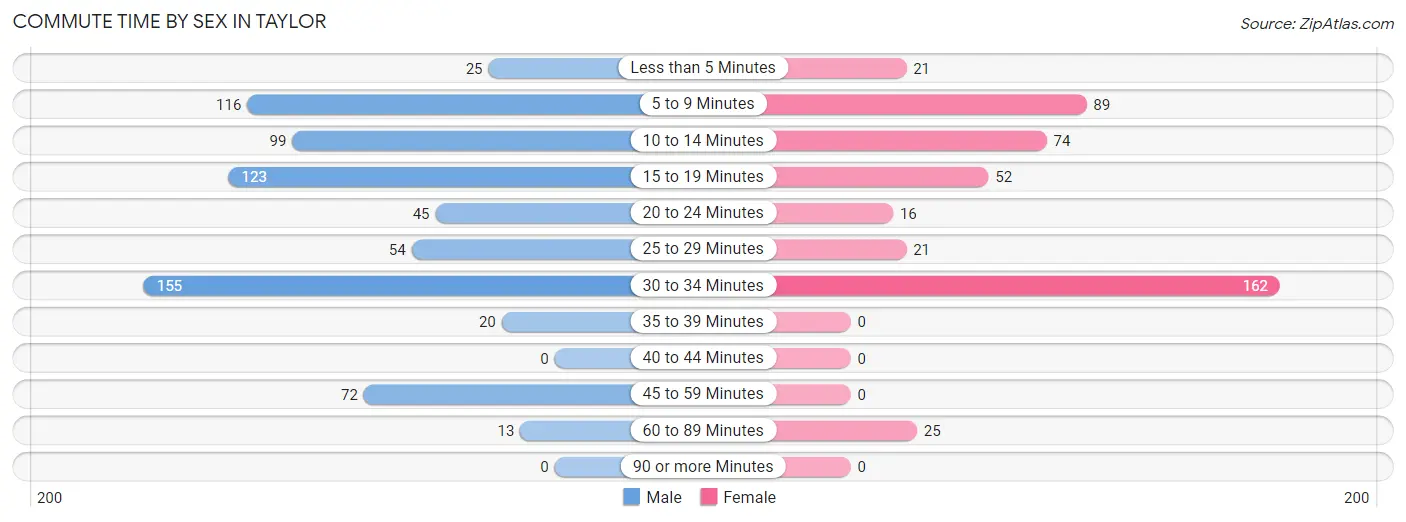
| Commute Time | Male | Female |
| Less than 5 Minutes | 25 (3.5%) | 21 (4.6%) |
| 5 to 9 Minutes | 116 (16.1%) | 89 (19.4%) |
| 10 to 14 Minutes | 99 (13.7%) | 74 (16.1%) |
| 15 to 19 Minutes | 123 (17.0%) | 52 (11.3%) |
| 20 to 24 Minutes | 45 (6.2%) | 16 (3.5%) |
| 25 to 29 Minutes | 54 (7.5%) | 21 (4.6%) |
| 30 to 34 Minutes | 155 (21.5%) | 162 (35.2%) |
| 35 to 39 Minutes | 20 (2.8%) | 0 (0.0%) |
| 40 to 44 Minutes | 0 (0.0%) | 0 (0.0%) |
| 45 to 59 Minutes | 72 (10.0%) | 0 (0.0%) |
| 60 to 89 Minutes | 13 (1.8%) | 25 (5.4%) |
| 90 or more Minutes | 0 (0.0%) | 0 (0.0%) |
Time of Departure to Work by Sex in Taylor
The most frequent times of departure to work in Taylor are 8:00 AM to 8:29 AM (139, 19.3%) for males and 7:00 AM to 7:29 AM (119, 25.9%) for females.
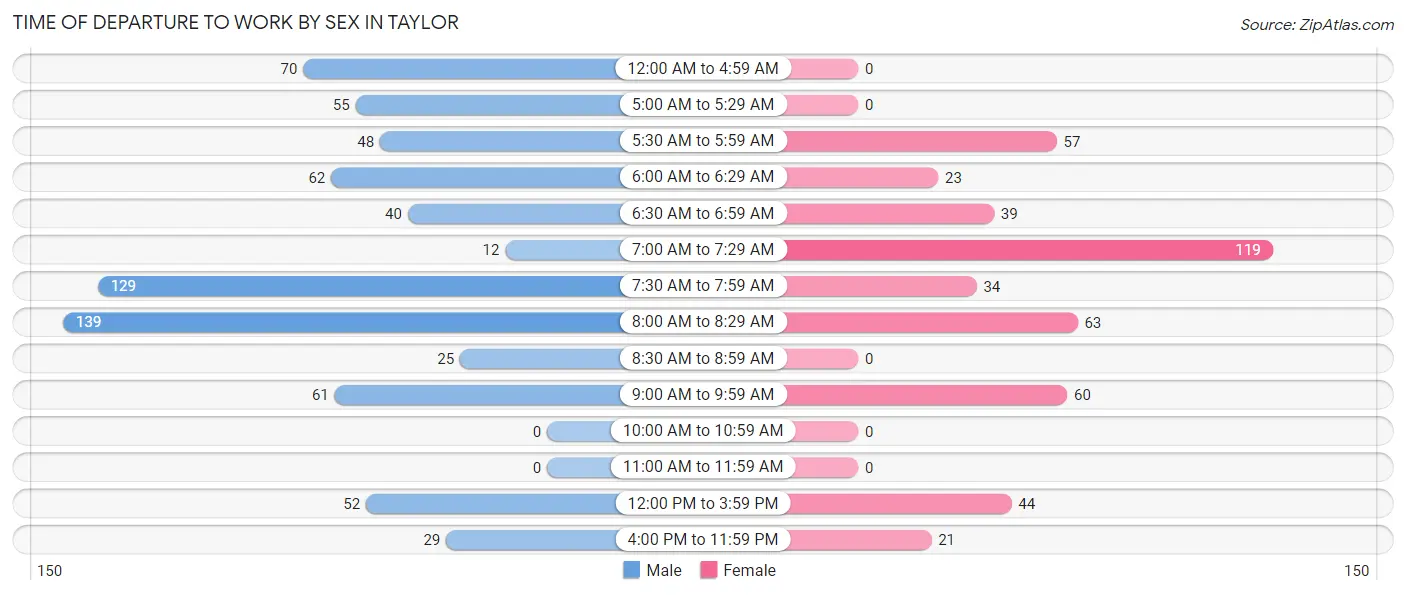
| Time of Departure | Male | Female |
| 12:00 AM to 4:59 AM | 70 (9.7%) | 0 (0.0%) |
| 5:00 AM to 5:29 AM | 55 (7.6%) | 0 (0.0%) |
| 5:30 AM to 5:59 AM | 48 (6.7%) | 57 (12.4%) |
| 6:00 AM to 6:29 AM | 62 (8.6%) | 23 (5.0%) |
| 6:30 AM to 6:59 AM | 40 (5.5%) | 39 (8.5%) |
| 7:00 AM to 7:29 AM | 12 (1.7%) | 119 (25.9%) |
| 7:30 AM to 7:59 AM | 129 (17.9%) | 34 (7.4%) |
| 8:00 AM to 8:29 AM | 139 (19.3%) | 63 (13.7%) |
| 8:30 AM to 8:59 AM | 25 (3.5%) | 0 (0.0%) |
| 9:00 AM to 9:59 AM | 61 (8.5%) | 60 (13.0%) |
| 10:00 AM to 10:59 AM | 0 (0.0%) | 0 (0.0%) |
| 11:00 AM to 11:59 AM | 0 (0.0%) | 0 (0.0%) |
| 12:00 PM to 3:59 PM | 52 (7.2%) | 44 (9.6%) |
| 4:00 PM to 11:59 PM | 29 (4.0%) | 21 (4.6%) |
| Total | 722 (100.0%) | 460 (100.0%) |
Housing Occupancy in Taylor
Occupancy by Ownership in Taylor
Of the total 1,397 dwellings in Taylor, owner-occupied units account for 1,086 (77.7%), while renter-occupied units make up 311 (22.3%).
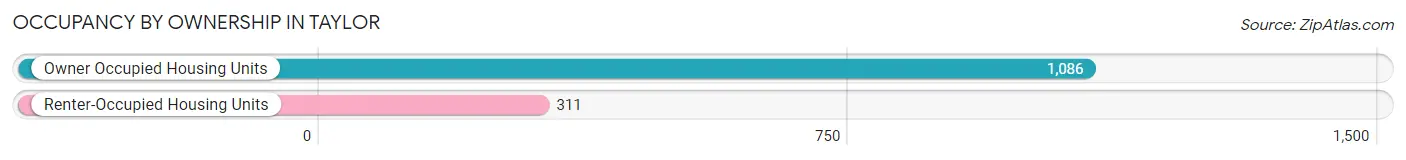
| Occupancy | # Housing Units | % Housing Units |
| Owner Occupied Housing Units | 1,086 | 77.7% |
| Renter-Occupied Housing Units | 311 | 22.3% |
| Total Occupied Housing Units | 1,397 | 100.0% |
Occupancy by Household Size in Taylor
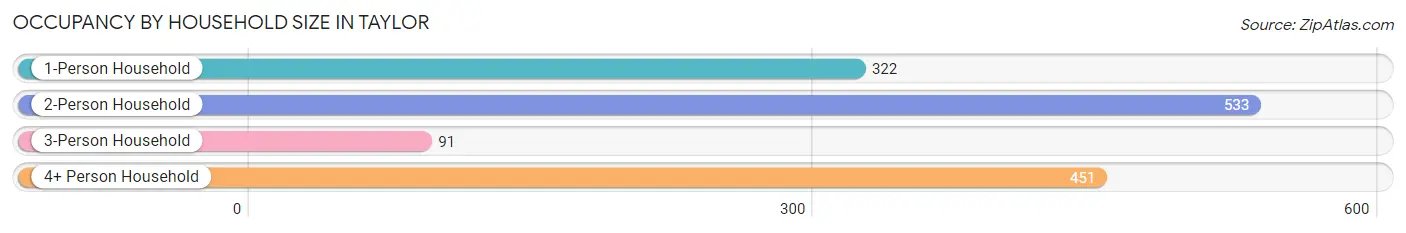
| Household Size | # Housing Units | % Housing Units |
| 1-Person Household | 322 | 23.1% |
| 2-Person Household | 533 | 38.2% |
| 3-Person Household | 91 | 6.5% |
| 4+ Person Household | 451 | 32.3% |
| Total Housing Units | 1,397 | 100.0% |
Occupancy by Ownership by Household Size in Taylor
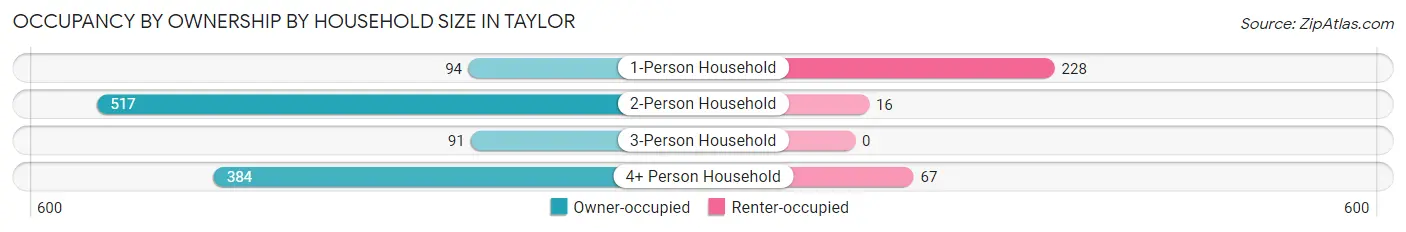
| Household Size | Owner-occupied | Renter-occupied |
| 1-Person Household | 94 (29.2%) | 228 (70.8%) |
| 2-Person Household | 517 (97.0%) | 16 (3.0%) |
| 3-Person Household | 91 (100.0%) | 0 (0.0%) |
| 4+ Person Household | 384 (85.1%) | 67 (14.9%) |
| Total Housing Units | 1,086 (77.7%) | 311 (22.3%) |
Occupancy by Educational Attainment in Taylor
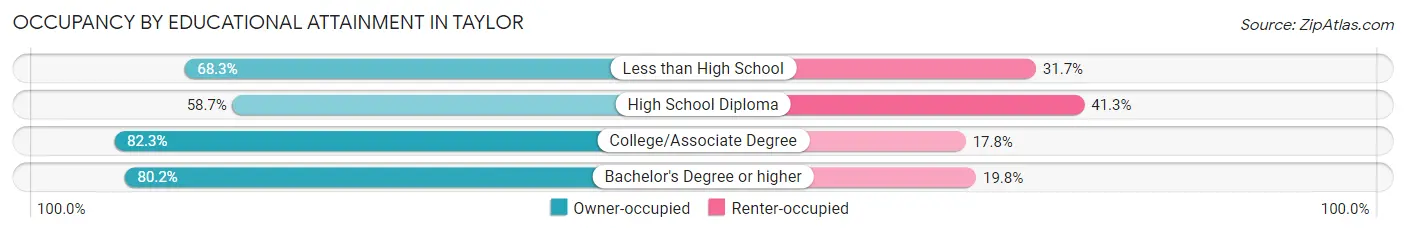
| Household Size | Owner-occupied | Renter-occupied |
| Less than High School | 41 (68.3%) | 19 (31.7%) |
| High School Diploma | 121 (58.7%) | 85 (41.3%) |
| College/Associate Degree | 681 (82.3%) | 147 (17.7%) |
| Bachelor's Degree or higher | 243 (80.2%) | 60 (19.8%) |
Occupancy by Age of Householder in Taylor
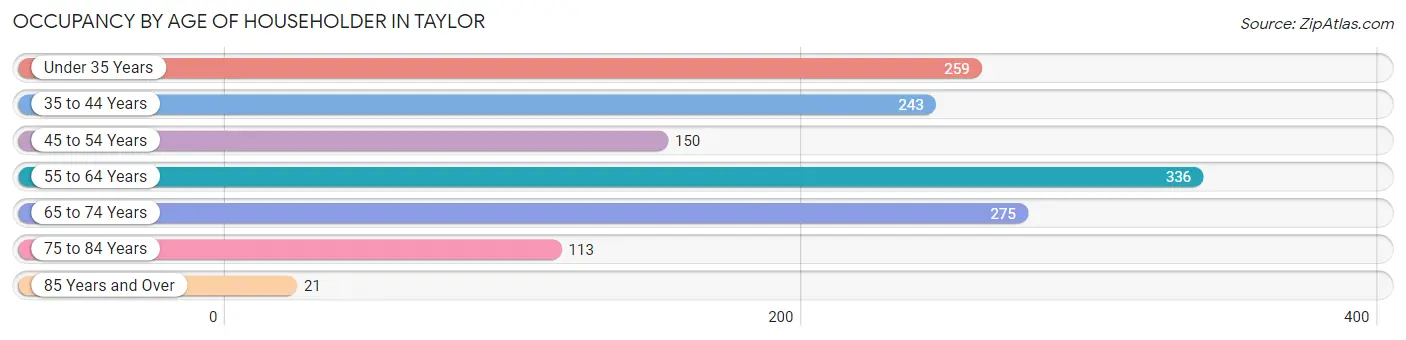
| Age Bracket | # Households | % Households |
| Under 35 Years | 259 | 18.5% |
| 35 to 44 Years | 243 | 17.4% |
| 45 to 54 Years | 150 | 10.7% |
| 55 to 64 Years | 336 | 24.0% |
| 65 to 74 Years | 275 | 19.7% |
| 75 to 84 Years | 113 | 8.1% |
| 85 Years and Over | 21 | 1.5% |
| Total | 1,397 | 100.0% |
Housing Finances in Taylor
Median Income by Occupancy in Taylor
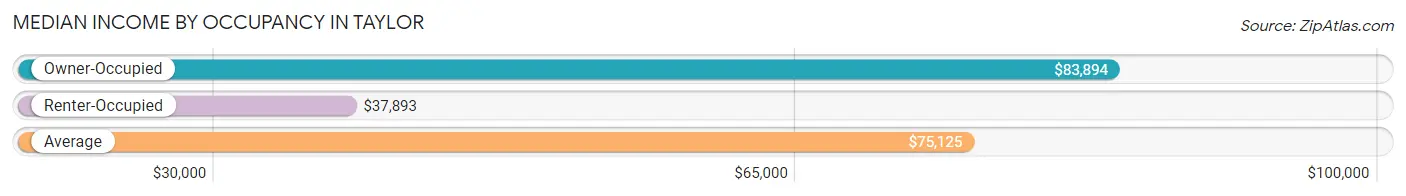
| Occupancy Type | # Households | Median Income |
| Owner-Occupied | 1,086 (77.7%) | $83,894 |
| Renter-Occupied | 311 (22.3%) | $37,893 |
| Average | 1,397 (100.0%) | $75,125 |
Occupancy by Householder Income Bracket in Taylor
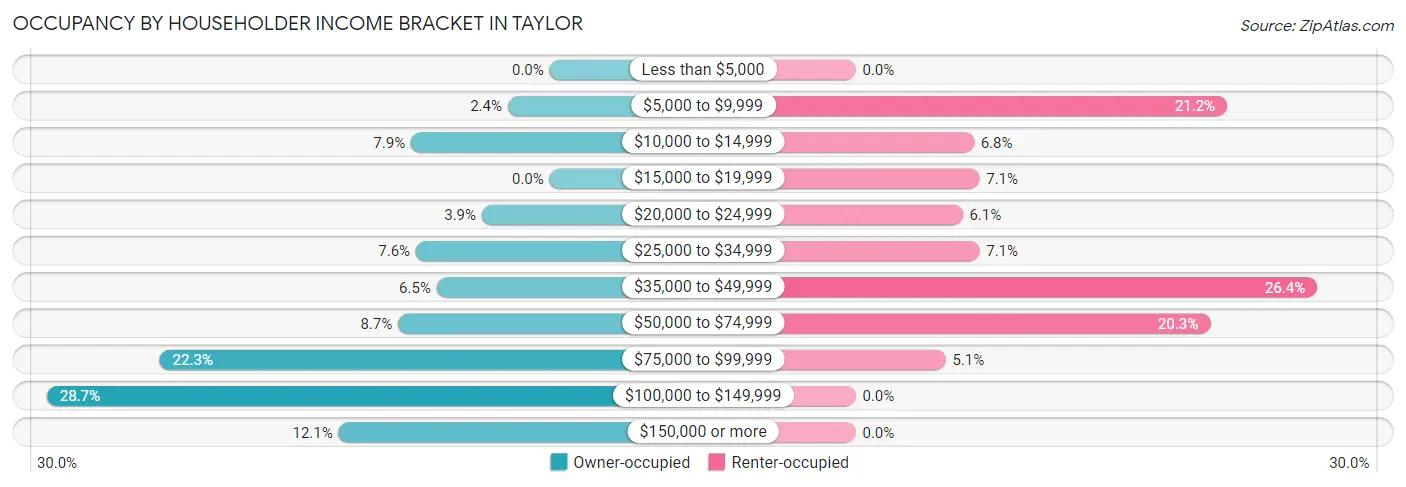
| Income Bracket | Owner-occupied | Renter-occupied |
| Less than $5,000 | 0 (0.0%) | 0 (0.0%) |
| $5,000 to $9,999 | 26 (2.4%) | 66 (21.2%) |
| $10,000 to $14,999 | 86 (7.9%) | 21 (6.8%) |
| $15,000 to $19,999 | 0 (0.0%) | 22 (7.1%) |
| $20,000 to $24,999 | 42 (3.9%) | 19 (6.1%) |
| $25,000 to $34,999 | 83 (7.6%) | 22 (7.1%) |
| $35,000 to $49,999 | 70 (6.5%) | 82 (26.4%) |
| $50,000 to $74,999 | 94 (8.7%) | 63 (20.3%) |
| $75,000 to $99,999 | 242 (22.3%) | 16 (5.1%) |
| $100,000 to $149,999 | 312 (28.7%) | 0 (0.0%) |
| $150,000 or more | 131 (12.1%) | 0 (0.0%) |
| Total | 1,086 (100.0%) | 311 (100.0%) |
Monthly Housing Cost Tiers in Taylor
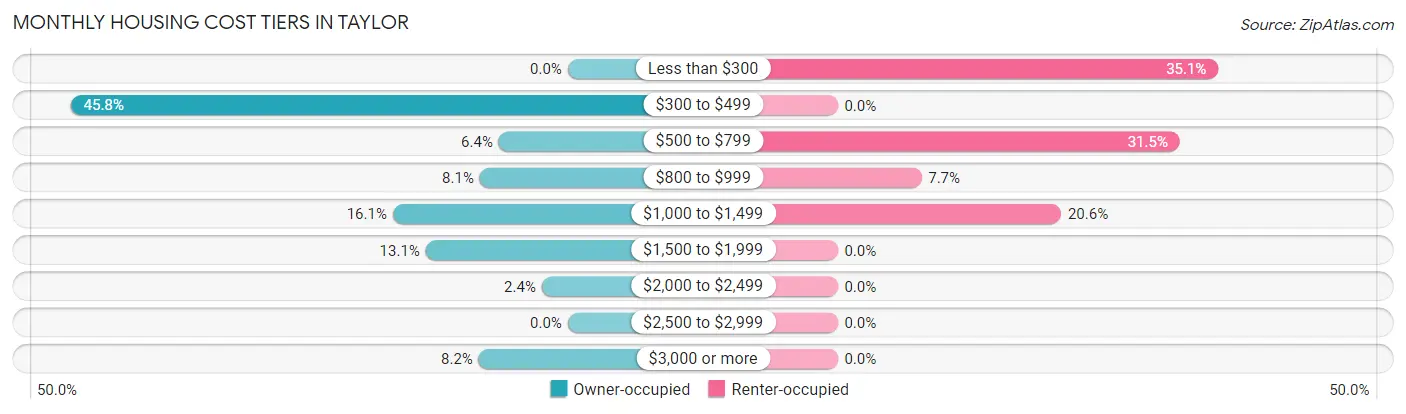
| Monthly Cost | Owner-occupied | Renter-occupied |
| Less than $300 | 0 (0.0%) | 109 (35.0%) |
| $300 to $499 | 497 (45.8%) | 0 (0.0%) |
| $500 to $799 | 69 (6.4%) | 98 (31.5%) |
| $800 to $999 | 88 (8.1%) | 24 (7.7%) |
| $1,000 to $1,499 | 175 (16.1%) | 64 (20.6%) |
| $1,500 to $1,999 | 142 (13.1%) | 0 (0.0%) |
| $2,000 to $2,499 | 26 (2.4%) | 0 (0.0%) |
| $2,500 to $2,999 | 0 (0.0%) | 0 (0.0%) |
| $3,000 or more | 89 (8.2%) | 0 (0.0%) |
| Total | 1,086 (100.0%) | 311 (100.0%) |
Physical Housing Characteristics in Taylor
Housing Structures in Taylor
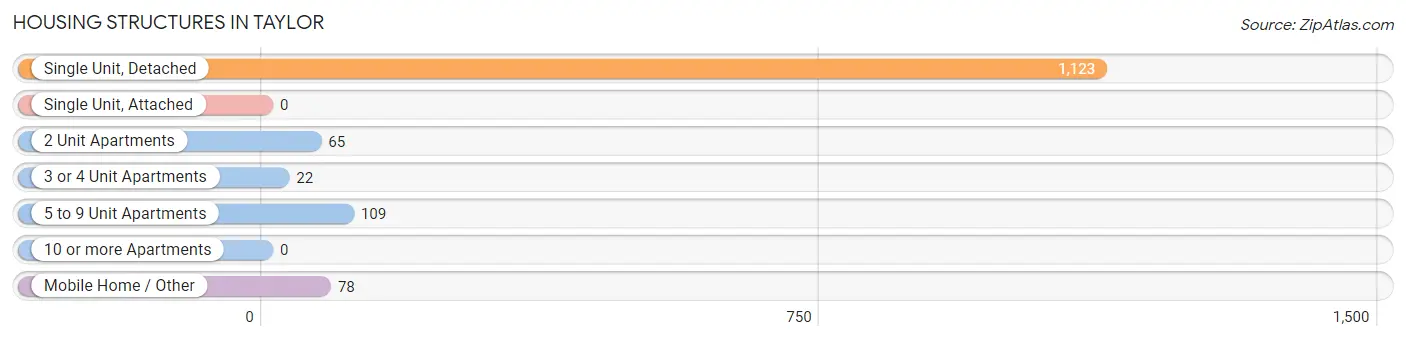
| Structure Type | # Housing Units | % Housing Units |
| Single Unit, Detached | 1,123 | 80.4% |
| Single Unit, Attached | 0 | 0.0% |
| 2 Unit Apartments | 65 | 4.6% |
| 3 or 4 Unit Apartments | 22 | 1.6% |
| 5 to 9 Unit Apartments | 109 | 7.8% |
| 10 or more Apartments | 0 | 0.0% |
| Mobile Home / Other | 78 | 5.6% |
| Total | 1,397 | 100.0% |
Housing Structures by Occupancy in Taylor
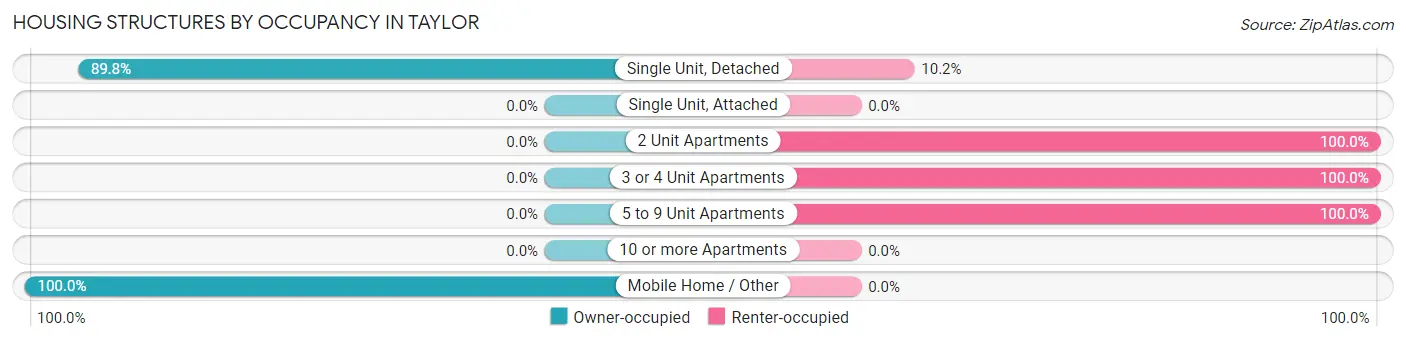
| Structure Type | Owner-occupied | Renter-occupied |
| Single Unit, Detached | 1,008 (89.8%) | 115 (10.2%) |
| Single Unit, Attached | 0 (0.0%) | 0 (0.0%) |
| 2 Unit Apartments | 0 (0.0%) | 65 (100.0%) |
| 3 or 4 Unit Apartments | 0 (0.0%) | 22 (100.0%) |
| 5 to 9 Unit Apartments | 0 (0.0%) | 109 (100.0%) |
| 10 or more Apartments | 0 (0.0%) | 0 (0.0%) |
| Mobile Home / Other | 78 (100.0%) | 0 (0.0%) |
| Total | 1,086 (77.7%) | 311 (22.3%) |
Housing Structures by Number of Rooms in Taylor
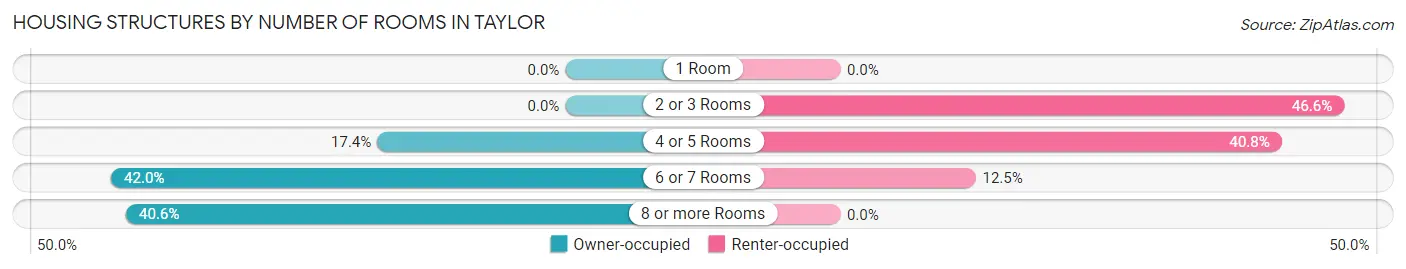
| Number of Rooms | Owner-occupied | Renter-occupied |
| 1 Room | 0 (0.0%) | 0 (0.0%) |
| 2 or 3 Rooms | 0 (0.0%) | 145 (46.6%) |
| 4 or 5 Rooms | 189 (17.4%) | 127 (40.8%) |
| 6 or 7 Rooms | 456 (42.0%) | 39 (12.5%) |
| 8 or more Rooms | 441 (40.6%) | 0 (0.0%) |
| Total | 1,086 (100.0%) | 311 (100.0%) |
Housing Structure by Heating Type in Taylor
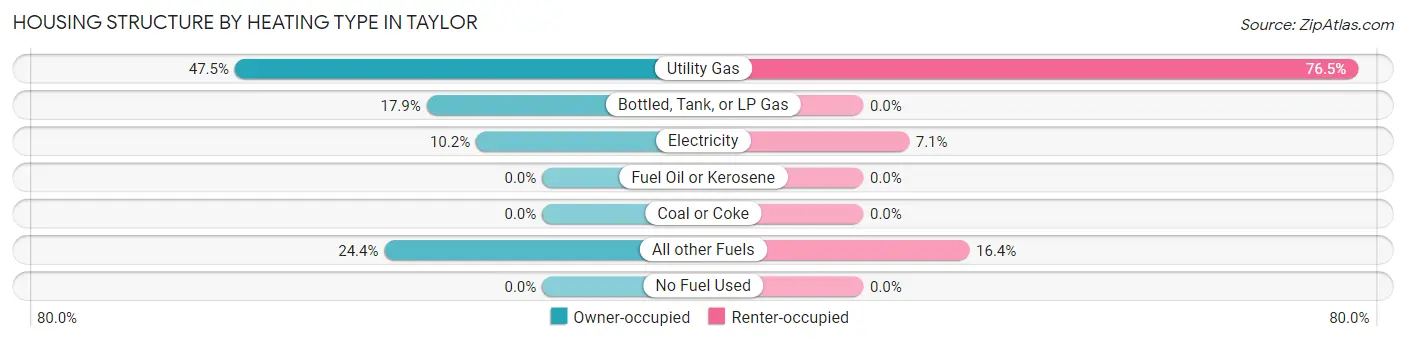
| Heating Type | Owner-occupied | Renter-occupied |
| Utility Gas | 516 (47.5%) | 238 (76.5%) |
| Bottled, Tank, or LP Gas | 194 (17.9%) | 0 (0.0%) |
| Electricity | 111 (10.2%) | 22 (7.1%) |
| Fuel Oil or Kerosene | 0 (0.0%) | 0 (0.0%) |
| Coal or Coke | 0 (0.0%) | 0 (0.0%) |
| All other Fuels | 265 (24.4%) | 51 (16.4%) |
| No Fuel Used | 0 (0.0%) | 0 (0.0%) |
| Total | 1,086 (100.0%) | 311 (100.0%) |
Household Vehicle Usage in Taylor
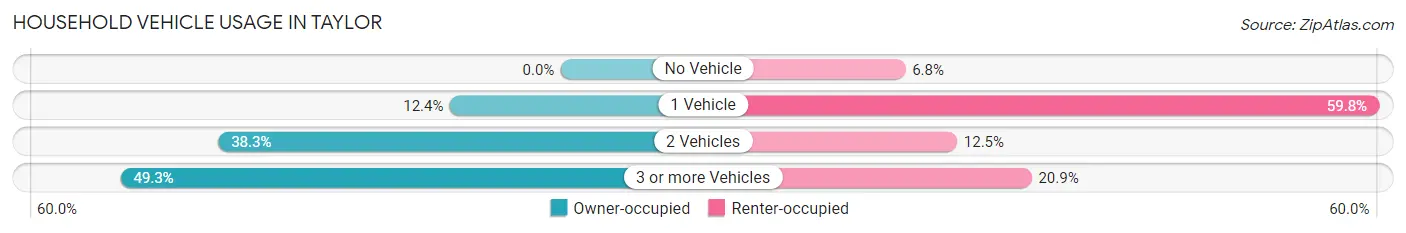
| Vehicles per Household | Owner-occupied | Renter-occupied |
| No Vehicle | 0 (0.0%) | 21 (6.8%) |
| 1 Vehicle | 135 (12.4%) | 186 (59.8%) |
| 2 Vehicles | 416 (38.3%) | 39 (12.5%) |
| 3 or more Vehicles | 535 (49.3%) | 65 (20.9%) |
| Total | 1,086 (100.0%) | 311 (100.0%) |
Real Estate & Mortgages in Taylor
Real Estate and Mortgage Overview in Taylor
| Characteristic | Without Mortgage | With Mortgage |
| Housing Units | 552 | 534 |
| Median Property Value | $277,900 | $265,900 |
| Median Household Income | $64,792 | $49 |
| Monthly Housing Costs | $433 | $89 |
| Real Estate Taxes | $1,008 | $0 |
Property Value by Mortgage Status in Taylor
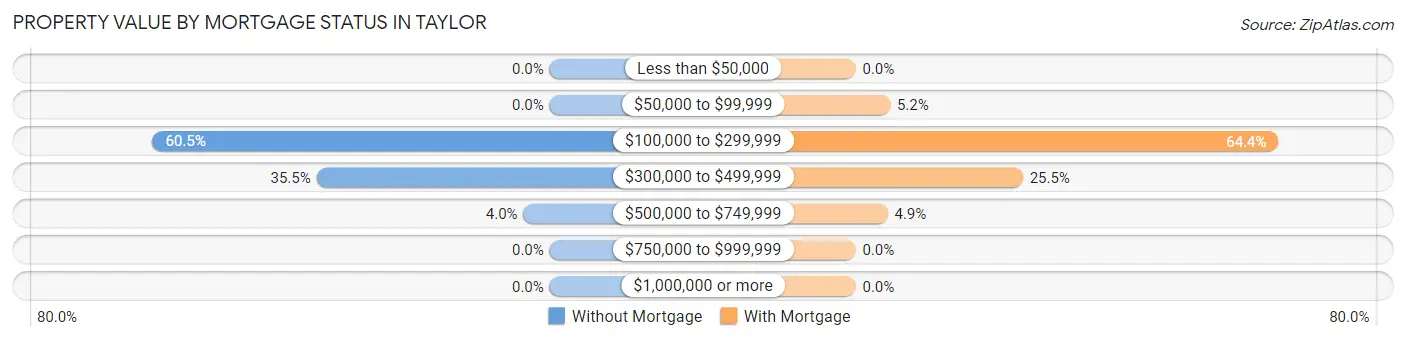
| Property Value | Without Mortgage | With Mortgage |
| Less than $50,000 | 0 (0.0%) | 0 (0.0%) |
| $50,000 to $99,999 | 0 (0.0%) | 28 (5.2%) |
| $100,000 to $299,999 | 334 (60.5%) | 344 (64.4%) |
| $300,000 to $499,999 | 196 (35.5%) | 136 (25.5%) |
| $500,000 to $749,999 | 22 (4.0%) | 26 (4.9%) |
| $750,000 to $999,999 | 0 (0.0%) | 0 (0.0%) |
| $1,000,000 or more | 0 (0.0%) | 0 (0.0%) |
| Total | 552 (100.0%) | 534 (100.0%) |
Household Income by Mortgage Status in Taylor
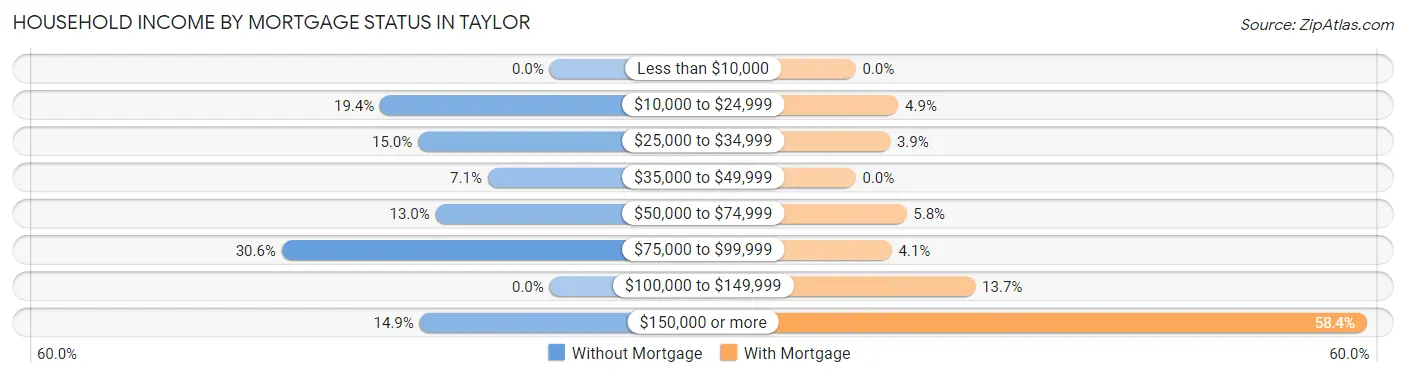
| Household Income | Without Mortgage | With Mortgage |
| Less than $10,000 | 0 (0.0%) | 0 (0.0%) |
| $10,000 to $24,999 | 107 (19.4%) | 26 (4.9%) |
| $25,000 to $34,999 | 83 (15.0%) | 21 (3.9%) |
| $35,000 to $49,999 | 39 (7.1%) | 0 (0.0%) |
| $50,000 to $74,999 | 72 (13.0%) | 31 (5.8%) |
| $75,000 to $99,999 | 169 (30.6%) | 22 (4.1%) |
| $100,000 to $149,999 | 0 (0.0%) | 73 (13.7%) |
| $150,000 or more | 82 (14.9%) | 312 (58.4%) |
| Total | 552 (100.0%) | 534 (100.0%) |
Property Value to Household Income Ratio in Taylor
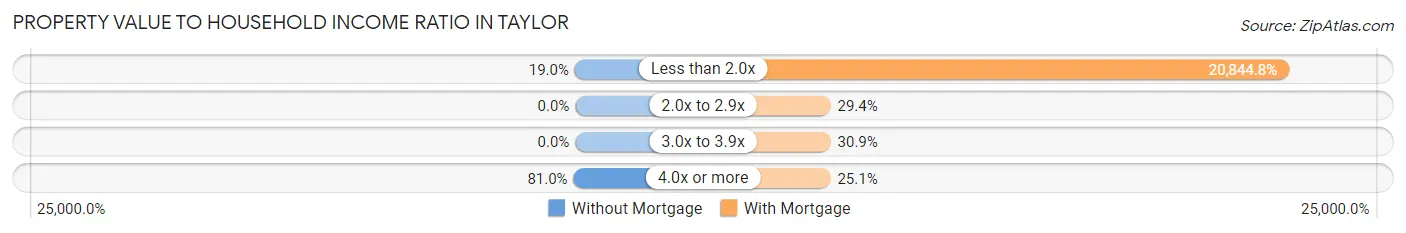
| Value-to-Income Ratio | Without Mortgage | With Mortgage |
| Less than 2.0x | 105 (19.0%) | 111,311 (20,844.8%) |
| 2.0x to 2.9x | 0 (0.0%) | 157 (29.4%) |
| 3.0x to 3.9x | 0 (0.0%) | 165 (30.9%) |
| 4.0x or more | 447 (81.0%) | 134 (25.1%) |
| Total | 552 (100.0%) | 534 (100.0%) |
Real Estate Taxes by Mortgage Status in Taylor
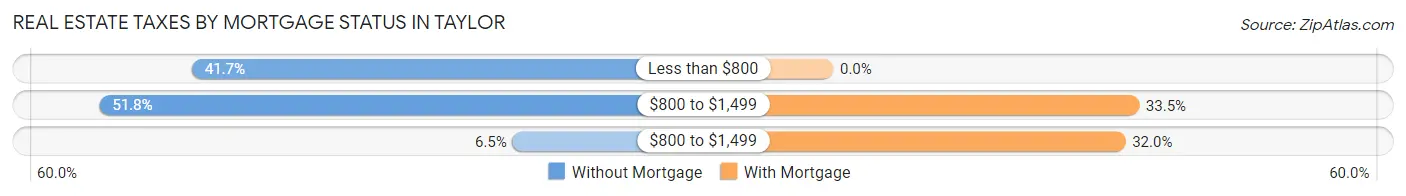
| Property Taxes | Without Mortgage | With Mortgage |
| Less than $800 | 230 (41.7%) | 0 (0.0%) |
| $800 to $1,499 | 286 (51.8%) | 179 (33.5%) |
| $800 to $1,499 | 36 (6.5%) | 171 (32.0%) |
| Total | 552 (100.0%) | 534 (100.0%) |
Health & Disability in Taylor
Health Insurance Coverage by Age in Taylor
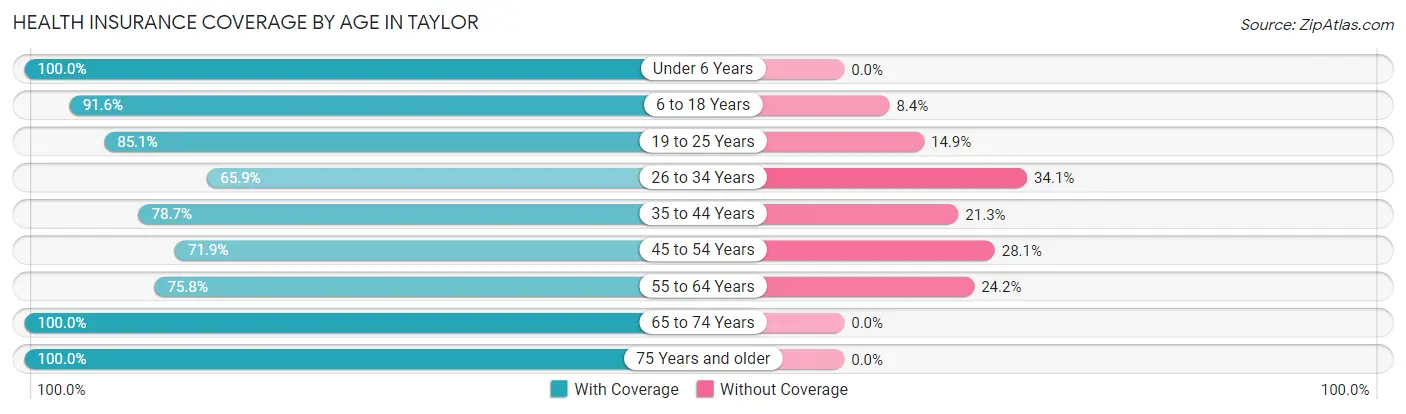
| Age Bracket | With Coverage | Without Coverage |
| Under 6 Years | 490 (100.0%) | 0 (0.0%) |
| 6 to 18 Years | 848 (91.6%) | 78 (8.4%) |
| 19 to 25 Years | 229 (85.1%) | 40 (14.9%) |
| 26 to 34 Years | 228 (65.9%) | 118 (34.1%) |
| 35 to 44 Years | 344 (78.7%) | 93 (21.3%) |
| 45 to 54 Years | 223 (71.9%) | 87 (28.1%) |
| 55 to 64 Years | 466 (75.8%) | 149 (24.2%) |
| 65 to 74 Years | 331 (100.0%) | 0 (0.0%) |
| 75 Years and older | 338 (100.0%) | 0 (0.0%) |
| Total | 3,497 (86.1%) | 565 (13.9%) |
Health Insurance Coverage by Citizenship Status in Taylor
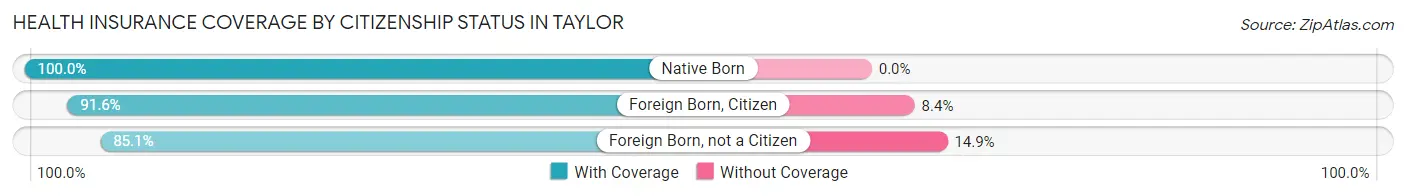
| Citizenship Status | With Coverage | Without Coverage |
| Native Born | 490 (100.0%) | 0 (0.0%) |
| Foreign Born, Citizen | 848 (91.6%) | 78 (8.4%) |
| Foreign Born, not a Citizen | 229 (85.1%) | 40 (14.9%) |
Health Insurance Coverage by Household Income in Taylor
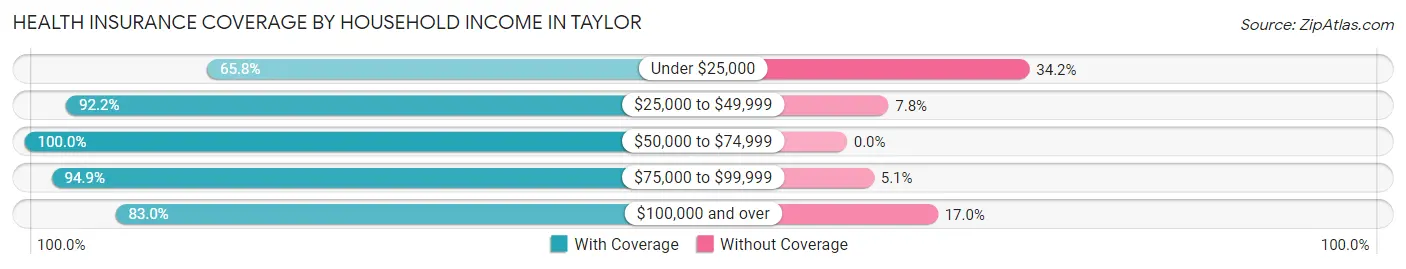
| Household Income | With Coverage | Without Coverage |
| Under $25,000 | 304 (65.8%) | 158 (34.2%) |
| $25,000 to $49,999 | 616 (92.2%) | 52 (7.8%) |
| $50,000 to $74,999 | 486 (100.0%) | 0 (0.0%) |
| $75,000 to $99,999 | 488 (94.9%) | 26 (5.1%) |
| $100,000 and over | 1,603 (83.0%) | 329 (17.0%) |
Public vs Private Health Insurance Coverage by Age in Taylor
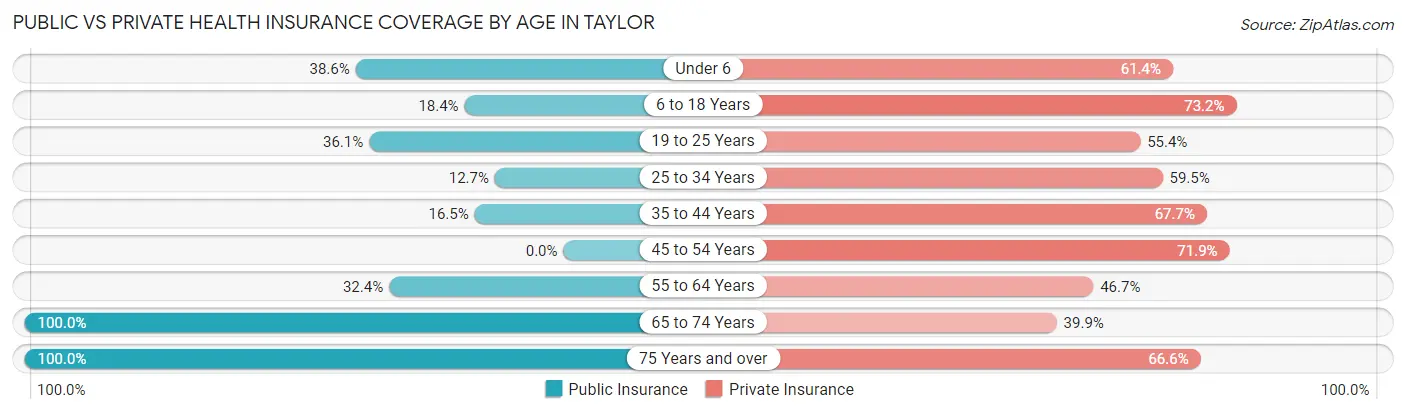
| Age Bracket | Public Insurance | Private Insurance |
| Under 6 | 189 (38.6%) | 301 (61.4%) |
| 6 to 18 Years | 170 (18.4%) | 678 (73.2%) |
| 19 to 25 Years | 97 (36.1%) | 149 (55.4%) |
| 25 to 34 Years | 44 (12.7%) | 206 (59.5%) |
| 35 to 44 Years | 72 (16.5%) | 296 (67.7%) |
| 45 to 54 Years | 0 (0.0%) | 223 (71.9%) |
| 55 to 64 Years | 199 (32.4%) | 287 (46.7%) |
| 65 to 74 Years | 331 (100.0%) | 132 (39.9%) |
| 75 Years and over | 338 (100.0%) | 225 (66.6%) |
| Total | 1,440 (35.4%) | 2,497 (61.5%) |
Disability Status by Sex by Age in Taylor
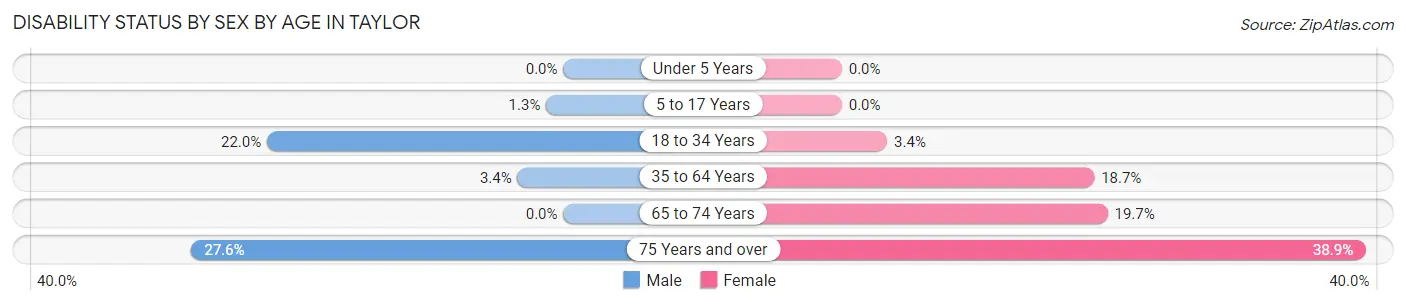
| Age Bracket | Male | Female |
| Under 5 Years | 0 (0.0%) | 0 (0.0%) |
| 5 to 17 Years | 7 (1.3%) | 0 (0.0%) |
| 18 to 34 Years | 88 (22.0%) | 11 (3.4%) |
| 35 to 64 Years | 22 (3.4%) | 134 (18.7%) |
| 65 to 74 Years | 0 (0.0%) | 58 (19.7%) |
| 75 Years and over | 50 (27.6%) | 61 (38.9%) |
Disability Class by Sex by Age in Taylor
Disability Class: Hearing Difficulty
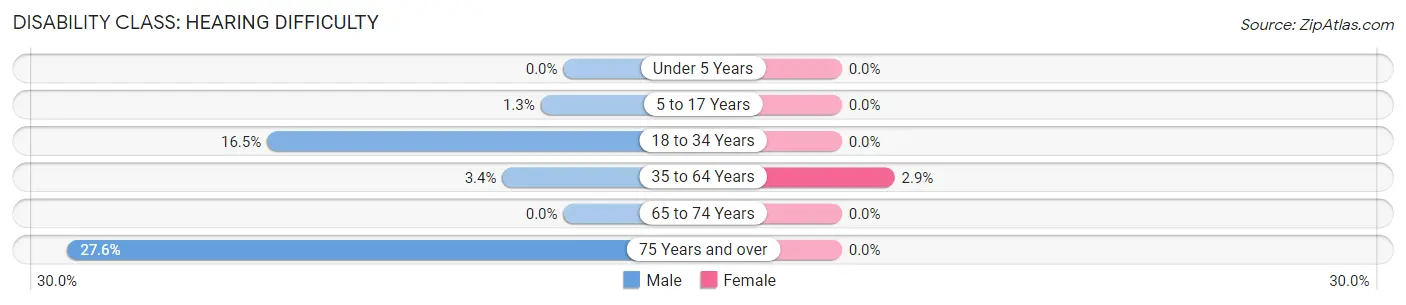
| Age Bracket | Male | Female |
| Under 5 Years | 0 (0.0%) | 0 (0.0%) |
| 5 to 17 Years | 7 (1.3%) | 0 (0.0%) |
| 18 to 34 Years | 66 (16.5%) | 0 (0.0%) |
| 35 to 64 Years | 22 (3.4%) | 21 (2.9%) |
| 65 to 74 Years | 0 (0.0%) | 0 (0.0%) |
| 75 Years and over | 50 (27.6%) | 0 (0.0%) |
Disability Class: Vision Difficulty
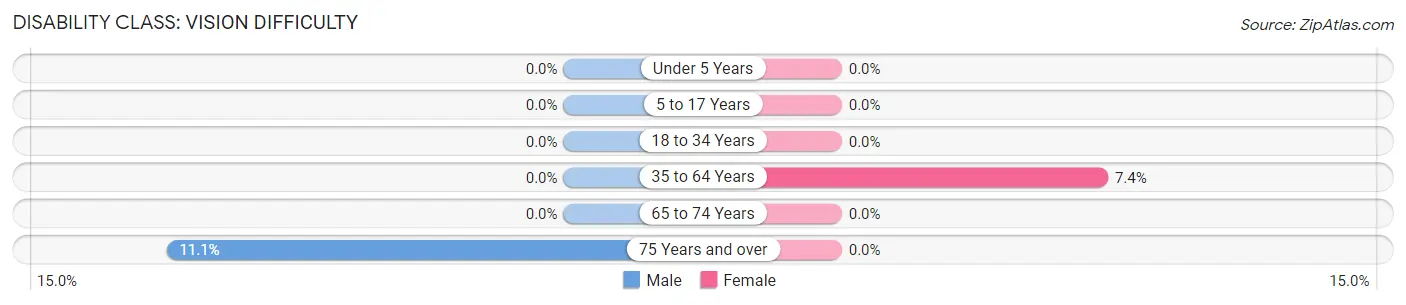
| Age Bracket | Male | Female |
| Under 5 Years | 0 (0.0%) | 0 (0.0%) |
| 5 to 17 Years | 0 (0.0%) | 0 (0.0%) |
| 18 to 34 Years | 0 (0.0%) | 0 (0.0%) |
| 35 to 64 Years | 0 (0.0%) | 53 (7.4%) |
| 65 to 74 Years | 0 (0.0%) | 0 (0.0%) |
| 75 Years and over | 20 (11.1%) | 0 (0.0%) |
Disability Class: Cognitive Difficulty
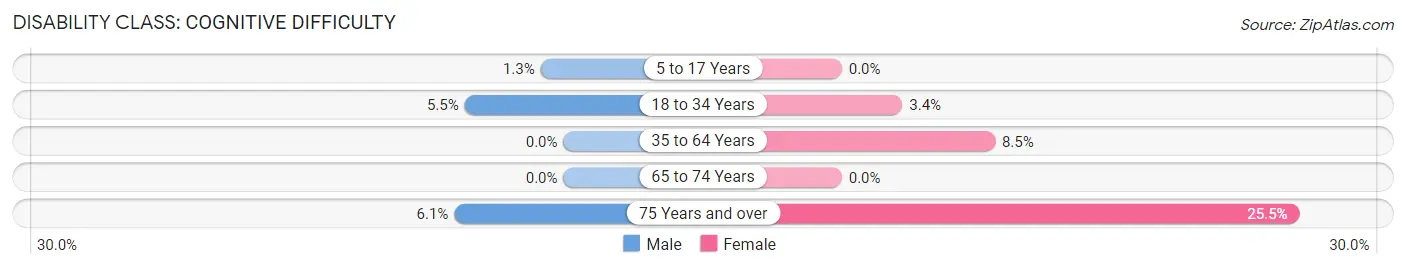
| Age Bracket | Male | Female |
| 5 to 17 Years | 7 (1.3%) | 0 (0.0%) |
| 18 to 34 Years | 22 (5.5%) | 11 (3.4%) |
| 35 to 64 Years | 0 (0.0%) | 61 (8.5%) |
| 65 to 74 Years | 0 (0.0%) | 0 (0.0%) |
| 75 Years and over | 11 (6.1%) | 40 (25.5%) |
Disability Class: Ambulatory Difficulty
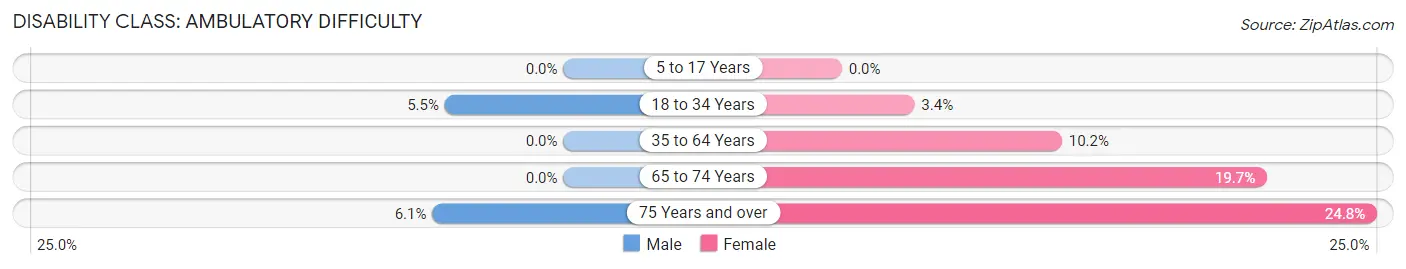
| Age Bracket | Male | Female |
| 5 to 17 Years | 0 (0.0%) | 0 (0.0%) |
| 18 to 34 Years | 22 (5.5%) | 11 (3.4%) |
| 35 to 64 Years | 0 (0.0%) | 73 (10.2%) |
| 65 to 74 Years | 0 (0.0%) | 58 (19.7%) |
| 75 Years and over | 11 (6.1%) | 39 (24.8%) |
Disability Class: Self-Care Difficulty
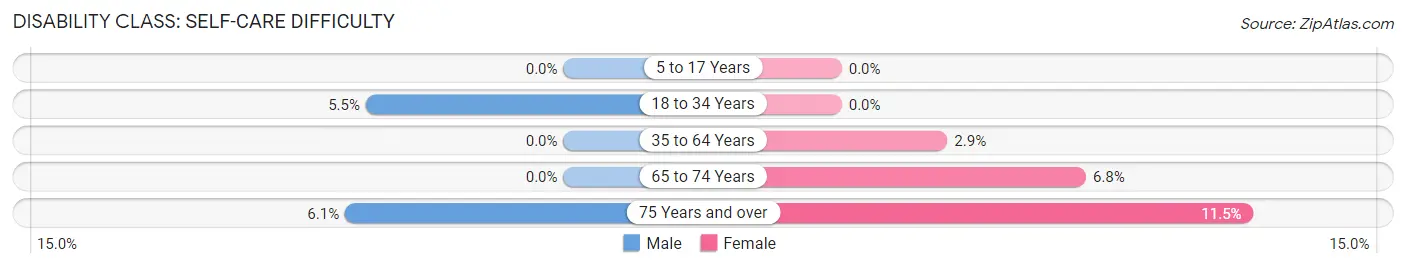
| Age Bracket | Male | Female |
| 5 to 17 Years | 0 (0.0%) | 0 (0.0%) |
| 18 to 34 Years | 22 (5.5%) | 0 (0.0%) |
| 35 to 64 Years | 0 (0.0%) | 21 (2.9%) |
| 65 to 74 Years | 0 (0.0%) | 20 (6.8%) |
| 75 Years and over | 11 (6.1%) | 18 (11.5%) |
Technology Access in Taylor
Computing Device Access in Taylor
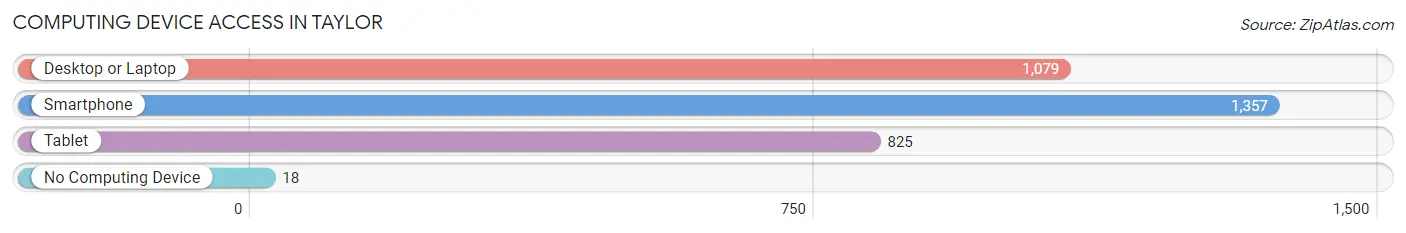
| Device Type | # Households | % Households |
| Desktop or Laptop | 1,079 | 77.2% |
| Smartphone | 1,357 | 97.1% |
| Tablet | 825 | 59.1% |
| No Computing Device | 18 | 1.3% |
| Total | 1,397 | 100.0% |
Internet Access in Taylor
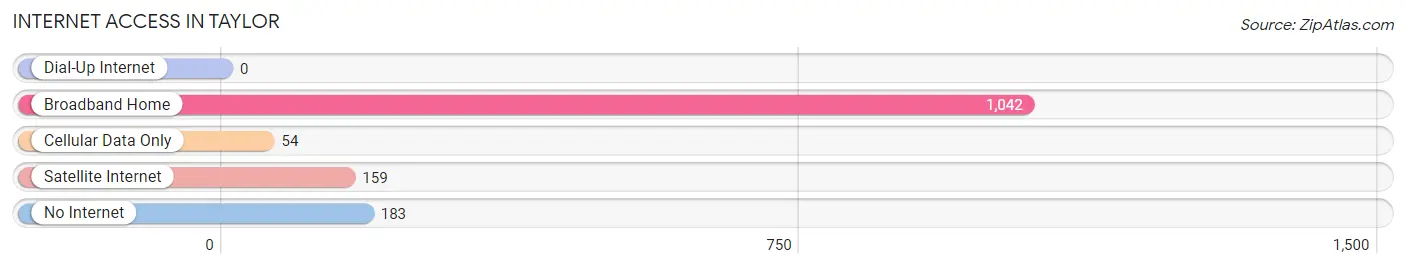
| Internet Type | # Households | % Households |
| Dial-Up Internet | 0 | 0.0% |
| Broadband Home | 1,042 | 74.6% |
| Cellular Data Only | 54 | 3.9% |
| Satellite Internet | 159 | 11.4% |
| No Internet | 183 | 13.1% |
| Total | 1,397 | 100.0% |
Taylor Summary
Taylor is a small town located in Navajo County, Arizona. It is situated in the White Mountains of Arizona, about 30 miles east of Show Low. The town was founded in 1876 by William Taylor, a Mormon pioneer, and was originally known as Taylorville. The town was incorporated in 1945 and has a population of approximately 2,000 people.
Geography
Taylor is located in the White Mountains of Arizona, at an elevation of 6,400 feet. The town is situated in a valley surrounded by mountains, with the highest peak in the area being Mount Baldy, which rises to an elevation of 11,400 feet. The town is located in a semi-arid climate, with hot summers and cold winters. The average annual precipitation is approximately 12 inches.
Economy
The economy of Taylor is largely based on tourism and agriculture. The town is home to several tourist attractions, including the Taylor Historical Museum, the Taylor Rodeo Grounds, and the Taylor Golf Course. The town also has several restaurants, shops, and lodging facilities. Agriculture is also an important part of the local economy, with the main crops being hay, alfalfa, and wheat.
Demographics
As of the 2010 census, the population of Taylor was 2,037. The racial makeup of the town was 94.3% White, 0.7% African American, 0.7% Native American, 0.3% Asian, 0.1% Pacific Islander, 2.2% from other races, and 1.9% from two or more races. Hispanic or Latino of any race were 5.2% of the population.
The median income for a household in Taylor was $35,938, and the median income for a family was $41,250. The per capita income for the town was $17,845. About 11.2% of families and 14.2% of the population were below the poverty line, including 18.2% of those under age 18 and 8.3% of those age 65 or over.
Conclusion
Taylor is a small town located in Navajo County, Arizona. It is situated in the White Mountains of Arizona, about 30 miles east of Show Low. The town was founded in 1876 by William Taylor, a Mormon pioneer, and was originally known as Taylorville. The town was incorporated in 1945 and has a population of approximately 2,000 people. The economy of Taylor is largely based on tourism and agriculture, and the town is home to several tourist attractions, restaurants, shops, and lodging facilities. The racial makeup of the town is 94.3% White, 0.7% African American, 0.7% Native American, 0.3% Asian, 0.1% Pacific Islander, 2.2% from other races, and 1.9% from two or more races. The median income for a household in Taylor was $35,938, and the median income for a family was $41,250.
Common Questions
What is Per Capita Income in Taylor?
Per Capita income in Taylor is $24,464.
What is the Median Family Income in Taylor?
Median Family Income in Taylor is $84,220.
What is the Median Household income in Taylor?
Median Household Income in Taylor is $75,125.
What is Income or Wage Gap in Taylor?
Income or Wage Gap in Taylor is 35.6%.
Women in Taylor earn 64.4 cents for every dollar earned by a man.
What is Family Income Deficit in Taylor?
Family Income Deficit in Taylor is $12,838.
Families that are below poverty line in Taylor earn $12,838 less on average than the poverty threshold level.
What is Inequality or Gini Index in Taylor?
Inequality or Gini Index in Taylor is 0.38.
What is the Total Population of Taylor?
Total Population of Taylor is 4,062.
What is the Total Male Population of Taylor?
Total Male Population of Taylor is 1,918.
What is the Total Female Population of Taylor?
Total Female Population of Taylor is 2,144.
What is the Ratio of Males per 100 Females in Taylor?
There are 89.46 Males per 100 Females in Taylor.
What is the Ratio of Females per 100 Males in Taylor?
There are 111.78 Females per 100 Males in Taylor.
What is the Median Population Age in Taylor?
Median Population Age in Taylor is 35.5 Years.
What is the Average Family Size in Taylor
Average Family Size in Taylor is 3.5 People.
What is the Average Household Size in Taylor
Average Household Size in Taylor is 2.9 People.
How Large is the Labor Force in Taylor?
There are 1,497 People in the Labor Forcein in Taylor.
What is the Percentage of People in the Labor Force in Taylor?
53.2% of People are in the Labor Force in Taylor.
What is the Unemployment Rate in Taylor?
Unemployment Rate in Taylor is 4.9%.