Willcox, AZ Map & Demographics
Willcox Map
Willcox Overview
$19,625
PER CAPITA INCOME
$55,507
AVG FAMILY INCOME
$40,884
AVG HOUSEHOLD INCOME
15.9%
WAGE / INCOME GAP [ % ]
84.1¢/ $1
WAGE / INCOME GAP [ $ ]
$13,640
FAMILY INCOME DEFICIT
0.43
INEQUALITY / GINI INDEX
3,232
TOTAL POPULATION
1,619
MALE POPULATION
1,613
FEMALE POPULATION
100.37
MALES / 100 FEMALES
99.63
FEMALES / 100 MALES
30.8
MEDIAN AGE
4.0
AVG FAMILY SIZE
2.9
AVG HOUSEHOLD SIZE
1,462
LABOR FORCE [ PEOPLE ]
58.2%
PERCENT IN LABOR FORCE
16.8%
UNEMPLOYMENT RATE
Willcox Zip Codes
Willcox Area Codes
Income in Willcox
Income Overview in Willcox
Per Capita Income in Willcox is $19,625, while median incomes of families and households are $55,507 and $40,884 respectively.
| Characteristic | Number | Measure |
| Per Capita Income | 3,232 | $19,625 |
| Median Family Income | 641 | $55,507 |
| Mean Family Income | 641 | $58,978 |
| Median Household Income | 1,109 | $40,884 |
| Mean Household Income | 1,109 | $49,211 |
| Income Deficit | 641 | $13,640 |
| Wage / Income Gap (%) | 3,232 | 15.86% |
| Wage / Income Gap ($) | 3,232 | 84.14¢ per $1 |
| Gini / Inequality Index | 3,232 | 0.43 |
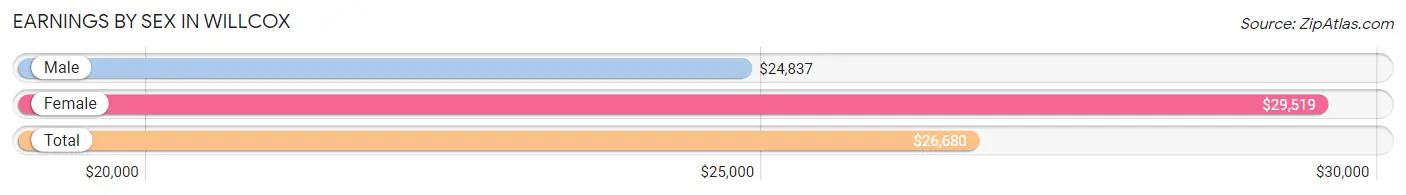
Earnings by Sex in Willcox
Average Earnings in Willcox are $26,680, $24,837 for men and $29,519 for women, a difference of 15.9%.
| Sex | Number | Average Earnings |
| Male | 677 (47.4%) | $24,837 |
| Female | 752 (52.6%) | $29,519 |
| Total | 1,429 (100.0%) | $26,680 |
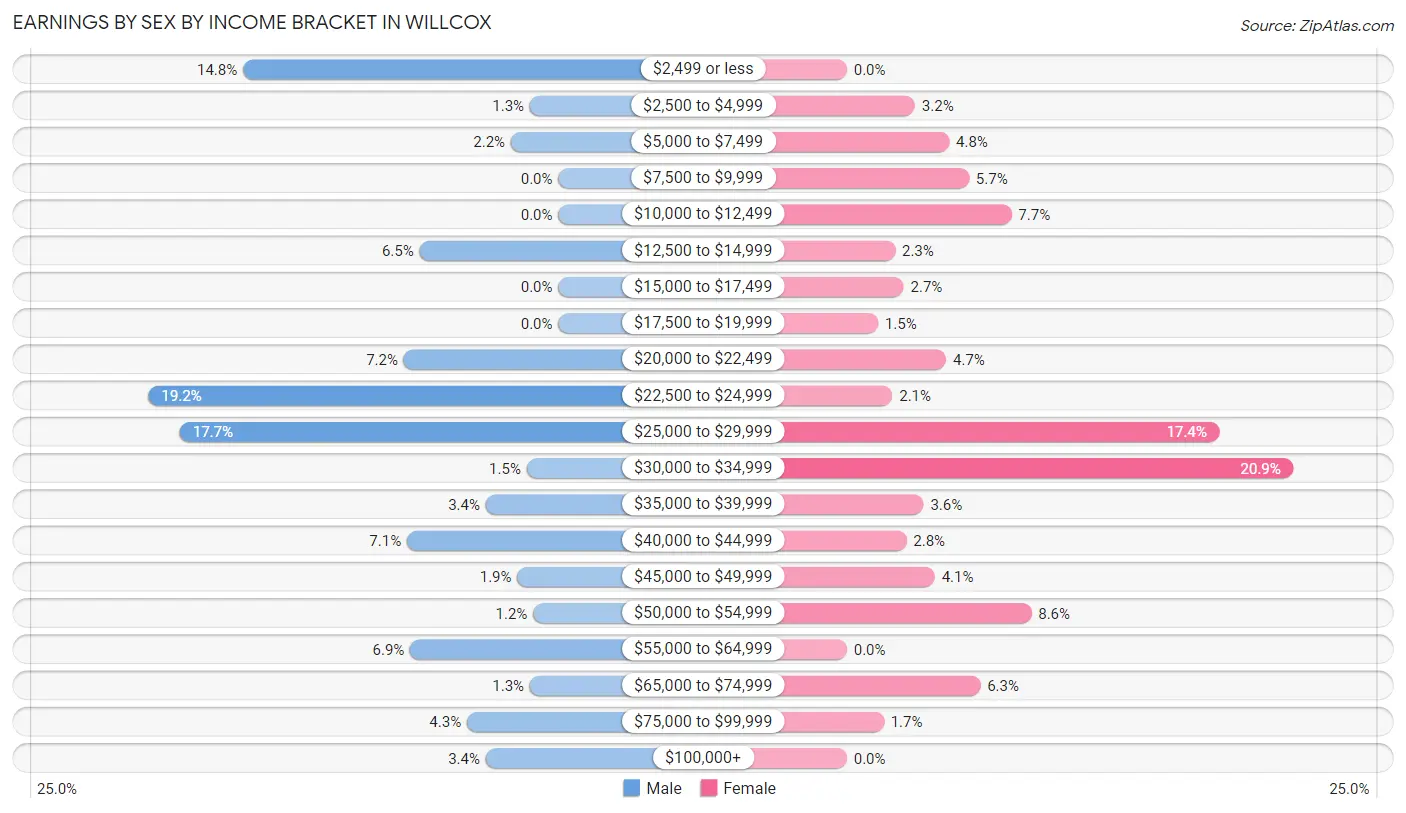
Earnings by Sex by Income Bracket in Willcox
The most common earnings brackets in Willcox are $22,500 to $24,999 for men (130 | 19.2%) and $30,000 to $34,999 for women (157 | 20.9%).
| Income | Male | Female |
| $2,499 or less | 100 (14.8%) | 0 (0.0%) |
| $2,500 to $4,999 | 9 (1.3%) | 24 (3.2%) |
| $5,000 to $7,499 | 15 (2.2%) | 36 (4.8%) |
| $7,500 to $9,999 | 0 (0.0%) | 43 (5.7%) |
| $10,000 to $12,499 | 0 (0.0%) | 58 (7.7%) |
| $12,500 to $14,999 | 44 (6.5%) | 17 (2.3%) |
| $15,000 to $17,499 | 0 (0.0%) | 20 (2.7%) |
| $17,500 to $19,999 | 0 (0.0%) | 11 (1.5%) |
| $20,000 to $22,499 | 49 (7.2%) | 35 (4.6%) |
| $22,500 to $24,999 | 130 (19.2%) | 16 (2.1%) |
| $25,000 to $29,999 | 120 (17.7%) | 131 (17.4%) |
| $30,000 to $34,999 | 10 (1.5%) | 157 (20.9%) |
| $35,000 to $39,999 | 23 (3.4%) | 27 (3.6%) |
| $40,000 to $44,999 | 48 (7.1%) | 21 (2.8%) |
| $45,000 to $49,999 | 13 (1.9%) | 31 (4.1%) |
| $50,000 to $54,999 | 8 (1.2%) | 65 (8.6%) |
| $55,000 to $64,999 | 47 (6.9%) | 0 (0.0%) |
| $65,000 to $74,999 | 9 (1.3%) | 47 (6.2%) |
| $75,000 to $99,999 | 29 (4.3%) | 13 (1.7%) |
| $100,000+ | 23 (3.4%) | 0 (0.0%) |
| Total | 677 (100.0%) | 752 (100.0%) |
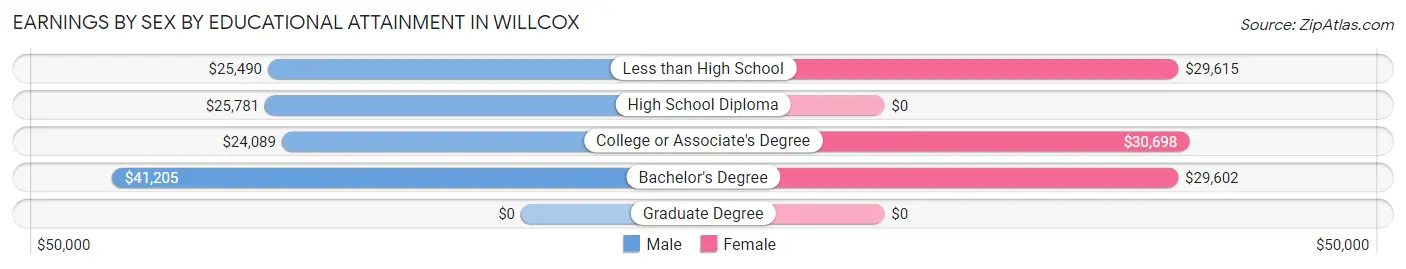
Earnings by Sex by Educational Attainment in Willcox
Average earnings in Willcox are $25,596 for men and $28,990 for women, a difference of 11.7%. Men with an educational attainment of bachelor's degree enjoy the highest average annual earnings of $41,205, while those with college or associate's degree education earn the least with $24,089. Women with an educational attainment of college or associate's degree earn the most with the average annual earnings of $30,698, while those with bachelor's degree education have the smallest earnings of $29,602.
| Educational Attainment | Male Income | Female Income |
| Less than High School | $25,490 | $29,615 |
| High School Diploma | $25,781 | $0 |
| College or Associate's Degree | $24,089 | $30,698 |
| Bachelor's Degree | $41,205 | $29,602 |
| Graduate Degree | - | - |
| Total | $25,596 | $28,990 |
Family Income in Willcox
Family Income Brackets in Willcox
According to the Willcox family income data, there are 173 families falling into the $50,000 to $74,999 income range, which is the most common income bracket and makes up 27.0% of all families.
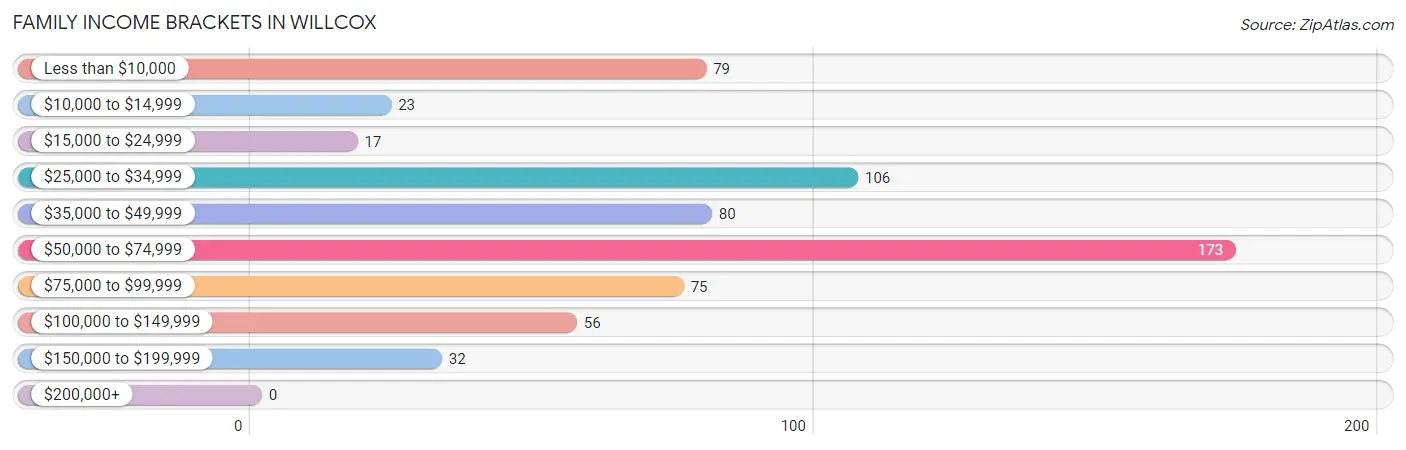
| Income Bracket | # Families | % Families |
| Less than $10,000 | 79 | 12.3% |
| $10,000 to $14,999 | 23 | 3.6% |
| $15,000 to $24,999 | 17 | 2.7% |
| $25,000 to $34,999 | 106 | 16.5% |
| $35,000 to $49,999 | 80 | 12.5% |
| $50,000 to $74,999 | 173 | 27.0% |
| $75,000 to $99,999 | 75 | 11.7% |
| $100,000 to $149,999 | 56 | 8.7% |
| $150,000 to $199,999 | 32 | 5.0% |
| $200,000+ | 0 | 0.0% |
Family Income by Famaliy Size in Willcox
4-person families (225 | 35.1%) account for the highest median family income in Willcox with $60,417 per family, while 2-person families (211 | 32.9%) have the highest median income of $28,812 per family member.
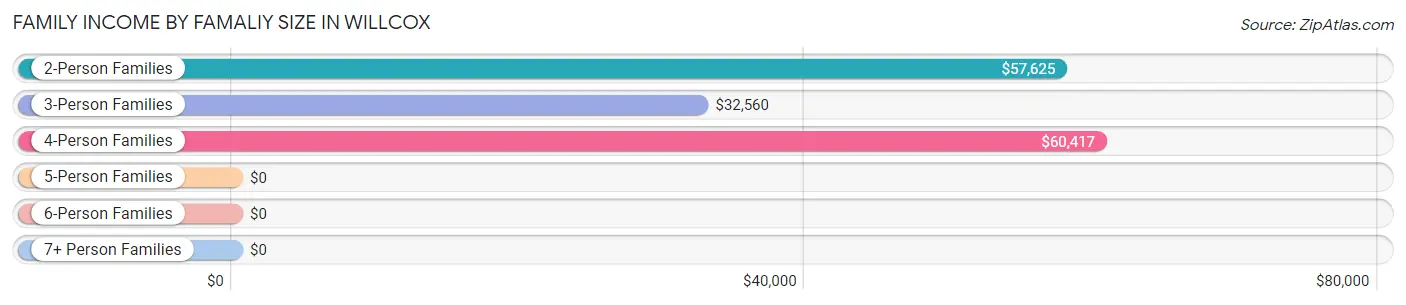
| Income Bracket | # Families | Median Income |
| 2-Person Families | 211 (32.9%) | $57,625 |
| 3-Person Families | 153 (23.9%) | $32,560 |
| 4-Person Families | 225 (35.1%) | $60,417 |
| 5-Person Families | 28 (4.4%) | $0 |
| 6-Person Families | 5 (0.8%) | $0 |
| 7+ Person Families | 19 (3.0%) | $0 |
| Total | 641 (100.0%) | $55,507 |
Family Income by Number of Earners in Willcox
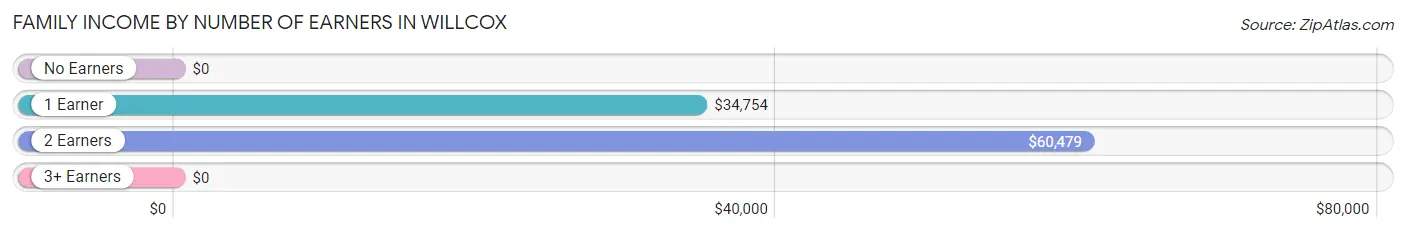
| Number of Earners | # Families | Median Income |
| No Earners | 63 (9.8%) | $0 |
| 1 Earner | 263 (41.0%) | $34,754 |
| 2 Earners | 289 (45.1%) | $60,479 |
| 3+ Earners | 26 (4.1%) | $0 |
| Total | 641 (100.0%) | $55,507 |
Household Income in Willcox
Household Income Brackets in Willcox
With 228 households falling in the category, the $50,000 to $74,999 income range is the most frequent in Willcox, accounting for 20.6% of all households.
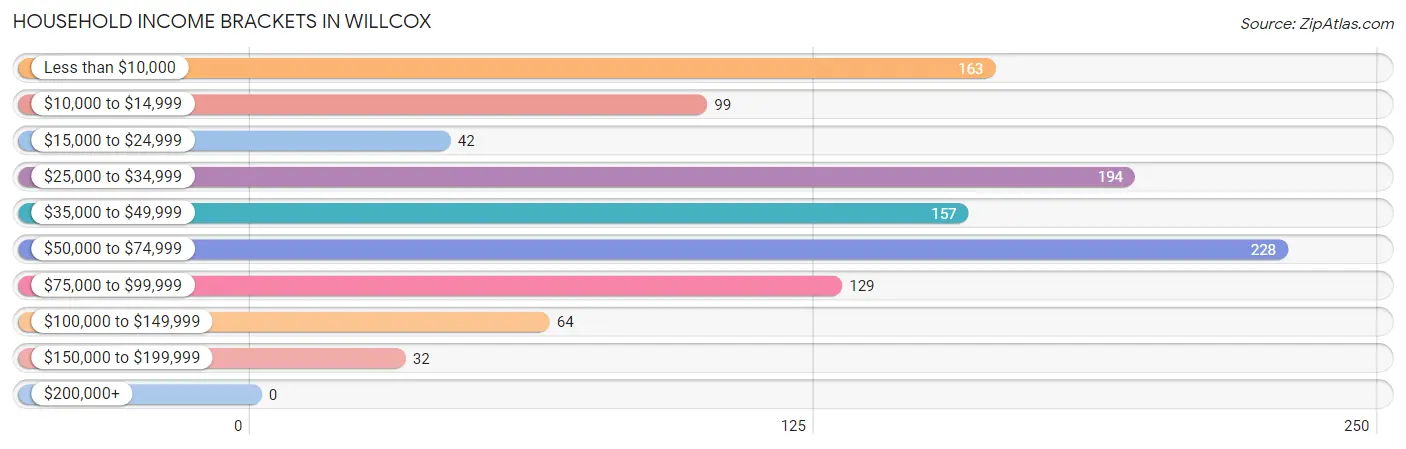
| Income Bracket | # Households | % Households |
| Less than $10,000 | 163 | 14.7% |
| $10,000 to $14,999 | 99 | 8.9% |
| $15,000 to $24,999 | 42 | 3.8% |
| $25,000 to $34,999 | 194 | 17.5% |
| $35,000 to $49,999 | 157 | 14.2% |
| $50,000 to $74,999 | 228 | 20.6% |
| $75,000 to $99,999 | 129 | 11.6% |
| $100,000 to $149,999 | 64 | 5.8% |
| $150,000 to $199,999 | 32 | 2.9% |
| $200,000+ | 0 | 0.0% |
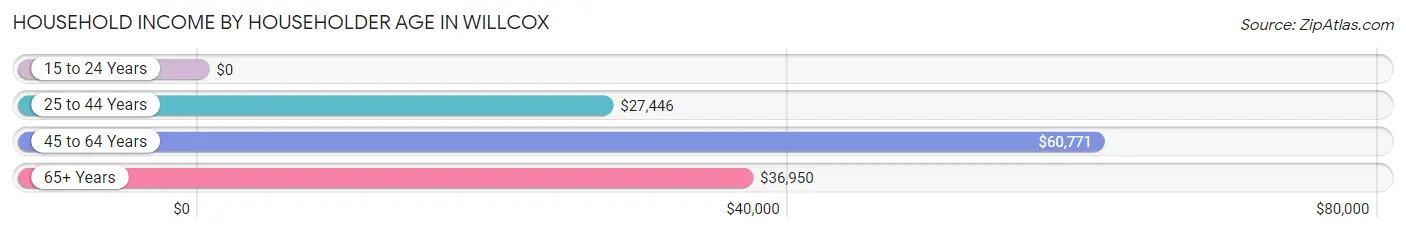
Household Income by Householder Age in Willcox
The median household income in Willcox is $40,884, with the highest median household income of $60,771 found in the 45 to 64 years age bracket for the primary householder. A total of 353 households (31.8%) fall into this category. Meanwhile, the 15 to 24 years age bracket for the primary householder has the lowest median household income of $0, with 52 households (4.7%) in this group.
| Income Bracket | # Households | Median Income |
| 15 to 24 Years | 52 (4.7%) | $0 |
| 25 to 44 Years | 301 (27.1%) | $27,446 |
| 45 to 64 Years | 353 (31.8%) | $60,771 |
| 65+ Years | 403 (36.3%) | $36,950 |
| Total | 1,109 (100.0%) | $40,884 |
Poverty in Willcox
Income Below Poverty by Sex and Age in Willcox
With 14.7% poverty level for males and 23.1% for females among the residents of Willcox, 25 to 34 year old males and 15 year old females are the most vulnerable to poverty, with 75 males (27.4%) and 25 females (48.1%) in their respective age groups living below the poverty level.
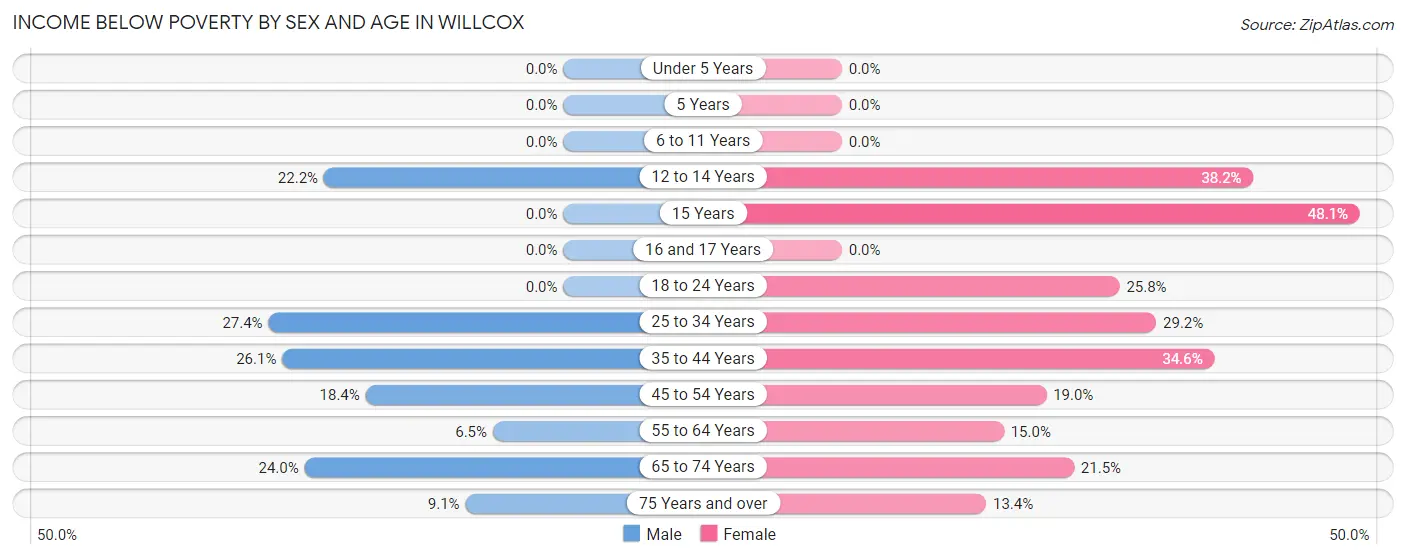
| Age Bracket | Male | Female |
| Under 5 Years | 0 (0.0%) | 0 (0.0%) |
| 5 Years | 0 (0.0%) | 0 (0.0%) |
| 6 to 11 Years | 0 (0.0%) | 0 (0.0%) |
| 12 to 14 Years | 28 (22.2%) | 34 (38.2%) |
| 15 Years | 0 (0.0%) | 25 (48.1%) |
| 16 and 17 Years | 0 (0.0%) | 0 (0.0%) |
| 18 to 24 Years | 0 (0.0%) | 42 (25.8%) |
| 25 to 34 Years | 75 (27.4%) | 105 (29.2%) |
| 35 to 44 Years | 54 (26.1%) | 64 (34.6%) |
| 45 to 54 Years | 20 (18.3%) | 33 (19.0%) |
| 55 to 64 Years | 10 (6.5%) | 23 (15.0%) |
| 65 to 74 Years | 43 (24.0%) | 28 (21.5%) |
| 75 Years and over | 7 (9.1%) | 17 (13.4%) |
| Total | 237 (14.7%) | 371 (23.1%) |
Income Above Poverty by Sex and Age in Willcox
According to the poverty statistics in Willcox, males aged under 5 years and females aged under 5 years are the age groups that are most secure financially, with 100.0% of males and 100.0% of females in these age groups living above the poverty line.
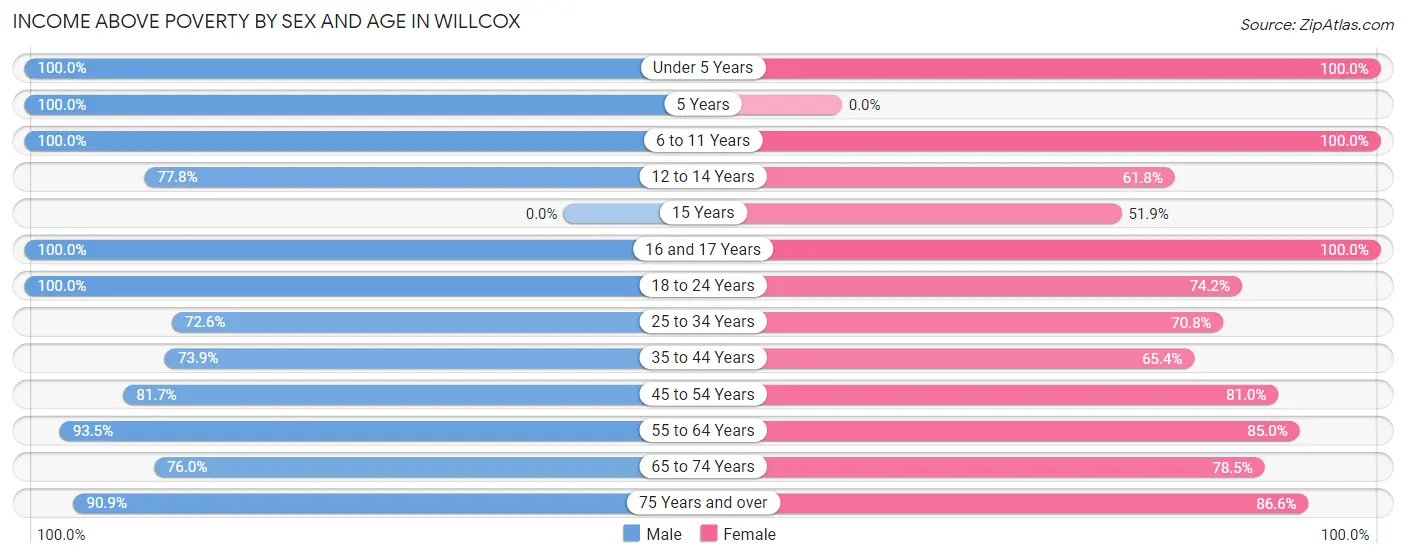
| Age Bracket | Male | Female |
| Under 5 Years | 129 (100.0%) | 75 (100.0%) |
| 5 Years | 106 (100.0%) | 0 (0.0%) |
| 6 to 11 Years | 69 (100.0%) | 74 (100.0%) |
| 12 to 14 Years | 98 (77.8%) | 55 (61.8%) |
| 15 Years | 0 (0.0%) | 27 (51.9%) |
| 16 and 17 Years | 52 (100.0%) | 21 (100.0%) |
| 18 to 24 Years | 130 (100.0%) | 121 (74.2%) |
| 25 to 34 Years | 199 (72.6%) | 255 (70.8%) |
| 35 to 44 Years | 153 (73.9%) | 121 (65.4%) |
| 45 to 54 Years | 89 (81.7%) | 141 (81.0%) |
| 55 to 64 Years | 143 (93.5%) | 130 (85.0%) |
| 65 to 74 Years | 136 (76.0%) | 102 (78.5%) |
| 75 Years and over | 70 (90.9%) | 110 (86.6%) |
| Total | 1,374 (85.3%) | 1,232 (76.9%) |
Income Below Poverty Among Married-Couple Families in Willcox
The poverty statistics for married-couple families in Willcox show that 10.0% or 36 of the total 360 families live below the poverty line. Families with no children have the highest poverty rate of 12.2%, comprising of 30 families. On the other hand, families with 3 or 4 children have the lowest poverty rate of 0.0%, which includes 0 families.
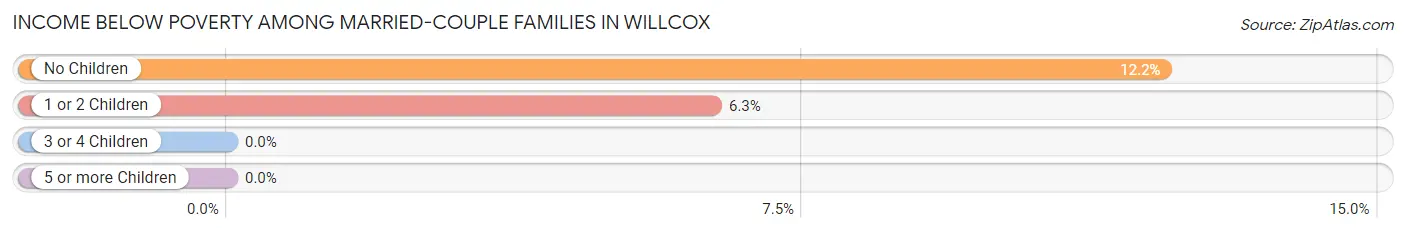
| Children | Above Poverty | Below Poverty |
| No Children | 216 (87.8%) | 30 (12.2%) |
| 1 or 2 Children | 89 (93.7%) | 6 (6.3%) |
| 3 or 4 Children | 10 (100.0%) | 0 (0.0%) |
| 5 or more Children | 9 (100.0%) | 0 (0.0%) |
| Total | 324 (90.0%) | 36 (10.0%) |
Income Below Poverty Among Single-Parent Households in Willcox
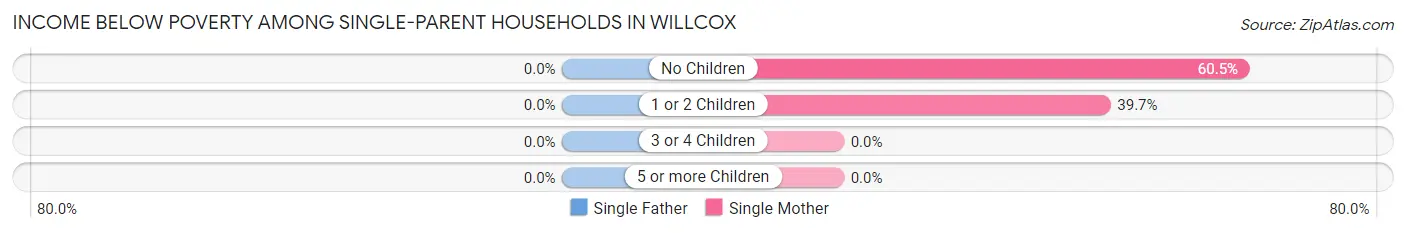
| Children | Single Father | Single Mother |
| No Children | 0 (0.0%) | 23 (60.5%) |
| 1 or 2 Children | 0 (0.0%) | 60 (39.7%) |
| 3 or 4 Children | 0 (0.0%) | 0 (0.0%) |
| 5 or more Children | 0 (0.0%) | 0 (0.0%) |
| Total | 0 (0.0%) | 83 (35.5%) |
Income Below Poverty Among Married-Couple vs Single-Parent Households in Willcox
The poverty data for Willcox shows that 36 of the married-couple family households (10.0%) and 83 of the single-parent households (29.5%) are living below the poverty level. Within the married-couple family households, those with no children have the highest poverty rate, with 30 households (12.2%) falling below the poverty line. Among the single-parent households, those with 1 or 2 children have the highest poverty rate, with 60 household (37.0%) living below poverty.
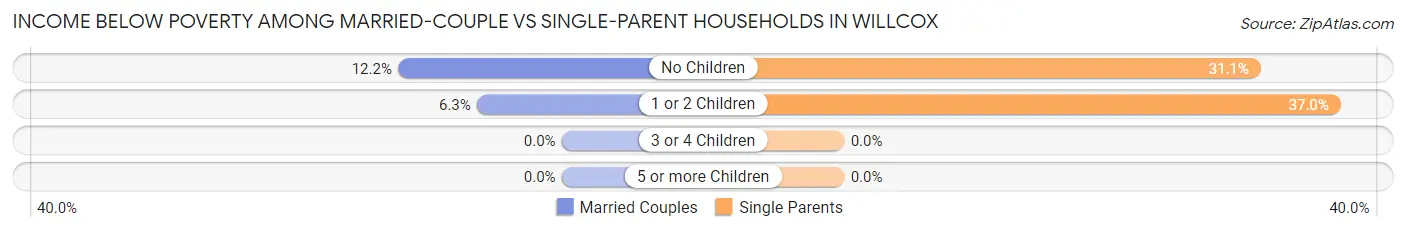
| Children | Married-Couple Families | Single-Parent Households |
| No Children | 30 (12.2%) | 23 (31.1%) |
| 1 or 2 Children | 6 (6.3%) | 60 (37.0%) |
| 3 or 4 Children | 0 (0.0%) | 0 (0.0%) |
| 5 or more Children | 0 (0.0%) | 0 (0.0%) |
| Total | 36 (10.0%) | 83 (29.5%) |
Race in Willcox
The most populous races in Willcox are White / Caucasian (2,111 | 65.3%), Hispanic or Latino (1,928 | 59.7%), and Two or more Races (605 | 18.7%).
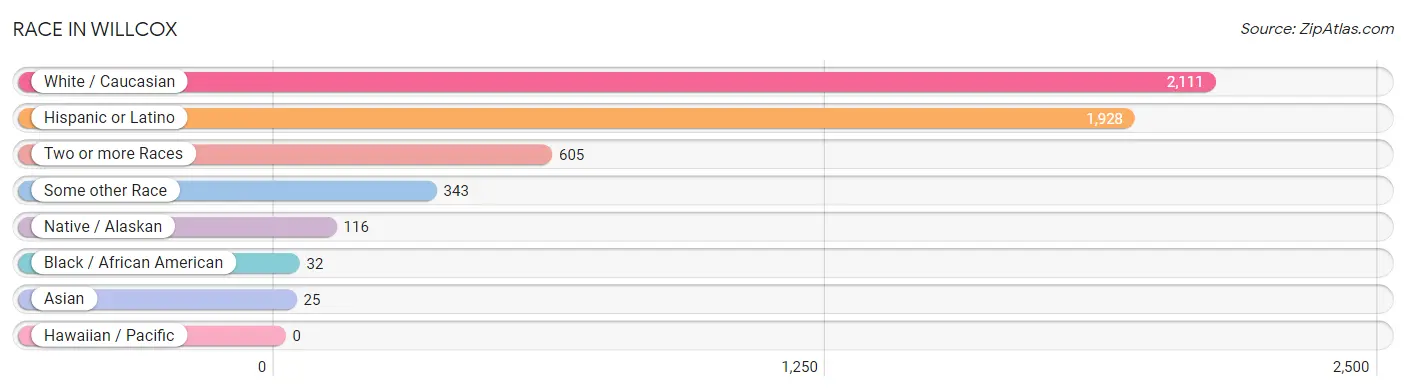
| Race | # Population | % Population |
| Asian | 25 | 0.8% |
| Black / African American | 32 | 1.0% |
| Hawaiian / Pacific | 0 | 0.0% |
| Hispanic or Latino | 1,928 | 59.7% |
| Native / Alaskan | 116 | 3.6% |
| White / Caucasian | 2,111 | 65.3% |
| Two or more Races | 605 | 18.7% |
| Some other Race | 343 | 10.6% |
| Total | 3,232 | 100.0% |
Ancestry in Willcox
The most populous ancestries reported in Willcox are Mexican (1,852 | 57.3%), German (446 | 13.8%), Irish (347 | 10.7%), English (212 | 6.6%), and European (136 | 4.2%), together accounting for 92.6% of all Willcox residents.
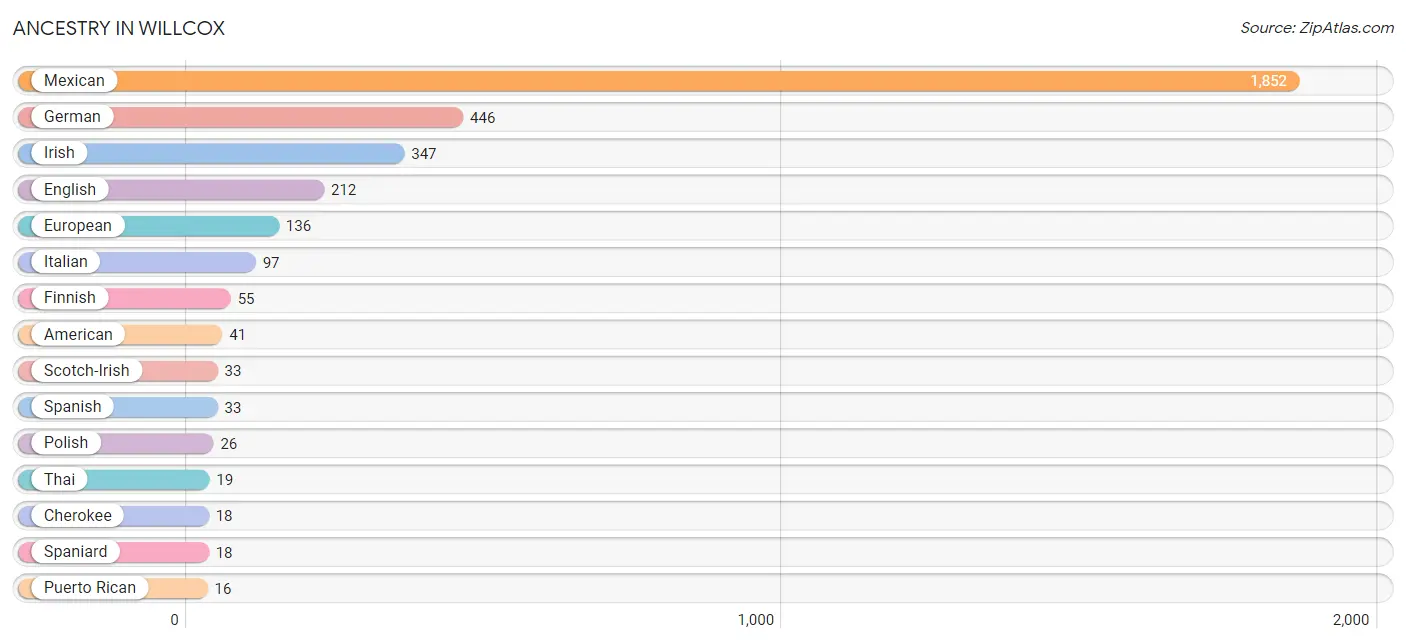
| Ancestry | # Population | % Population |
| American | 41 | 1.3% |
| Arab | 15 | 0.5% |
| Australian | 5 | 0.2% |
| British | 10 | 0.3% |
| Burmese | 6 | 0.2% |
| Cherokee | 18 | 0.6% |
| Egyptian | 15 | 0.5% |
| English | 212 | 6.6% |
| European | 136 | 4.2% |
| Finnish | 55 | 1.7% |
| French | 13 | 0.4% |
| French Canadian | 7 | 0.2% |
| German | 446 | 13.8% |
| Irish | 347 | 10.7% |
| Italian | 97 | 3.0% |
| Kiowa | 10 | 0.3% |
| Mexican | 1,852 | 57.3% |
| Navajo | 2 | 0.1% |
| Norwegian | 10 | 0.3% |
| Polish | 26 | 0.8% |
| Puerto Rican | 16 | 0.5% |
| Scandinavian | 12 | 0.4% |
| Scotch-Irish | 33 | 1.0% |
| Scottish | 7 | 0.2% |
| Spaniard | 18 | 0.6% |
| Spanish | 33 | 1.0% |
| Thai | 19 | 0.6% |
| Welsh | 6 | 0.2% | View All 28 Rows |
Immigrants in Willcox
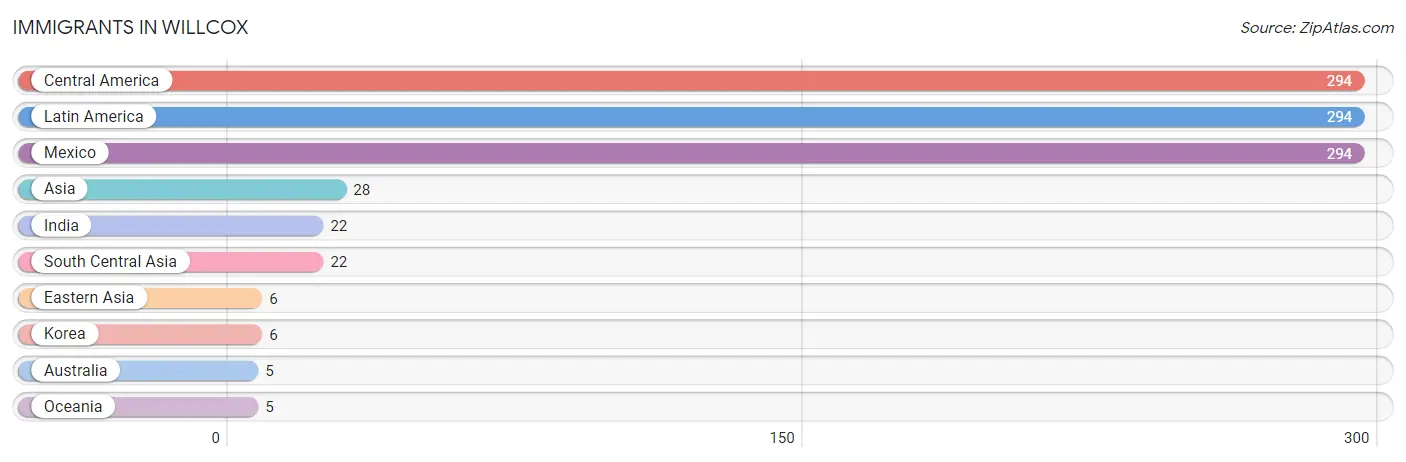
The most numerous immigrant groups reported in Willcox came from Central America (294 | 9.1%), Latin America (294 | 9.1%), Mexico (294 | 9.1%), Asia (28 | 0.9%), and India (22 | 0.7%), together accounting for 28.8% of all Willcox residents.
| Immigration Origin | # Population | % Population |
| Asia | 28 | 0.9% |
| Australia | 5 | 0.2% |
| Central America | 294 | 9.1% |
| Eastern Asia | 6 | 0.2% |
| India | 22 | 0.7% |
| Korea | 6 | 0.2% |
| Latin America | 294 | 9.1% |
| Mexico | 294 | 9.1% |
| Oceania | 5 | 0.2% |
| South Central Asia | 22 | 0.7% | View All 10 Rows |
Sex and Age in Willcox
Sex and Age in Willcox
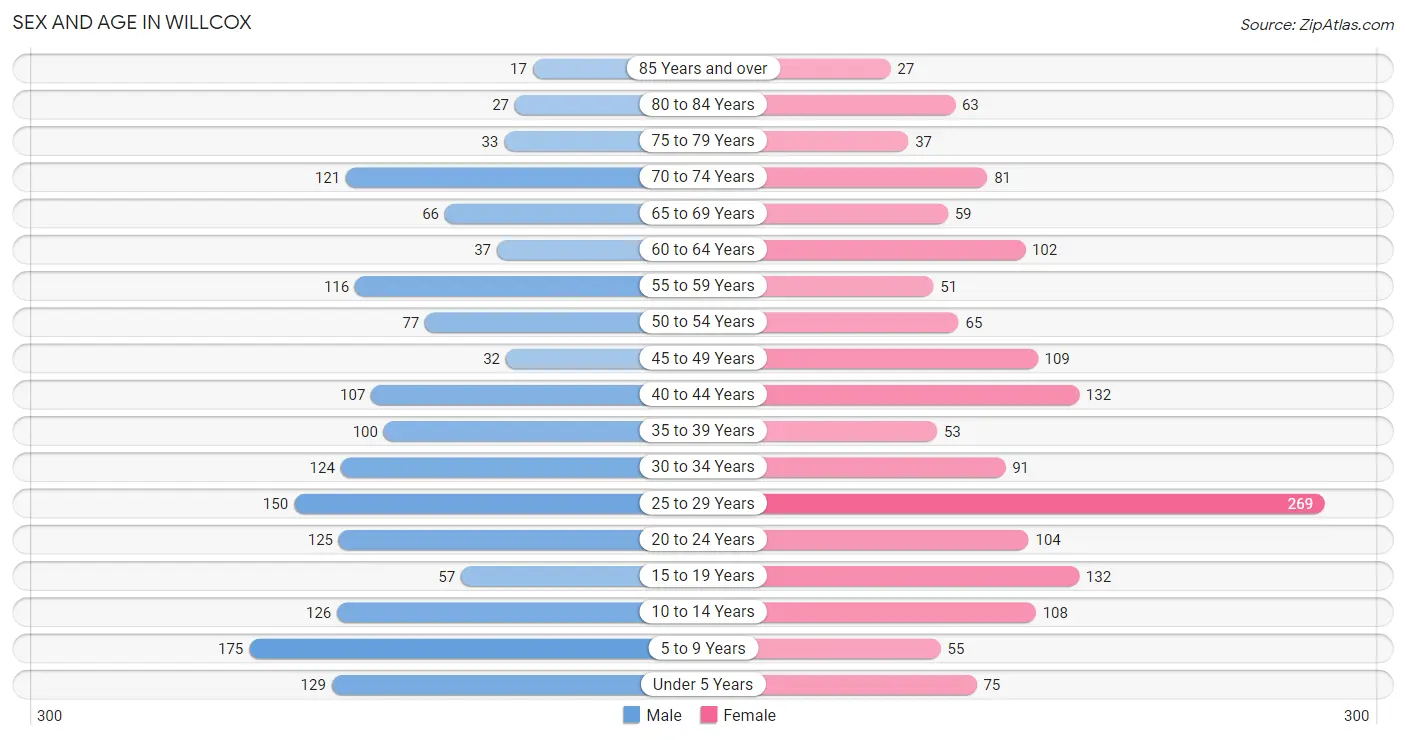
The most populous age groups in Willcox are 5 to 9 Years (175 | 10.8%) for men and 25 to 29 Years (269 | 16.7%) for women.
| Age Bracket | Male | Female |
| Under 5 Years | 129 (8.0%) | 75 (4.6%) |
| 5 to 9 Years | 175 (10.8%) | 55 (3.4%) |
| 10 to 14 Years | 126 (7.8%) | 108 (6.7%) |
| 15 to 19 Years | 57 (3.5%) | 132 (8.2%) |
| 20 to 24 Years | 125 (7.7%) | 104 (6.5%) |
| 25 to 29 Years | 150 (9.3%) | 269 (16.7%) |
| 30 to 34 Years | 124 (7.7%) | 91 (5.6%) |
| 35 to 39 Years | 100 (6.2%) | 53 (3.3%) |
| 40 to 44 Years | 107 (6.6%) | 132 (8.2%) |
| 45 to 49 Years | 32 (2.0%) | 109 (6.8%) |
| 50 to 54 Years | 77 (4.8%) | 65 (4.0%) |
| 55 to 59 Years | 116 (7.2%) | 51 (3.2%) |
| 60 to 64 Years | 37 (2.3%) | 102 (6.3%) |
| 65 to 69 Years | 66 (4.1%) | 59 (3.7%) |
| 70 to 74 Years | 121 (7.5%) | 81 (5.0%) |
| 75 to 79 Years | 33 (2.0%) | 37 (2.3%) |
| 80 to 84 Years | 27 (1.7%) | 63 (3.9%) |
| 85 Years and over | 17 (1.1%) | 27 (1.7%) |
| Total | 1,619 (100.0%) | 1,613 (100.0%) |
Families and Households in Willcox
Median Family Size in Willcox
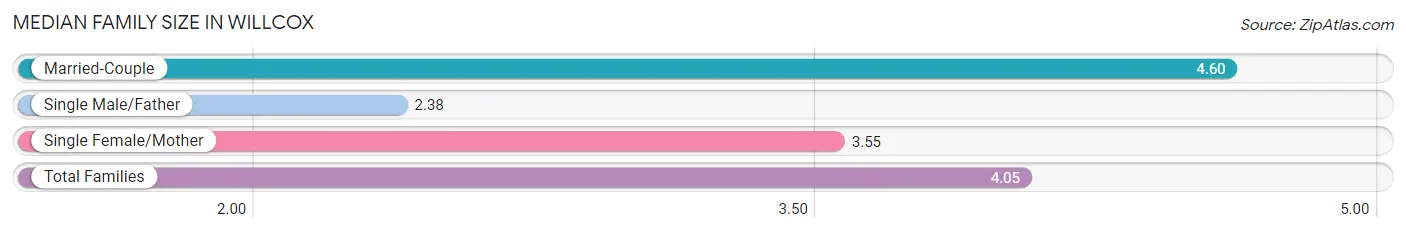
The median family size in Willcox is 4.05 persons per family, with married-couple families (360 | 56.2%) accounting for the largest median family size of 4.6 persons per family. On the other hand, single male/father families (47 | 7.3%) represent the smallest median family size with 2.38 persons per family.
| Family Type | # Families | Family Size |
| Married-Couple | 360 (56.2%) | 4.60 |
| Single Male/Father | 47 (7.3%) | 2.38 |
| Single Female/Mother | 234 (36.5%) | 3.55 |
| Total Families | 641 (100.0%) | 4.05 |
Median Household Size in Willcox
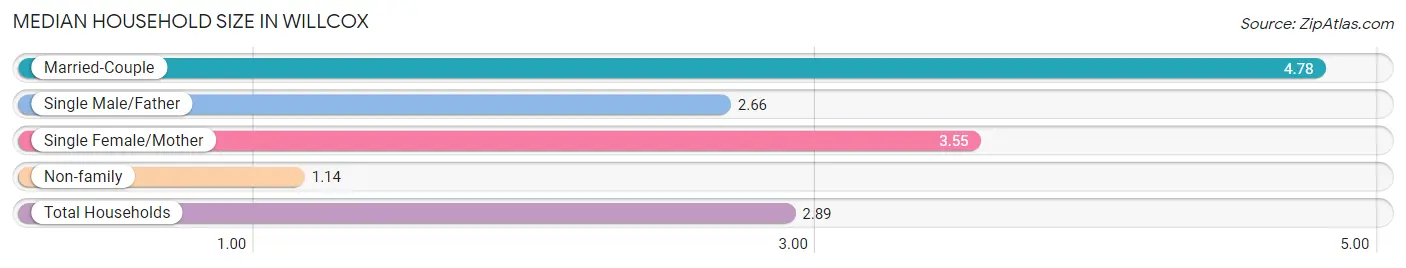
The median household size in Willcox is 2.89 persons per household, with married-couple households (360 | 32.5%) accounting for the largest median household size of 4.78 persons per household. non-family households (468 | 42.2%) represent the smallest median household size with 1.14 persons per household.
| Household Type | # Households | Household Size |
| Married-Couple | 360 (32.5%) | 4.78 |
| Single Male/Father | 47 (4.2%) | 2.66 |
| Single Female/Mother | 234 (21.1%) | 3.55 |
| Non-family | 468 (42.2%) | 1.14 |
| Total Households | 1,109 (100.0%) | 2.89 |
Household Size by Marriage Status in Willcox
Out of a total of 1,109 households in Willcox, 641 (57.8%) are family households, while 468 (42.2%) are nonfamily households. The most numerous type of family households are 4-person households, comprising 225, and the most common type of nonfamily households are 1-person households, comprising 433.
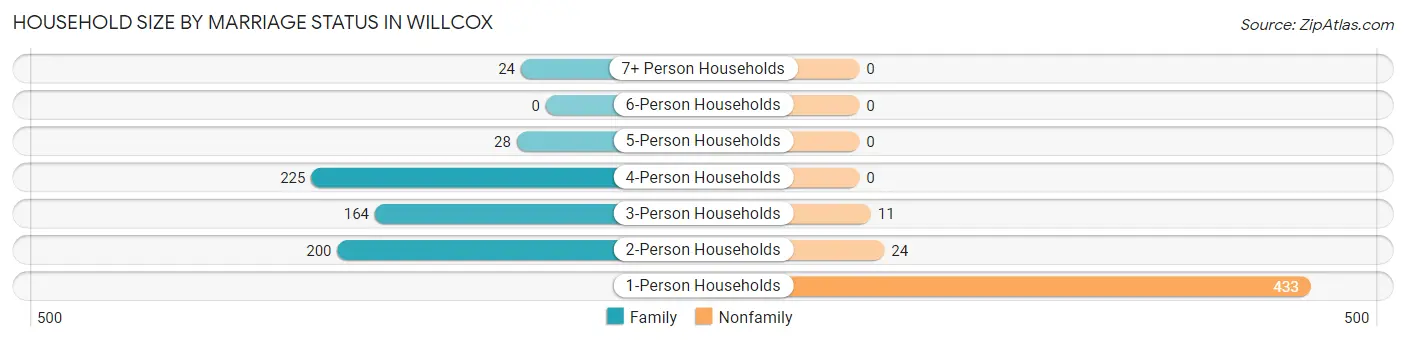
| Household Size | Family Households | Nonfamily Households |
| 1-Person Households | - | 433 (39.0%) |
| 2-Person Households | 200 (18.0%) | 24 (2.2%) |
| 3-Person Households | 164 (14.8%) | 11 (1.0%) |
| 4-Person Households | 225 (20.3%) | 0 (0.0%) |
| 5-Person Households | 28 (2.5%) | 0 (0.0%) |
| 6-Person Households | 0 (0.0%) | 0 (0.0%) |
| 7+ Person Households | 24 (2.2%) | 0 (0.0%) |
| Total | 641 (57.8%) | 468 (42.2%) |
Female Fertility in Willcox
Fertility by Age in Willcox
Average fertility rate in Willcox is 26.0 births per 1,000 women. Women in the age bracket of 20 to 34 years have the highest fertility rate with 52.0 births per 1,000 women. Women in the age bracket of 20 to 34 years acount for 100.0% of all women with births.
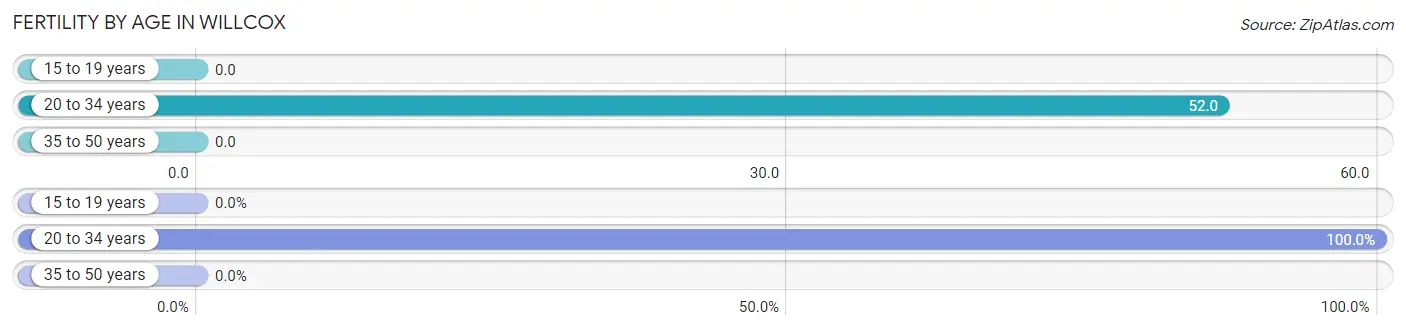
| Age Bracket | Women with Births | Births / 1,000 Women |
| 15 to 19 years | 0 (0.0%) | 0.0 |
| 20 to 34 years | 24 (100.0%) | 52.0 |
| 35 to 50 years | 0 (0.0%) | 0.0 |
| Total | 24 (100.0%) | 26.0 |
Fertility by Age by Marriage Status in Willcox
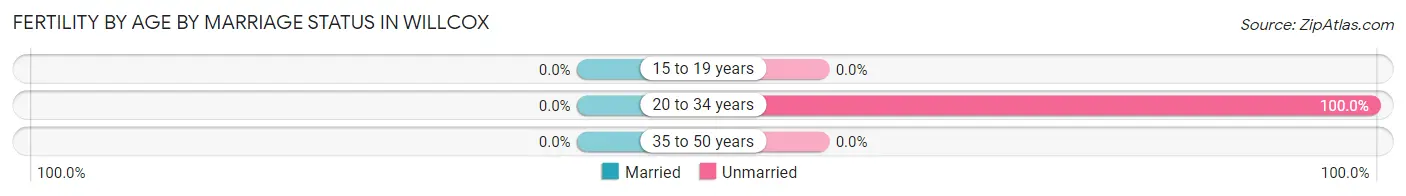
| Age Bracket | Married | Unmarried |
| 15 to 19 years | 0 (0.0%) | 0 (0.0%) |
| 20 to 34 years | 0 (0.0%) | 24 (100.0%) |
| 35 to 50 years | 0 (0.0%) | 0 (0.0%) |
| Total | 0 (0.0%) | 24 (100.0%) |
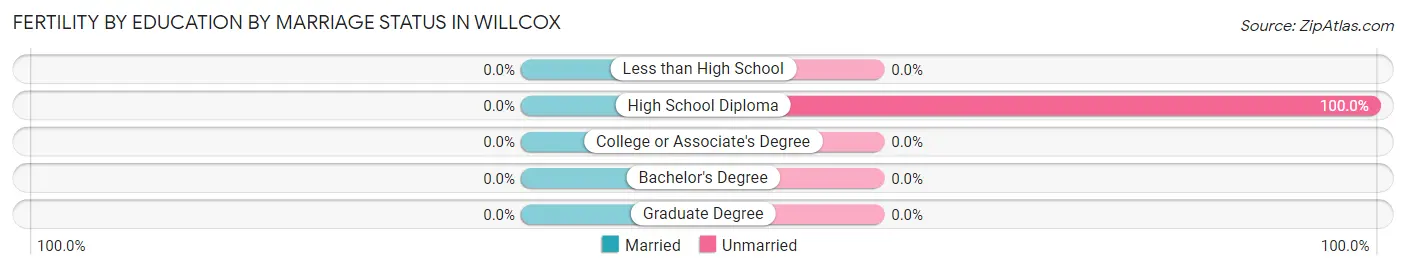
Fertility by Education in Willcox
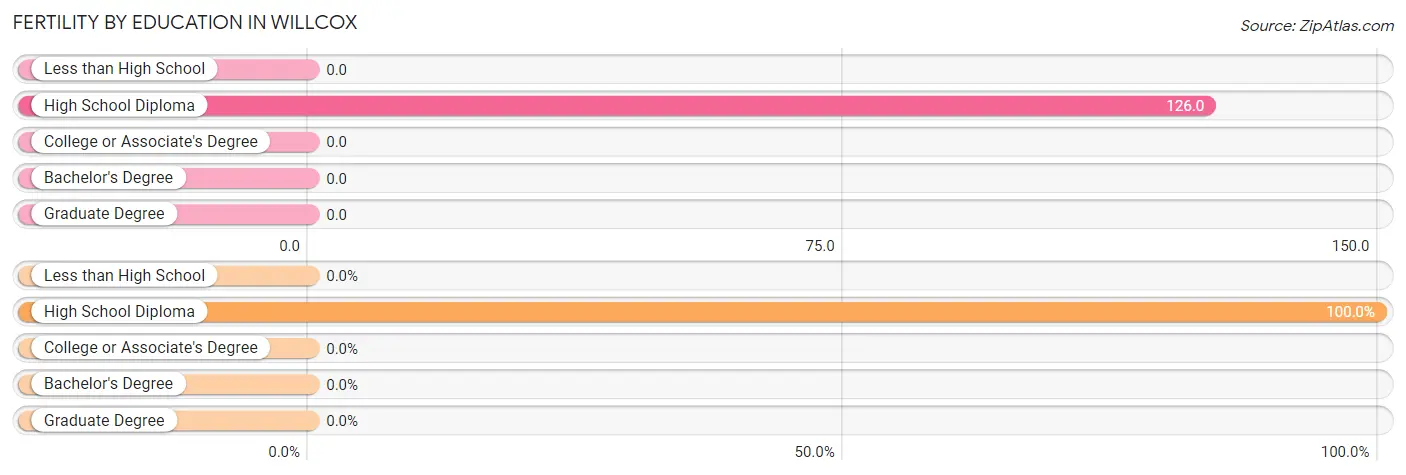
| Educational Attainment | Women with Births | Births / 1,000 Women |
| Less than High School | 0 (0.0%) | 0.0 |
| High School Diploma | 24 (100.0%) | 126.0 |
| College or Associate's Degree | 0 (0.0%) | 0.0 |
| Bachelor's Degree | 0 (0.0%) | 0.0 |
| Graduate Degree | 0 (0.0%) | 0.0 |
| Total | 24 (100.0%) | 26.0 |
Fertility by Education by Marriage Status in Willcox
| Educational Attainment | Married | Unmarried |
| Less than High School | 0 (0.0%) | 0 (0.0%) |
| High School Diploma | 0 (0.0%) | 24 (100.0%) |
| College or Associate's Degree | 0 (0.0%) | 0 (0.0%) |
| Bachelor's Degree | 0 (0.0%) | 0 (0.0%) |
| Graduate Degree | 0 (0.0%) | 0 (0.0%) |
| Total | 0 (0.0%) | 24 (100.0%) |
Employment Characteristics in Willcox
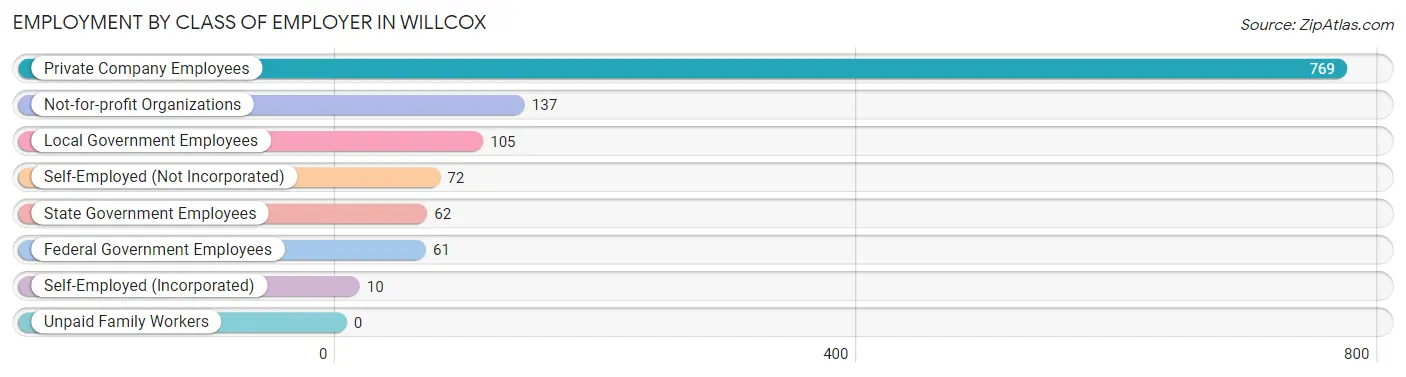
Employment by Class of Employer in Willcox
Among the 1,216 employed individuals in Willcox, private company employees (769 | 63.2%), not-for-profit organizations (137 | 11.3%), and local government employees (105 | 8.6%) make up the most common classes of employment.
| Employer Class | # Employees | % Employees |
| Private Company Employees | 769 | 63.2% |
| Self-Employed (Incorporated) | 10 | 0.8% |
| Self-Employed (Not Incorporated) | 72 | 5.9% |
| Not-for-profit Organizations | 137 | 11.3% |
| Local Government Employees | 105 | 8.6% |
| State Government Employees | 62 | 5.1% |
| Federal Government Employees | 61 | 5.0% |
| Unpaid Family Workers | 0 | 0.0% |
| Total | 1,216 | 100.0% |
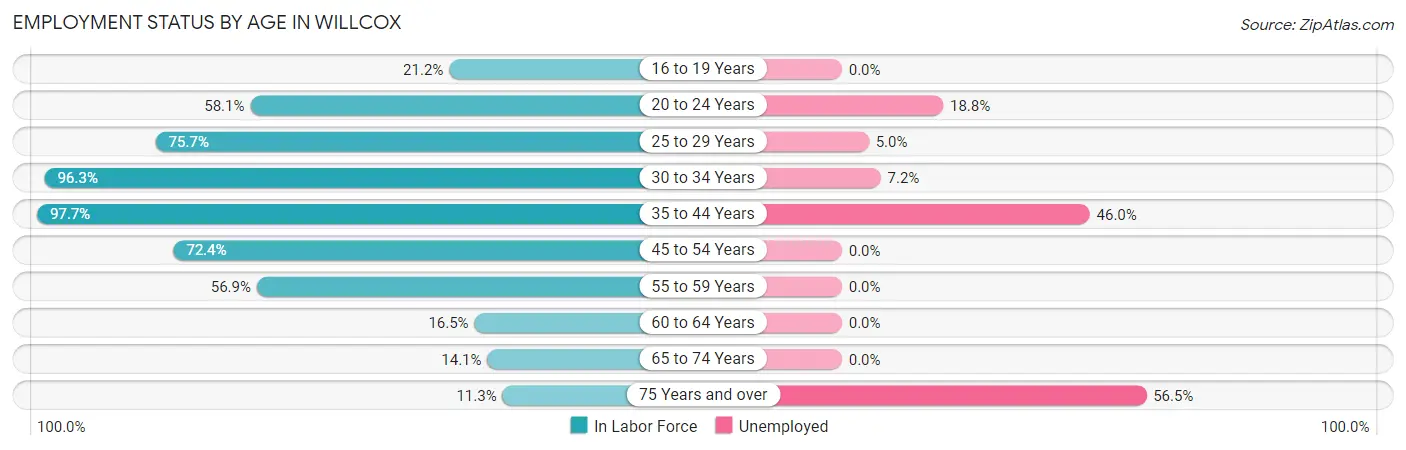
Employment Status by Age in Willcox
According to the labor force statistics for Willcox, out of the total population over 16 years of age (2,512), 58.2% or 1,462 individuals are in the labor force, with 16.8% or 246 of them unemployed. The age group with the highest labor force participation rate is 35 to 44 years, with 97.7% or 383 individuals in the labor force. Within the labor force, the 75 years and over age range has the highest percentage of unemployed individuals, with 56.5% or 13 of them being unemployed.
| Age Bracket | In Labor Force | Unemployed |
| 16 to 19 Years | 29 (21.2%) | 0 (0.0%) |
| 20 to 24 Years | 133 (58.1%) | 25 (18.8%) |
| 25 to 29 Years | 317 (75.7%) | 16 (5.0%) |
| 30 to 34 Years | 207 (96.3%) | 15 (7.2%) |
| 35 to 44 Years | 383 (97.7%) | 176 (46.0%) |
| 45 to 54 Years | 205 (72.4%) | 0 (0.0%) |
| 55 to 59 Years | 95 (56.9%) | 0 (0.0%) |
| 60 to 64 Years | 23 (16.5%) | 0 (0.0%) |
| 65 to 74 Years | 46 (14.1%) | 0 (0.0%) |
| 75 Years and over | 23 (11.3%) | 13 (56.5%) |
| Total | 1,462 (58.2%) | 246 (16.8%) |
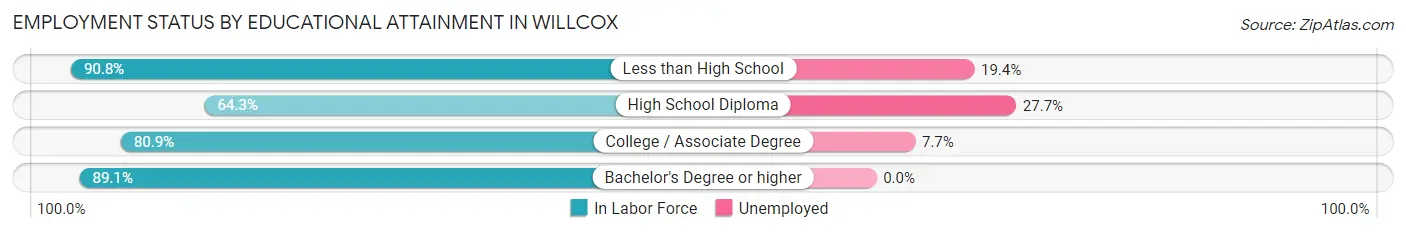
Employment Status by Educational Attainment in Willcox
According to labor force statistics for Willcox, 76.2% of individuals (1,231) out of the total population between 25 and 64 years of age (1,615) are in the labor force, with 16.8% or 207 of them being unemployed. The group with the highest labor force participation rate are those with the educational attainment of less than high school, with 90.8% or 268 individuals in the labor force. Within the labor force, individuals with high school diploma education have the highest percentage of unemployment, with 27.7% or 122 of them being unemployed.
| Educational Attainment | In Labor Force | Unemployed |
| Less than High School | 268 (90.8%) | 57 (19.4%) |
| High School Diploma | 441 (64.3%) | 190 (27.7%) |
| College / Associate Degree | 431 (80.9%) | 41 (7.7%) |
| Bachelor's Degree or higher | 90 (89.1%) | 0 (0.0%) |
| Total | 1,231 (76.2%) | 271 (16.8%) |
Employment Occupations by Sex in Willcox
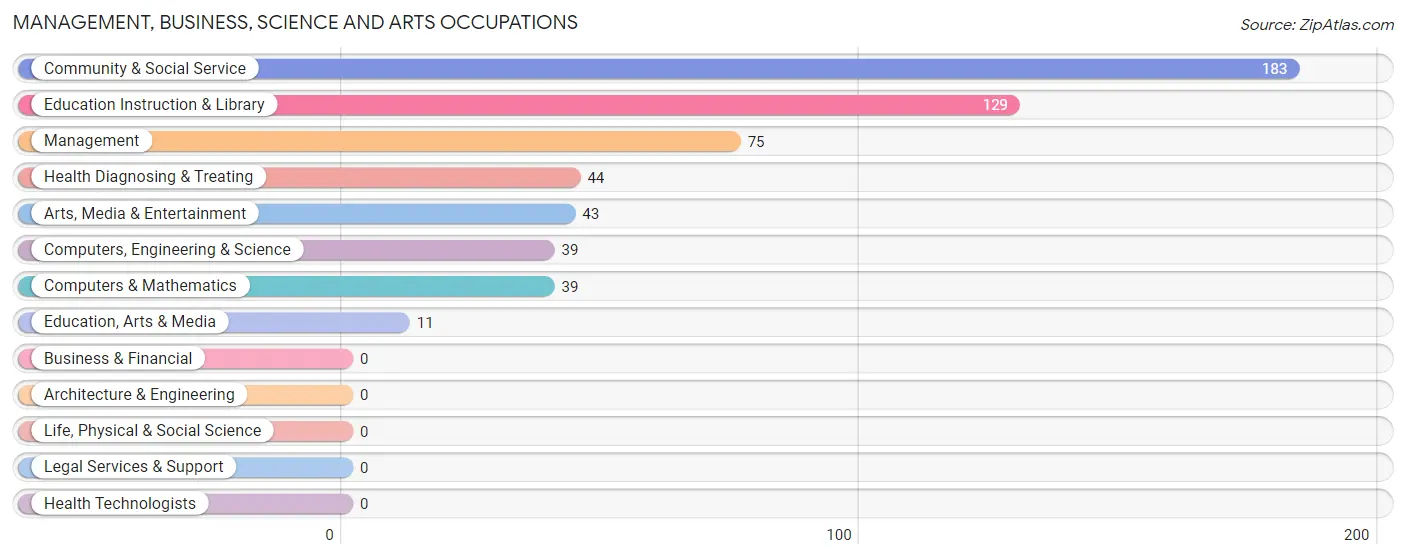
Management, Business, Science and Arts Occupations
The most common Management, Business, Science and Arts occupations in Willcox are Community & Social Service (183 | 15.0%), Education Instruction & Library (129 | 10.6%), Management (75 | 6.2%), Health Diagnosing & Treating (44 | 3.6%), and Arts, Media & Entertainment (43 | 3.5%).
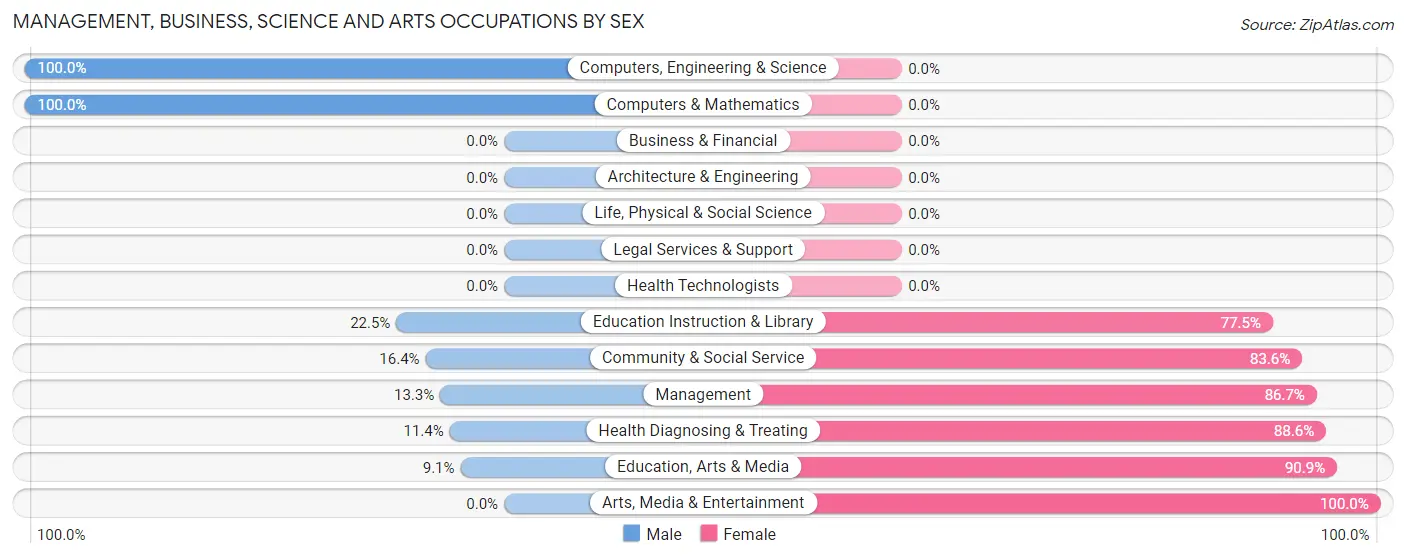
Management, Business, Science and Arts Occupations by Sex
Within the Management, Business, Science and Arts occupations in Willcox, the most male-oriented occupations are Computers, Engineering & Science (100.0%), Computers & Mathematics (100.0%), and Education Instruction & Library (22.5%), while the most female-oriented occupations are Arts, Media & Entertainment (100.0%), Education, Arts & Media (90.9%), and Health Diagnosing & Treating (88.6%).
| Occupation | Male | Female |
| Management | 10 (13.3%) | 65 (86.7%) |
| Business & Financial | 0 (0.0%) | 0 (0.0%) |
| Computers, Engineering & Science | 39 (100.0%) | 0 (0.0%) |
| Computers & Mathematics | 39 (100.0%) | 0 (0.0%) |
| Architecture & Engineering | 0 (0.0%) | 0 (0.0%) |
| Life, Physical & Social Science | 0 (0.0%) | 0 (0.0%) |
| Community & Social Service | 30 (16.4%) | 153 (83.6%) |
| Education, Arts & Media | 1 (9.1%) | 10 (90.9%) |
| Legal Services & Support | 0 (0.0%) | 0 (0.0%) |
| Education Instruction & Library | 29 (22.5%) | 100 (77.5%) |
| Arts, Media & Entertainment | 0 (0.0%) | 43 (100.0%) |
| Health Diagnosing & Treating | 5 (11.4%) | 39 (88.6%) |
| Health Technologists | 0 (0.0%) | 0 (0.0%) |
| Total (Category) | 84 (24.6%) | 257 (75.4%) |
| Total (Overall) | 511 (42.0%) | 705 (58.0%) |
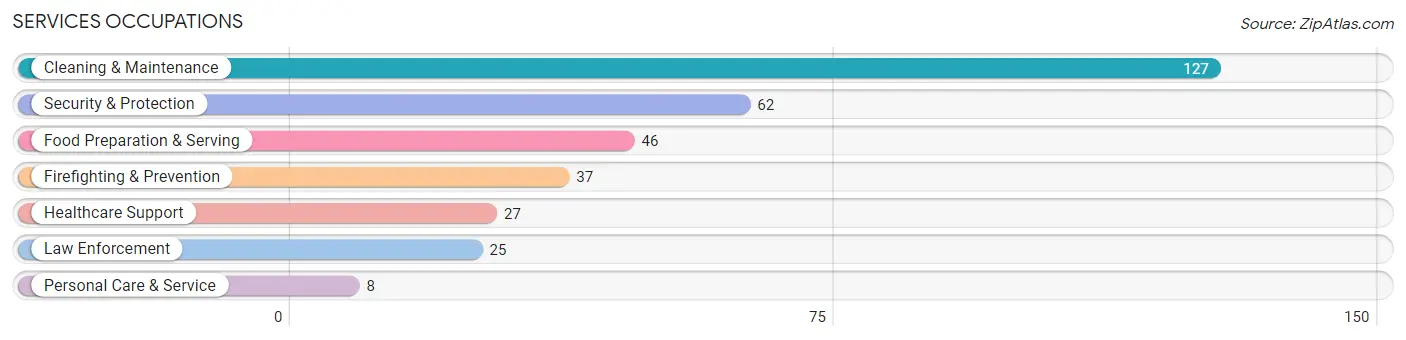
Services Occupations
The most common Services occupations in Willcox are Cleaning & Maintenance (127 | 10.4%), Security & Protection (62 | 5.1%), Food Preparation & Serving (46 | 3.8%), Firefighting & Prevention (37 | 3.0%), and Healthcare Support (27 | 2.2%).
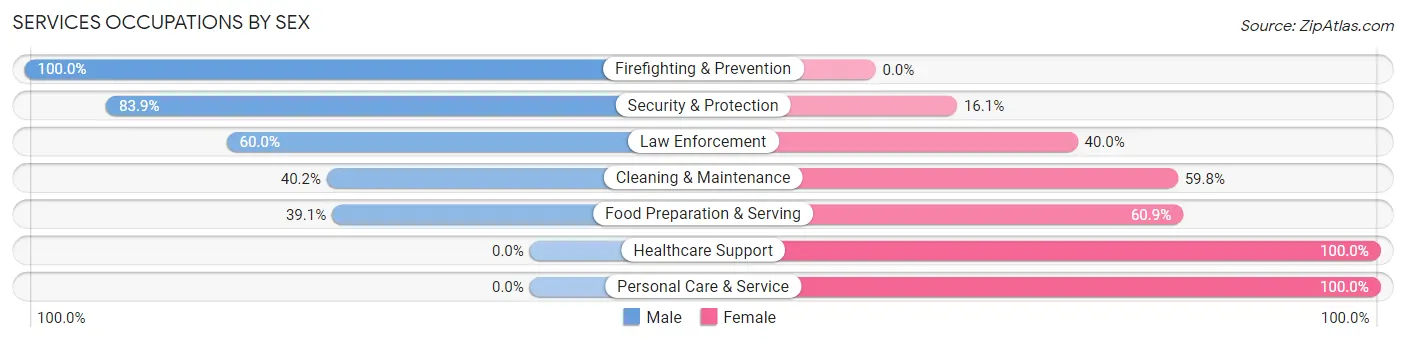
Services Occupations by Sex
Within the Services occupations in Willcox, the most male-oriented occupations are Firefighting & Prevention (100.0%), Security & Protection (83.9%), and Law Enforcement (60.0%), while the most female-oriented occupations are Healthcare Support (100.0%), Personal Care & Service (100.0%), and Food Preparation & Serving (60.9%).
| Occupation | Male | Female |
| Healthcare Support | 0 (0.0%) | 27 (100.0%) |
| Security & Protection | 52 (83.9%) | 10 (16.1%) |
| Firefighting & Prevention | 37 (100.0%) | 0 (0.0%) |
| Law Enforcement | 15 (60.0%) | 10 (40.0%) |
| Food Preparation & Serving | 18 (39.1%) | 28 (60.9%) |
| Cleaning & Maintenance | 51 (40.2%) | 76 (59.8%) |
| Personal Care & Service | 0 (0.0%) | 8 (100.0%) |
| Total (Category) | 121 (44.8%) | 149 (55.2%) |
| Total (Overall) | 511 (42.0%) | 705 (58.0%) |
Sales and Office Occupations
The most common Sales and Office occupations in Willcox are Office & Administration (165 | 13.6%), and Sales & Related (106 | 8.7%).
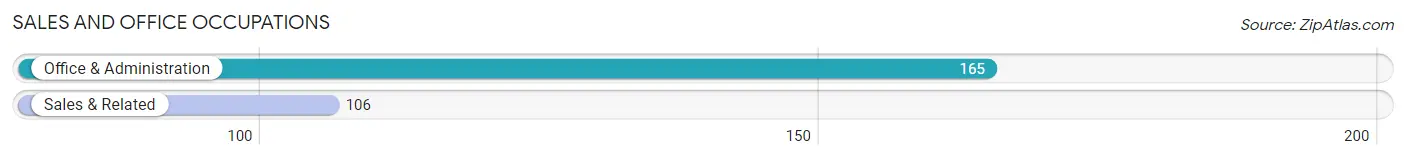
Sales and Office Occupations by Sex
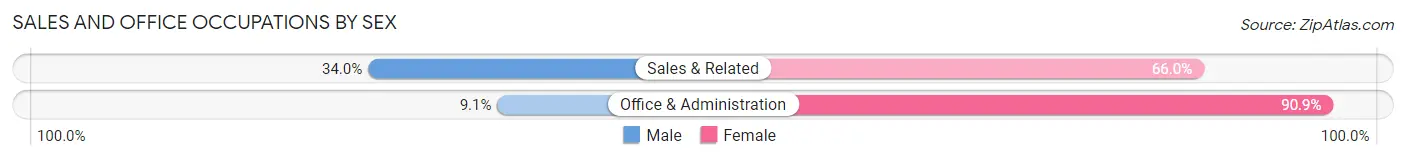
| Occupation | Male | Female |
| Sales & Related | 36 (34.0%) | 70 (66.0%) |
| Office & Administration | 15 (9.1%) | 150 (90.9%) |
| Total (Category) | 51 (18.8%) | 220 (81.2%) |
| Total (Overall) | 511 (42.0%) | 705 (58.0%) |
Natural Resources, Construction and Maintenance Occupations
The most common Natural Resources, Construction and Maintenance occupations in Willcox are Construction & Extraction (57 | 4.7%), Farming, Fishing & Forestry (53 | 4.4%), and Installation, Maintenance & Repair (12 | 1.0%).
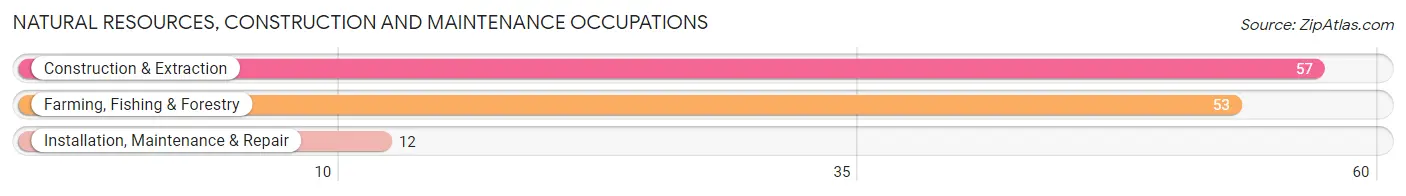
Natural Resources, Construction and Maintenance Occupations by Sex
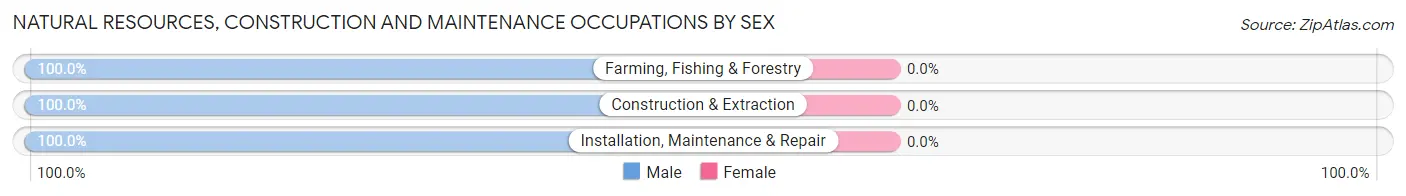
| Occupation | Male | Female |
| Farming, Fishing & Forestry | 53 (100.0%) | 0 (0.0%) |
| Construction & Extraction | 57 (100.0%) | 0 (0.0%) |
| Installation, Maintenance & Repair | 12 (100.0%) | 0 (0.0%) |
| Total (Category) | 122 (100.0%) | 0 (0.0%) |
| Total (Overall) | 511 (42.0%) | 705 (58.0%) |
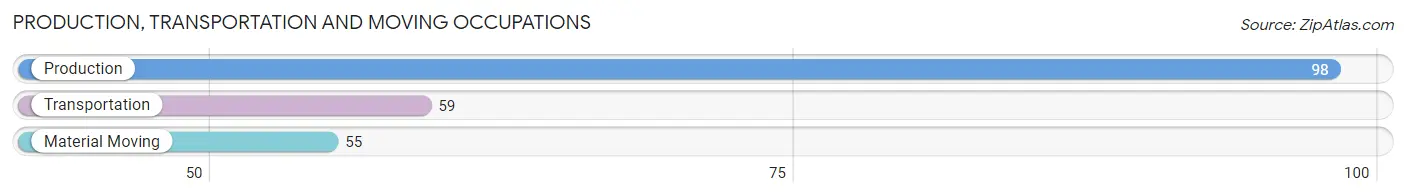
Production, Transportation and Moving Occupations
The most common Production, Transportation and Moving occupations in Willcox are Production (98 | 8.1%), Transportation (59 | 4.9%), and Material Moving (55 | 4.5%).
Production, Transportation and Moving Occupations by Sex
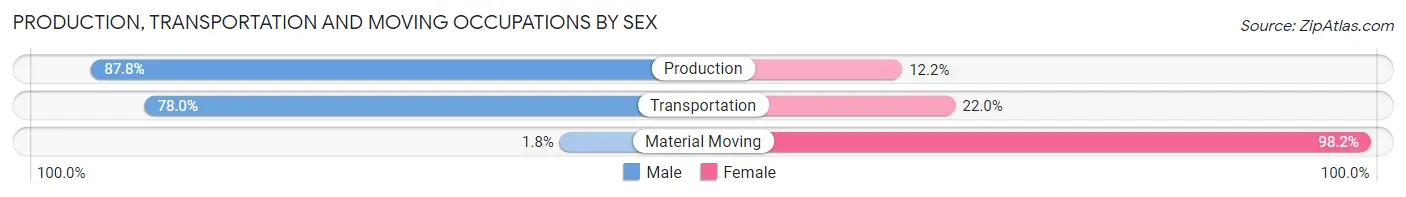
| Occupation | Male | Female |
| Production | 86 (87.8%) | 12 (12.2%) |
| Transportation | 46 (78.0%) | 13 (22.0%) |
| Material Moving | 1 (1.8%) | 54 (98.2%) |
| Total (Category) | 133 (62.7%) | 79 (37.3%) |
| Total (Overall) | 511 (42.0%) | 705 (58.0%) |
Employment Industries by Sex in Willcox
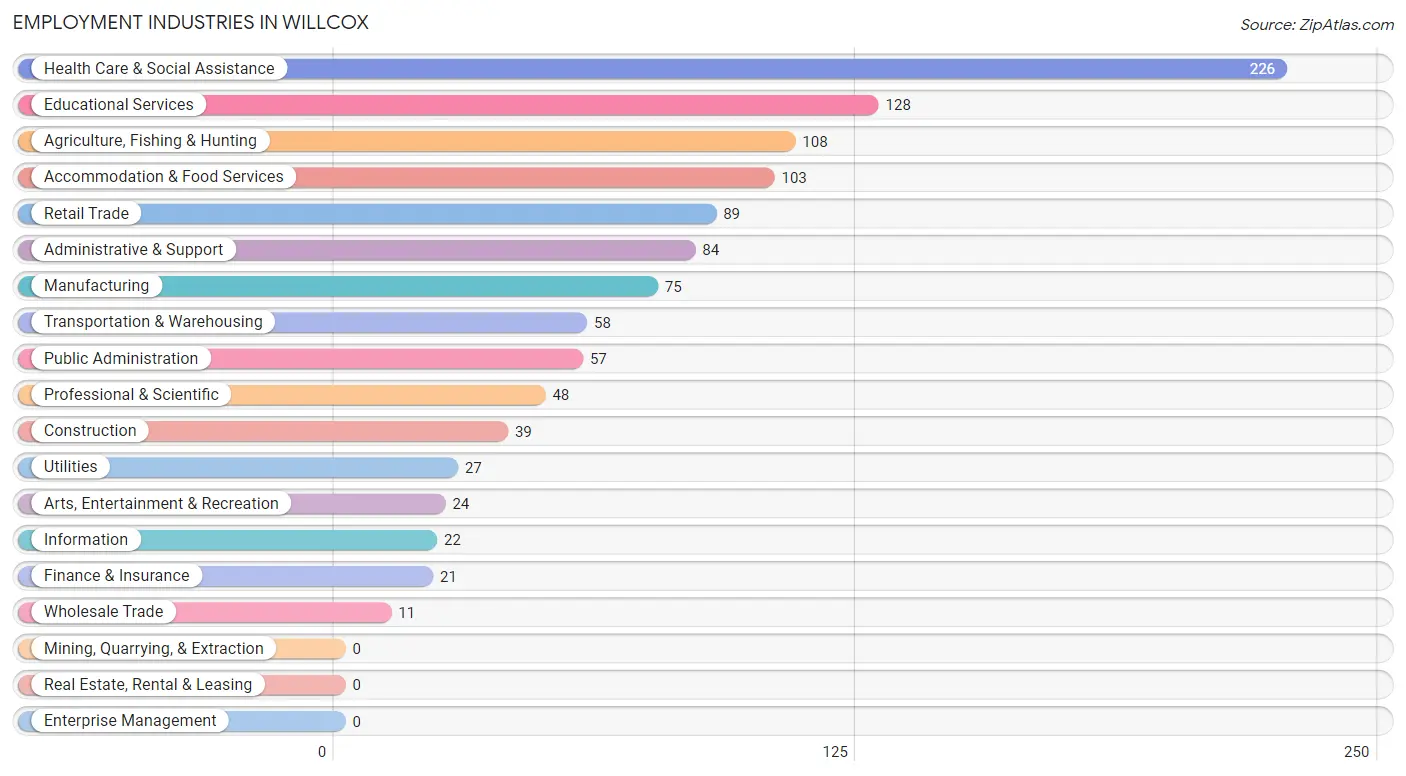
Employment Industries in Willcox
The major employment industries in Willcox include Health Care & Social Assistance (226 | 18.6%), Educational Services (128 | 10.5%), Agriculture, Fishing & Hunting (108 | 8.9%), Accommodation & Food Services (103 | 8.5%), and Retail Trade (89 | 7.3%).
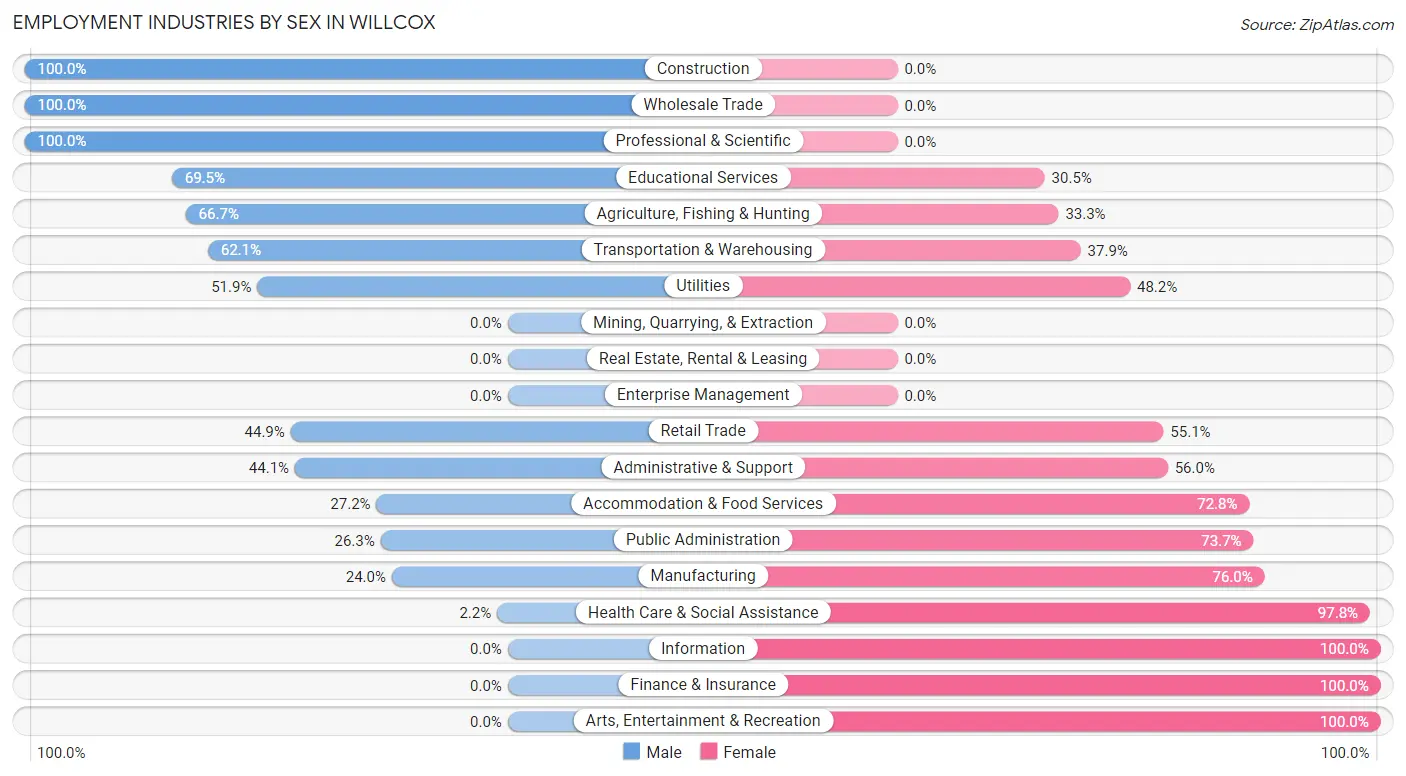
Employment Industries by Sex in Willcox
The Willcox industries that see more men than women are Construction (100.0%), Wholesale Trade (100.0%), and Professional & Scientific (100.0%), whereas the industries that tend to have a higher number of women are Information (100.0%), Finance & Insurance (100.0%), and Arts, Entertainment & Recreation (100.0%).
| Industry | Male | Female |
| Agriculture, Fishing & Hunting | 72 (66.7%) | 36 (33.3%) |
| Mining, Quarrying, & Extraction | 0 (0.0%) | 0 (0.0%) |
| Construction | 39 (100.0%) | 0 (0.0%) |
| Manufacturing | 18 (24.0%) | 57 (76.0%) |
| Wholesale Trade | 11 (100.0%) | 0 (0.0%) |
| Retail Trade | 40 (44.9%) | 49 (55.1%) |
| Transportation & Warehousing | 36 (62.1%) | 22 (37.9%) |
| Utilities | 14 (51.8%) | 13 (48.1%) |
| Information | 0 (0.0%) | 22 (100.0%) |
| Finance & Insurance | 0 (0.0%) | 21 (100.0%) |
| Real Estate, Rental & Leasing | 0 (0.0%) | 0 (0.0%) |
| Professional & Scientific | 48 (100.0%) | 0 (0.0%) |
| Enterprise Management | 0 (0.0%) | 0 (0.0%) |
| Administrative & Support | 37 (44.1%) | 47 (55.9%) |
| Educational Services | 89 (69.5%) | 39 (30.5%) |
| Health Care & Social Assistance | 5 (2.2%) | 221 (97.8%) |
| Arts, Entertainment & Recreation | 0 (0.0%) | 24 (100.0%) |
| Accommodation & Food Services | 28 (27.2%) | 75 (72.8%) |
| Public Administration | 15 (26.3%) | 42 (73.7%) |
| Total | 511 (42.0%) | 705 (58.0%) |
Education in Willcox
School Enrollment in Willcox
The most common levels of schooling among the 669 students in Willcox are high school (282 | 42.1%), middle school (171 | 25.6%), and elementary school (112 | 16.7%).
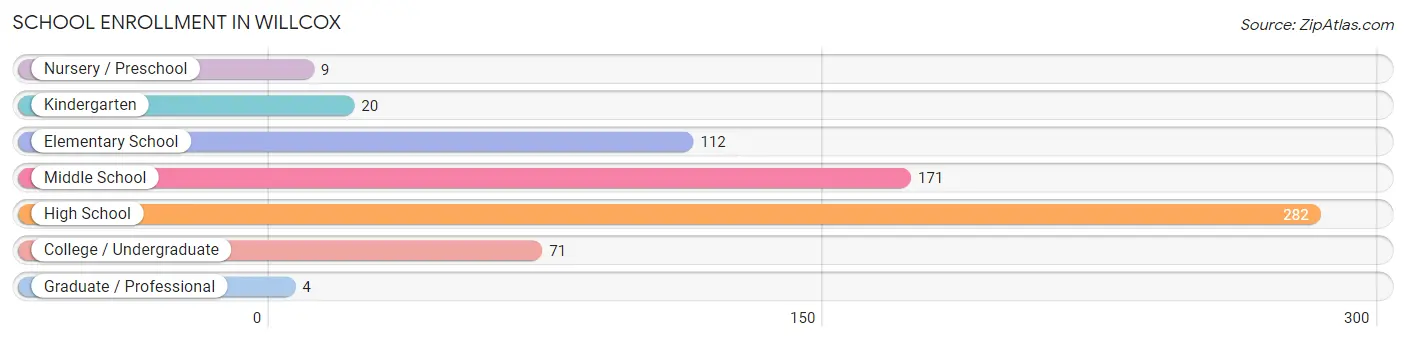
| School Level | # Students | % Students |
| Nursery / Preschool | 9 | 1.3% |
| Kindergarten | 20 | 3.0% |
| Elementary School | 112 | 16.7% |
| Middle School | 171 | 25.6% |
| High School | 282 | 42.1% |
| College / Undergraduate | 71 | 10.6% |
| Graduate / Professional | 4 | 0.6% |
| Total | 669 | 100.0% |
School Enrollment by Age by Funding Source in Willcox
Out of a total of 669 students who are enrolled in schools in Willcox, 41 (6.1%) attend a private institution, while the remaining 628 (93.9%) are enrolled in public schools. The age group of 20 to 24 year olds has the highest likelihood of being enrolled in private schools, with 9 (100.0% in the age bracket) enrolled. Conversely, the age group of 3 to 4 year olds has the lowest likelihood of being enrolled in a private school, with 17 (100.0% in the age bracket) attending a public institution.
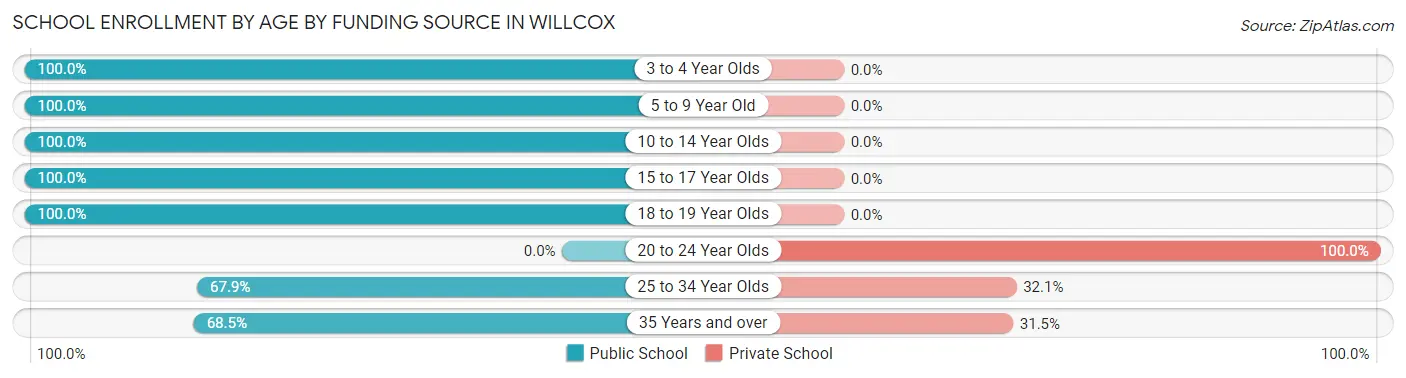
| Age Bracket | Public School | Private School |
| 3 to 4 Year Olds | 17 (100.0%) | 0 (0.0%) |
| 5 to 9 Year Old | 124 (100.0%) | 0 (0.0%) |
| 10 to 14 Year Olds | 234 (100.0%) | 0 (0.0%) |
| 15 to 17 Year Olds | 125 (100.0%) | 0 (0.0%) |
| 18 to 19 Year Olds | 59 (100.0%) | 0 (0.0%) |
| 20 to 24 Year Olds | 0 (0.0%) | 9 (100.0%) |
| 25 to 34 Year Olds | 19 (67.9%) | 9 (32.1%) |
| 35 Years and over | 50 (68.5%) | 23 (31.5%) |
| Total | 628 (93.9%) | 41 (6.1%) |
Educational Attainment by Field of Study in Willcox
Education (93 | 47.4%), communications (22 | 11.2%), liberal arts & history (19 | 9.7%), science & technology (17 | 8.7%), and arts & humanities (17 | 8.7%) are the most common fields of study among 196 individuals in Willcox who have obtained a bachelor's degree or higher.
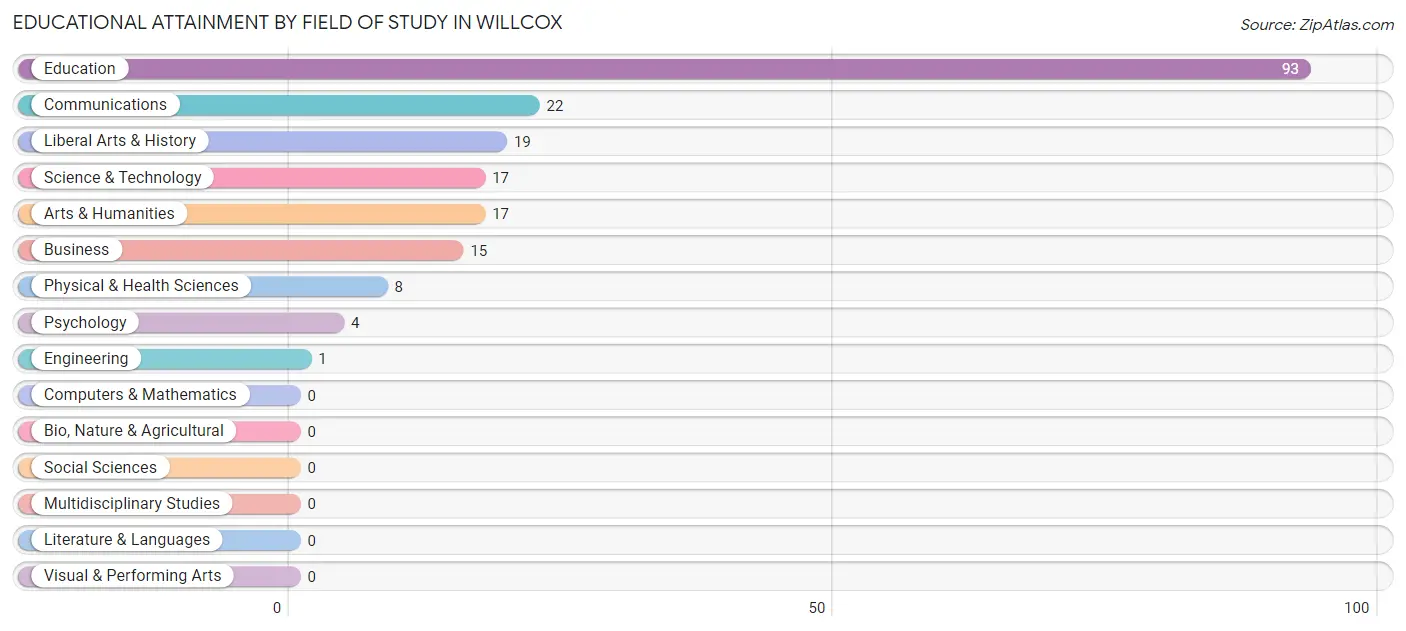
| Field of Study | # Graduates | % Graduates |
| Computers & Mathematics | 0 | 0.0% |
| Bio, Nature & Agricultural | 0 | 0.0% |
| Physical & Health Sciences | 8 | 4.1% |
| Psychology | 4 | 2.0% |
| Social Sciences | 0 | 0.0% |
| Engineering | 1 | 0.5% |
| Multidisciplinary Studies | 0 | 0.0% |
| Science & Technology | 17 | 8.7% |
| Business | 15 | 7.6% |
| Education | 93 | 47.4% |
| Literature & Languages | 0 | 0.0% |
| Liberal Arts & History | 19 | 9.7% |
| Visual & Performing Arts | 0 | 0.0% |
| Communications | 22 | 11.2% |
| Arts & Humanities | 17 | 8.7% |
| Total | 196 | 100.0% |
Transportation & Commute in Willcox
Vehicle Availability by Sex in Willcox
The most prevalent vehicle ownership categories in Willcox are males with 2 vehicles (168, accounting for 33.1%) and females with 2 vehicles (220, making up 23.8%).
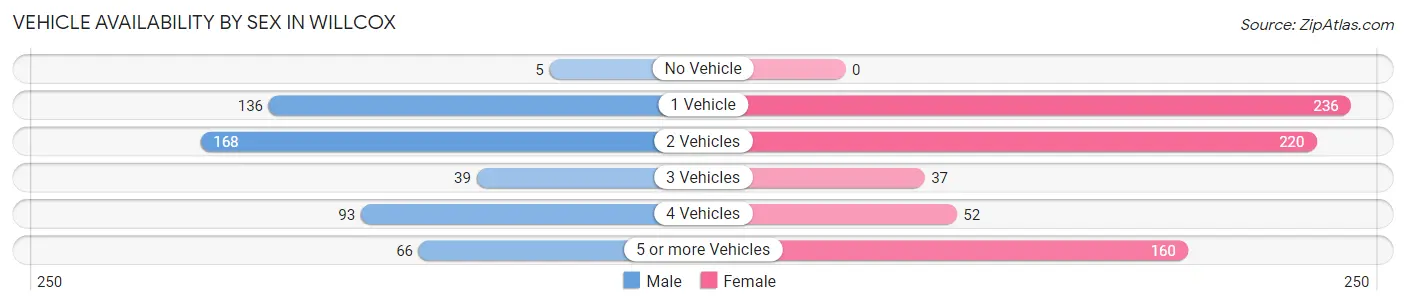
| Vehicles Available | Male | Female |
| No Vehicle | 5 (1.0%) | 0 (0.0%) |
| 1 Vehicle | 136 (26.8%) | 236 (33.5%) |
| 2 Vehicles | 168 (33.1%) | 220 (31.2%) |
| 3 Vehicles | 39 (7.7%) | 37 (5.2%) |
| 4 Vehicles | 93 (18.3%) | 52 (7.4%) |
| 5 or more Vehicles | 66 (13.0%) | 160 (22.7%) |
| Total | 507 (100.0%) | 705 (100.0%) |
Commute Time in Willcox
The most frequently occuring commute durations in Willcox are 5 to 9 minutes (490 commuters, 41.0%), 10 to 14 minutes (167 commuters, 14.0%), and less than 5 minutes (146 commuters, 12.2%).
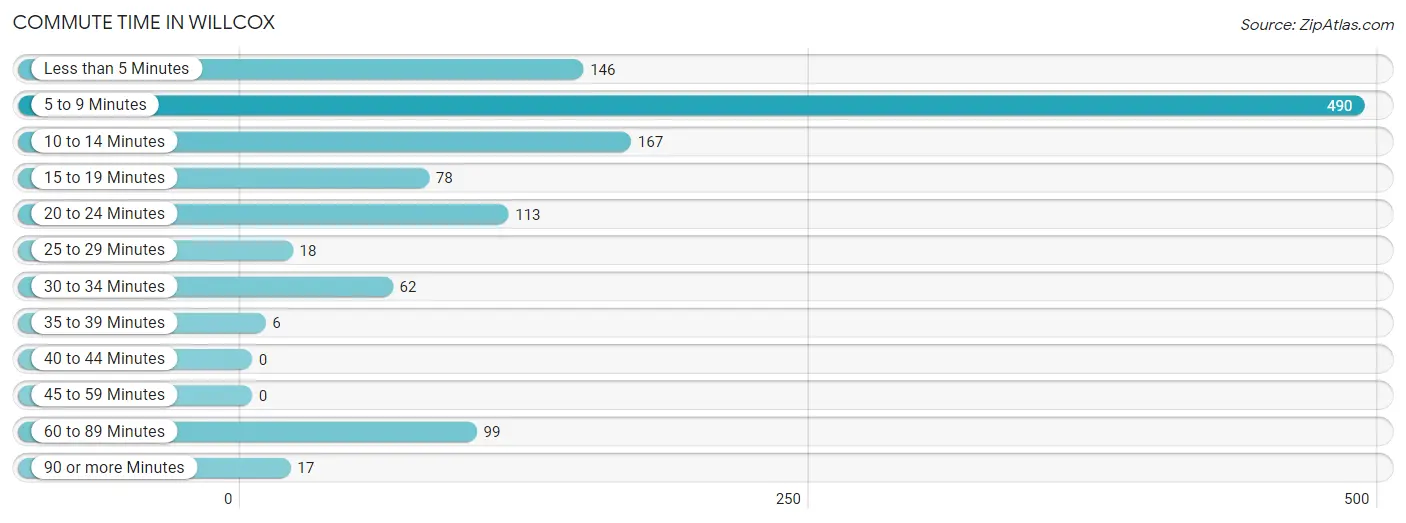
| Commute Time | # Commuters | % Commuters |
| Less than 5 Minutes | 146 | 12.2% |
| 5 to 9 Minutes | 490 | 41.0% |
| 10 to 14 Minutes | 167 | 14.0% |
| 15 to 19 Minutes | 78 | 6.5% |
| 20 to 24 Minutes | 113 | 9.5% |
| 25 to 29 Minutes | 18 | 1.5% |
| 30 to 34 Minutes | 62 | 5.2% |
| 35 to 39 Minutes | 6 | 0.5% |
| 40 to 44 Minutes | 0 | 0.0% |
| 45 to 59 Minutes | 0 | 0.0% |
| 60 to 89 Minutes | 99 | 8.3% |
| 90 or more Minutes | 17 | 1.4% |
Commute Time by Sex in Willcox
The most common commute times in Willcox are 5 to 9 minutes (180 commuters, 36.4%) for males and 5 to 9 minutes (310 commuters, 44.2%) for females.
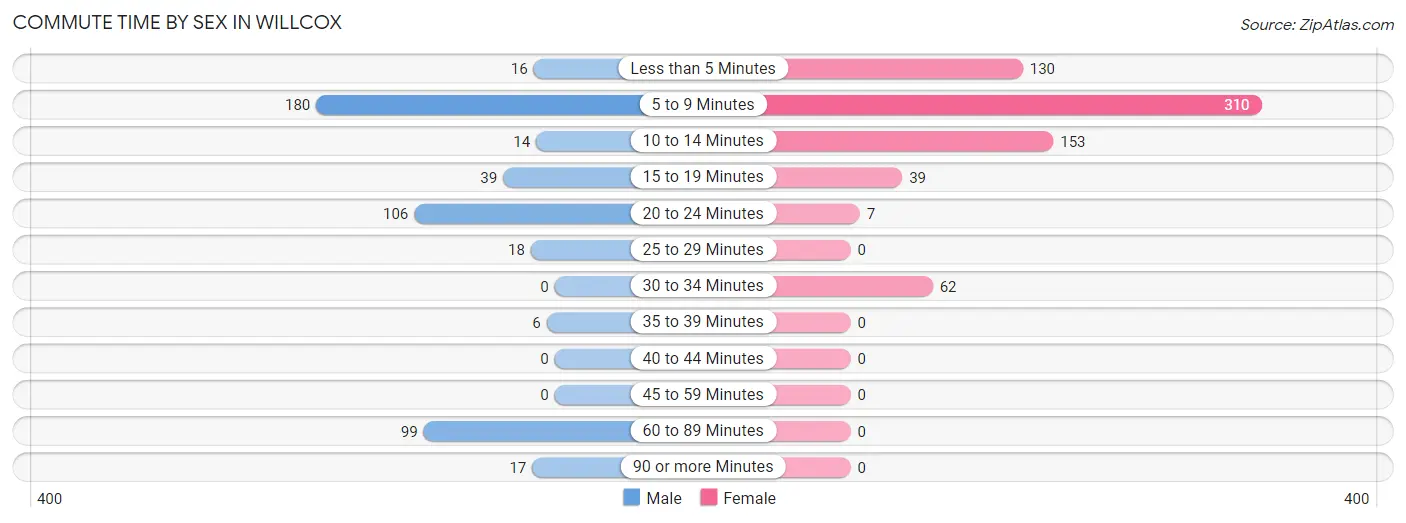
| Commute Time | Male | Female |
| Less than 5 Minutes | 16 (3.2%) | 130 (18.5%) |
| 5 to 9 Minutes | 180 (36.4%) | 310 (44.2%) |
| 10 to 14 Minutes | 14 (2.8%) | 153 (21.8%) |
| 15 to 19 Minutes | 39 (7.9%) | 39 (5.6%) |
| 20 to 24 Minutes | 106 (21.4%) | 7 (1.0%) |
| 25 to 29 Minutes | 18 (3.6%) | 0 (0.0%) |
| 30 to 34 Minutes | 0 (0.0%) | 62 (8.8%) |
| 35 to 39 Minutes | 6 (1.2%) | 0 (0.0%) |
| 40 to 44 Minutes | 0 (0.0%) | 0 (0.0%) |
| 45 to 59 Minutes | 0 (0.0%) | 0 (0.0%) |
| 60 to 89 Minutes | 99 (20.0%) | 0 (0.0%) |
| 90 or more Minutes | 17 (3.4%) | 0 (0.0%) |
Time of Departure to Work by Sex in Willcox
The most frequent times of departure to work in Willcox are 6:00 AM to 6:29 AM (126, 25.5%) for males and 12:00 PM to 3:59 PM (166, 23.7%) for females.
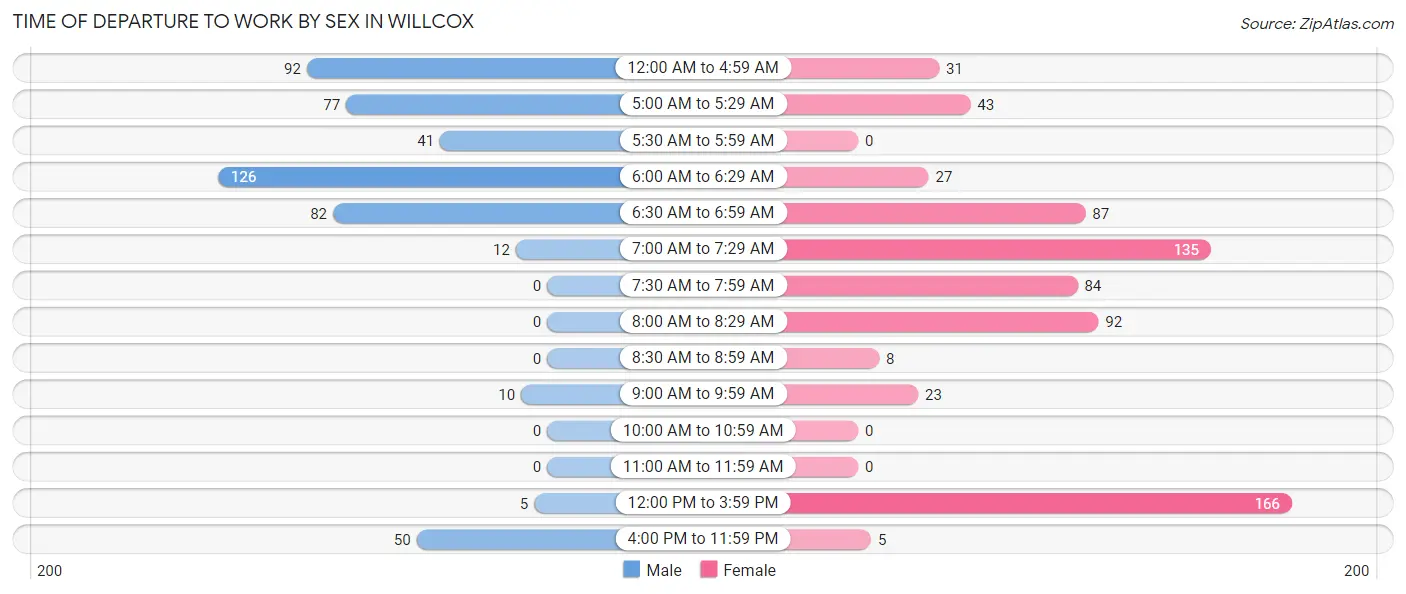
| Time of Departure | Male | Female |
| 12:00 AM to 4:59 AM | 92 (18.6%) | 31 (4.4%) |
| 5:00 AM to 5:29 AM | 77 (15.6%) | 43 (6.1%) |
| 5:30 AM to 5:59 AM | 41 (8.3%) | 0 (0.0%) |
| 6:00 AM to 6:29 AM | 126 (25.5%) | 27 (3.8%) |
| 6:30 AM to 6:59 AM | 82 (16.6%) | 87 (12.4%) |
| 7:00 AM to 7:29 AM | 12 (2.4%) | 135 (19.3%) |
| 7:30 AM to 7:59 AM | 0 (0.0%) | 84 (12.0%) |
| 8:00 AM to 8:29 AM | 0 (0.0%) | 92 (13.1%) |
| 8:30 AM to 8:59 AM | 0 (0.0%) | 8 (1.1%) |
| 9:00 AM to 9:59 AM | 10 (2.0%) | 23 (3.3%) |
| 10:00 AM to 10:59 AM | 0 (0.0%) | 0 (0.0%) |
| 11:00 AM to 11:59 AM | 0 (0.0%) | 0 (0.0%) |
| 12:00 PM to 3:59 PM | 5 (1.0%) | 166 (23.7%) |
| 4:00 PM to 11:59 PM | 50 (10.1%) | 5 (0.7%) |
| Total | 495 (100.0%) | 701 (100.0%) |
Housing Occupancy in Willcox
Occupancy by Ownership in Willcox
Of the total 1,109 dwellings in Willcox, owner-occupied units account for 524 (47.2%), while renter-occupied units make up 585 (52.7%).
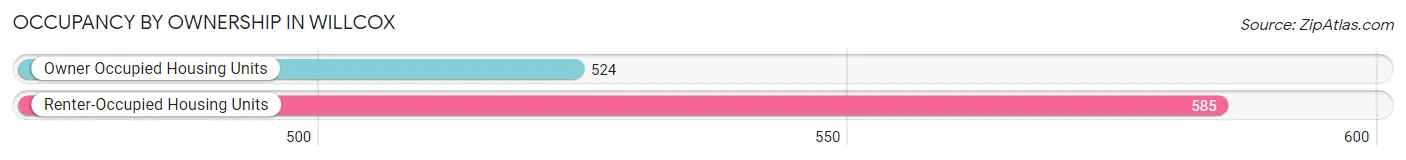
| Occupancy | # Housing Units | % Housing Units |
| Owner Occupied Housing Units | 524 | 47.2% |
| Renter-Occupied Housing Units | 585 | 52.7% |
| Total Occupied Housing Units | 1,109 | 100.0% |
Occupancy by Household Size in Willcox
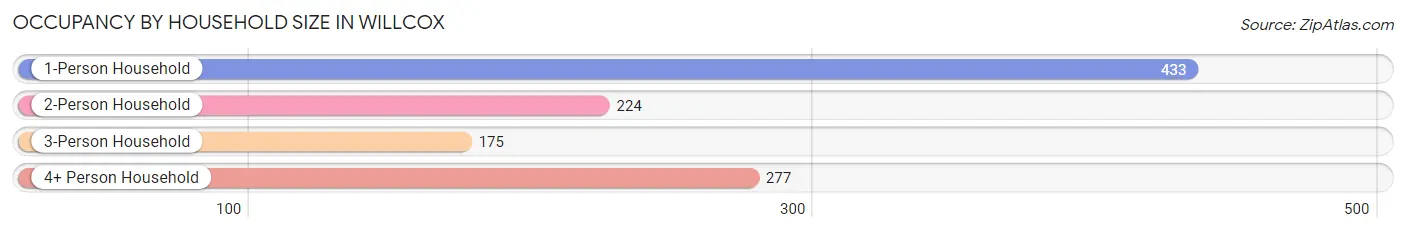
| Household Size | # Housing Units | % Housing Units |
| 1-Person Household | 433 | 39.0% |
| 2-Person Household | 224 | 20.2% |
| 3-Person Household | 175 | 15.8% |
| 4+ Person Household | 277 | 25.0% |
| Total Housing Units | 1,109 | 100.0% |
Occupancy by Ownership by Household Size in Willcox
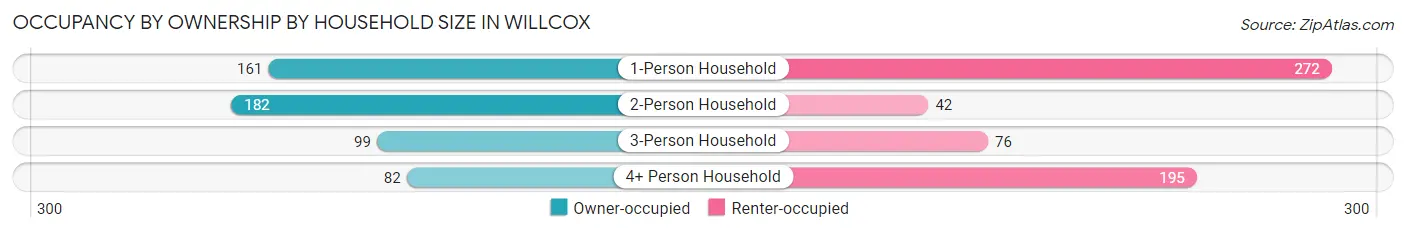
| Household Size | Owner-occupied | Renter-occupied |
| 1-Person Household | 161 (37.2%) | 272 (62.8%) |
| 2-Person Household | 182 (81.2%) | 42 (18.8%) |
| 3-Person Household | 99 (56.6%) | 76 (43.4%) |
| 4+ Person Household | 82 (29.6%) | 195 (70.4%) |
| Total Housing Units | 524 (47.2%) | 585 (52.7%) |
Occupancy by Educational Attainment in Willcox
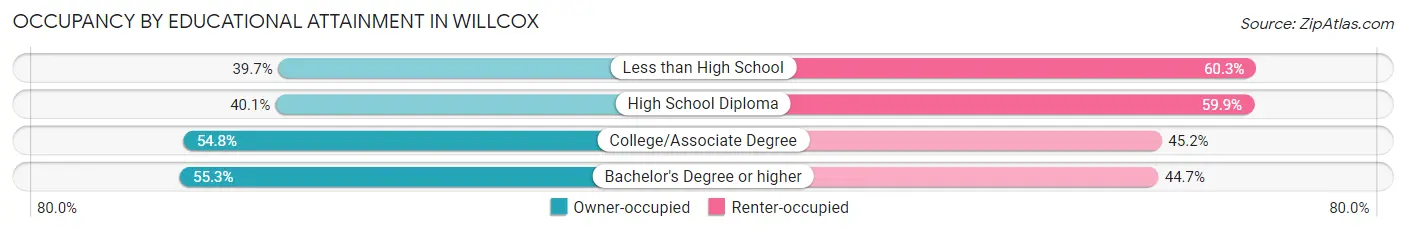
| Household Size | Owner-occupied | Renter-occupied |
| Less than High School | 58 (39.7%) | 88 (60.3%) |
| High School Diploma | 170 (40.1%) | 254 (59.9%) |
| College/Associate Degree | 213 (54.8%) | 176 (45.2%) |
| Bachelor's Degree or higher | 83 (55.3%) | 67 (44.7%) |
Occupancy by Age of Householder in Willcox
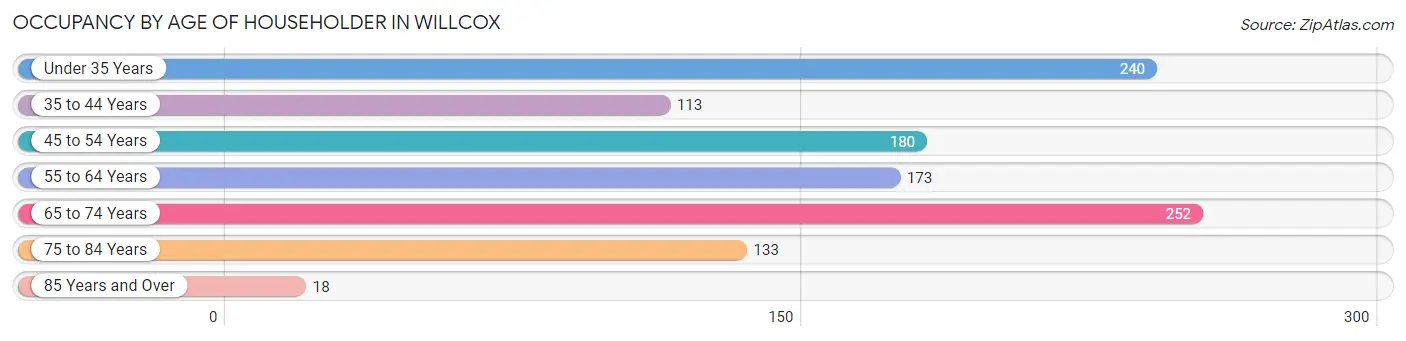
| Age Bracket | # Households | % Households |
| Under 35 Years | 240 | 21.6% |
| 35 to 44 Years | 113 | 10.2% |
| 45 to 54 Years | 180 | 16.2% |
| 55 to 64 Years | 173 | 15.6% |
| 65 to 74 Years | 252 | 22.7% |
| 75 to 84 Years | 133 | 12.0% |
| 85 Years and Over | 18 | 1.6% |
| Total | 1,109 | 100.0% |
Housing Finances in Willcox
Median Income by Occupancy in Willcox
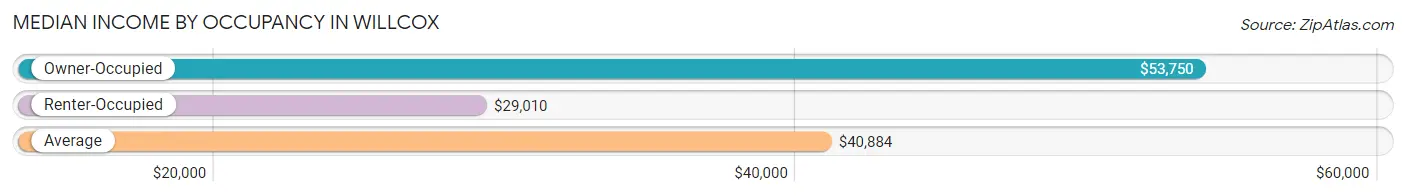
| Occupancy Type | # Households | Median Income |
| Owner-Occupied | 524 (47.2%) | $53,750 |
| Renter-Occupied | 585 (52.7%) | $29,010 |
| Average | 1,109 (100.0%) | $40,884 |
Occupancy by Householder Income Bracket in Willcox
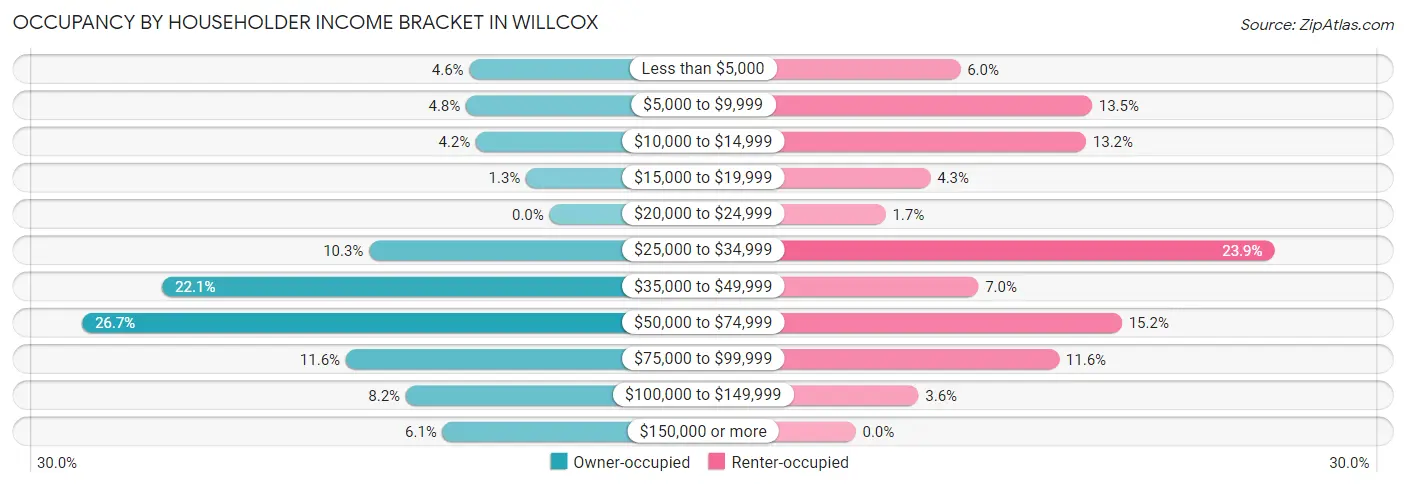
| Income Bracket | Owner-occupied | Renter-occupied |
| Less than $5,000 | 24 (4.6%) | 35 (6.0%) |
| $5,000 to $9,999 | 25 (4.8%) | 79 (13.5%) |
| $10,000 to $14,999 | 22 (4.2%) | 77 (13.2%) |
| $15,000 to $19,999 | 7 (1.3%) | 25 (4.3%) |
| $20,000 to $24,999 | 0 (0.0%) | 10 (1.7%) |
| $25,000 to $34,999 | 54 (10.3%) | 140 (23.9%) |
| $35,000 to $49,999 | 116 (22.1%) | 41 (7.0%) |
| $50,000 to $74,999 | 140 (26.7%) | 89 (15.2%) |
| $75,000 to $99,999 | 61 (11.6%) | 68 (11.6%) |
| $100,000 to $149,999 | 43 (8.2%) | 21 (3.6%) |
| $150,000 or more | 32 (6.1%) | 0 (0.0%) |
| Total | 524 (100.0%) | 585 (100.0%) |
Monthly Housing Cost Tiers in Willcox
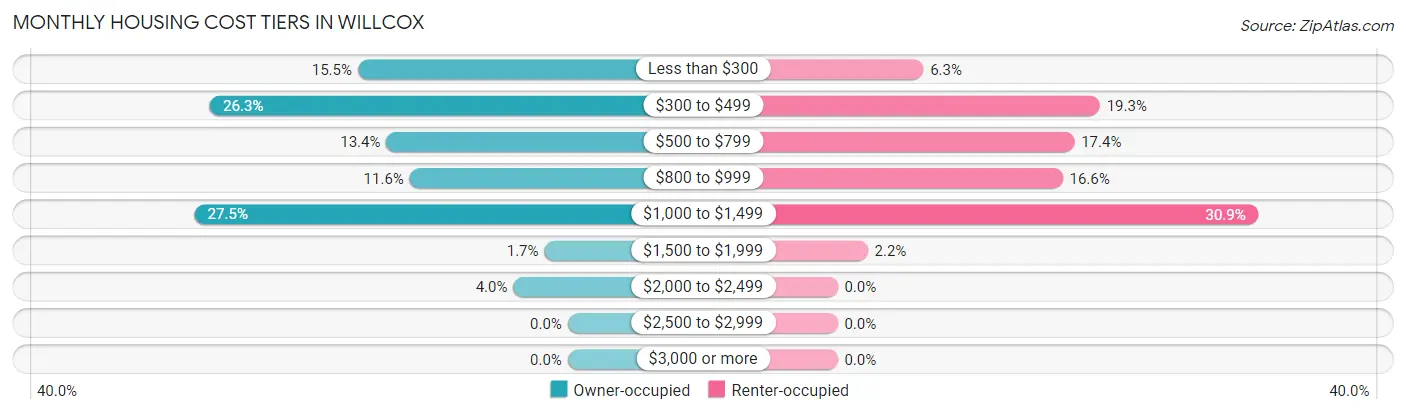
| Monthly Cost | Owner-occupied | Renter-occupied |
| Less than $300 | 81 (15.5%) | 37 (6.3%) |
| $300 to $499 | 138 (26.3%) | 113 (19.3%) |
| $500 to $799 | 70 (13.4%) | 102 (17.4%) |
| $800 to $999 | 61 (11.6%) | 97 (16.6%) |
| $1,000 to $1,499 | 144 (27.5%) | 181 (30.9%) |
| $1,500 to $1,999 | 9 (1.7%) | 13 (2.2%) |
| $2,000 to $2,499 | 21 (4.0%) | 0 (0.0%) |
| $2,500 to $2,999 | 0 (0.0%) | 0 (0.0%) |
| $3,000 or more | 0 (0.0%) | 0 (0.0%) |
| Total | 524 (100.0%) | 585 (100.0%) |
Physical Housing Characteristics in Willcox
Housing Structures in Willcox
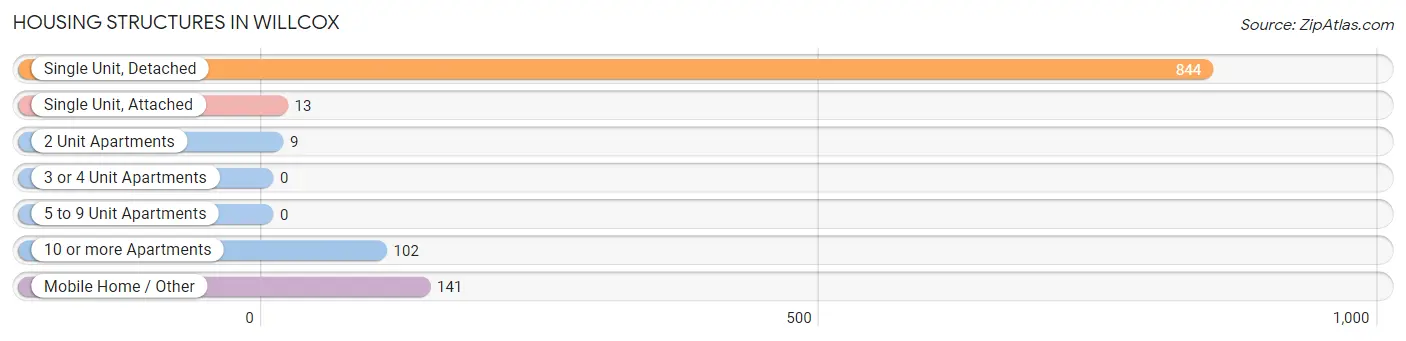
| Structure Type | # Housing Units | % Housing Units |
| Single Unit, Detached | 844 | 76.1% |
| Single Unit, Attached | 13 | 1.2% |
| 2 Unit Apartments | 9 | 0.8% |
| 3 or 4 Unit Apartments | 0 | 0.0% |
| 5 to 9 Unit Apartments | 0 | 0.0% |
| 10 or more Apartments | 102 | 9.2% |
| Mobile Home / Other | 141 | 12.7% |
| Total | 1,109 | 100.0% |
Housing Structures by Occupancy in Willcox
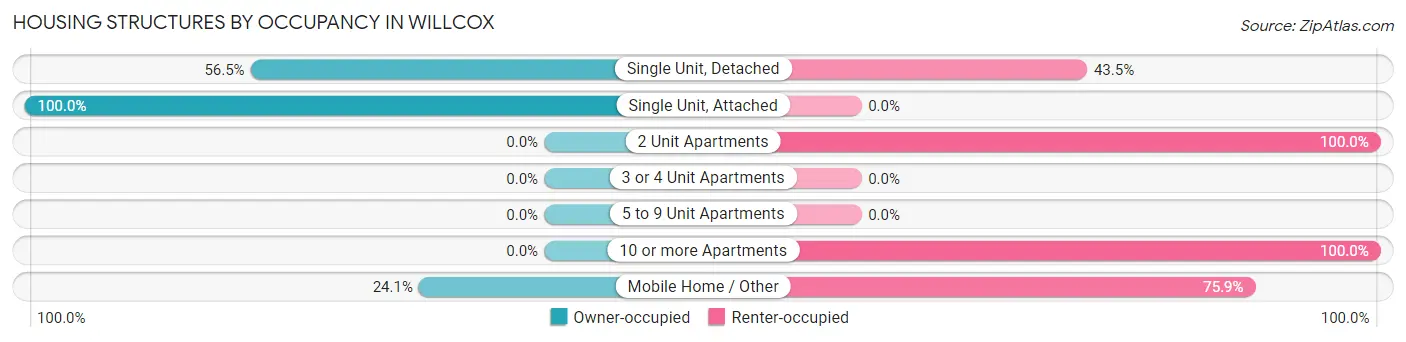
| Structure Type | Owner-occupied | Renter-occupied |
| Single Unit, Detached | 477 (56.5%) | 367 (43.5%) |
| Single Unit, Attached | 13 (100.0%) | 0 (0.0%) |
| 2 Unit Apartments | 0 (0.0%) | 9 (100.0%) |
| 3 or 4 Unit Apartments | 0 (0.0%) | 0 (0.0%) |
| 5 to 9 Unit Apartments | 0 (0.0%) | 0 (0.0%) |
| 10 or more Apartments | 0 (0.0%) | 102 (100.0%) |
| Mobile Home / Other | 34 (24.1%) | 107 (75.9%) |
| Total | 524 (47.2%) | 585 (52.7%) |
Housing Structures by Number of Rooms in Willcox
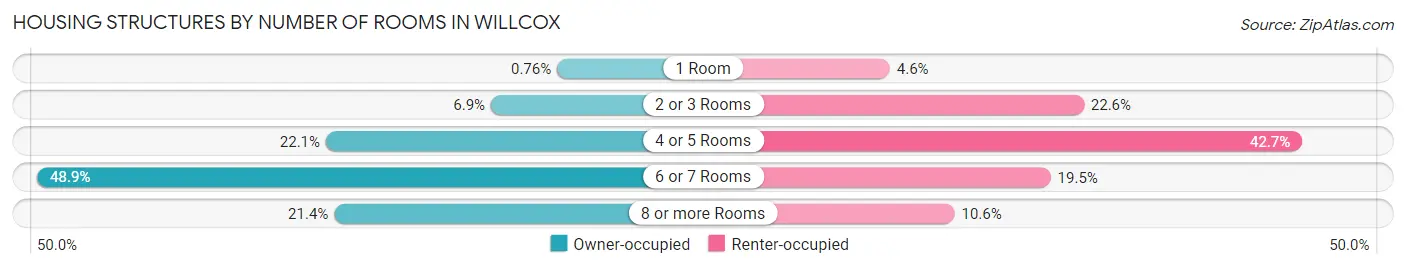
| Number of Rooms | Owner-occupied | Renter-occupied |
| 1 Room | 4 (0.8%) | 27 (4.6%) |
| 2 or 3 Rooms | 36 (6.9%) | 132 (22.6%) |
| 4 or 5 Rooms | 116 (22.1%) | 250 (42.7%) |
| 6 or 7 Rooms | 256 (48.8%) | 114 (19.5%) |
| 8 or more Rooms | 112 (21.4%) | 62 (10.6%) |
| Total | 524 (100.0%) | 585 (100.0%) |
Housing Structure by Heating Type in Willcox
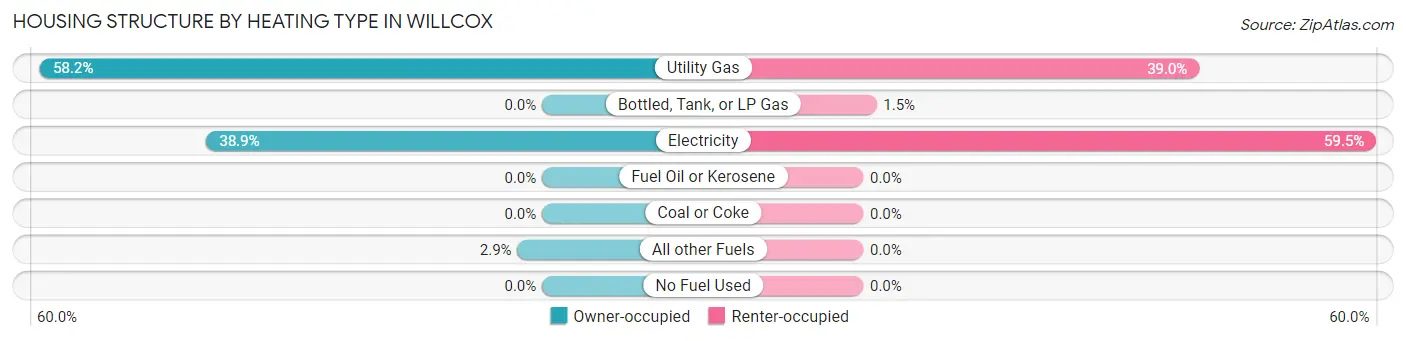
| Heating Type | Owner-occupied | Renter-occupied |
| Utility Gas | 305 (58.2%) | 228 (39.0%) |
| Bottled, Tank, or LP Gas | 0 (0.0%) | 9 (1.5%) |
| Electricity | 204 (38.9%) | 348 (59.5%) |
| Fuel Oil or Kerosene | 0 (0.0%) | 0 (0.0%) |
| Coal or Coke | 0 (0.0%) | 0 (0.0%) |
| All other Fuels | 15 (2.9%) | 0 (0.0%) |
| No Fuel Used | 0 (0.0%) | 0 (0.0%) |
| Total | 524 (100.0%) | 585 (100.0%) |
Household Vehicle Usage in Willcox
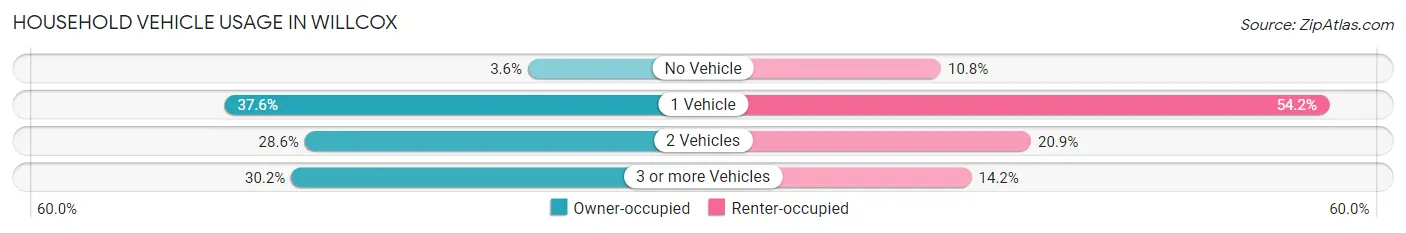
| Vehicles per Household | Owner-occupied | Renter-occupied |
| No Vehicle | 19 (3.6%) | 63 (10.8%) |
| 1 Vehicle | 197 (37.6%) | 317 (54.2%) |
| 2 Vehicles | 150 (28.6%) | 122 (20.8%) |
| 3 or more Vehicles | 158 (30.1%) | 83 (14.2%) |
| Total | 524 (100.0%) | 585 (100.0%) |
Real Estate & Mortgages in Willcox
Real Estate and Mortgage Overview in Willcox
| Characteristic | Without Mortgage | With Mortgage |
| Housing Units | 248 | 276 |
| Median Property Value | $100,000 | $120,700 |
| Median Household Income | $39,643 | $20 |
| Monthly Housing Costs | $397 | $0 |
| Real Estate Taxes | $923 | $25 |
Property Value by Mortgage Status in Willcox
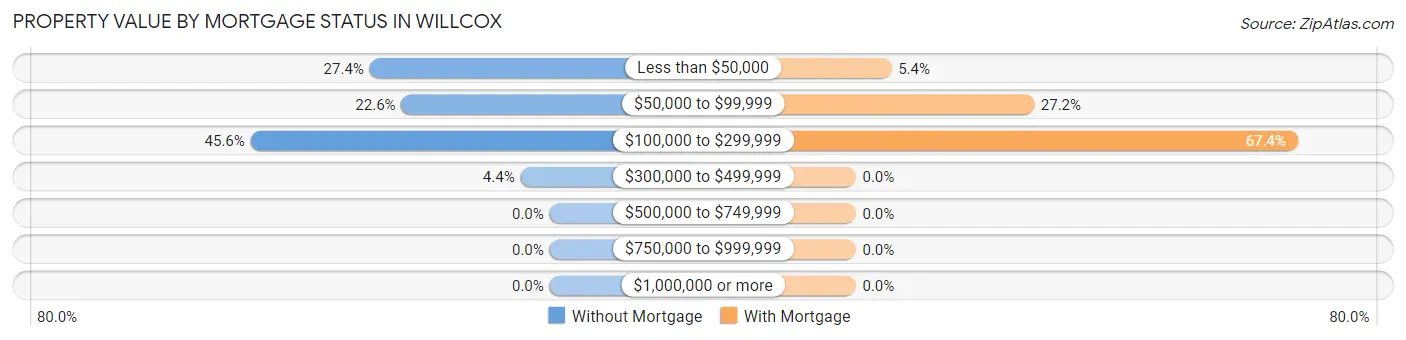
| Property Value | Without Mortgage | With Mortgage |
| Less than $50,000 | 68 (27.4%) | 15 (5.4%) |
| $50,000 to $99,999 | 56 (22.6%) | 75 (27.2%) |
| $100,000 to $299,999 | 113 (45.6%) | 186 (67.4%) |
| $300,000 to $499,999 | 11 (4.4%) | 0 (0.0%) |
| $500,000 to $749,999 | 0 (0.0%) | 0 (0.0%) |
| $750,000 to $999,999 | 0 (0.0%) | 0 (0.0%) |
| $1,000,000 or more | 0 (0.0%) | 0 (0.0%) |
| Total | 248 (100.0%) | 276 (100.0%) |
Household Income by Mortgage Status in Willcox
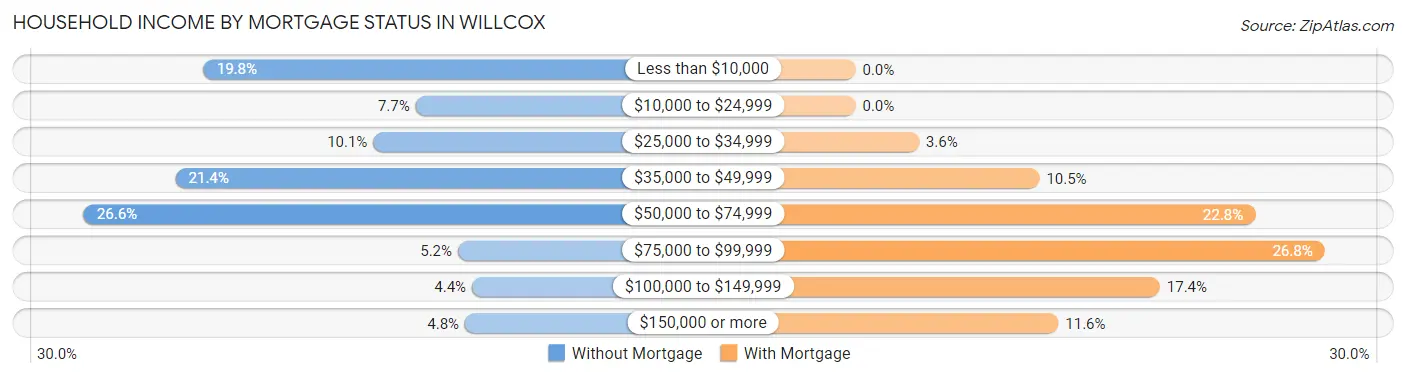
| Household Income | Without Mortgage | With Mortgage |
| Less than $10,000 | 49 (19.8%) | 0 (0.0%) |
| $10,000 to $24,999 | 19 (7.7%) | 0 (0.0%) |
| $25,000 to $34,999 | 25 (10.1%) | 10 (3.6%) |
| $35,000 to $49,999 | 53 (21.4%) | 29 (10.5%) |
| $50,000 to $74,999 | 66 (26.6%) | 63 (22.8%) |
| $75,000 to $99,999 | 13 (5.2%) | 74 (26.8%) |
| $100,000 to $149,999 | 11 (4.4%) | 48 (17.4%) |
| $150,000 or more | 12 (4.8%) | 32 (11.6%) |
| Total | 248 (100.0%) | 276 (100.0%) |
Property Value to Household Income Ratio in Willcox
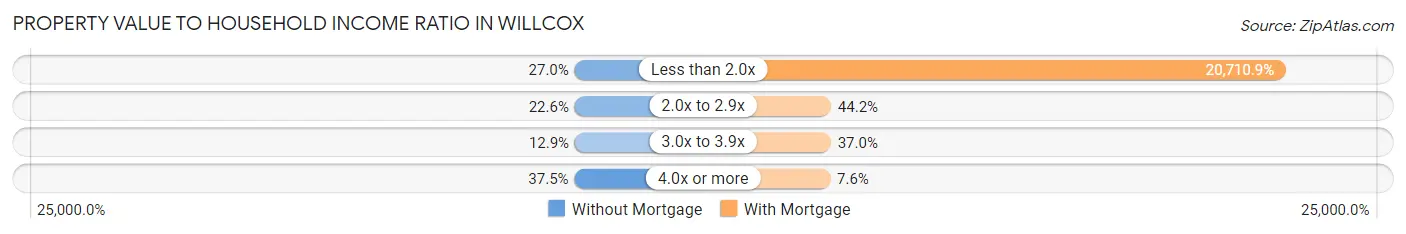
| Value-to-Income Ratio | Without Mortgage | With Mortgage |
| Less than 2.0x | 67 (27.0%) | 57,162 (20,710.9%) |
| 2.0x to 2.9x | 56 (22.6%) | 122 (44.2%) |
| 3.0x to 3.9x | 32 (12.9%) | 102 (37.0%) |
| 4.0x or more | 93 (37.5%) | 21 (7.6%) |
| Total | 248 (100.0%) | 276 (100.0%) |
Real Estate Taxes by Mortgage Status in Willcox
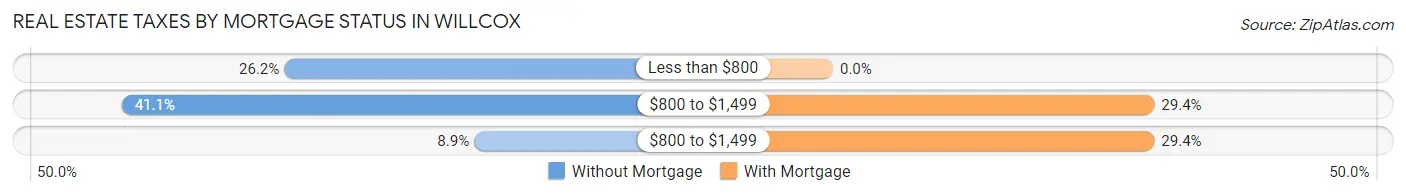
| Property Taxes | Without Mortgage | With Mortgage |
| Less than $800 | 65 (26.2%) | 0 (0.0%) |
| $800 to $1,499 | 102 (41.1%) | 81 (29.3%) |
| $800 to $1,499 | 22 (8.9%) | 81 (29.3%) |
| Total | 248 (100.0%) | 276 (100.0%) |
Health & Disability in Willcox
Health Insurance Coverage by Age in Willcox
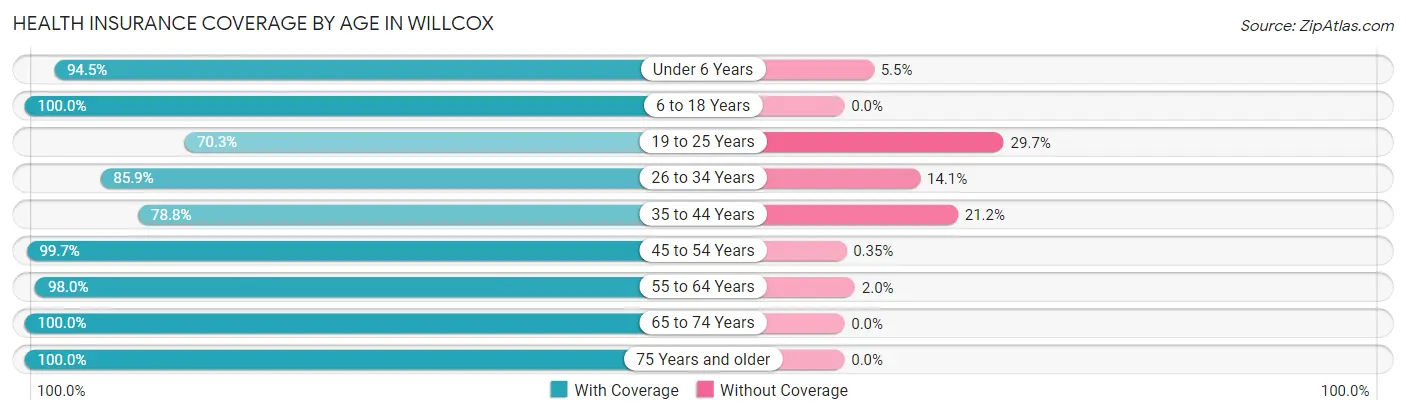
| Age Bracket | With Coverage | Without Coverage |
| Under 6 Years | 293 (94.5%) | 17 (5.5%) |
| 6 to 18 Years | 542 (100.0%) | 0 (0.0%) |
| 19 to 25 Years | 227 (70.3%) | 96 (29.7%) |
| 26 to 34 Years | 468 (85.9%) | 77 (14.1%) |
| 35 to 44 Years | 309 (78.8%) | 83 (21.2%) |
| 45 to 54 Years | 282 (99.7%) | 1 (0.4%) |
| 55 to 64 Years | 300 (98.0%) | 6 (2.0%) |
| 65 to 74 Years | 309 (100.0%) | 0 (0.0%) |
| 75 Years and older | 204 (100.0%) | 0 (0.0%) |
| Total | 2,934 (91.3%) | 280 (8.7%) |
Health Insurance Coverage by Citizenship Status in Willcox
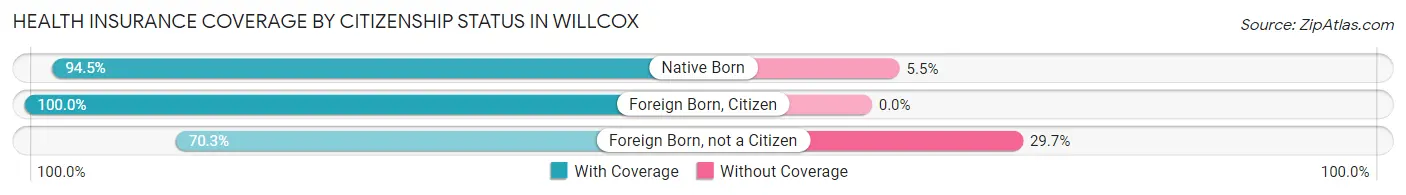
| Citizenship Status | With Coverage | Without Coverage |
| Native Born | 293 (94.5%) | 17 (5.5%) |
| Foreign Born, Citizen | 542 (100.0%) | 0 (0.0%) |
| Foreign Born, not a Citizen | 227 (70.3%) | 96 (29.7%) |
Health Insurance Coverage by Household Income in Willcox
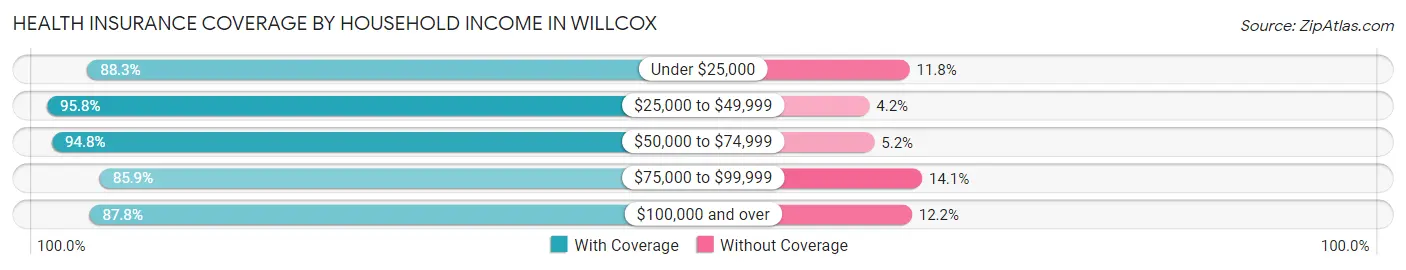
| Household Income | With Coverage | Without Coverage |
| Under $25,000 | 503 (88.2%) | 67 (11.7%) |
| $25,000 to $49,999 | 769 (95.8%) | 34 (4.2%) |
| $50,000 to $74,999 | 716 (94.8%) | 39 (5.2%) |
| $75,000 to $99,999 | 329 (85.9%) | 54 (14.1%) |
| $100,000 and over | 613 (87.8%) | 85 (12.2%) |
Public vs Private Health Insurance Coverage by Age in Willcox
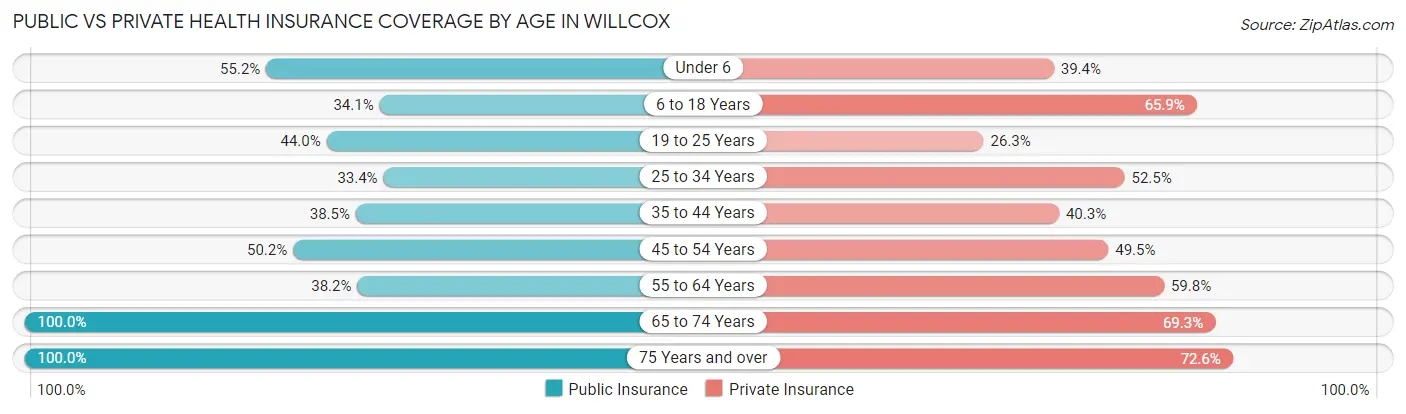
| Age Bracket | Public Insurance | Private Insurance |
| Under 6 | 171 (55.2%) | 122 (39.4%) |
| 6 to 18 Years | 185 (34.1%) | 357 (65.9%) |
| 19 to 25 Years | 142 (44.0%) | 85 (26.3%) |
| 25 to 34 Years | 182 (33.4%) | 286 (52.5%) |
| 35 to 44 Years | 151 (38.5%) | 158 (40.3%) |
| 45 to 54 Years | 142 (50.2%) | 140 (49.5%) |
| 55 to 64 Years | 117 (38.2%) | 183 (59.8%) |
| 65 to 74 Years | 309 (100.0%) | 214 (69.3%) |
| 75 Years and over | 204 (100.0%) | 148 (72.6%) |
| Total | 1,603 (49.9%) | 1,693 (52.7%) |
Disability Status by Sex by Age in Willcox
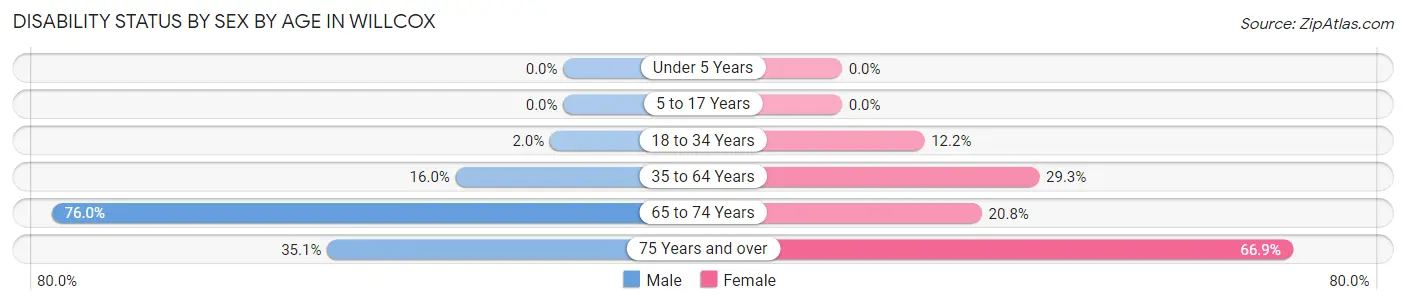
| Age Bracket | Male | Female |
| Under 5 Years | 0 (0.0%) | 0 (0.0%) |
| 5 to 17 Years | 0 (0.0%) | 0 (0.0%) |
| 18 to 34 Years | 8 (2.0%) | 64 (12.2%) |
| 35 to 64 Years | 75 (16.0%) | 150 (29.3%) |
| 65 to 74 Years | 136 (76.0%) | 27 (20.8%) |
| 75 Years and over | 27 (35.1%) | 85 (66.9%) |
Disability Class by Sex by Age in Willcox
Disability Class: Hearing Difficulty
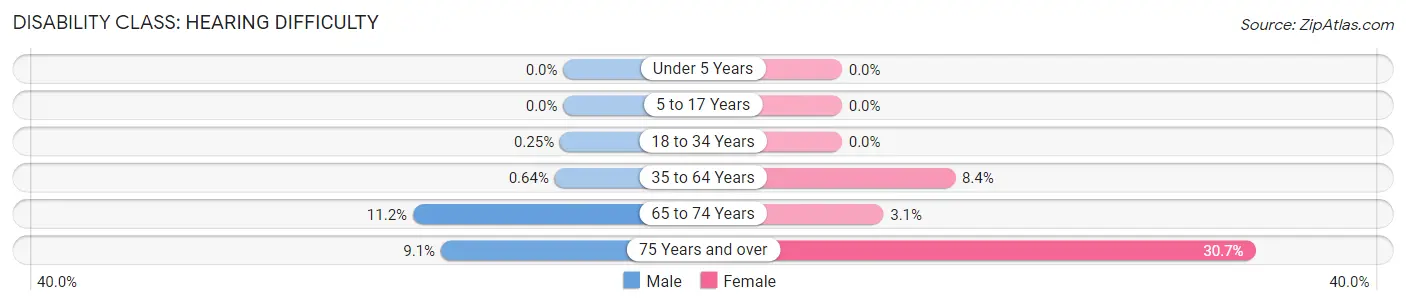
| Age Bracket | Male | Female |
| Under 5 Years | 0 (0.0%) | 0 (0.0%) |
| 5 to 17 Years | 0 (0.0%) | 0 (0.0%) |
| 18 to 34 Years | 1 (0.3%) | 0 (0.0%) |
| 35 to 64 Years | 3 (0.6%) | 43 (8.4%) |
| 65 to 74 Years | 20 (11.2%) | 4 (3.1%) |
| 75 Years and over | 7 (9.1%) | 39 (30.7%) |
Disability Class: Vision Difficulty
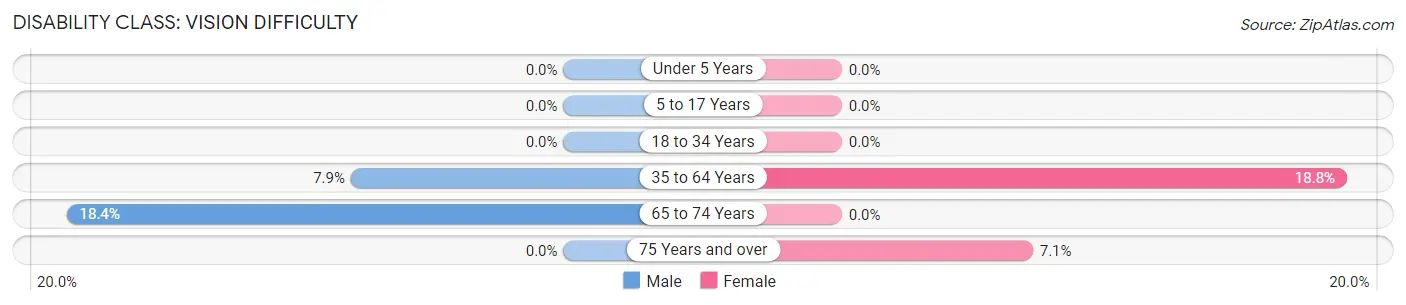
| Age Bracket | Male | Female |
| Under 5 Years | 0 (0.0%) | 0 (0.0%) |
| 5 to 17 Years | 0 (0.0%) | 0 (0.0%) |
| 18 to 34 Years | 0 (0.0%) | 0 (0.0%) |
| 35 to 64 Years | 37 (7.9%) | 96 (18.8%) |
| 65 to 74 Years | 33 (18.4%) | 0 (0.0%) |
| 75 Years and over | 0 (0.0%) | 9 (7.1%) |
Disability Class: Cognitive Difficulty
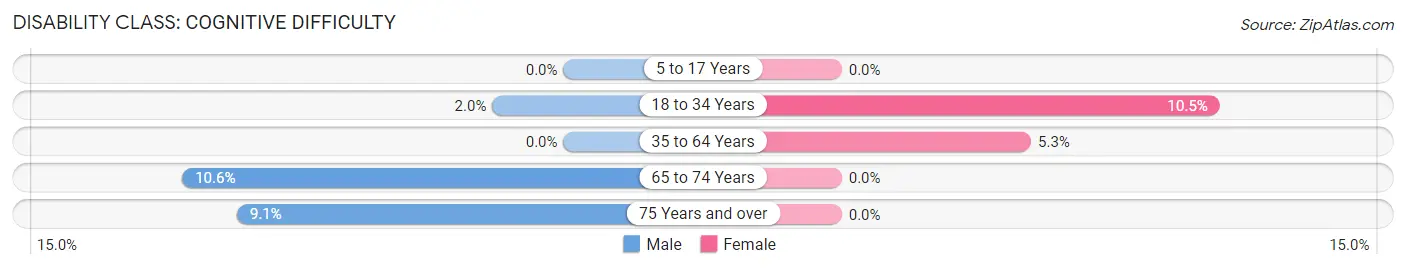
| Age Bracket | Male | Female |
| 5 to 17 Years | 0 (0.0%) | 0 (0.0%) |
| 18 to 34 Years | 8 (2.0%) | 55 (10.5%) |
| 35 to 64 Years | 0 (0.0%) | 27 (5.3%) |
| 65 to 74 Years | 19 (10.6%) | 0 (0.0%) |
| 75 Years and over | 7 (9.1%) | 0 (0.0%) |
Disability Class: Ambulatory Difficulty
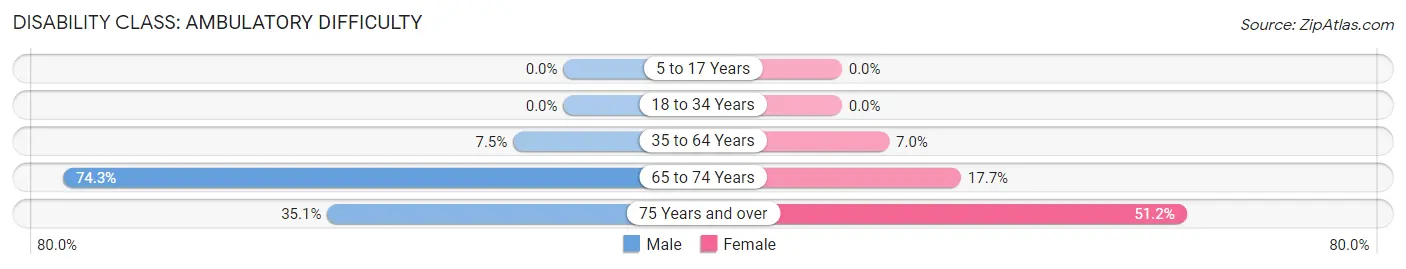
| Age Bracket | Male | Female |
| 5 to 17 Years | 0 (0.0%) | 0 (0.0%) |
| 18 to 34 Years | 0 (0.0%) | 0 (0.0%) |
| 35 to 64 Years | 35 (7.5%) | 36 (7.0%) |
| 65 to 74 Years | 133 (74.3%) | 23 (17.7%) |
| 75 Years and over | 27 (35.1%) | 65 (51.2%) |
Disability Class: Self-Care Difficulty
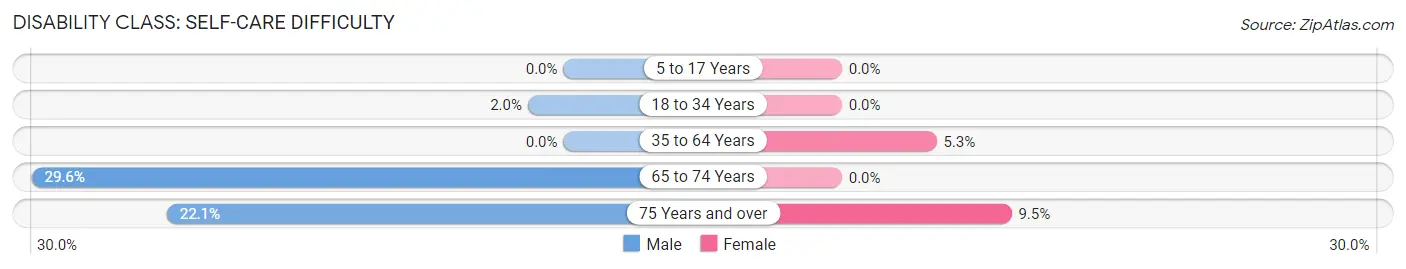
| Age Bracket | Male | Female |
| 5 to 17 Years | 0 (0.0%) | 0 (0.0%) |
| 18 to 34 Years | 8 (2.0%) | 0 (0.0%) |
| 35 to 64 Years | 0 (0.0%) | 27 (5.3%) |
| 65 to 74 Years | 53 (29.6%) | 0 (0.0%) |
| 75 Years and over | 17 (22.1%) | 12 (9.5%) |
Technology Access in Willcox
Computing Device Access in Willcox
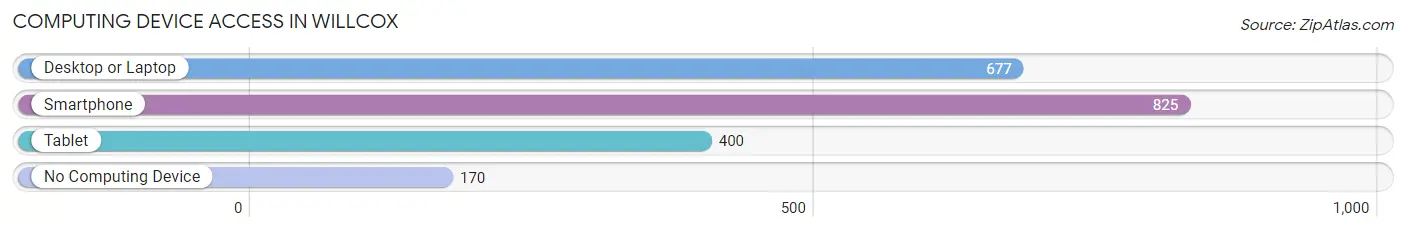
| Device Type | # Households | % Households |
| Desktop or Laptop | 677 | 61.1% |
| Smartphone | 825 | 74.4% |
| Tablet | 400 | 36.1% |
| No Computing Device | 170 | 15.3% |
| Total | 1,109 | 100.0% |
Internet Access in Willcox
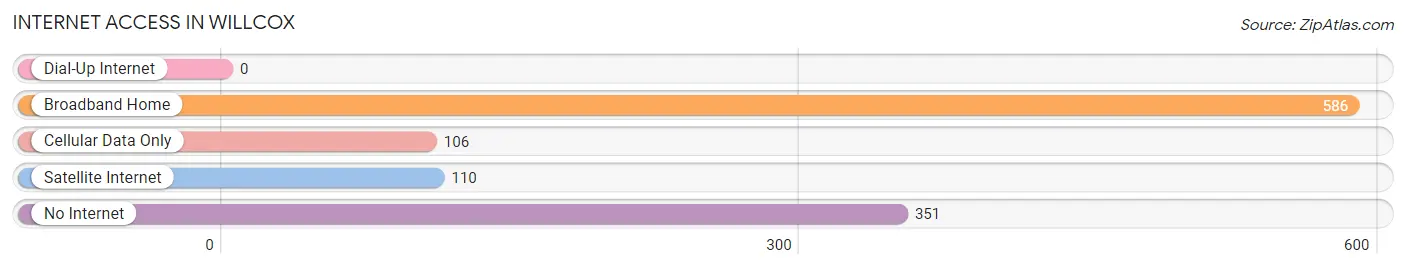
| Internet Type | # Households | % Households |
| Dial-Up Internet | 0 | 0.0% |
| Broadband Home | 586 | 52.8% |
| Cellular Data Only | 106 | 9.6% |
| Satellite Internet | 110 | 9.9% |
| No Internet | 351 | 31.7% |
| Total | 1,109 | 100.0% |
Willcox Summary
Willcox, Arizona is a small town located in Cochise County in the southeastern part of the state. It is situated at the intersection of Interstate 10 and State Route 186, about 70 miles east of Tucson and 90 miles west of the New Mexico border. The town has a population of about 3,700 people and is the county seat of Cochise County.
Willcox is located in the Chihuahuan Desert, which is characterized by hot, dry summers and mild winters. The area receives an average of 12 inches of precipitation annually, most of which falls in the summer months. The town is situated at an elevation of 4,000 feet, and the surrounding area is mostly flat with some rolling hills.
The economy of Willcox is largely based on agriculture, with the main crops being cotton, alfalfa, and wheat. The town is also home to several large cattle ranches, and the area is known for its production of beef and dairy products. In addition, Willcox is home to several wineries and vineyards, and the town is a popular destination for wine tasting and tours.
The demographics of Willcox are largely Hispanic, with about 70% of the population identifying as Hispanic or Latino. The median household income is about $35,000, and the median age is 37. The town is home to a large number of retirees, and the unemployment rate is about 6%.
Willcox is served by the Willcox Unified School District, which includes two elementary schools, one middle school, and one high school. The town is also home to a branch of Cochise College, which offers a variety of degree and certificate programs.
Willcox is a small town with a rich history and a vibrant economy. The town is home to a diverse population and offers a variety of recreational activities, including hiking, camping, and bird watching. The town is also home to several wineries and vineyards, making it a popular destination for wine tasting and tours. With its mild climate and beautiful scenery, Willcox is an ideal place to live and work.
Common Questions
What is Per Capita Income in Willcox?
Per Capita income in Willcox is $19,625.
What is the Median Family Income in Willcox?
Median Family Income in Willcox is $55,507.
What is the Median Household income in Willcox?
Median Household Income in Willcox is $40,884.
What is Income or Wage Gap in Willcox?
Income or Wage Gap in Willcox is 15.9%.
Women in Willcox earn 84.1 cents for every dollar earned by a man.
What is Family Income Deficit in Willcox?
Family Income Deficit in Willcox is $13,640.
Families that are below poverty line in Willcox earn $13,640 less on average than the poverty threshold level.
What is Inequality or Gini Index in Willcox?
Inequality or Gini Index in Willcox is 0.43.
What is the Total Population of Willcox?
Total Population of Willcox is 3,232.
What is the Total Male Population of Willcox?
Total Male Population of Willcox is 1,619.
What is the Total Female Population of Willcox?
Total Female Population of Willcox is 1,613.
What is the Ratio of Males per 100 Females in Willcox?
There are 100.37 Males per 100 Females in Willcox.
What is the Ratio of Females per 100 Males in Willcox?
There are 99.63 Females per 100 Males in Willcox.
What is the Median Population Age in Willcox?
Median Population Age in Willcox is 30.8 Years.
What is the Average Family Size in Willcox
Average Family Size in Willcox is 4.0 People.
What is the Average Household Size in Willcox
Average Household Size in Willcox is 2.9 People.
How Large is the Labor Force in Willcox?
There are 1,462 People in the Labor Forcein in Willcox.
What is the Percentage of People in the Labor Force in Willcox?
58.2% of People are in the Labor Force in Willcox.
What is the Unemployment Rate in Willcox?
Unemployment Rate in Willcox is 16.8%.