Kayenta, AZ Map & Demographics
Kayenta Map

Kayenta Overview
$18,643
PER CAPITA INCOME
$57,734
AVG FAMILY INCOME
$54,051
AVG HOUSEHOLD INCOME
32.5%
WAGE / INCOME GAP [ % ]
67.5¢/ $1
WAGE / INCOME GAP [ $ ]
0.43
INEQUALITY / GINI INDEX
5,366
TOTAL POPULATION
2,388
MALE POPULATION
2,978
FEMALE POPULATION
80.19
MALES / 100 FEMALES
124.71
FEMALES / 100 MALES
27.6
MEDIAN AGE
3.7
AVG FAMILY SIZE
3.5
AVG HOUSEHOLD SIZE
1,759
LABOR FORCE [ PEOPLE ]
47.4%
PERCENT IN LABOR FORCE
7.3%
UNEMPLOYMENT RATE
Kayenta Zip Codes
Kayenta Area Codes
Income in Kayenta
Income Overview in Kayenta
Per Capita Income in Kayenta is $18,643, while median incomes of families and households are $57,734 and $54,051 respectively.
| Characteristic | Number | Measure |
| Per Capita Income | 5,366 | $18,643 |
| Median Family Income | 1,289 | $57,734 |
| Mean Family Income | 1,289 | $69,129 |
| Median Household Income | 1,527 | $54,051 |
| Mean Household Income | 1,527 | $64,069 |
| Income Deficit | 1,289 | $0 |
| Wage / Income Gap (%) | 5,366 | 32.54% |
| Wage / Income Gap ($) | 5,366 | 67.46¢ per $1 |
| Gini / Inequality Index | 5,366 | 0.43 |
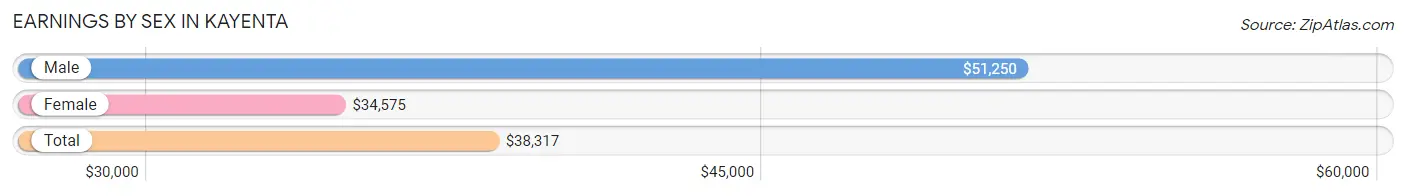
Earnings by Sex in Kayenta
Average Earnings in Kayenta are $38,317, $51,250 for men and $34,575 for women, a difference of 32.5%.
| Sex | Number | Average Earnings |
| Male | 924 (48.0%) | $51,250 |
| Female | 1,001 (52.0%) | $34,575 |
| Total | 1,925 (100.0%) | $38,317 |
Earnings by Sex by Income Bracket in Kayenta
The most common earnings brackets in Kayenta are $50,000 to $54,999 for men (135 | 14.6%) and $25,000 to $29,999 for women (172 | 17.2%).

| Income | Male | Female |
| $2,499 or less | 0 (0.0%) | 36 (3.6%) |
| $2,500 to $4,999 | 0 (0.0%) | 0 (0.0%) |
| $5,000 to $7,499 | 38 (4.1%) | 0 (0.0%) |
| $7,500 to $9,999 | 0 (0.0%) | 39 (3.9%) |
| $10,000 to $12,499 | 46 (5.0%) | 0 (0.0%) |
| $12,500 to $14,999 | 0 (0.0%) | 26 (2.6%) |
| $15,000 to $17,499 | 0 (0.0%) | 0 (0.0%) |
| $17,500 to $19,999 | 46 (5.0%) | 20 (2.0%) |
| $20,000 to $22,499 | 113 (12.2%) | 29 (2.9%) |
| $22,500 to $24,999 | 0 (0.0%) | 54 (5.4%) |
| $25,000 to $29,999 | 55 (5.9%) | 172 (17.2%) |
| $30,000 to $34,999 | 57 (6.2%) | 150 (15.0%) |
| $35,000 to $39,999 | 0 (0.0%) | 99 (9.9%) |
| $40,000 to $44,999 | 76 (8.2%) | 84 (8.4%) |
| $45,000 to $49,999 | 0 (0.0%) | 97 (9.7%) |
| $50,000 to $54,999 | 135 (14.6%) | 0 (0.0%) |
| $55,000 to $64,999 | 70 (7.6%) | 120 (12.0%) |
| $65,000 to $74,999 | 120 (13.0%) | 26 (2.6%) |
| $75,000 to $99,999 | 99 (10.7%) | 49 (4.9%) |
| $100,000+ | 69 (7.5%) | 0 (0.0%) |
| Total | 924 (100.0%) | 1,001 (100.0%) |
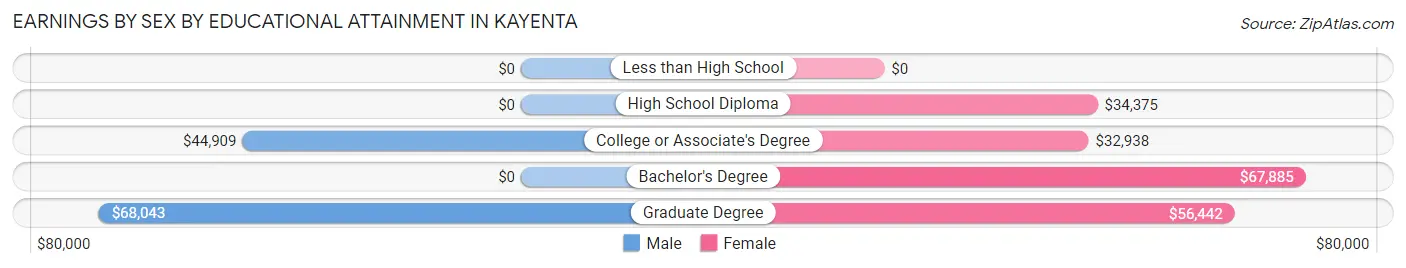
Earnings by Sex by Educational Attainment in Kayenta
Average earnings in Kayenta are $51,250 for men and $34,508 for women, a difference of 32.7%. Men with an educational attainment of graduate degree enjoy the highest average annual earnings of $68,043, while those with college or associate's degree education earn the least with $44,909. Women with an educational attainment of bachelor's degree earn the most with the average annual earnings of $67,885, while those with college or associate's degree education have the smallest earnings of $32,938.
| Educational Attainment | Male Income | Female Income |
| Less than High School | - | - |
| High School Diploma | - | - |
| College or Associate's Degree | $44,909 | $32,938 |
| Bachelor's Degree | - | - |
| Graduate Degree | $68,043 | $56,442 |
| Total | $51,250 | $34,508 |
Family Income in Kayenta
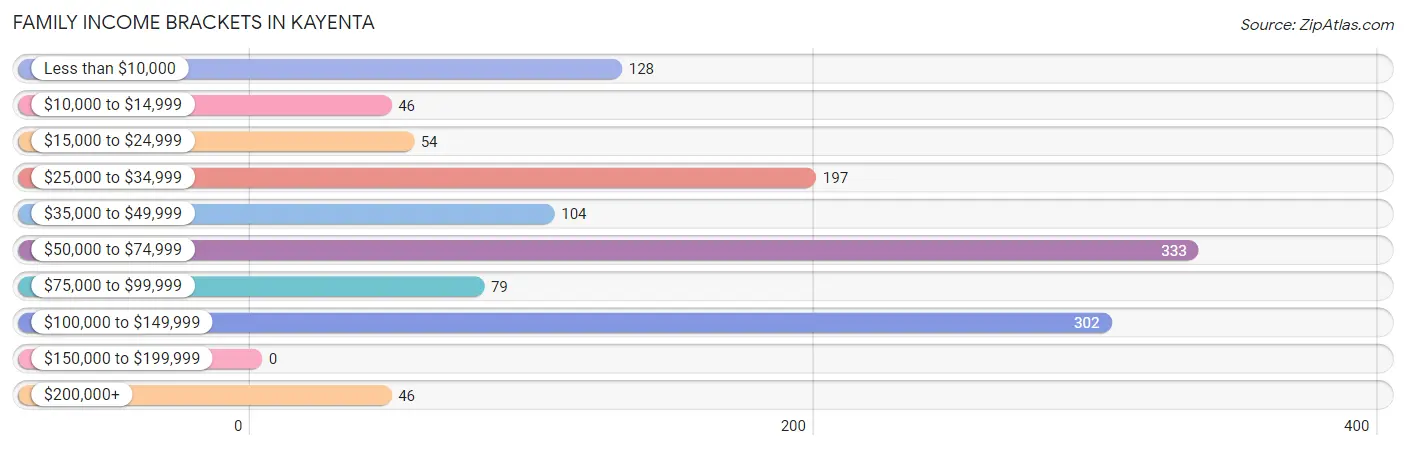
Family Income Brackets in Kayenta
According to the Kayenta family income data, there are 333 families falling into the $50,000 to $74,999 income range, which is the most common income bracket and makes up 25.8% of all families.
| Income Bracket | # Families | % Families |
| Less than $10,000 | 128 | 9.9% |
| $10,000 to $14,999 | 46 | 3.6% |
| $15,000 to $24,999 | 54 | 4.2% |
| $25,000 to $34,999 | 197 | 15.3% |
| $35,000 to $49,999 | 104 | 8.1% |
| $50,000 to $74,999 | 333 | 25.8% |
| $75,000 to $99,999 | 79 | 6.1% |
| $100,000 to $149,999 | 302 | 23.4% |
| $150,000 to $199,999 | 0 | 0.0% |
| $200,000+ | 46 | 3.6% |
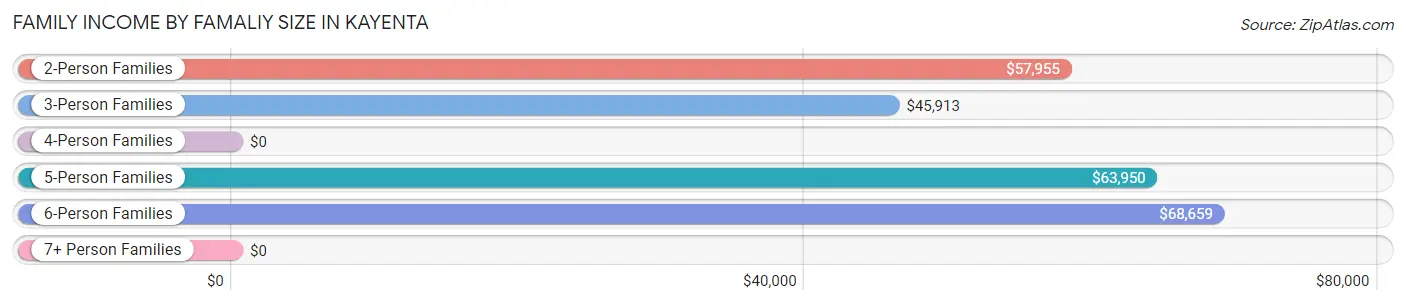
Family Income by Famaliy Size in Kayenta
6-person families (90 | 7.0%) account for the highest median family income in Kayenta with $68,659 per family, while 2-person families (352 | 27.3%) have the highest median income of $28,978 per family member.
| Income Bracket | # Families | Median Income |
| 2-Person Families | 352 (27.3%) | $57,955 |
| 3-Person Families | 229 (17.8%) | $45,913 |
| 4-Person Families | 314 (24.4%) | $0 |
| 5-Person Families | 249 (19.3%) | $63,950 |
| 6-Person Families | 90 (7.0%) | $68,659 |
| 7+ Person Families | 55 (4.3%) | $0 |
| Total | 1,289 (100.0%) | $57,734 |
Family Income by Number of Earners in Kayenta
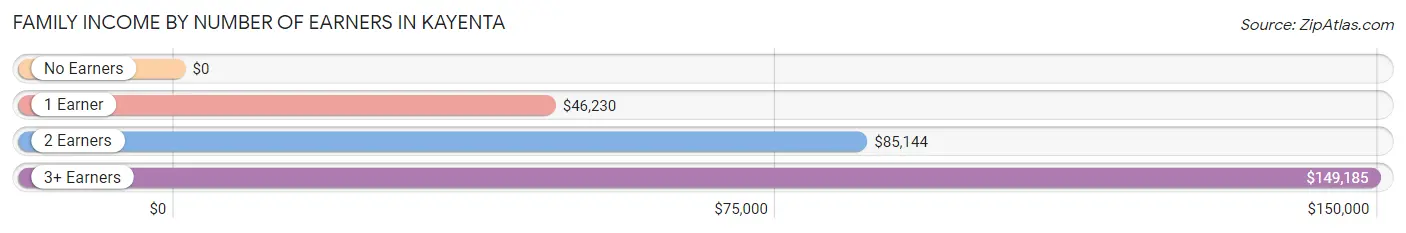
| Number of Earners | # Families | Median Income |
| No Earners | 193 (15.0%) | $0 |
| 1 Earner | 602 (46.7%) | $46,230 |
| 2 Earners | 385 (29.9%) | $85,144 |
| 3+ Earners | 109 (8.5%) | $149,185 |
| Total | 1,289 (100.0%) | $57,734 |
Household Income in Kayenta
Household Income Brackets in Kayenta
With 418 households falling in the category, the $50,000 to $74,999 income range is the most frequent in Kayenta, accounting for 27.4% of all households.
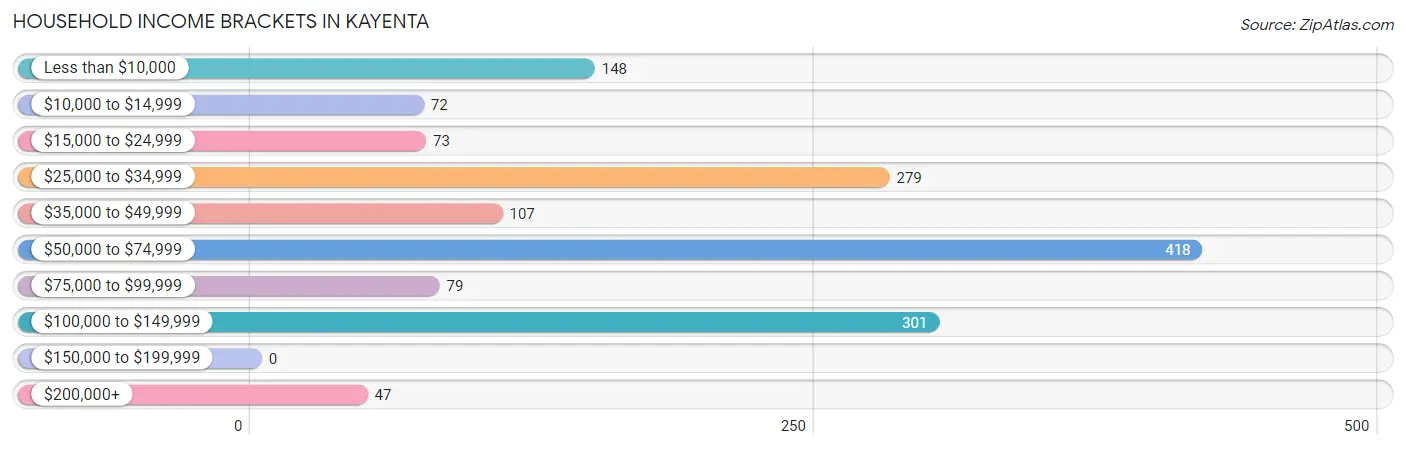
| Income Bracket | # Households | % Households |
| Less than $10,000 | 148 | 9.7% |
| $10,000 to $14,999 | 72 | 4.7% |
| $15,000 to $24,999 | 73 | 4.8% |
| $25,000 to $34,999 | 279 | 18.3% |
| $35,000 to $49,999 | 107 | 7.0% |
| $50,000 to $74,999 | 418 | 27.4% |
| $75,000 to $99,999 | 79 | 5.2% |
| $100,000 to $149,999 | 301 | 19.7% |
| $150,000 to $199,999 | 0 | 0.0% |
| $200,000+ | 47 | 3.1% |
Household Income by Householder Age in Kayenta
The median household income in Kayenta is $54,051, with the highest median household income of $61,154 found in the 45 to 64 years age bracket for the primary householder. A total of 608 households (39.8%) fall into this category.
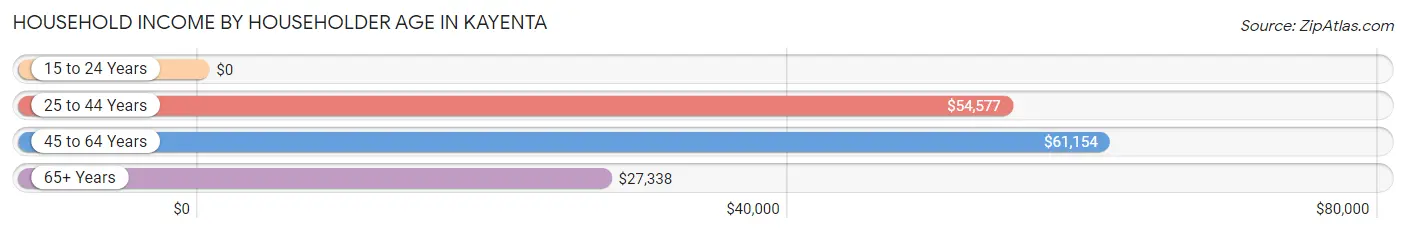
| Income Bracket | # Households | Median Income |
| 15 to 24 Years | 0 (0.0%) | $0 |
| 25 to 44 Years | 541 (35.4%) | $54,577 |
| 45 to 64 Years | 608 (39.8%) | $61,154 |
| 65+ Years | 378 (24.7%) | $27,338 |
| Total | 1,527 (100.0%) | $54,051 |
Poverty in Kayenta
Income Below Poverty by Sex and Age in Kayenta
With 24.0% poverty level for males and 34.2% for females among the residents of Kayenta, 6 to 11 year old males and 16 and 17 year old females are the most vulnerable to poverty, with 216 males (49.1%) and 57 females (64.0%) in their respective age groups living below the poverty level.
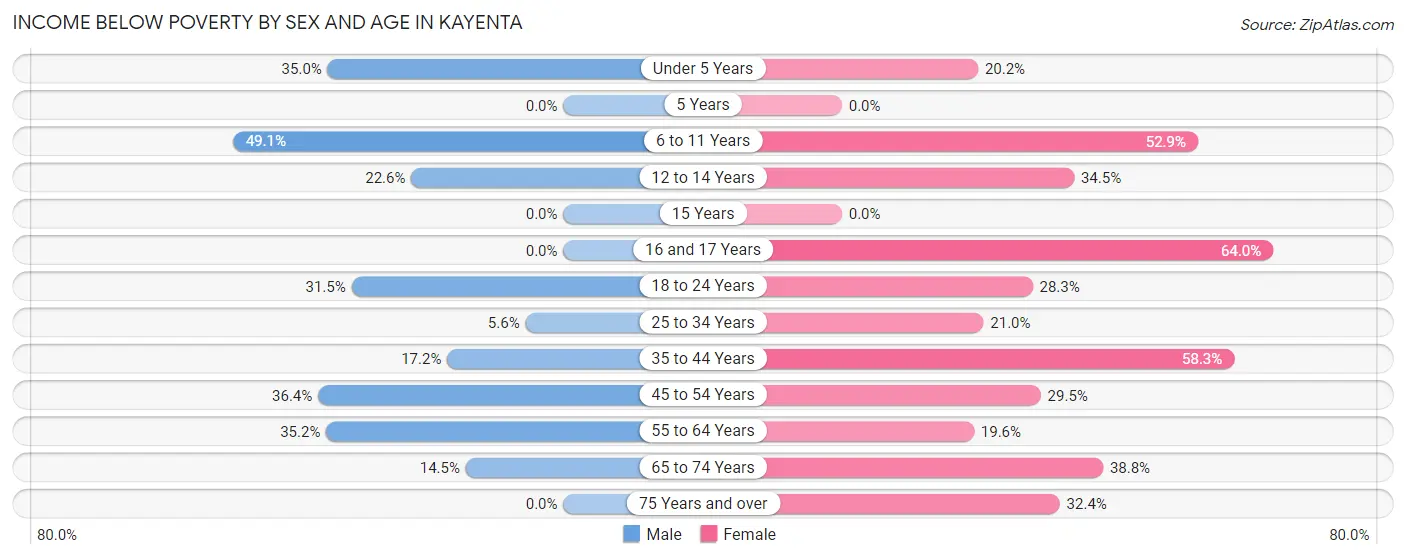
| Age Bracket | Male | Female |
| Under 5 Years | 28 (35.0%) | 56 (20.2%) |
| 5 Years | 0 (0.0%) | 0 (0.0%) |
| 6 to 11 Years | 216 (49.1%) | 259 (52.9%) |
| 12 to 14 Years | 21 (22.6%) | 30 (34.5%) |
| 15 Years | 0 (0.0%) | 0 (0.0%) |
| 16 and 17 Years | 0 (0.0%) | 57 (64.0%) |
| 18 to 24 Years | 89 (31.5%) | 96 (28.3%) |
| 25 to 34 Years | 32 (5.6%) | 111 (21.0%) |
| 35 to 44 Years | 30 (17.2%) | 120 (58.3%) |
| 45 to 54 Years | 55 (36.4%) | 57 (29.5%) |
| 55 to 64 Years | 75 (35.2%) | 61 (19.6%) |
| 65 to 74 Years | 20 (14.5%) | 133 (38.8%) |
| 75 Years and over | 0 (0.0%) | 22 (32.4%) |
| Total | 566 (24.0%) | 1,002 (34.2%) |
Income Above Poverty by Sex and Age in Kayenta
According to the poverty statistics in Kayenta, males aged 5 years and females aged 55 to 64 years are the age groups that are most secure financially, with 100.0% of males and 80.4% of females in these age groups living above the poverty line.
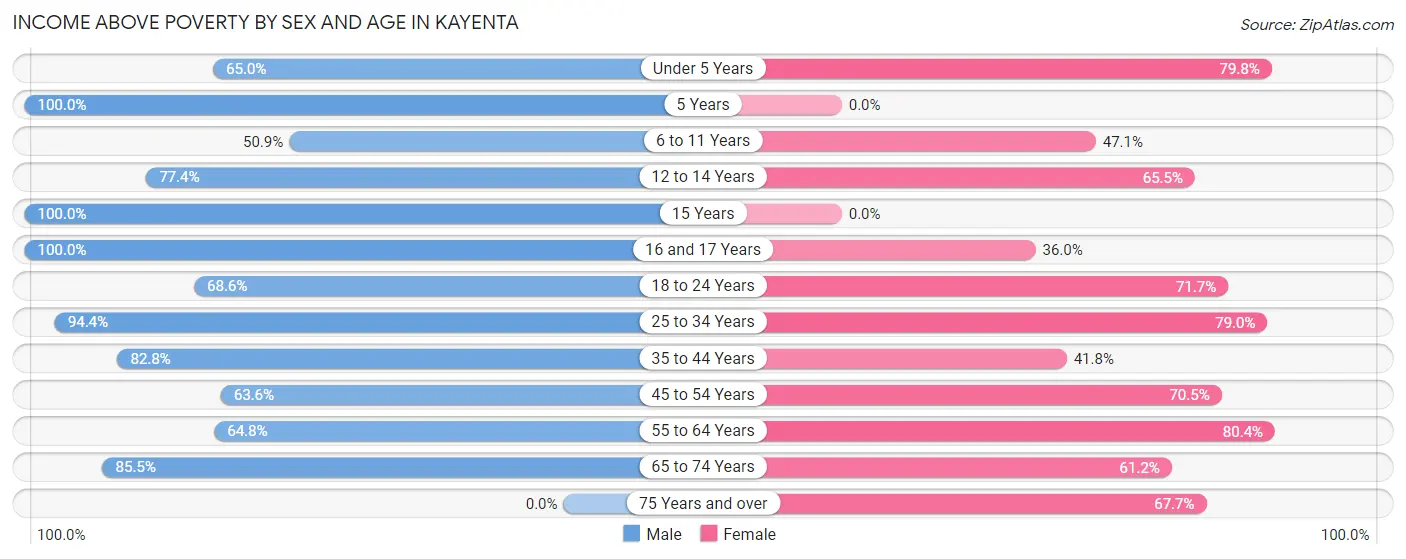
| Age Bracket | Male | Female |
| Under 5 Years | 52 (65.0%) | 221 (79.8%) |
| 5 Years | 86 (100.0%) | 0 (0.0%) |
| 6 to 11 Years | 224 (50.9%) | 231 (47.1%) |
| 12 to 14 Years | 72 (77.4%) | 57 (65.5%) |
| 15 Years | 55 (100.0%) | 0 (0.0%) |
| 16 and 17 Years | 79 (100.0%) | 32 (36.0%) |
| 18 to 24 Years | 194 (68.5%) | 243 (71.7%) |
| 25 to 34 Years | 537 (94.4%) | 417 (79.0%) |
| 35 to 44 Years | 144 (82.8%) | 86 (41.7%) |
| 45 to 54 Years | 96 (63.6%) | 136 (70.5%) |
| 55 to 64 Years | 138 (64.8%) | 250 (80.4%) |
| 65 to 74 Years | 118 (85.5%) | 210 (61.2%) |
| 75 Years and over | 0 (0.0%) | 46 (67.6%) |
| Total | 1,795 (76.0%) | 1,929 (65.8%) |
Income Below Poverty Among Married-Couple Families in Kayenta
The poverty statistics for married-couple families in Kayenta show that 12.1% or 78 of the total 642 families live below the poverty line. Families with no children have the highest poverty rate of 29.5%, comprising of 59 families. On the other hand, families with 3 or 4 children have the lowest poverty rate of 0.0%, which includes 0 families.
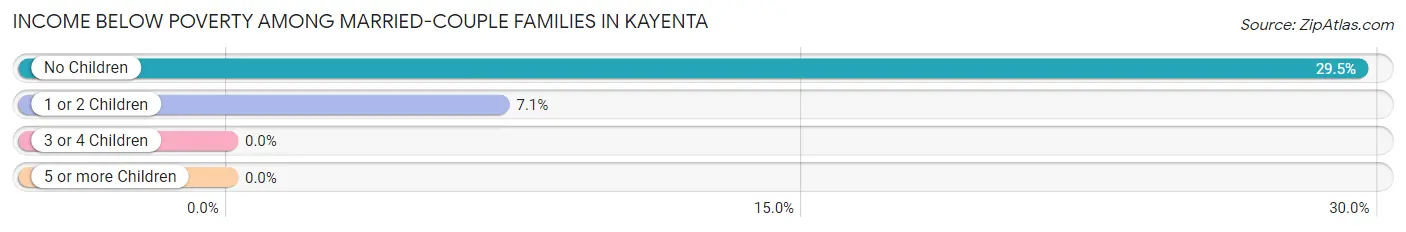
| Children | Above Poverty | Below Poverty |
| No Children | 141 (70.5%) | 59 (29.5%) |
| 1 or 2 Children | 249 (92.9%) | 19 (7.1%) |
| 3 or 4 Children | 174 (100.0%) | 0 (0.0%) |
| 5 or more Children | 0 (0.0%) | 0 (0.0%) |
| Total | 564 (87.8%) | 78 (12.1%) |
Income Below Poverty Among Single-Parent Households in Kayenta
According to the poverty data in Kayenta, 14.3% or 30 single-father households and 54.1% or 237 single-mother households are living below the poverty line. Among single-father households, those with 1 or 2 children have the highest poverty rate, with 30 households (42.2%) experiencing poverty. Likewise, among single-mother households, those with 5 or more children have the highest poverty rate, with 31 households (100.0%) falling below the poverty line.
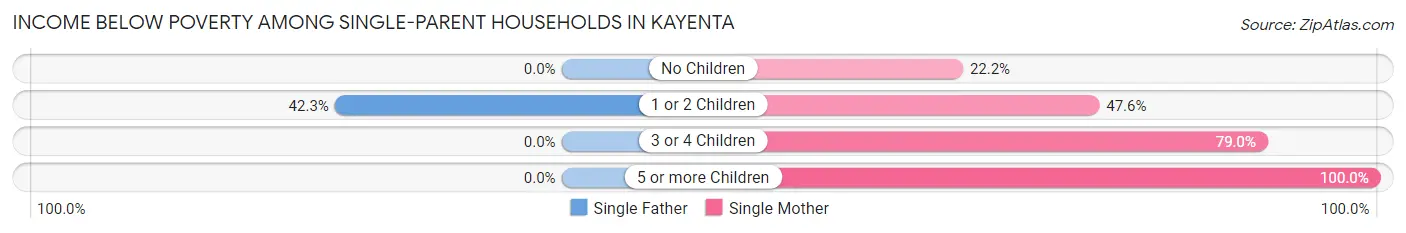
| Children | Single Father | Single Mother |
| No Children | 0 (0.0%) | 22 (22.2%) |
| 1 or 2 Children | 30 (42.2%) | 90 (47.6%) |
| 3 or 4 Children | 0 (0.0%) | 94 (79.0%) |
| 5 or more Children | 0 (0.0%) | 31 (100.0%) |
| Total | 30 (14.3%) | 237 (54.1%) |
Income Below Poverty Among Married-Couple vs Single-Parent Households in Kayenta
The poverty data for Kayenta shows that 78 of the married-couple family households (12.1%) and 267 of the single-parent households (41.3%) are living below the poverty level. Within the married-couple family households, those with no children have the highest poverty rate, with 59 households (29.5%) falling below the poverty line. Among the single-parent households, those with 5 or more children have the highest poverty rate, with 31 household (100.0%) living below poverty.
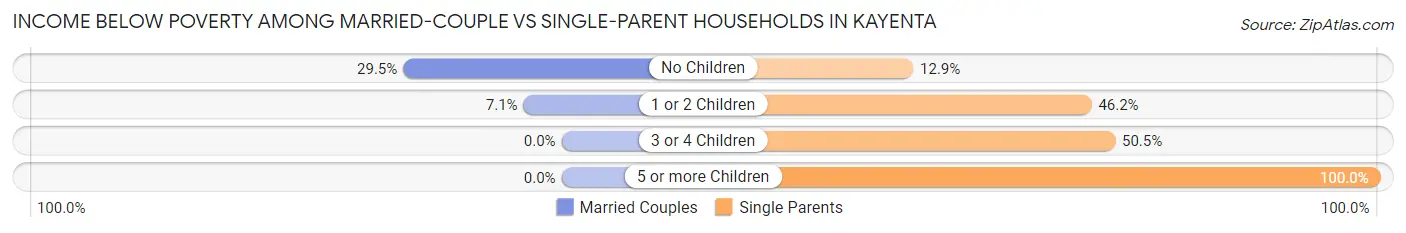
| Children | Married-Couple Families | Single-Parent Households |
| No Children | 59 (29.5%) | 22 (12.9%) |
| 1 or 2 Children | 19 (7.1%) | 120 (46.2%) |
| 3 or 4 Children | 0 (0.0%) | 94 (50.5%) |
| 5 or more Children | 0 (0.0%) | 31 (100.0%) |
| Total | 78 (12.1%) | 267 (41.3%) |
Race in Kayenta
The most populous races in Kayenta are Native / Alaskan (5,103 | 95.1%), White / Caucasian (187 | 3.5%), and Asian (38 | 0.7%).
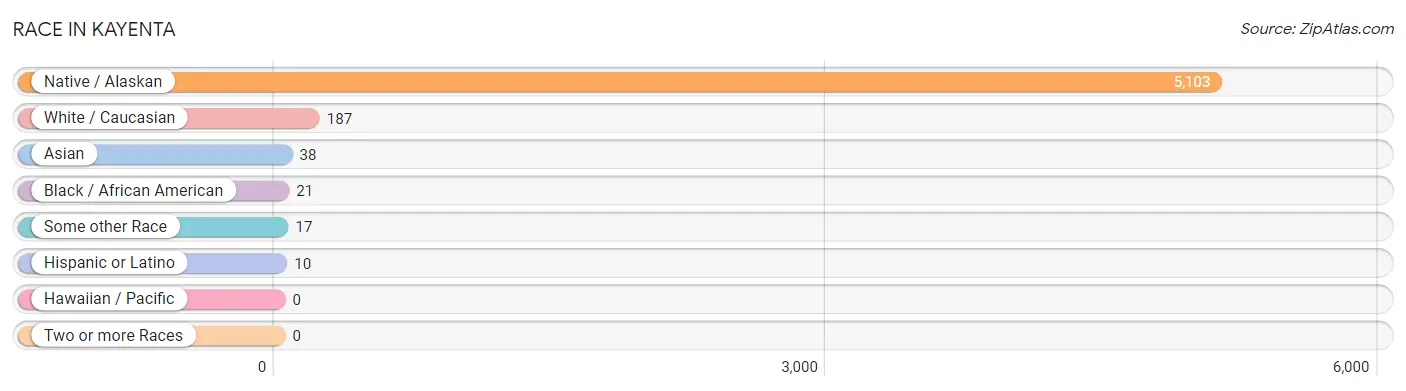
| Race | # Population | % Population |
| Asian | 38 | 0.7% |
| Black / African American | 21 | 0.4% |
| Hawaiian / Pacific | 0 | 0.0% |
| Hispanic or Latino | 10 | 0.2% |
| Native / Alaskan | 5,103 | 95.1% |
| White / Caucasian | 187 | 3.5% |
| Two or more Races | 0 | 0.0% |
| Some other Race | 17 | 0.3% |
| Total | 5,366 | 100.0% |
Ancestry in Kayenta
The most populous ancestries reported in Kayenta are Navajo (5,041 | 93.9%), Hopi (81 | 1.5%), German (52 | 1.0%), Apache (48 | 0.9%), and Burmese (38 | 0.7%), together accounting for 98.0% of all Kayenta residents.
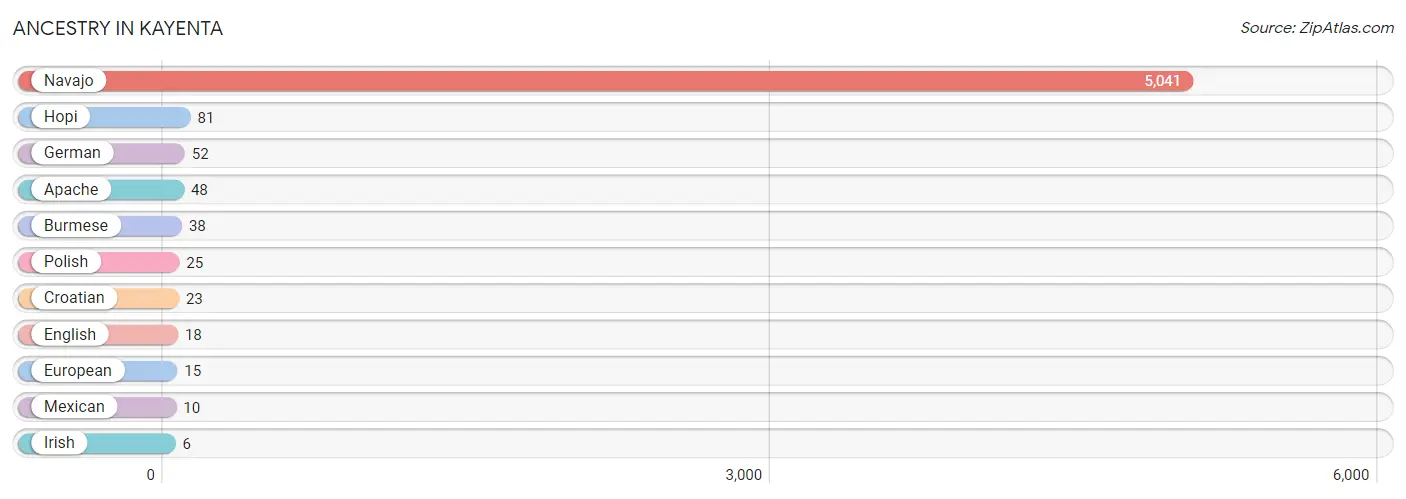
| Ancestry | # Population | % Population |
| Apache | 48 | 0.9% |
| Burmese | 38 | 0.7% |
| Croatian | 23 | 0.4% |
| English | 18 | 0.3% |
| European | 15 | 0.3% |
| German | 52 | 1.0% |
| Hopi | 81 | 1.5% |
| Irish | 6 | 0.1% |
| Mexican | 10 | 0.2% |
| Navajo | 5,041 | 93.9% |
| Polish | 25 | 0.5% | View All 11 Rows |
Immigrants in Kayenta
The most numerous immigrant groups reported in Kayenta came from Asia (38 | 0.7%), Eastern Asia (38 | 0.7%), and Korea (38 | 0.7%), together accounting for 2.1% of all Kayenta residents.
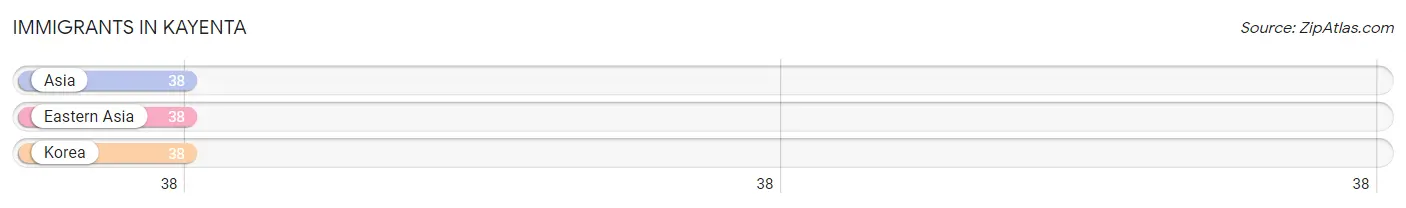
| Immigration Origin | # Population | % Population |
| Asia | 38 | 0.7% |
| Eastern Asia | 38 | 0.7% |
| Korea | 38 | 0.7% | View All 3 Rows |
Sex and Age in Kayenta
Sex and Age in Kayenta
The most populous age groups in Kayenta are 5 to 9 Years (405 | 17.0%) for men and 30 to 34 Years (412 | 13.8%) for women.
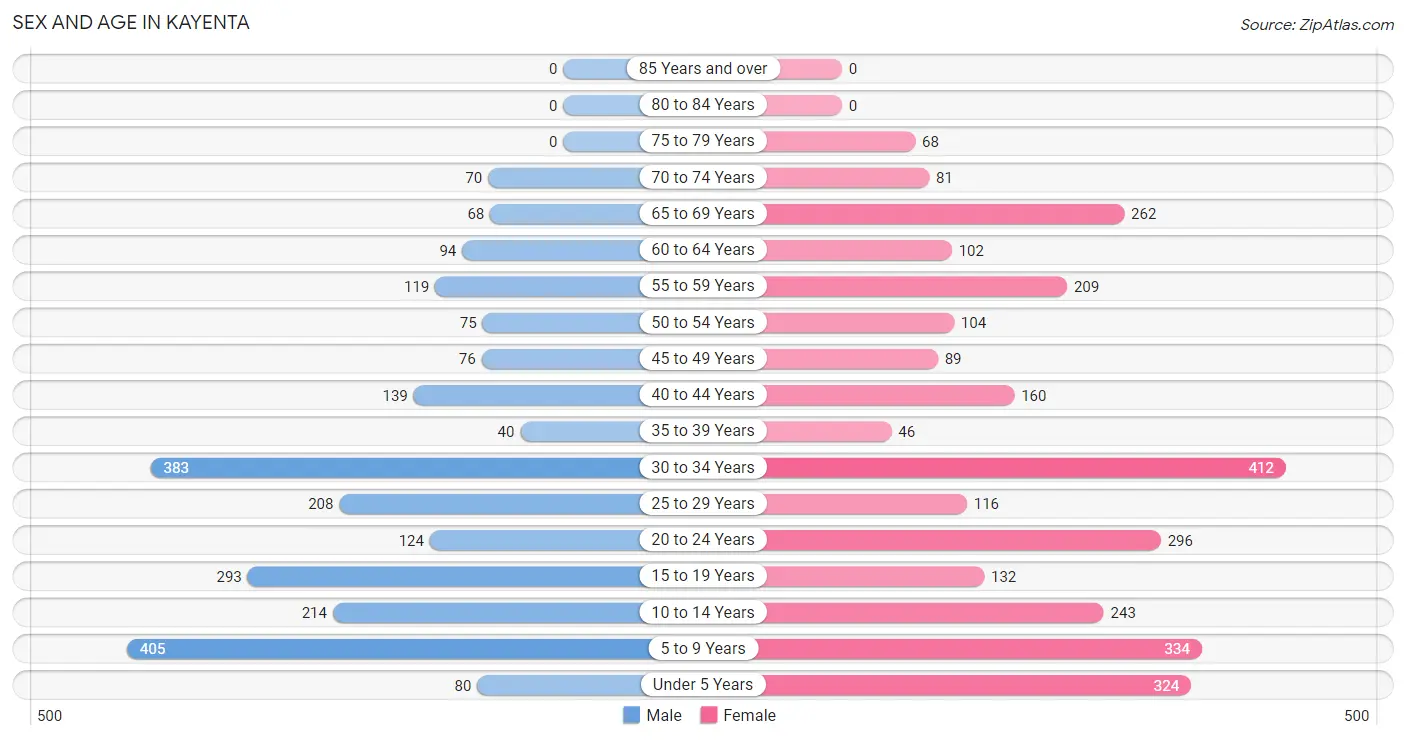
| Age Bracket | Male | Female |
| Under 5 Years | 80 (3.4%) | 324 (10.9%) |
| 5 to 9 Years | 405 (17.0%) | 334 (11.2%) |
| 10 to 14 Years | 214 (9.0%) | 243 (8.2%) |
| 15 to 19 Years | 293 (12.3%) | 132 (4.4%) |
| 20 to 24 Years | 124 (5.2%) | 296 (9.9%) |
| 25 to 29 Years | 208 (8.7%) | 116 (3.9%) |
| 30 to 34 Years | 383 (16.0%) | 412 (13.8%) |
| 35 to 39 Years | 40 (1.7%) | 46 (1.5%) |
| 40 to 44 Years | 139 (5.8%) | 160 (5.4%) |
| 45 to 49 Years | 76 (3.2%) | 89 (3.0%) |
| 50 to 54 Years | 75 (3.1%) | 104 (3.5%) |
| 55 to 59 Years | 119 (5.0%) | 209 (7.0%) |
| 60 to 64 Years | 94 (3.9%) | 102 (3.4%) |
| 65 to 69 Years | 68 (2.9%) | 262 (8.8%) |
| 70 to 74 Years | 70 (2.9%) | 81 (2.7%) |
| 75 to 79 Years | 0 (0.0%) | 68 (2.3%) |
| 80 to 84 Years | 0 (0.0%) | 0 (0.0%) |
| 85 Years and over | 0 (0.0%) | 0 (0.0%) |
| Total | 2,388 (100.0%) | 2,978 (100.0%) |
Families and Households in Kayenta
Median Family Size in Kayenta
The median family size in Kayenta is 3.70 persons per family, with married-couple families (642 | 49.8%) accounting for the largest median family size of 4 persons per family. On the other hand, single male/father families (209 | 16.2%) represent the smallest median family size with 2.23 persons per family.
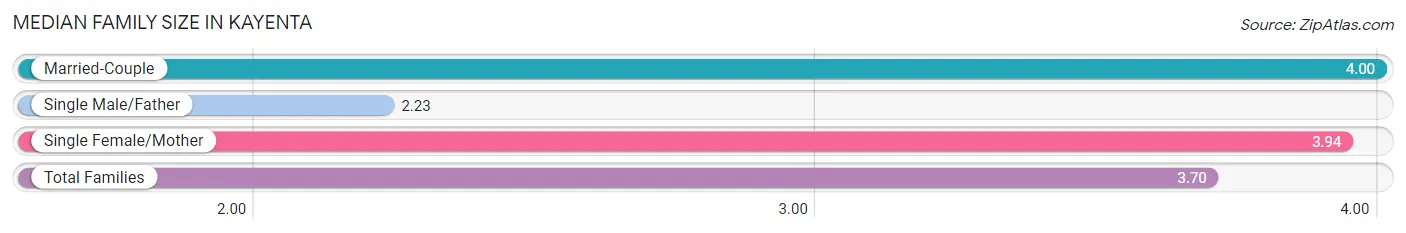
| Family Type | # Families | Family Size |
| Married-Couple | 642 (49.8%) | 4.00 |
| Single Male/Father | 209 (16.2%) | 2.23 |
| Single Female/Mother | 438 (34.0%) | 3.94 |
| Total Families | 1,289 (100.0%) | 3.70 |
Median Household Size in Kayenta
The median household size in Kayenta is 3.46 persons per household, with married-couple households (642 | 42.0%) accounting for the largest median household size of 4.26 persons per household. non-family households (238 | 15.6%) represent the smallest median household size with 1.15 persons per household.
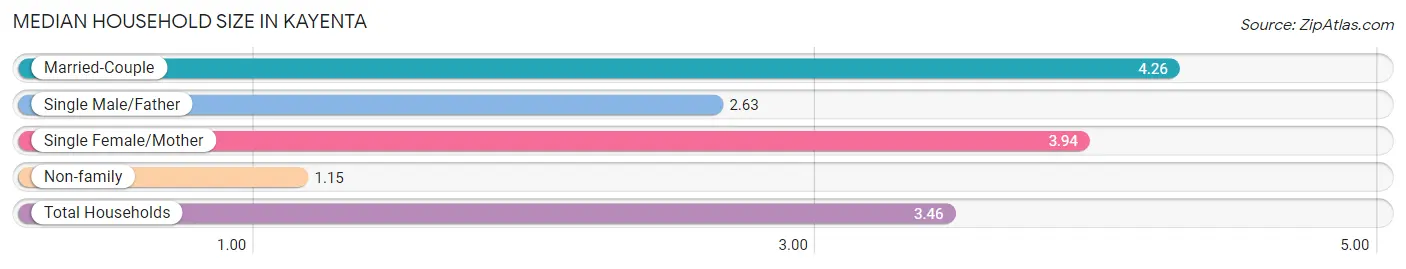
| Household Type | # Households | Household Size |
| Married-Couple | 642 (42.0%) | 4.26 |
| Single Male/Father | 209 (13.7%) | 2.63 |
| Single Female/Mother | 438 (28.7%) | 3.94 |
| Non-family | 238 (15.6%) | 1.15 |
| Total Households | 1,527 (100.0%) | 3.46 |
Household Size by Marriage Status in Kayenta
Out of a total of 1,527 households in Kayenta, 1,289 (84.4%) are family households, while 238 (15.6%) are nonfamily households. The most numerous type of family households are 2-person households, comprising 311, and the most common type of nonfamily households are 1-person households, comprising 215.
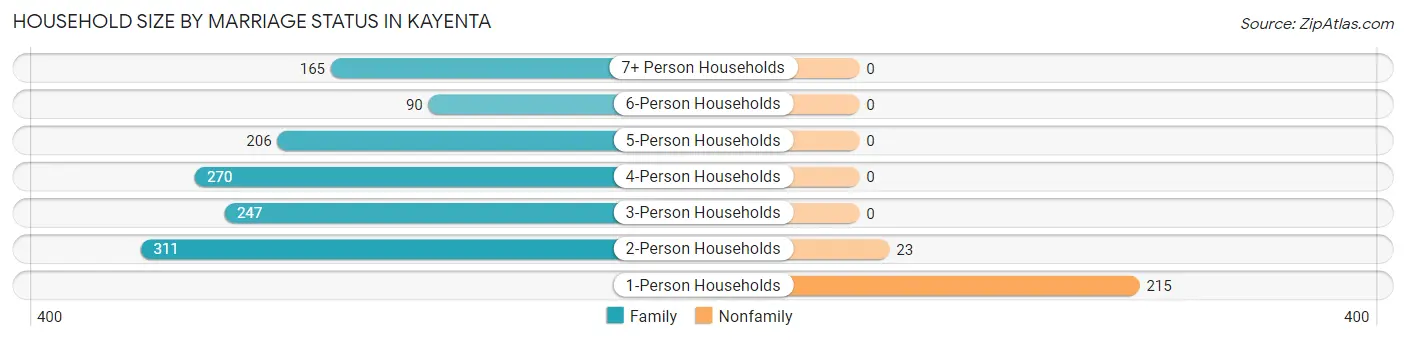
| Household Size | Family Households | Nonfamily Households |
| 1-Person Households | - | 215 (14.1%) |
| 2-Person Households | 311 (20.4%) | 23 (1.5%) |
| 3-Person Households | 247 (16.2%) | 0 (0.0%) |
| 4-Person Households | 270 (17.7%) | 0 (0.0%) |
| 5-Person Households | 206 (13.5%) | 0 (0.0%) |
| 6-Person Households | 90 (5.9%) | 0 (0.0%) |
| 7+ Person Households | 165 (10.8%) | 0 (0.0%) |
| Total | 1,289 (84.4%) | 238 (15.6%) |
Female Fertility in Kayenta
Fertility by Age in Kayenta
Average fertility rate in Kayenta is 20.0 births per 1,000 women. Women in the age bracket of 20 to 34 years have the highest fertility rate with 30.0 births per 1,000 women. Women in the age bracket of 20 to 34 years acount for 100.0% of all women with births.
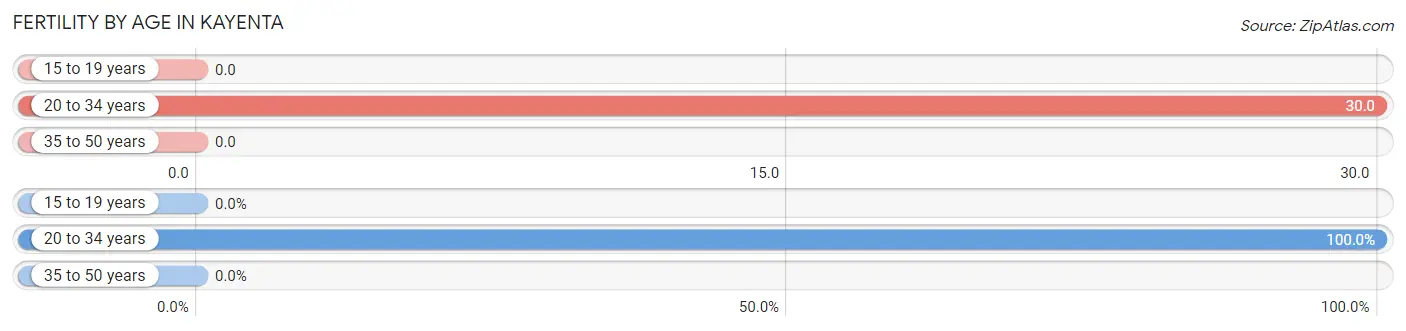
| Age Bracket | Women with Births | Births / 1,000 Women |
| 15 to 19 years | 0 (0.0%) | 0.0 |
| 20 to 34 years | 25 (100.0%) | 30.0 |
| 35 to 50 years | 0 (0.0%) | 0.0 |
| Total | 25 (100.0%) | 20.0 |
Fertility by Age by Marriage Status in Kayenta
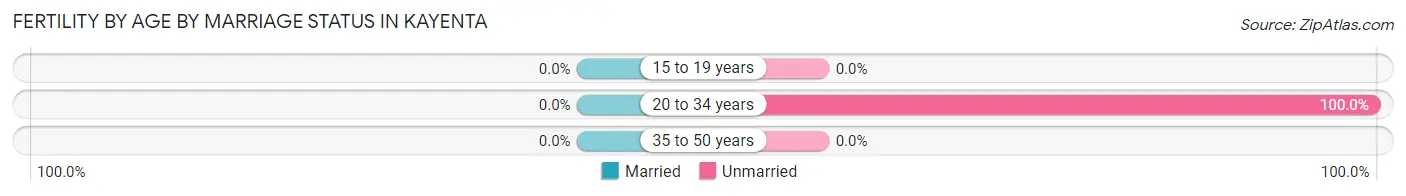
| Age Bracket | Married | Unmarried |
| 15 to 19 years | 0 (0.0%) | 0 (0.0%) |
| 20 to 34 years | 0 (0.0%) | 25 (100.0%) |
| 35 to 50 years | 0 (0.0%) | 0 (0.0%) |
| Total | 0 (0.0%) | 25 (100.0%) |
Fertility by Education in Kayenta
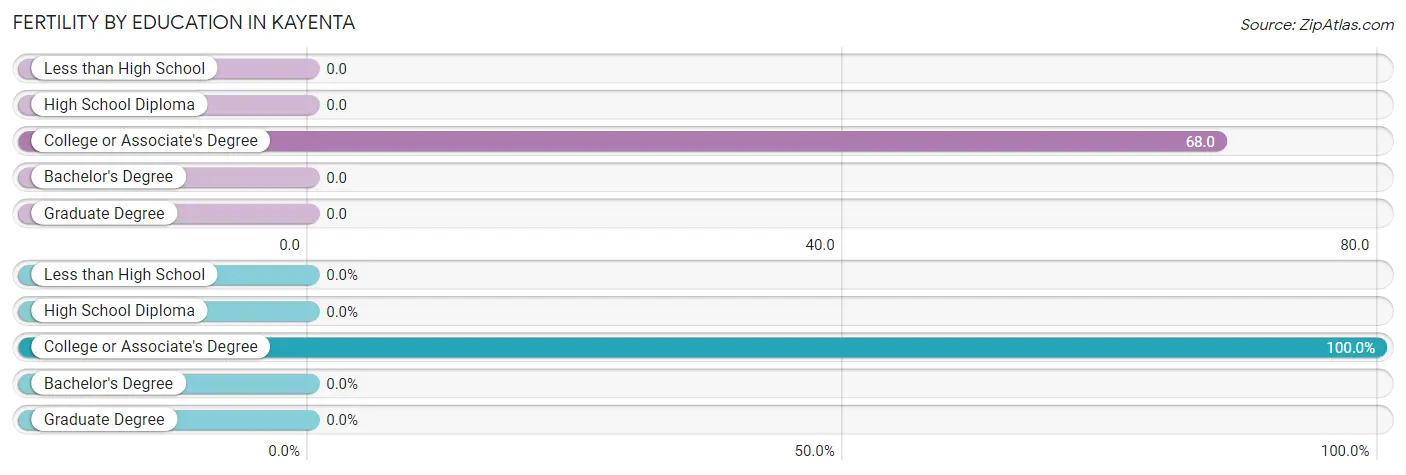
| Educational Attainment | Women with Births | Births / 1,000 Women |
| Less than High School | 0 (0.0%) | 0.0 |
| High School Diploma | 0 (0.0%) | 0.0 |
| College or Associate's Degree | 25 (100.0%) | 68.0 |
| Bachelor's Degree | 0 (0.0%) | 0.0 |
| Graduate Degree | 0 (0.0%) | 0.0 |
| Total | 25 (100.0%) | 20.0 |
Fertility by Education by Marriage Status in Kayenta
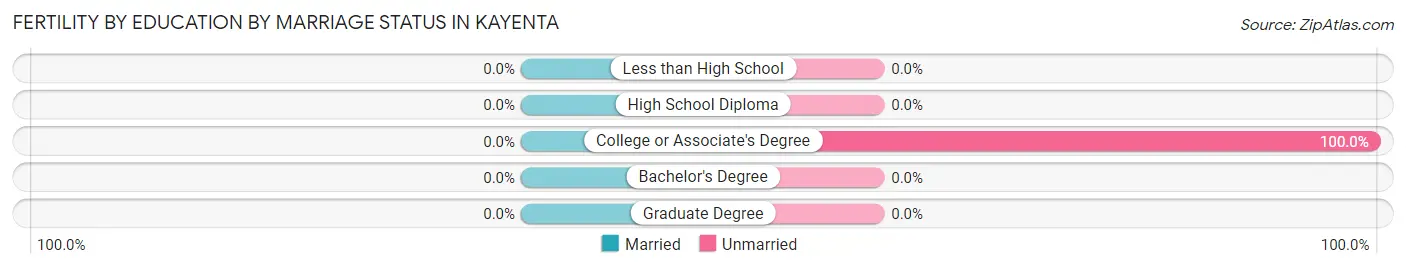
| Educational Attainment | Married | Unmarried |
| Less than High School | 0 (0.0%) | 0 (0.0%) |
| High School Diploma | 0 (0.0%) | 0 (0.0%) |
| College or Associate's Degree | 0 (0.0%) | 25 (100.0%) |
| Bachelor's Degree | 0 (0.0%) | 0 (0.0%) |
| Graduate Degree | 0 (0.0%) | 0 (0.0%) |
| Total | 0 (0.0%) | 25 (100.0%) |
Employment Characteristics in Kayenta
Employment by Class of Employer in Kayenta
Among the 1,631 employed individuals in Kayenta, private company employees (614 | 37.7%), federal government employees (283 | 17.3%), and state government employees (279 | 17.1%) make up the most common classes of employment.
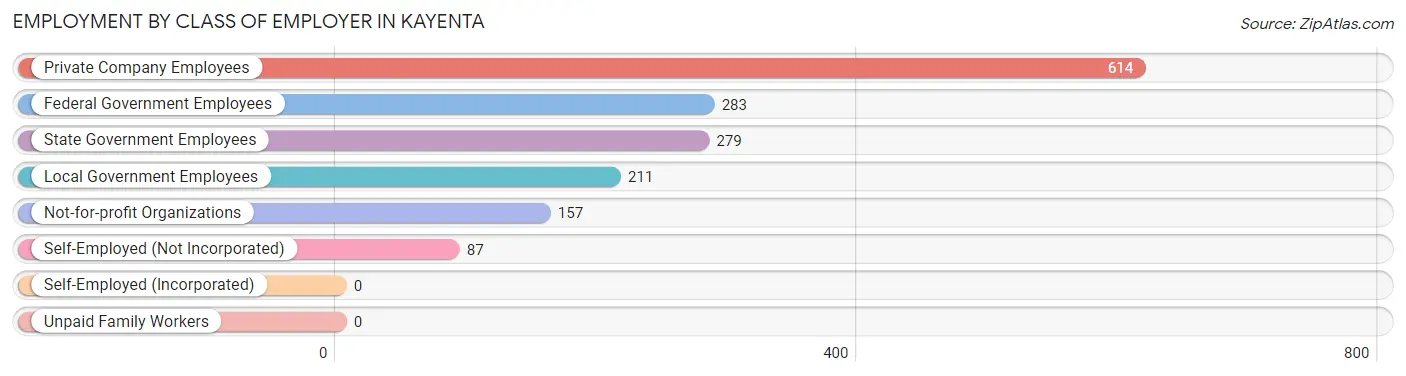
| Employer Class | # Employees | % Employees |
| Private Company Employees | 614 | 37.7% |
| Self-Employed (Incorporated) | 0 | 0.0% |
| Self-Employed (Not Incorporated) | 87 | 5.3% |
| Not-for-profit Organizations | 157 | 9.6% |
| Local Government Employees | 211 | 12.9% |
| State Government Employees | 279 | 17.1% |
| Federal Government Employees | 283 | 17.3% |
| Unpaid Family Workers | 0 | 0.0% |
| Total | 1,631 | 100.0% |
Employment Status by Age in Kayenta
According to the labor force statistics for Kayenta, out of the total population over 16 years of age (3,711), 47.4% or 1,759 individuals are in the labor force, with 7.3% or 128 of them unemployed. The age group with the highest labor force participation rate is 60 to 64 years, with 88.3% or 173 individuals in the labor force. Within the labor force, the 20 to 24 years age range has the highest percentage of unemployed individuals, with 29.2% or 33 of them being unemployed.
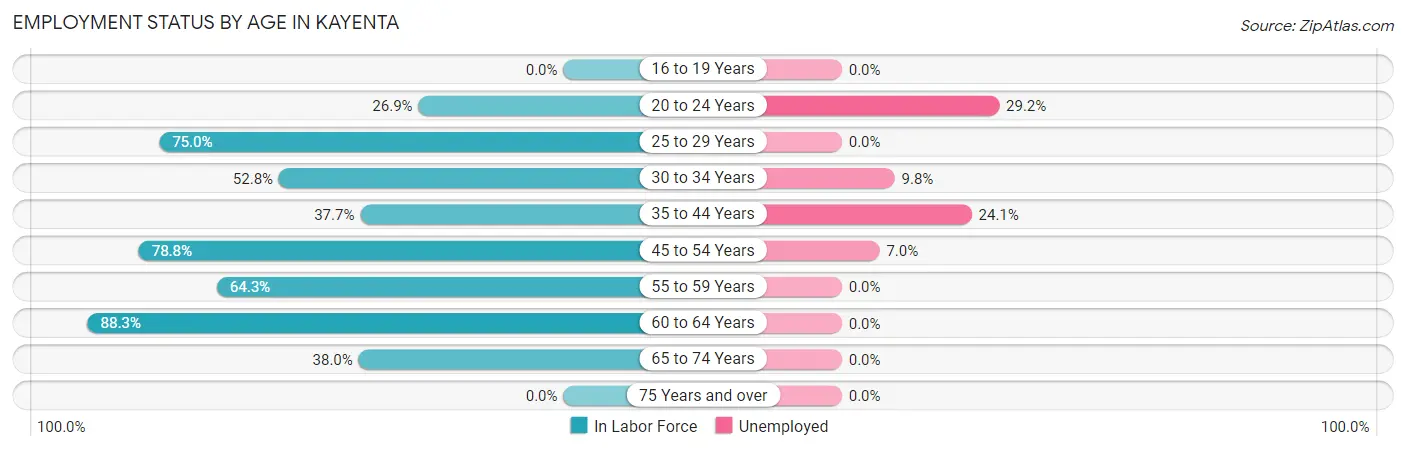
| Age Bracket | In Labor Force | Unemployed |
| 16 to 19 Years | 0 (0.0%) | 0 (0.0%) |
| 20 to 24 Years | 113 (26.9%) | 33 (29.2%) |
| 25 to 29 Years | 243 (75.0%) | 0 (0.0%) |
| 30 to 34 Years | 420 (52.8%) | 41 (9.8%) |
| 35 to 44 Years | 145 (37.7%) | 35 (24.1%) |
| 45 to 54 Years | 271 (78.8%) | 19 (7.0%) |
| 55 to 59 Years | 211 (64.3%) | 0 (0.0%) |
| 60 to 64 Years | 173 (88.3%) | 0 (0.0%) |
| 65 to 74 Years | 183 (38.0%) | 0 (0.0%) |
| 75 Years and over | 0 (0.0%) | 0 (0.0%) |
| Total | 1,759 (47.4%) | 128 (7.3%) |
Employment Status by Educational Attainment in Kayenta
According to labor force statistics for Kayenta, 61.7% of individuals (1,464) out of the total population between 25 and 64 years of age (2,372) are in the labor force, with 6.5% or 95 of them being unemployed. The group with the highest labor force participation rate are those with the educational attainment of college / associate degree, with 76.7% or 506 individuals in the labor force. Within the labor force, individuals with bachelor's degree or higher education have the highest percentage of unemployment, with 13.5% or 35 of them being unemployed.
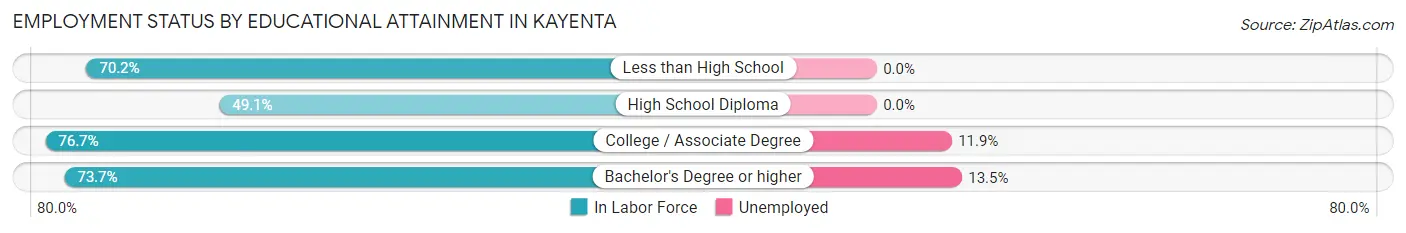
| Educational Attainment | In Labor Force | Unemployed |
| Less than High School | 99 (70.2%) | 0 (0.0%) |
| High School Diploma | 598 (49.1%) | 0 (0.0%) |
| College / Associate Degree | 506 (76.7%) | 79 (11.9%) |
| Bachelor's Degree or higher | 260 (73.7%) | 48 (13.5%) |
| Total | 1,464 (61.7%) | 154 (6.5%) |
Employment Occupations by Sex in Kayenta
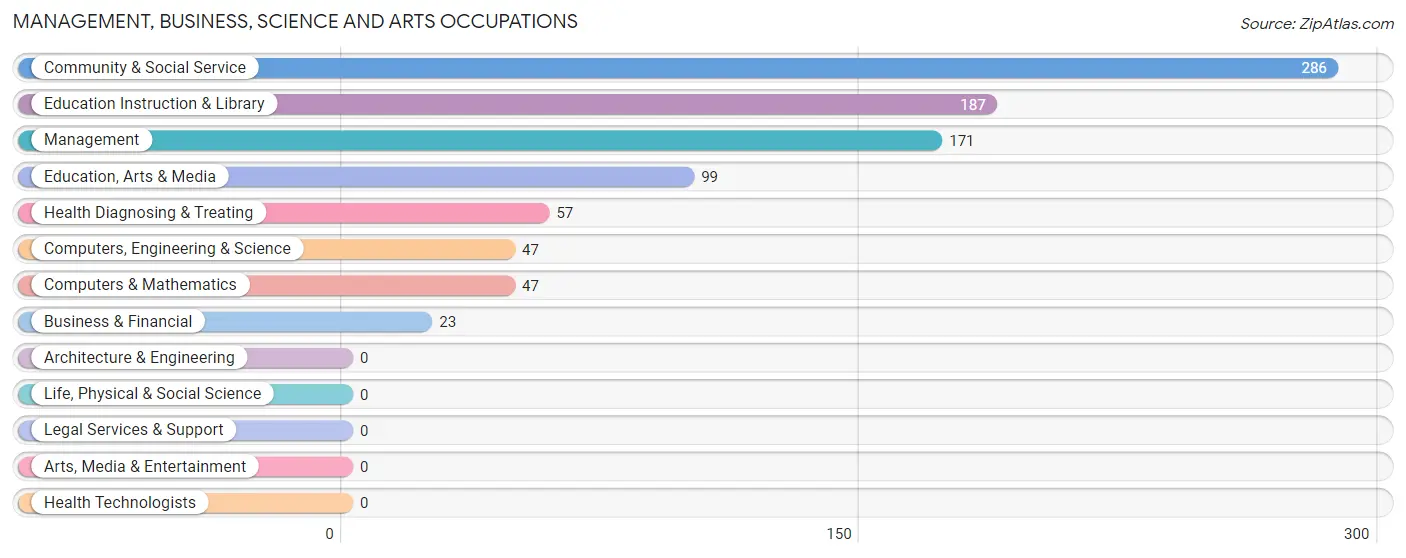
Management, Business, Science and Arts Occupations
The most common Management, Business, Science and Arts occupations in Kayenta are Community & Social Service (286 | 17.5%), Education Instruction & Library (187 | 11.5%), Management (171 | 10.5%), Education, Arts & Media (99 | 6.1%), and Health Diagnosing & Treating (57 | 3.5%).
Management, Business, Science and Arts Occupations by Sex
Within the Management, Business, Science and Arts occupations in Kayenta, the most male-oriented occupations are Computers, Engineering & Science (100.0%), Computers & Mathematics (100.0%), and Management (69.6%), while the most female-oriented occupations are Business & Financial (100.0%), Education, Arts & Media (100.0%), and Community & Social Service (92.0%).
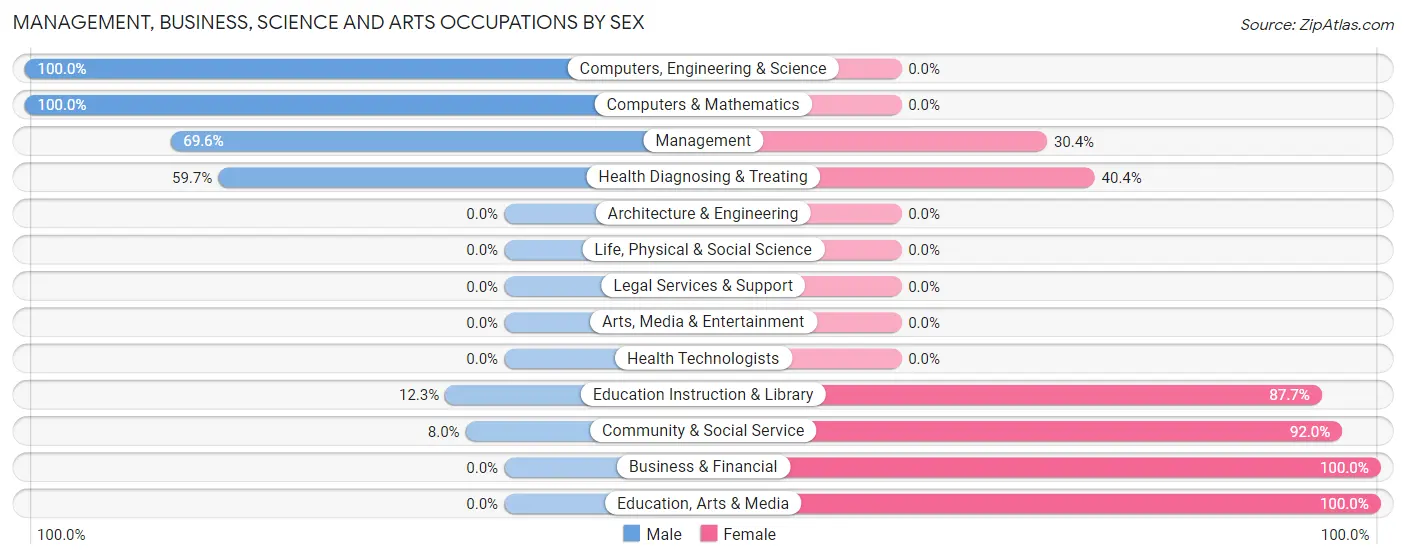
| Occupation | Male | Female |
| Management | 119 (69.6%) | 52 (30.4%) |
| Business & Financial | 0 (0.0%) | 23 (100.0%) |
| Computers, Engineering & Science | 47 (100.0%) | 0 (0.0%) |
| Computers & Mathematics | 47 (100.0%) | 0 (0.0%) |
| Architecture & Engineering | 0 (0.0%) | 0 (0.0%) |
| Life, Physical & Social Science | 0 (0.0%) | 0 (0.0%) |
| Community & Social Service | 23 (8.0%) | 263 (92.0%) |
| Education, Arts & Media | 0 (0.0%) | 99 (100.0%) |
| Legal Services & Support | 0 (0.0%) | 0 (0.0%) |
| Education Instruction & Library | 23 (12.3%) | 164 (87.7%) |
| Arts, Media & Entertainment | 0 (0.0%) | 0 (0.0%) |
| Health Diagnosing & Treating | 34 (59.7%) | 23 (40.4%) |
| Health Technologists | 0 (0.0%) | 0 (0.0%) |
| Total (Category) | 223 (38.2%) | 361 (61.8%) |
| Total (Overall) | 677 (41.5%) | 954 (58.5%) |
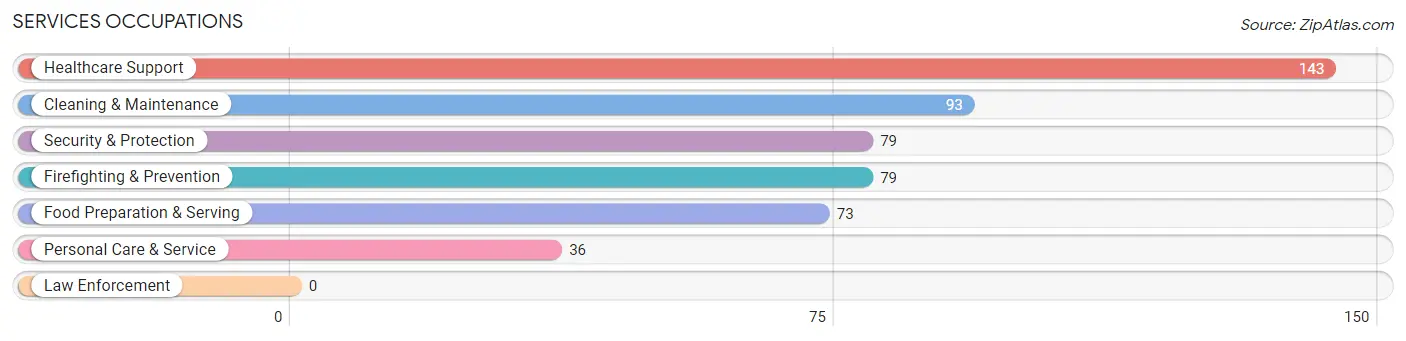
Services Occupations
The most common Services occupations in Kayenta are Healthcare Support (143 | 8.8%), Cleaning & Maintenance (93 | 5.7%), Security & Protection (79 | 4.8%), Firefighting & Prevention (79 | 4.8%), and Food Preparation & Serving (73 | 4.5%).
Services Occupations by Sex
Within the Services occupations in Kayenta, the most male-oriented occupations are Security & Protection (100.0%), Firefighting & Prevention (100.0%), and Food Preparation & Serving (46.6%), while the most female-oriented occupations are Cleaning & Maintenance (100.0%), Personal Care & Service (100.0%), and Healthcare Support (85.3%).
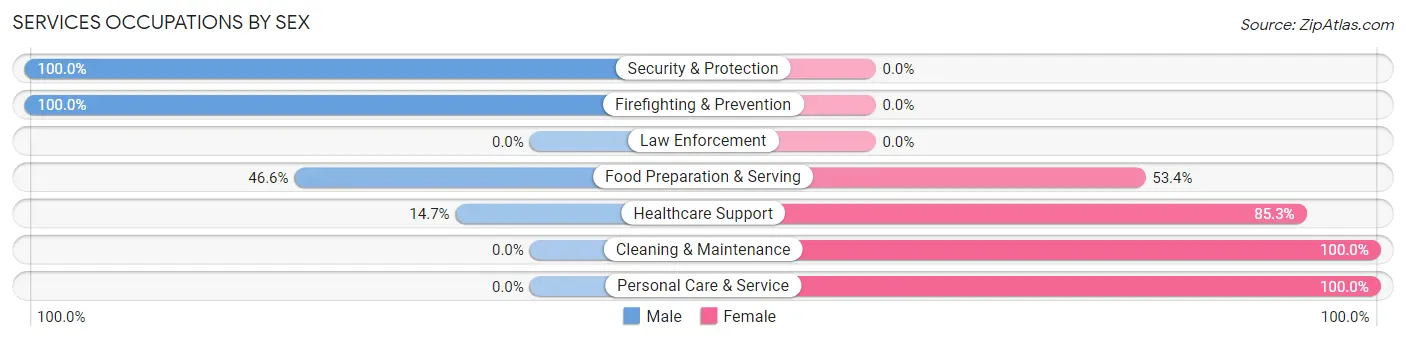
| Occupation | Male | Female |
| Healthcare Support | 21 (14.7%) | 122 (85.3%) |
| Security & Protection | 79 (100.0%) | 0 (0.0%) |
| Firefighting & Prevention | 79 (100.0%) | 0 (0.0%) |
| Law Enforcement | 0 (0.0%) | 0 (0.0%) |
| Food Preparation & Serving | 34 (46.6%) | 39 (53.4%) |
| Cleaning & Maintenance | 0 (0.0%) | 93 (100.0%) |
| Personal Care & Service | 0 (0.0%) | 36 (100.0%) |
| Total (Category) | 134 (31.6%) | 290 (68.4%) |
| Total (Overall) | 677 (41.5%) | 954 (58.5%) |
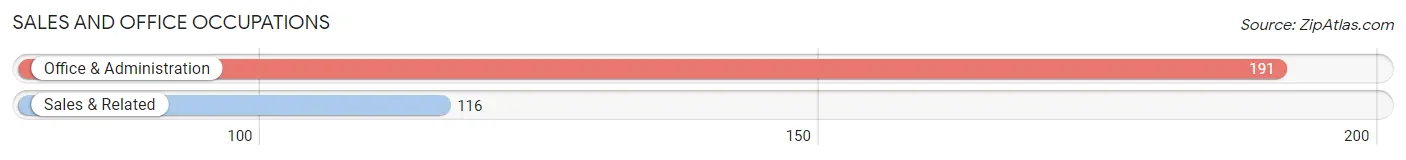
Sales and Office Occupations
The most common Sales and Office occupations in Kayenta are Office & Administration (191 | 11.7%), and Sales & Related (116 | 7.1%).
Sales and Office Occupations by Sex
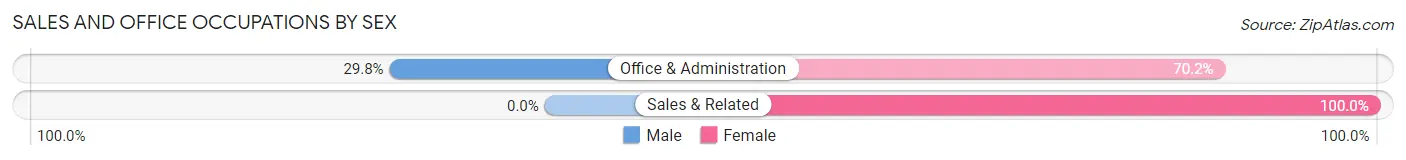
| Occupation | Male | Female |
| Sales & Related | 0 (0.0%) | 116 (100.0%) |
| Office & Administration | 57 (29.8%) | 134 (70.2%) |
| Total (Category) | 57 (18.6%) | 250 (81.4%) |
| Total (Overall) | 677 (41.5%) | 954 (58.5%) |
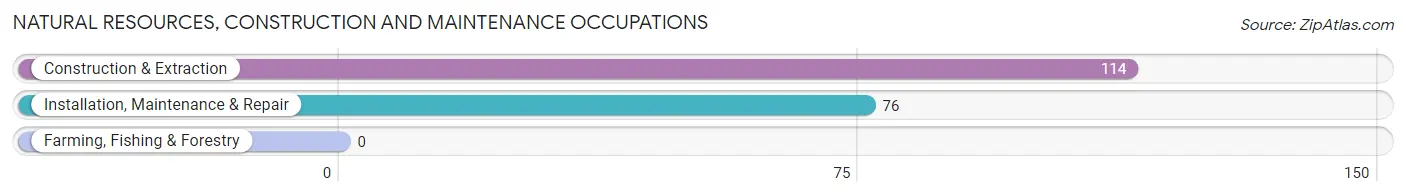
Natural Resources, Construction and Maintenance Occupations
The most common Natural Resources, Construction and Maintenance occupations in Kayenta are Construction & Extraction (114 | 7.0%), and Installation, Maintenance & Repair (76 | 4.7%).
Natural Resources, Construction and Maintenance Occupations by Sex
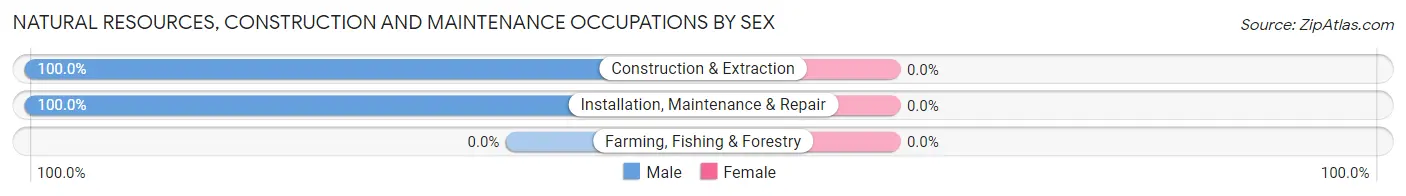
| Occupation | Male | Female |
| Farming, Fishing & Forestry | 0 (0.0%) | 0 (0.0%) |
| Construction & Extraction | 114 (100.0%) | 0 (0.0%) |
| Installation, Maintenance & Repair | 76 (100.0%) | 0 (0.0%) |
| Total (Category) | 190 (100.0%) | 0 (0.0%) |
| Total (Overall) | 677 (41.5%) | 954 (58.5%) |
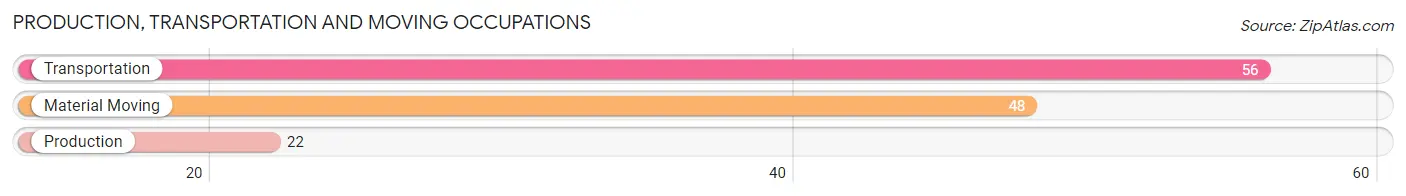
Production, Transportation and Moving Occupations
The most common Production, Transportation and Moving occupations in Kayenta are Transportation (56 | 3.4%), Material Moving (48 | 2.9%), and Production (22 | 1.3%).
Production, Transportation and Moving Occupations by Sex
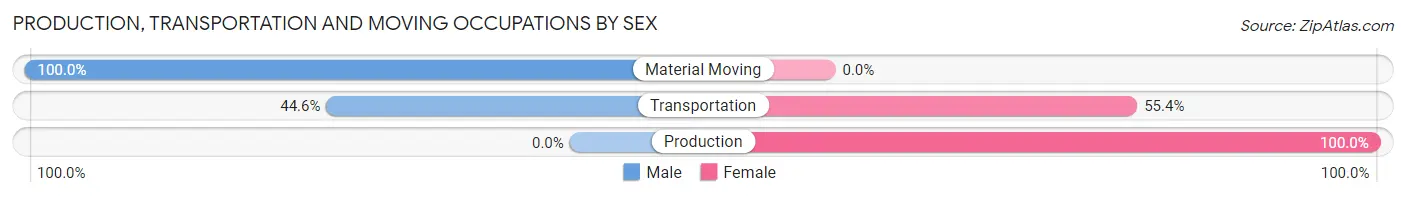
| Occupation | Male | Female |
| Production | 0 (0.0%) | 22 (100.0%) |
| Transportation | 25 (44.6%) | 31 (55.4%) |
| Material Moving | 48 (100.0%) | 0 (0.0%) |
| Total (Category) | 73 (57.9%) | 53 (42.1%) |
| Total (Overall) | 677 (41.5%) | 954 (58.5%) |
Employment Industries by Sex in Kayenta
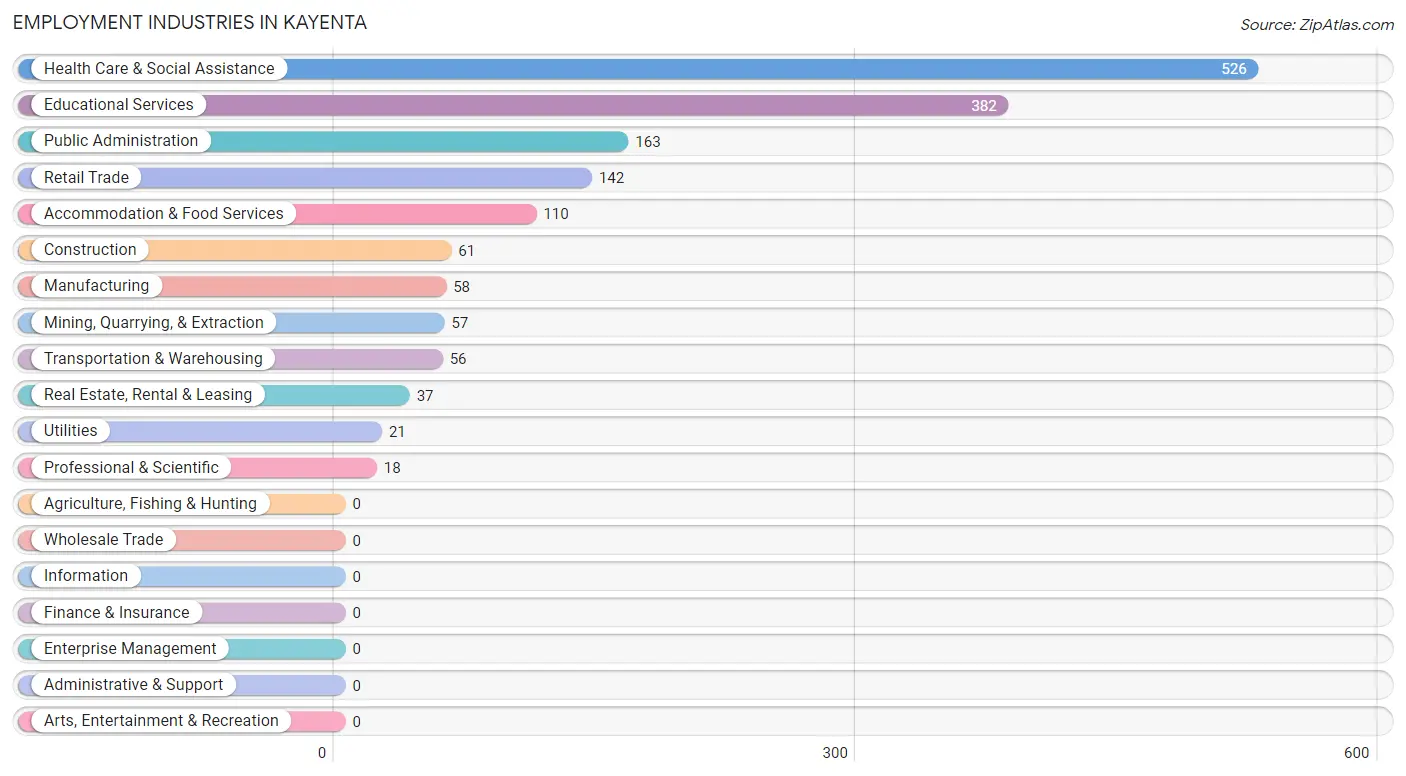
Employment Industries in Kayenta
The major employment industries in Kayenta include Health Care & Social Assistance (526 | 32.3%), Educational Services (382 | 23.4%), Public Administration (163 | 10.0%), Retail Trade (142 | 8.7%), and Accommodation & Food Services (110 | 6.7%).
Employment Industries by Sex in Kayenta
The Kayenta industries that see more men than women are Construction (100.0%), Utilities (100.0%), and Real Estate, Rental & Leasing (100.0%), whereas the industries that tend to have a higher number of women are Retail Trade (100.0%), Health Care & Social Assistance (74.1%), and Accommodation & Food Services (58.2%).
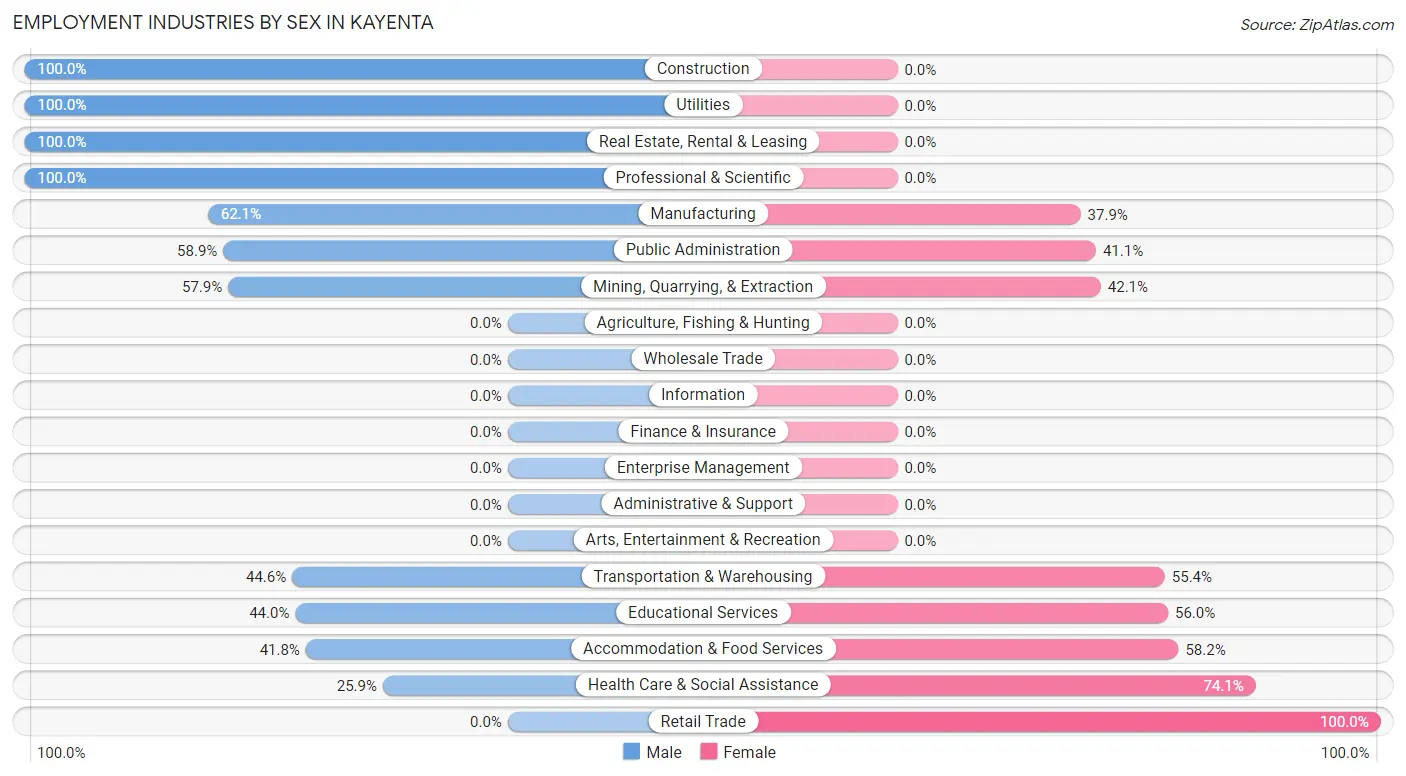
| Industry | Male | Female |
| Agriculture, Fishing & Hunting | 0 (0.0%) | 0 (0.0%) |
| Mining, Quarrying, & Extraction | 33 (57.9%) | 24 (42.1%) |
| Construction | 61 (100.0%) | 0 (0.0%) |
| Manufacturing | 36 (62.1%) | 22 (37.9%) |
| Wholesale Trade | 0 (0.0%) | 0 (0.0%) |
| Retail Trade | 0 (0.0%) | 142 (100.0%) |
| Transportation & Warehousing | 25 (44.6%) | 31 (55.4%) |
| Utilities | 21 (100.0%) | 0 (0.0%) |
| Information | 0 (0.0%) | 0 (0.0%) |
| Finance & Insurance | 0 (0.0%) | 0 (0.0%) |
| Real Estate, Rental & Leasing | 37 (100.0%) | 0 (0.0%) |
| Professional & Scientific | 18 (100.0%) | 0 (0.0%) |
| Enterprise Management | 0 (0.0%) | 0 (0.0%) |
| Administrative & Support | 0 (0.0%) | 0 (0.0%) |
| Educational Services | 168 (44.0%) | 214 (56.0%) |
| Health Care & Social Assistance | 136 (25.9%) | 390 (74.1%) |
| Arts, Entertainment & Recreation | 0 (0.0%) | 0 (0.0%) |
| Accommodation & Food Services | 46 (41.8%) | 64 (58.2%) |
| Public Administration | 96 (58.9%) | 67 (41.1%) |
| Total | 677 (41.5%) | 954 (58.5%) |
Education in Kayenta
School Enrollment in Kayenta
The most common levels of schooling among the 1,793 students in Kayenta are elementary school (617 | 34.4%), high school (391 | 21.8%), and middle school (302 | 16.8%).
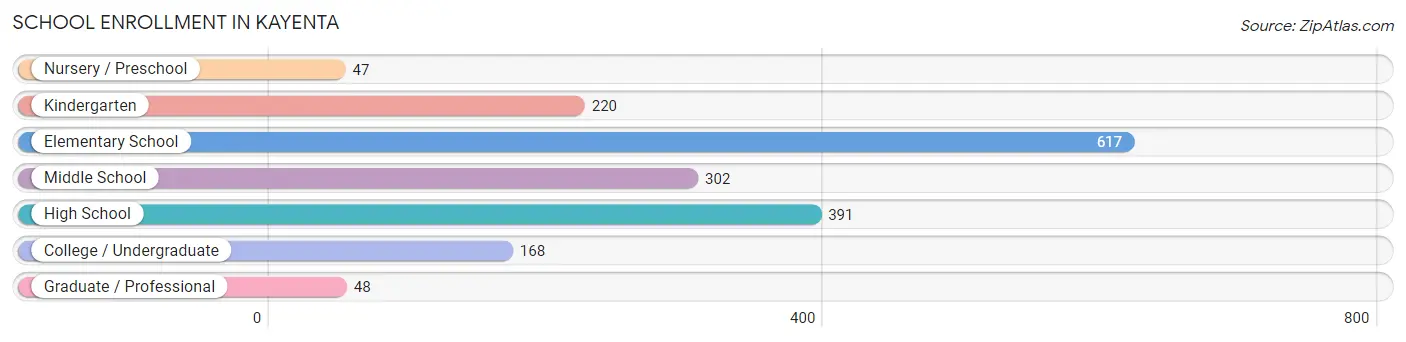
| School Level | # Students | % Students |
| Nursery / Preschool | 47 | 2.6% |
| Kindergarten | 220 | 12.3% |
| Elementary School | 617 | 34.4% |
| Middle School | 302 | 16.8% |
| High School | 391 | 21.8% |
| College / Undergraduate | 168 | 9.4% |
| Graduate / Professional | 48 | 2.7% |
| Total | 1,793 | 100.0% |
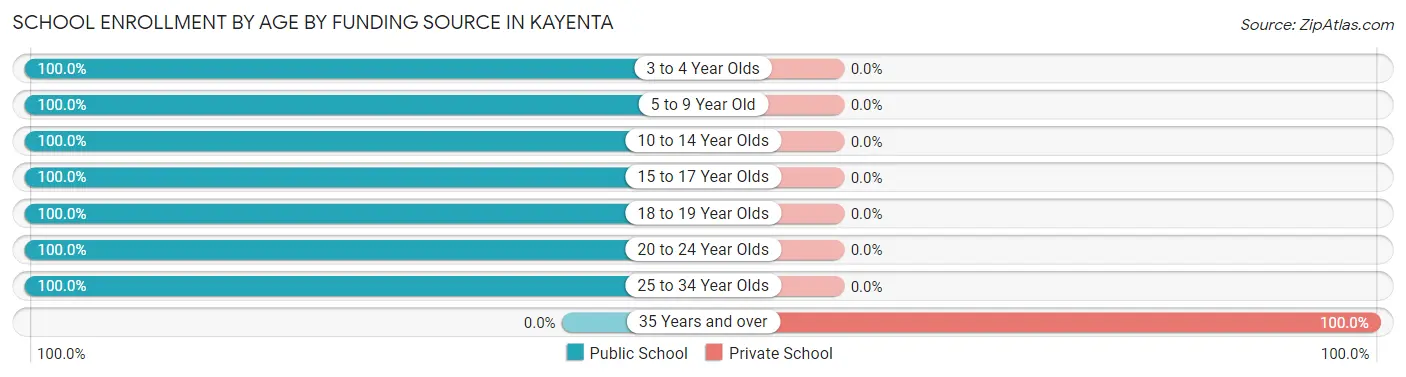
School Enrollment by Age by Funding Source in Kayenta
Out of a total of 1,793 students who are enrolled in schools in Kayenta, 68 (3.8%) attend a private institution, while the remaining 1,725 (96.2%) are enrolled in public schools. The age group of 35 years and over has the highest likelihood of being enrolled in private schools, with 68 (100.0% in the age bracket) enrolled. Conversely, the age group of 3 to 4 year olds has the lowest likelihood of being enrolled in a private school, with 47 (100.0% in the age bracket) attending a public institution.
| Age Bracket | Public School | Private School |
| 3 to 4 Year Olds | 47 (100.0%) | 0 (0.0%) |
| 5 to 9 Year Old | 739 (100.0%) | 0 (0.0%) |
| 10 to 14 Year Olds | 457 (100.0%) | 0 (0.0%) |
| 15 to 17 Year Olds | 193 (100.0%) | 0 (0.0%) |
| 18 to 19 Year Olds | 141 (100.0%) | 0 (0.0%) |
| 20 to 24 Year Olds | 101 (100.0%) | 0 (0.0%) |
| 25 to 34 Year Olds | 47 (100.0%) | 0 (0.0%) |
| 35 Years and over | 0 (0.0%) | 68 (100.0%) |
| Total | 1,725 (96.2%) | 68 (3.8%) |
Educational Attainment by Field of Study in Kayenta
Education (172 | 43.4%), engineering (62 | 15.7%), psychology (48 | 12.1%), business (35 | 8.8%), and arts & humanities (30 | 7.6%) are the most common fields of study among 396 individuals in Kayenta who have obtained a bachelor's degree or higher.
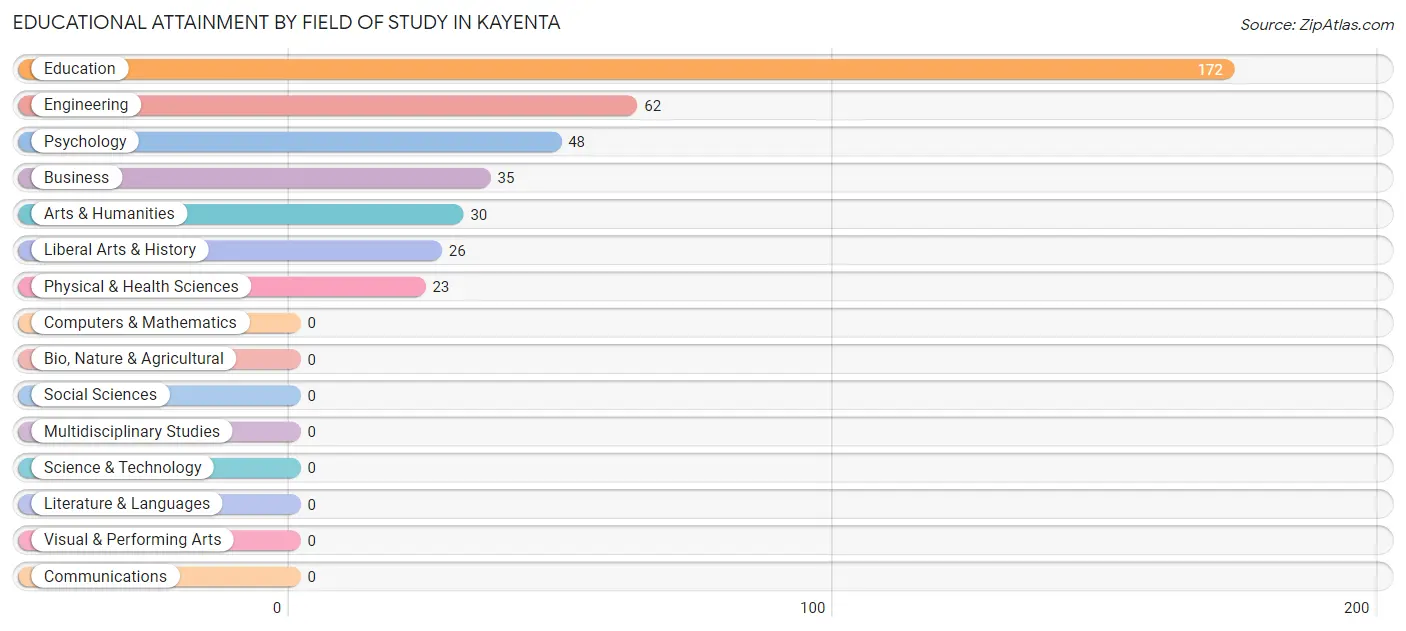
| Field of Study | # Graduates | % Graduates |
| Computers & Mathematics | 0 | 0.0% |
| Bio, Nature & Agricultural | 0 | 0.0% |
| Physical & Health Sciences | 23 | 5.8% |
| Psychology | 48 | 12.1% |
| Social Sciences | 0 | 0.0% |
| Engineering | 62 | 15.7% |
| Multidisciplinary Studies | 0 | 0.0% |
| Science & Technology | 0 | 0.0% |
| Business | 35 | 8.8% |
| Education | 172 | 43.4% |
| Literature & Languages | 0 | 0.0% |
| Liberal Arts & History | 26 | 6.6% |
| Visual & Performing Arts | 0 | 0.0% |
| Communications | 0 | 0.0% |
| Arts & Humanities | 30 | 7.6% |
| Total | 396 | 100.0% |
Transportation & Commute in Kayenta
Vehicle Availability by Sex in Kayenta
The most prevalent vehicle ownership categories in Kayenta are males with 2 vehicles (301, accounting for 45.3%) and females with 2 vehicles (473, making up 31.6%).
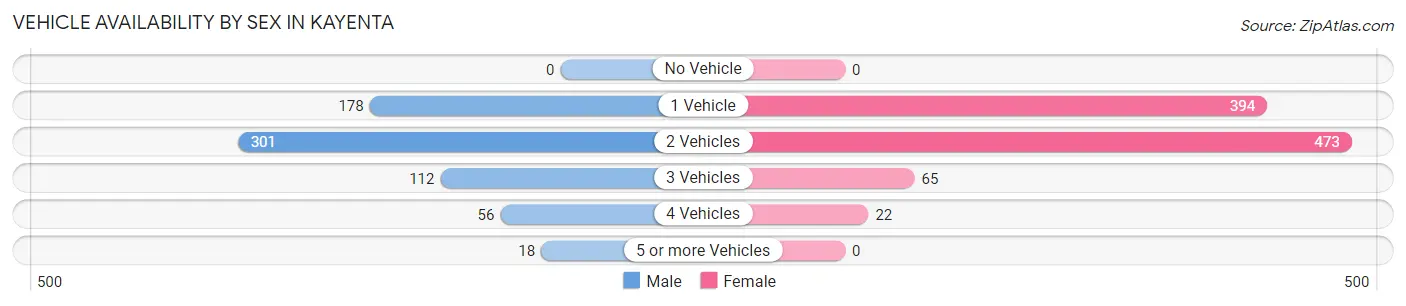
| Vehicles Available | Male | Female |
| No Vehicle | 0 (0.0%) | 0 (0.0%) |
| 1 Vehicle | 178 (26.8%) | 394 (41.3%) |
| 2 Vehicles | 301 (45.3%) | 473 (49.6%) |
| 3 Vehicles | 112 (16.8%) | 65 (6.8%) |
| 4 Vehicles | 56 (8.4%) | 22 (2.3%) |
| 5 or more Vehicles | 18 (2.7%) | 0 (0.0%) |
| Total | 665 (100.0%) | 954 (100.0%) |
Commute Time in Kayenta
The most frequently occuring commute durations in Kayenta are 15 to 19 minutes (388 commuters, 25.1%), 5 to 9 minutes (369 commuters, 23.8%), and 10 to 14 minutes (216 commuters, 14.0%).
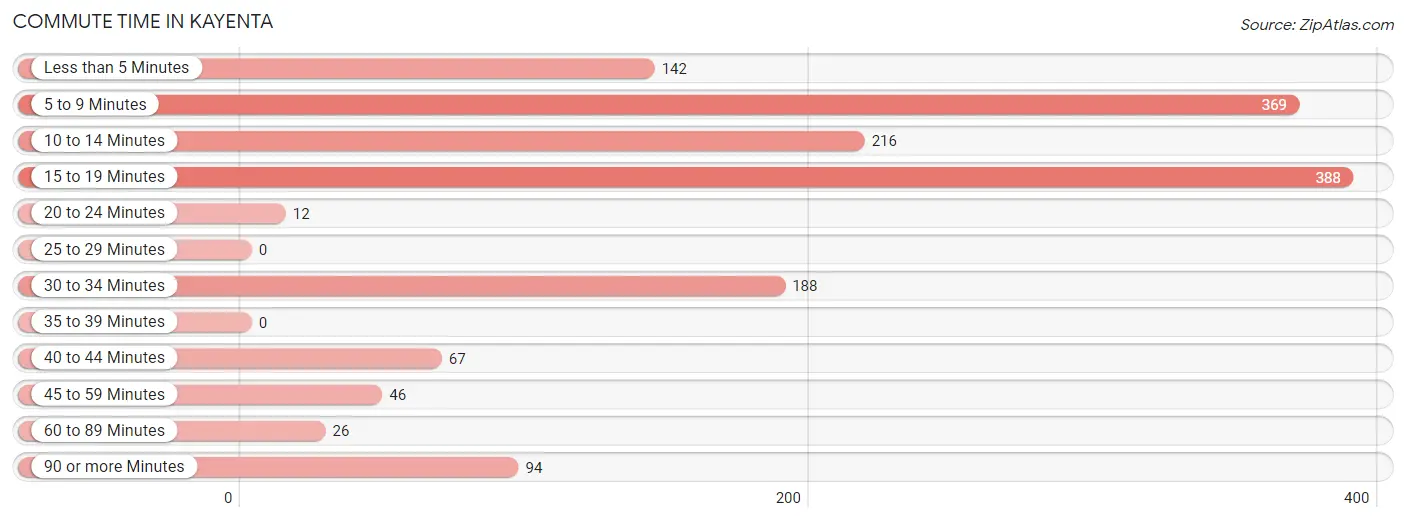
| Commute Time | # Commuters | % Commuters |
| Less than 5 Minutes | 142 | 9.2% |
| 5 to 9 Minutes | 369 | 23.8% |
| 10 to 14 Minutes | 216 | 14.0% |
| 15 to 19 Minutes | 388 | 25.1% |
| 20 to 24 Minutes | 12 | 0.8% |
| 25 to 29 Minutes | 0 | 0.0% |
| 30 to 34 Minutes | 188 | 12.1% |
| 35 to 39 Minutes | 0 | 0.0% |
| 40 to 44 Minutes | 67 | 4.3% |
| 45 to 59 Minutes | 46 | 3.0% |
| 60 to 89 Minutes | 26 | 1.7% |
| 90 or more Minutes | 94 | 6.1% |
Commute Time by Sex in Kayenta
The most common commute times in Kayenta are 5 to 9 minutes (135 commuters, 20.6%) for males and 15 to 19 minutes (258 commuters, 28.9%) for females.
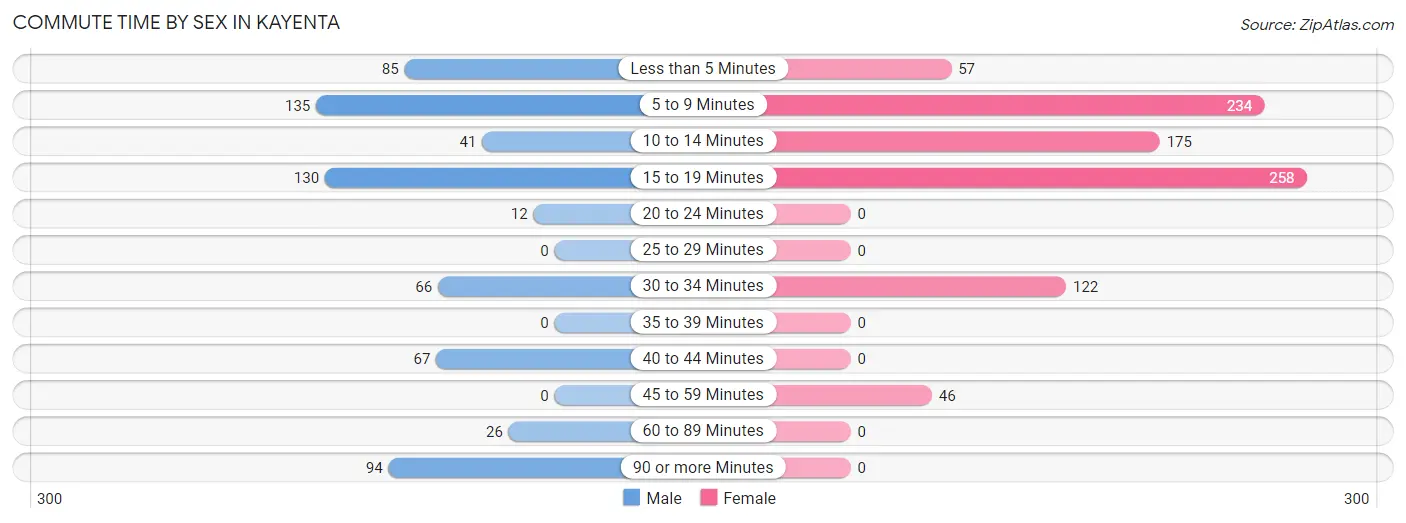
| Commute Time | Male | Female |
| Less than 5 Minutes | 85 (13.0%) | 57 (6.4%) |
| 5 to 9 Minutes | 135 (20.6%) | 234 (26.2%) |
| 10 to 14 Minutes | 41 (6.2%) | 175 (19.6%) |
| 15 to 19 Minutes | 130 (19.8%) | 258 (28.9%) |
| 20 to 24 Minutes | 12 (1.8%) | 0 (0.0%) |
| 25 to 29 Minutes | 0 (0.0%) | 0 (0.0%) |
| 30 to 34 Minutes | 66 (10.1%) | 122 (13.7%) |
| 35 to 39 Minutes | 0 (0.0%) | 0 (0.0%) |
| 40 to 44 Minutes | 67 (10.2%) | 0 (0.0%) |
| 45 to 59 Minutes | 0 (0.0%) | 46 (5.2%) |
| 60 to 89 Minutes | 26 (4.0%) | 0 (0.0%) |
| 90 or more Minutes | 94 (14.3%) | 0 (0.0%) |
Time of Departure to Work by Sex in Kayenta
The most frequent times of departure to work in Kayenta are 7:30 AM to 7:59 AM (253, 38.6%) for males and 7:30 AM to 7:59 AM (386, 43.3%) for females.
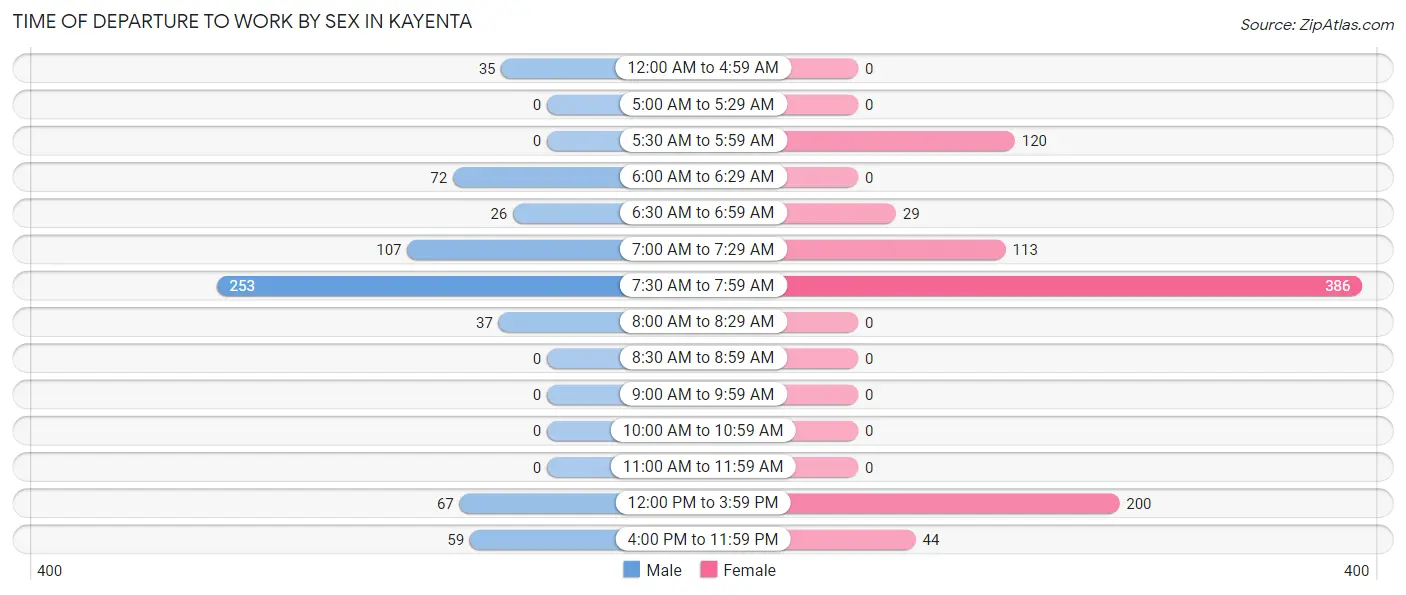
| Time of Departure | Male | Female |
| 12:00 AM to 4:59 AM | 35 (5.3%) | 0 (0.0%) |
| 5:00 AM to 5:29 AM | 0 (0.0%) | 0 (0.0%) |
| 5:30 AM to 5:59 AM | 0 (0.0%) | 120 (13.5%) |
| 6:00 AM to 6:29 AM | 72 (11.0%) | 0 (0.0%) |
| 6:30 AM to 6:59 AM | 26 (4.0%) | 29 (3.3%) |
| 7:00 AM to 7:29 AM | 107 (16.3%) | 113 (12.7%) |
| 7:30 AM to 7:59 AM | 253 (38.6%) | 386 (43.3%) |
| 8:00 AM to 8:29 AM | 37 (5.6%) | 0 (0.0%) |
| 8:30 AM to 8:59 AM | 0 (0.0%) | 0 (0.0%) |
| 9:00 AM to 9:59 AM | 0 (0.0%) | 0 (0.0%) |
| 10:00 AM to 10:59 AM | 0 (0.0%) | 0 (0.0%) |
| 11:00 AM to 11:59 AM | 0 (0.0%) | 0 (0.0%) |
| 12:00 PM to 3:59 PM | 67 (10.2%) | 200 (22.4%) |
| 4:00 PM to 11:59 PM | 59 (9.0%) | 44 (4.9%) |
| Total | 656 (100.0%) | 892 (100.0%) |
Housing Occupancy in Kayenta
Occupancy by Ownership in Kayenta
Of the total 1,527 dwellings in Kayenta, owner-occupied units account for 733 (48.0%), while renter-occupied units make up 794 (52.0%).
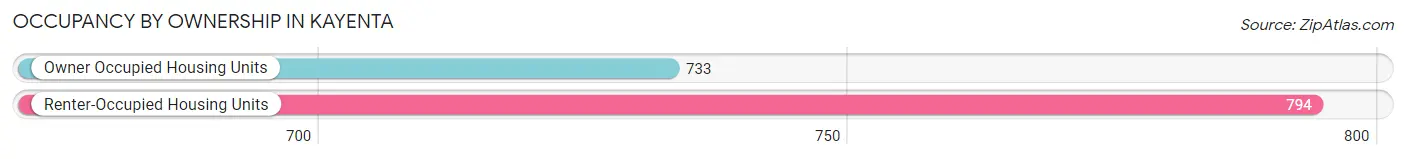
| Occupancy | # Housing Units | % Housing Units |
| Owner Occupied Housing Units | 733 | 48.0% |
| Renter-Occupied Housing Units | 794 | 52.0% |
| Total Occupied Housing Units | 1,527 | 100.0% |
Occupancy by Household Size in Kayenta
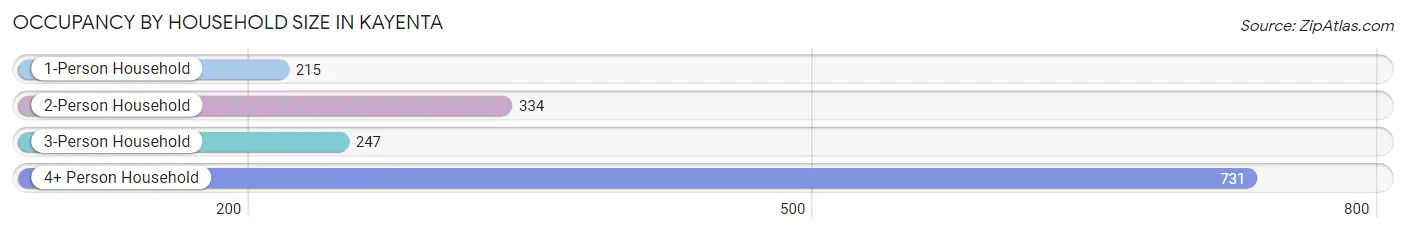
| Household Size | # Housing Units | % Housing Units |
| 1-Person Household | 215 | 14.1% |
| 2-Person Household | 334 | 21.9% |
| 3-Person Household | 247 | 16.2% |
| 4+ Person Household | 731 | 47.9% |
| Total Housing Units | 1,527 | 100.0% |
Occupancy by Ownership by Household Size in Kayenta
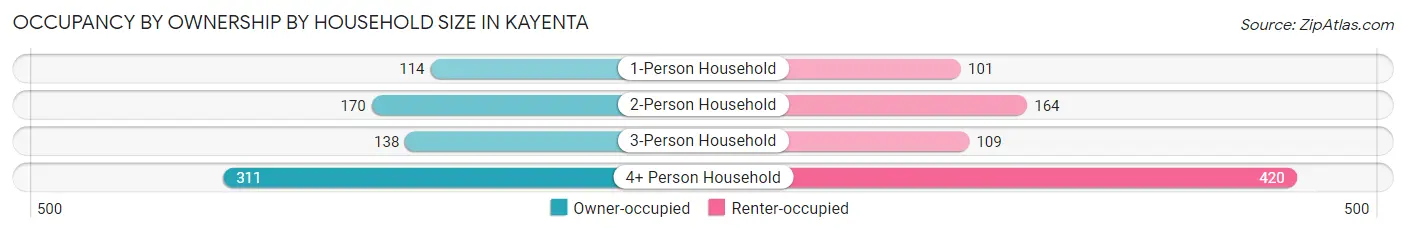
| Household Size | Owner-occupied | Renter-occupied |
| 1-Person Household | 114 (53.0%) | 101 (47.0%) |
| 2-Person Household | 170 (50.9%) | 164 (49.1%) |
| 3-Person Household | 138 (55.9%) | 109 (44.1%) |
| 4+ Person Household | 311 (42.5%) | 420 (57.5%) |
| Total Housing Units | 733 (48.0%) | 794 (52.0%) |
Occupancy by Educational Attainment in Kayenta
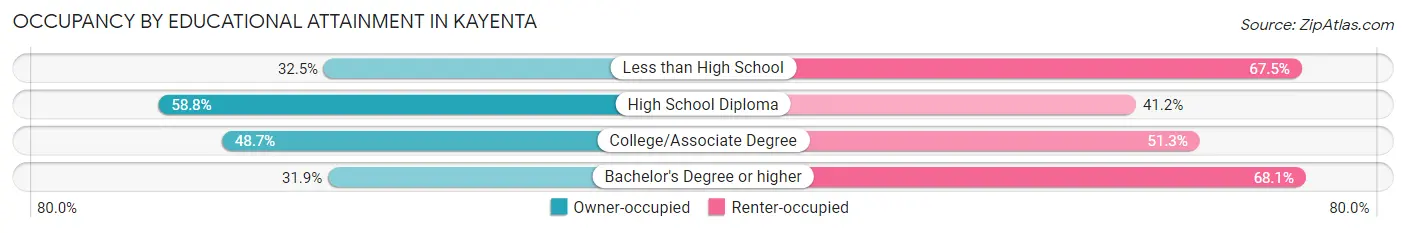
| Household Size | Owner-occupied | Renter-occupied |
| Less than High School | 53 (32.5%) | 110 (67.5%) |
| High School Diploma | 338 (58.8%) | 237 (41.2%) |
| College/Associate Degree | 262 (48.7%) | 276 (51.3%) |
| Bachelor's Degree or higher | 80 (31.9%) | 171 (68.1%) |
Occupancy by Age of Householder in Kayenta
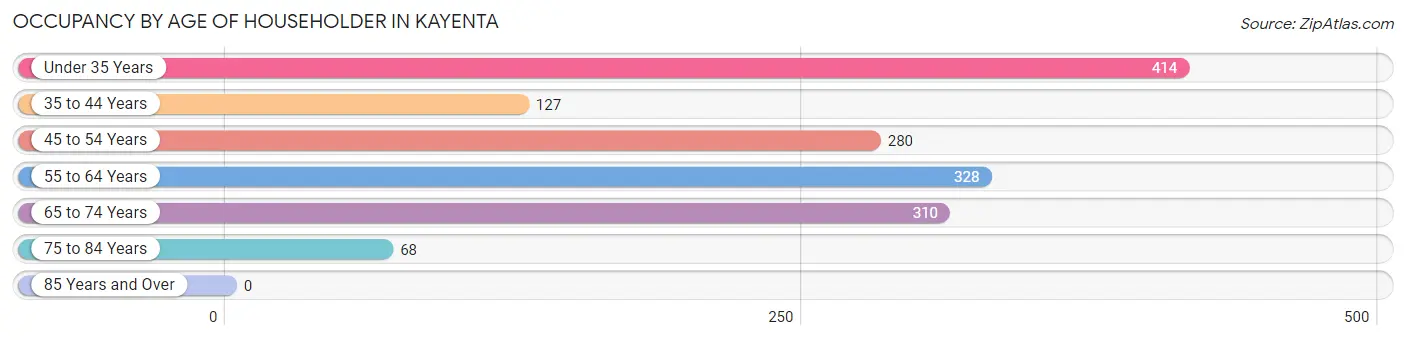
| Age Bracket | # Households | % Households |
| Under 35 Years | 414 | 27.1% |
| 35 to 44 Years | 127 | 8.3% |
| 45 to 54 Years | 280 | 18.3% |
| 55 to 64 Years | 328 | 21.5% |
| 65 to 74 Years | 310 | 20.3% |
| 75 to 84 Years | 68 | 4.4% |
| 85 Years and Over | 0 | 0.0% |
| Total | 1,527 | 100.0% |
Housing Finances in Kayenta
Median Income by Occupancy in Kayenta
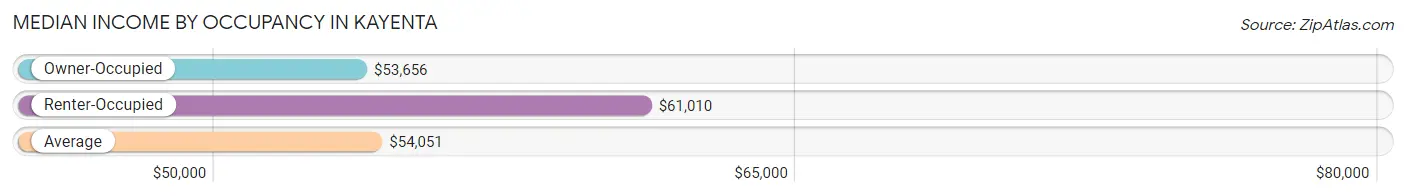
| Occupancy Type | # Households | Median Income |
| Owner-Occupied | 733 (48.0%) | $53,656 |
| Renter-Occupied | 794 (52.0%) | $61,010 |
| Average | 1,527 (100.0%) | $54,051 |
Occupancy by Householder Income Bracket in Kayenta
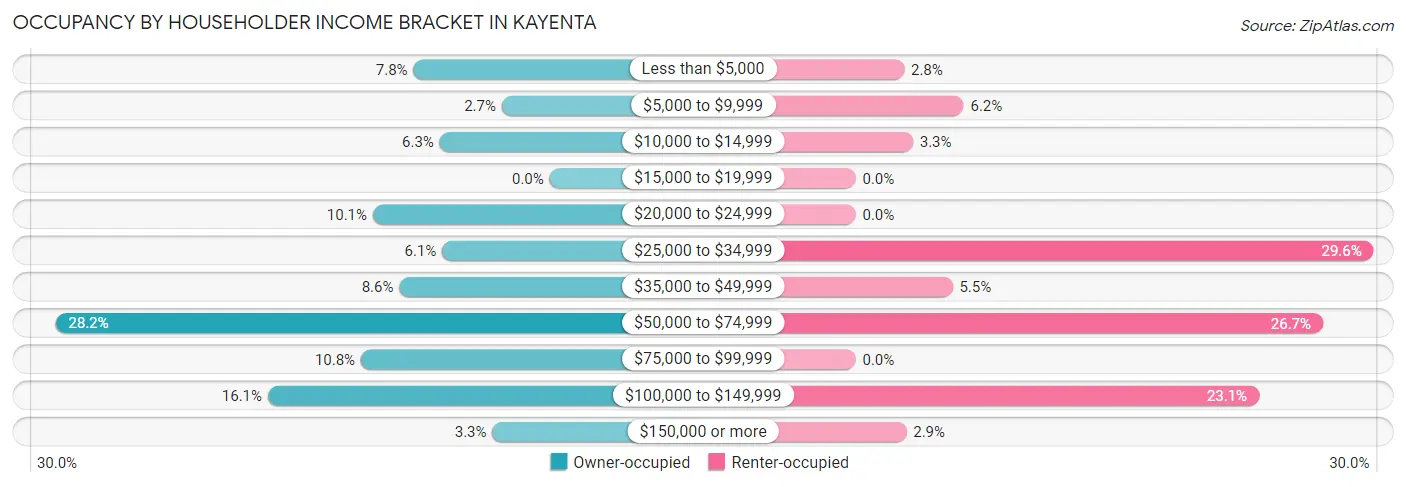
| Income Bracket | Owner-occupied | Renter-occupied |
| Less than $5,000 | 57 (7.8%) | 22 (2.8%) |
| $5,000 to $9,999 | 20 (2.7%) | 49 (6.2%) |
| $10,000 to $14,999 | 46 (6.3%) | 26 (3.3%) |
| $15,000 to $19,999 | 0 (0.0%) | 0 (0.0%) |
| $20,000 to $24,999 | 74 (10.1%) | 0 (0.0%) |
| $25,000 to $34,999 | 45 (6.1%) | 235 (29.6%) |
| $35,000 to $49,999 | 63 (8.6%) | 44 (5.5%) |
| $50,000 to $74,999 | 207 (28.2%) | 212 (26.7%) |
| $75,000 to $99,999 | 79 (10.8%) | 0 (0.0%) |
| $100,000 to $149,999 | 118 (16.1%) | 183 (23.1%) |
| $150,000 or more | 24 (3.3%) | 23 (2.9%) |
| Total | 733 (100.0%) | 794 (100.0%) |
Monthly Housing Cost Tiers in Kayenta
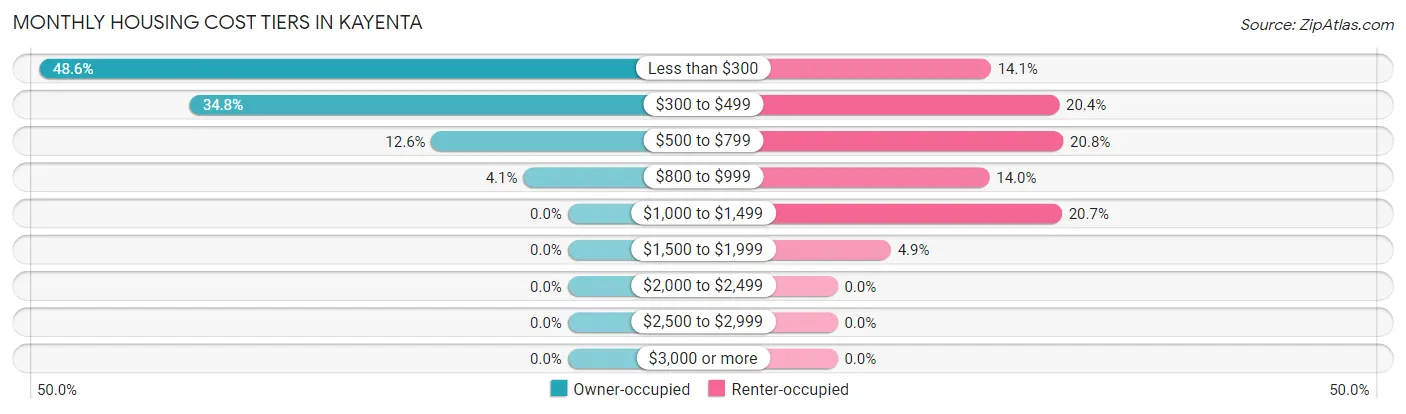
| Monthly Cost | Owner-occupied | Renter-occupied |
| Less than $300 | 356 (48.6%) | 112 (14.1%) |
| $300 to $499 | 255 (34.8%) | 162 (20.4%) |
| $500 to $799 | 92 (12.6%) | 165 (20.8%) |
| $800 to $999 | 30 (4.1%) | 111 (14.0%) |
| $1,000 to $1,499 | 0 (0.0%) | 164 (20.6%) |
| $1,500 to $1,999 | 0 (0.0%) | 39 (4.9%) |
| $2,000 to $2,499 | 0 (0.0%) | 0 (0.0%) |
| $2,500 to $2,999 | 0 (0.0%) | 0 (0.0%) |
| $3,000 or more | 0 (0.0%) | 0 (0.0%) |
| Total | 733 (100.0%) | 794 (100.0%) |
Physical Housing Characteristics in Kayenta
Housing Structures in Kayenta
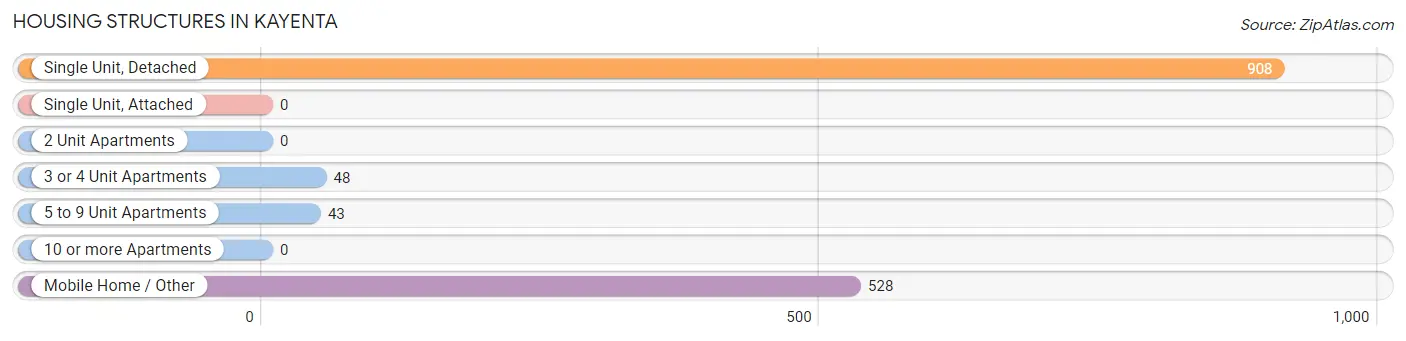
| Structure Type | # Housing Units | % Housing Units |
| Single Unit, Detached | 908 | 59.5% |
| Single Unit, Attached | 0 | 0.0% |
| 2 Unit Apartments | 0 | 0.0% |
| 3 or 4 Unit Apartments | 48 | 3.1% |
| 5 to 9 Unit Apartments | 43 | 2.8% |
| 10 or more Apartments | 0 | 0.0% |
| Mobile Home / Other | 528 | 34.6% |
| Total | 1,527 | 100.0% |
Housing Structures by Occupancy in Kayenta
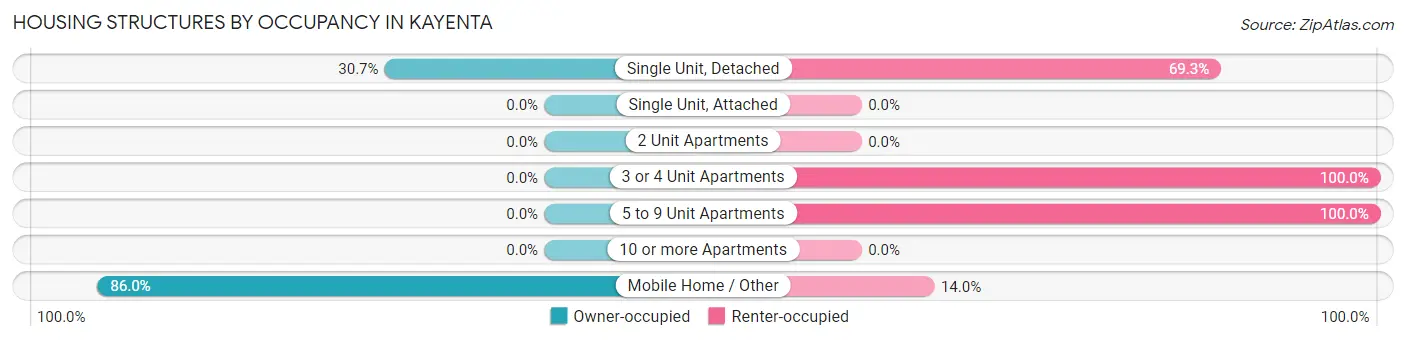
| Structure Type | Owner-occupied | Renter-occupied |
| Single Unit, Detached | 279 (30.7%) | 629 (69.3%) |
| Single Unit, Attached | 0 (0.0%) | 0 (0.0%) |
| 2 Unit Apartments | 0 (0.0%) | 0 (0.0%) |
| 3 or 4 Unit Apartments | 0 (0.0%) | 48 (100.0%) |
| 5 to 9 Unit Apartments | 0 (0.0%) | 43 (100.0%) |
| 10 or more Apartments | 0 (0.0%) | 0 (0.0%) |
| Mobile Home / Other | 454 (86.0%) | 74 (14.0%) |
| Total | 733 (48.0%) | 794 (52.0%) |
Housing Structures by Number of Rooms in Kayenta
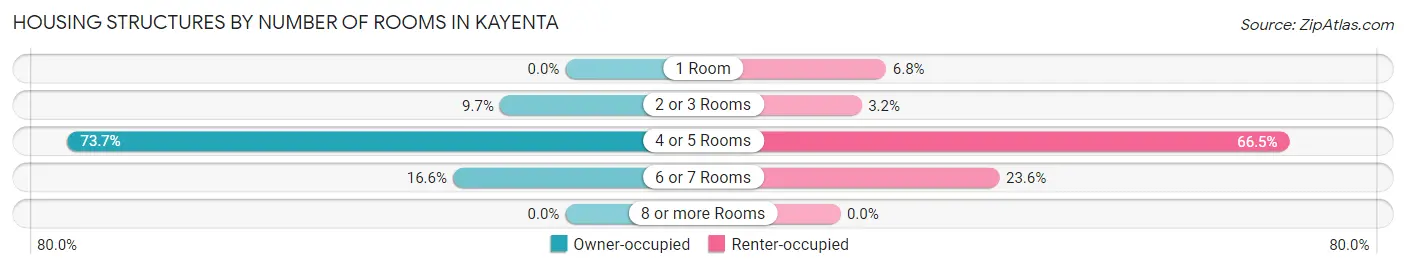
| Number of Rooms | Owner-occupied | Renter-occupied |
| 1 Room | 0 (0.0%) | 54 (6.8%) |
| 2 or 3 Rooms | 71 (9.7%) | 25 (3.2%) |
| 4 or 5 Rooms | 540 (73.7%) | 528 (66.5%) |
| 6 or 7 Rooms | 122 (16.6%) | 187 (23.5%) |
| 8 or more Rooms | 0 (0.0%) | 0 (0.0%) |
| Total | 733 (100.0%) | 794 (100.0%) |
Housing Structure by Heating Type in Kayenta
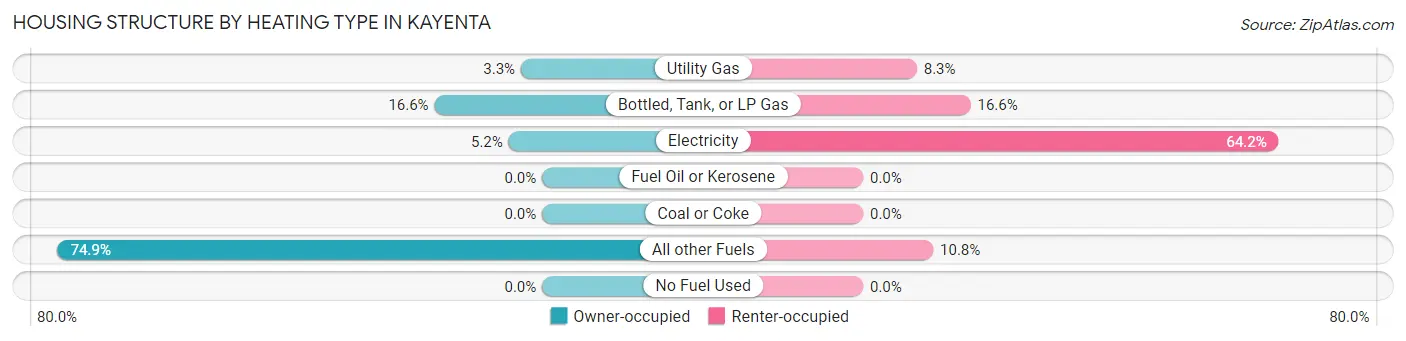
| Heating Type | Owner-occupied | Renter-occupied |
| Utility Gas | 24 (3.3%) | 66 (8.3%) |
| Bottled, Tank, or LP Gas | 122 (16.6%) | 132 (16.6%) |
| Electricity | 38 (5.2%) | 510 (64.2%) |
| Fuel Oil or Kerosene | 0 (0.0%) | 0 (0.0%) |
| Coal or Coke | 0 (0.0%) | 0 (0.0%) |
| All other Fuels | 549 (74.9%) | 86 (10.8%) |
| No Fuel Used | 0 (0.0%) | 0 (0.0%) |
| Total | 733 (100.0%) | 794 (100.0%) |
Household Vehicle Usage in Kayenta
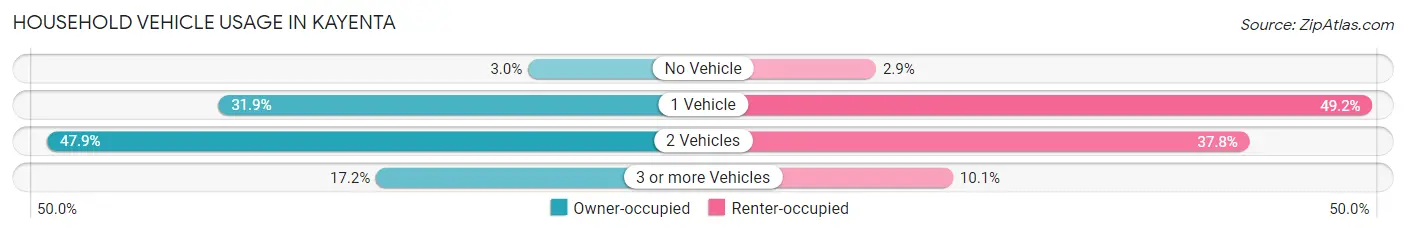
| Vehicles per Household | Owner-occupied | Renter-occupied |
| No Vehicle | 22 (3.0%) | 23 (2.9%) |
| 1 Vehicle | 234 (31.9%) | 391 (49.2%) |
| 2 Vehicles | 351 (47.9%) | 300 (37.8%) |
| 3 or more Vehicles | 126 (17.2%) | 80 (10.1%) |
| Total | 733 (100.0%) | 794 (100.0%) |
Real Estate & Mortgages in Kayenta
Real Estate and Mortgage Overview in Kayenta
| Characteristic | Without Mortgage | With Mortgage |
| Housing Units | 703 | 30 |
| Median Property Value | $45,400 | $0 |
| Median Household Income | $53,374 | $0 |
| Monthly Housing Costs | $296 | $0 |
| Real Estate Taxes | - | - |
Property Value by Mortgage Status in Kayenta
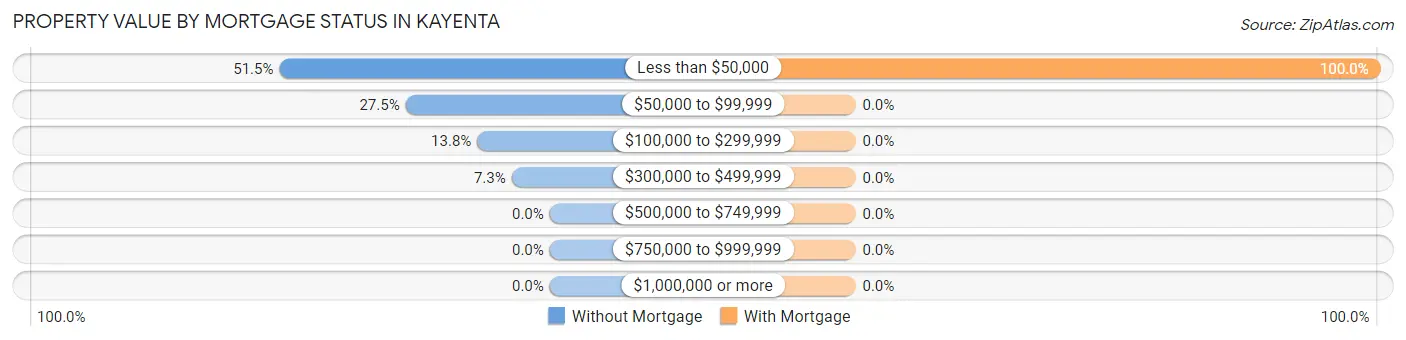
| Property Value | Without Mortgage | With Mortgage |
| Less than $50,000 | 362 (51.5%) | 30 (100.0%) |
| $50,000 to $99,999 | 193 (27.5%) | 0 (0.0%) |
| $100,000 to $299,999 | 97 (13.8%) | 0 (0.0%) |
| $300,000 to $499,999 | 51 (7.2%) | 0 (0.0%) |
| $500,000 to $749,999 | 0 (0.0%) | 0 (0.0%) |
| $750,000 to $999,999 | 0 (0.0%) | 0 (0.0%) |
| $1,000,000 or more | 0 (0.0%) | 0 (0.0%) |
| Total | 703 (100.0%) | 30 (100.0%) |
Household Income by Mortgage Status in Kayenta
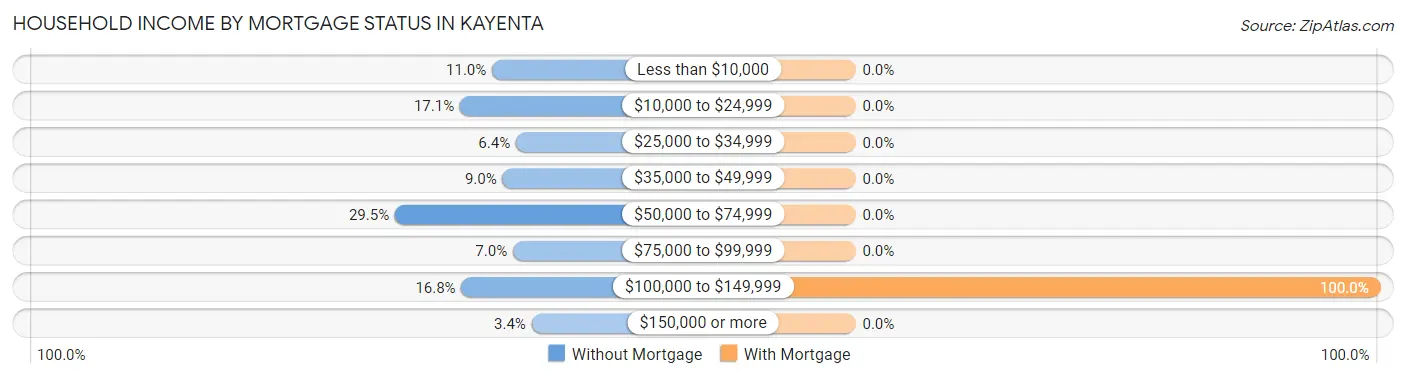
| Household Income | Without Mortgage | With Mortgage |
| Less than $10,000 | 77 (11.0%) | 0 (0.0%) |
| $10,000 to $24,999 | 120 (17.1%) | 0 (0.0%) |
| $25,000 to $34,999 | 45 (6.4%) | 0 (0.0%) |
| $35,000 to $49,999 | 63 (9.0%) | 0 (0.0%) |
| $50,000 to $74,999 | 207 (29.4%) | 0 (0.0%) |
| $75,000 to $99,999 | 49 (7.0%) | 0 (0.0%) |
| $100,000 to $149,999 | 118 (16.8%) | 30 (100.0%) |
| $150,000 or more | 24 (3.4%) | 0 (0.0%) |
| Total | 703 (100.0%) | 30 (100.0%) |
Property Value to Household Income Ratio in Kayenta
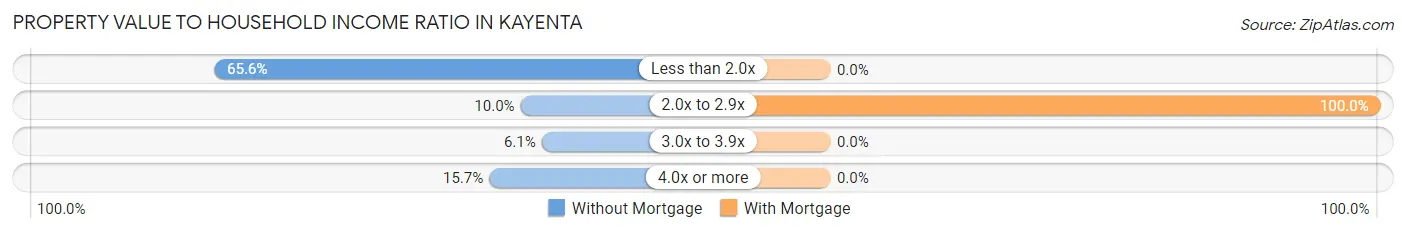
| Value-to-Income Ratio | Without Mortgage | With Mortgage |
| Less than 2.0x | 461 (65.6%) | 0 (0.0%) |
| 2.0x to 2.9x | 70 (10.0%) | 30 (100.0%) |
| 3.0x to 3.9x | 43 (6.1%) | 0 (0.0%) |
| 4.0x or more | 110 (15.7%) | 0 (0.0%) |
| Total | 703 (100.0%) | 30 (100.0%) |
Real Estate Taxes by Mortgage Status in Kayenta
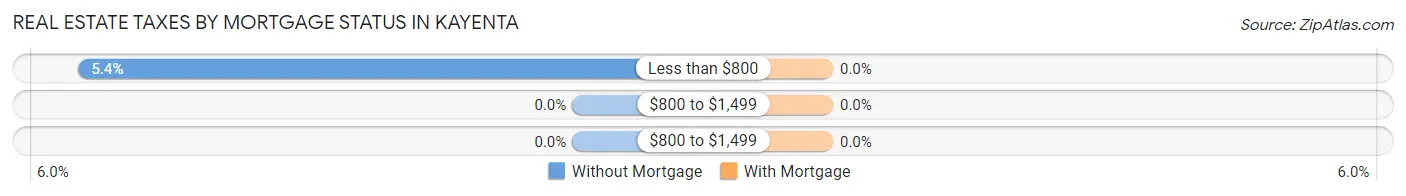
| Property Taxes | Without Mortgage | With Mortgage |
| Less than $800 | 38 (5.4%) | 0 (0.0%) |
| $800 to $1,499 | 0 (0.0%) | 0 (0.0%) |
| $800 to $1,499 | 0 (0.0%) | 0 (0.0%) |
| Total | 703 (100.0%) | 30 (100.0%) |
Health & Disability in Kayenta
Health Insurance Coverage by Age in Kayenta
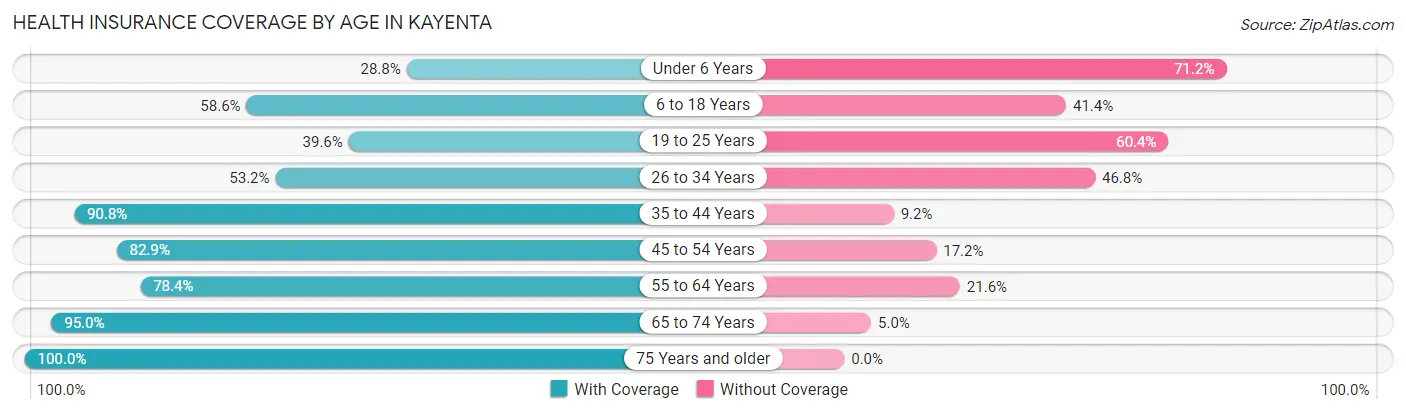
| Age Bracket | With Coverage | Without Coverage |
| Under 6 Years | 141 (28.8%) | 349 (71.2%) |
| 6 to 18 Years | 882 (58.6%) | 622 (41.4%) |
| 19 to 25 Years | 209 (39.6%) | 319 (60.4%) |
| 26 to 34 Years | 543 (53.2%) | 477 (46.8%) |
| 35 to 44 Years | 345 (90.8%) | 35 (9.2%) |
| 45 to 54 Years | 285 (82.9%) | 59 (17.2%) |
| 55 to 64 Years | 411 (78.4%) | 113 (21.6%) |
| 65 to 74 Years | 457 (95.0%) | 24 (5.0%) |
| 75 Years and older | 68 (100.0%) | 0 (0.0%) |
| Total | 3,341 (62.6%) | 1,998 (37.4%) |
Health Insurance Coverage by Citizenship Status in Kayenta
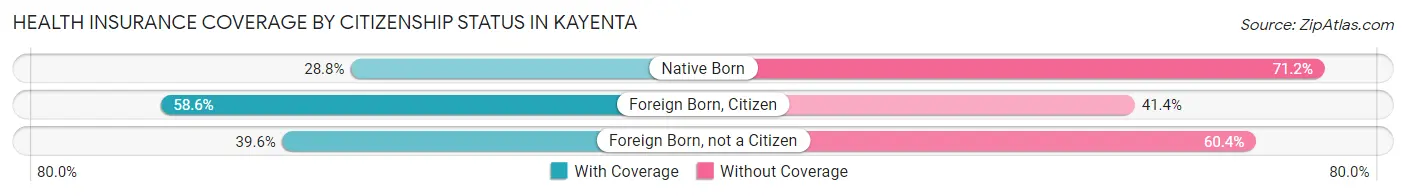
| Citizenship Status | With Coverage | Without Coverage |
| Native Born | 141 (28.8%) | 349 (71.2%) |
| Foreign Born, Citizen | 882 (58.6%) | 622 (41.4%) |
| Foreign Born, not a Citizen | 209 (39.6%) | 319 (60.4%) |
Health Insurance Coverage by Household Income in Kayenta
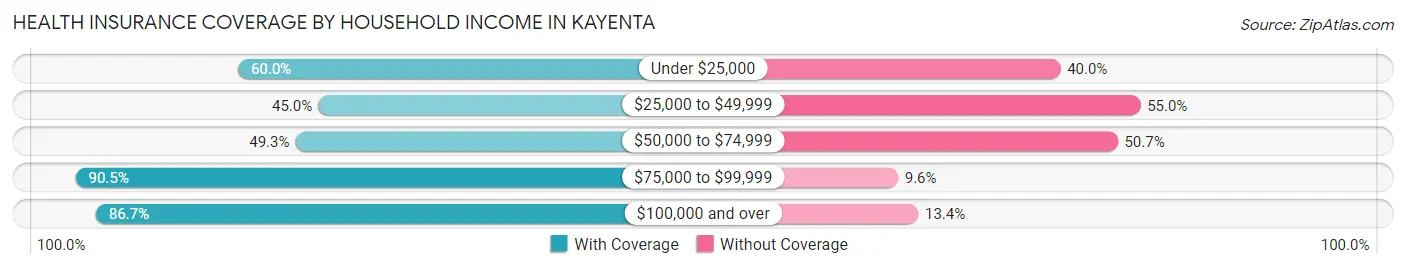
| Household Income | With Coverage | Without Coverage |
| Under $25,000 | 542 (60.0%) | 361 (40.0%) |
| $25,000 to $49,999 | 485 (45.0%) | 592 (55.0%) |
| $50,000 to $74,999 | 801 (49.3%) | 824 (50.7%) |
| $75,000 to $99,999 | 284 (90.4%) | 30 (9.6%) |
| $100,000 and over | 1,181 (86.7%) | 182 (13.4%) |
Public vs Private Health Insurance Coverage by Age in Kayenta
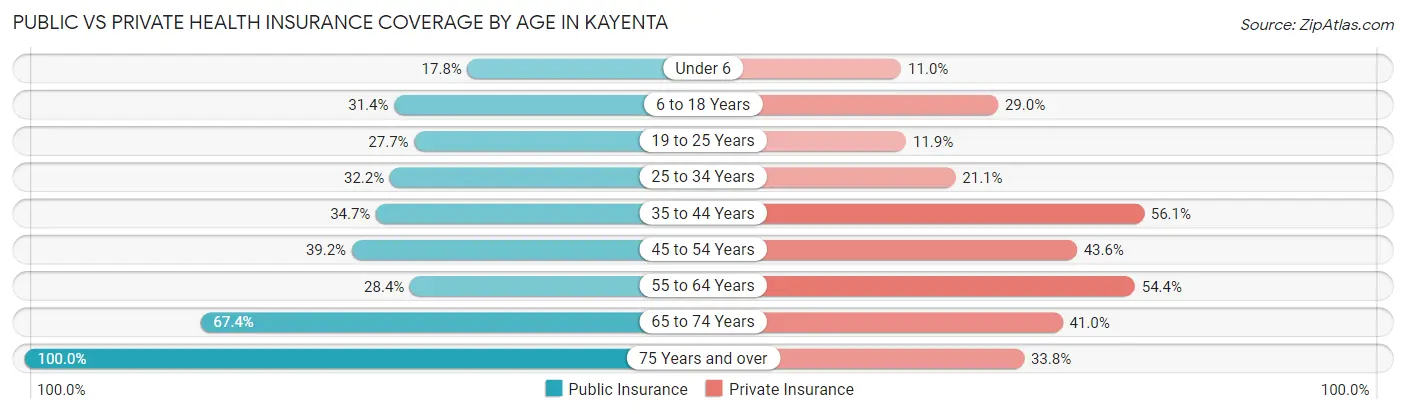
| Age Bracket | Public Insurance | Private Insurance |
| Under 6 | 87 (17.8%) | 54 (11.0%) |
| 6 to 18 Years | 472 (31.4%) | 436 (29.0%) |
| 19 to 25 Years | 146 (27.7%) | 63 (11.9%) |
| 25 to 34 Years | 328 (32.2%) | 215 (21.1%) |
| 35 to 44 Years | 132 (34.7%) | 213 (56.0%) |
| 45 to 54 Years | 135 (39.2%) | 150 (43.6%) |
| 55 to 64 Years | 149 (28.4%) | 285 (54.4%) |
| 65 to 74 Years | 324 (67.4%) | 197 (41.0%) |
| 75 Years and over | 68 (100.0%) | 23 (33.8%) |
| Total | 1,841 (34.5%) | 1,636 (30.6%) |
Disability Status by Sex by Age in Kayenta
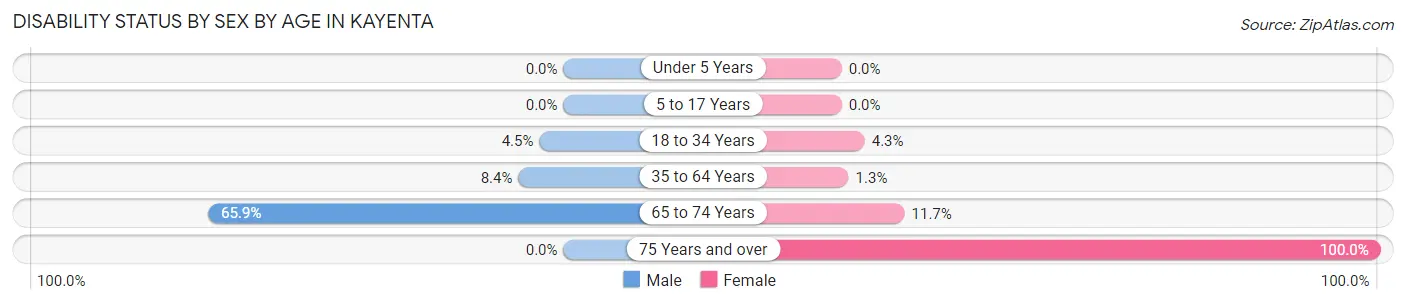
| Age Bracket | Male | Female |
| Under 5 Years | 0 (0.0%) | 0 (0.0%) |
| 5 to 17 Years | 0 (0.0%) | 0 (0.0%) |
| 18 to 34 Years | 38 (4.5%) | 37 (4.3%) |
| 35 to 64 Years | 45 (8.4%) | 9 (1.3%) |
| 65 to 74 Years | 91 (65.9%) | 40 (11.7%) |
| 75 Years and over | 0 (0.0%) | 68 (100.0%) |
Disability Class by Sex by Age in Kayenta
Disability Class: Hearing Difficulty
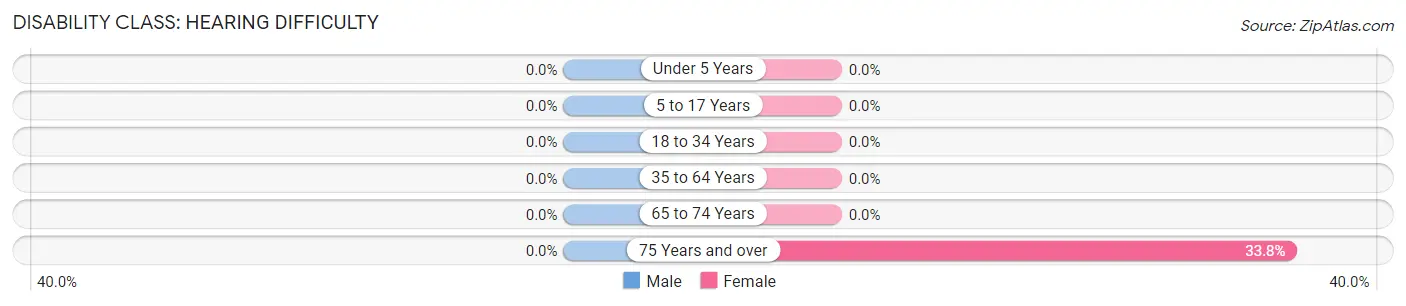
| Age Bracket | Male | Female |
| Under 5 Years | 0 (0.0%) | 0 (0.0%) |
| 5 to 17 Years | 0 (0.0%) | 0 (0.0%) |
| 18 to 34 Years | 0 (0.0%) | 0 (0.0%) |
| 35 to 64 Years | 0 (0.0%) | 0 (0.0%) |
| 65 to 74 Years | 0 (0.0%) | 0 (0.0%) |
| 75 Years and over | 0 (0.0%) | 23 (33.8%) |
Disability Class: Vision Difficulty
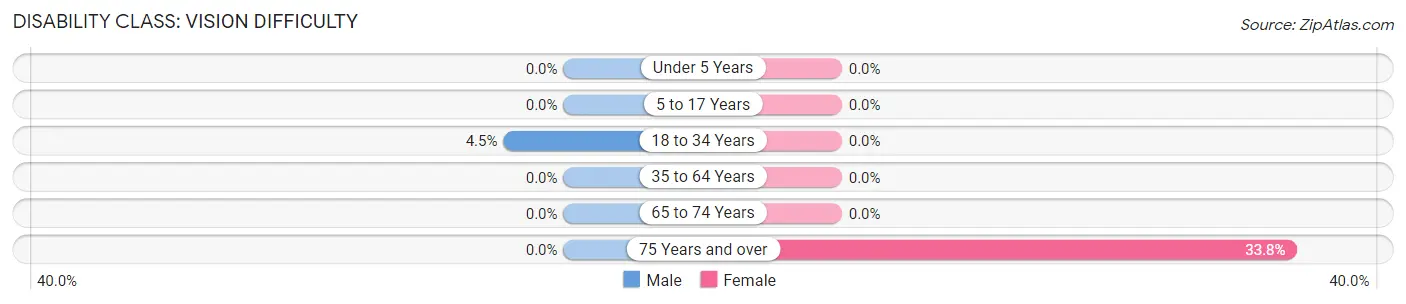
| Age Bracket | Male | Female |
| Under 5 Years | 0 (0.0%) | 0 (0.0%) |
| 5 to 17 Years | 0 (0.0%) | 0 (0.0%) |
| 18 to 34 Years | 38 (4.5%) | 0 (0.0%) |
| 35 to 64 Years | 0 (0.0%) | 0 (0.0%) |
| 65 to 74 Years | 0 (0.0%) | 0 (0.0%) |
| 75 Years and over | 0 (0.0%) | 23 (33.8%) |
Disability Class: Cognitive Difficulty
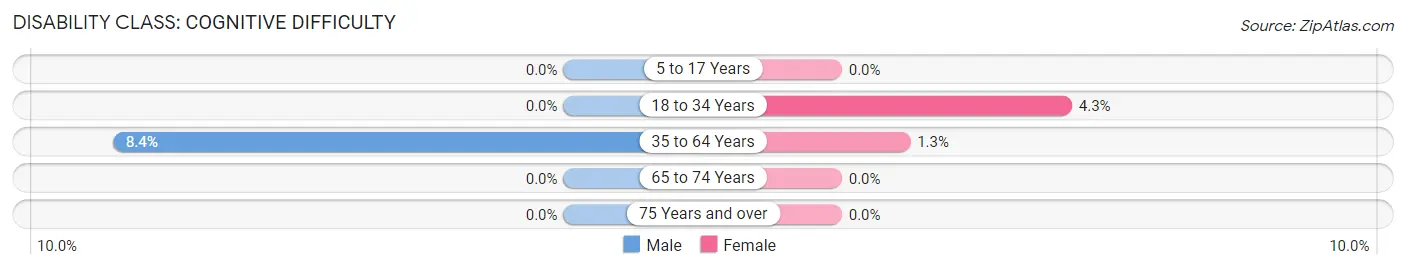
| Age Bracket | Male | Female |
| 5 to 17 Years | 0 (0.0%) | 0 (0.0%) |
| 18 to 34 Years | 0 (0.0%) | 37 (4.3%) |
| 35 to 64 Years | 45 (8.4%) | 9 (1.3%) |
| 65 to 74 Years | 0 (0.0%) | 0 (0.0%) |
| 75 Years and over | 0 (0.0%) | 0 (0.0%) |
Disability Class: Ambulatory Difficulty
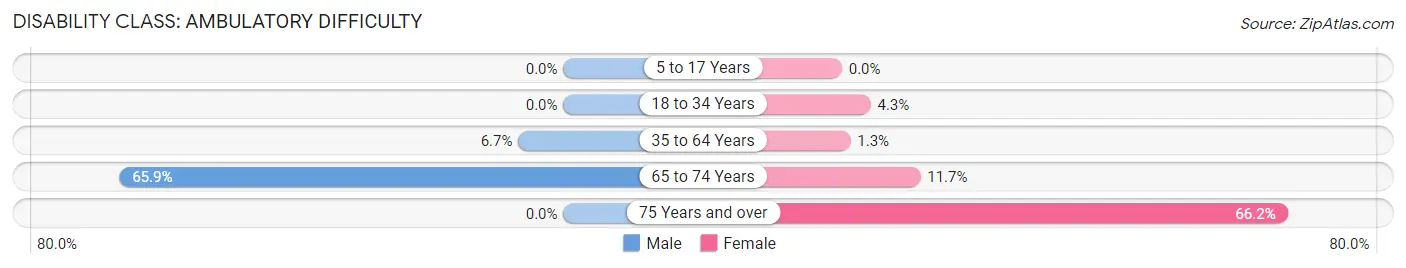
| Age Bracket | Male | Female |
| 5 to 17 Years | 0 (0.0%) | 0 (0.0%) |
| 18 to 34 Years | 0 (0.0%) | 37 (4.3%) |
| 35 to 64 Years | 36 (6.7%) | 9 (1.3%) |
| 65 to 74 Years | 91 (65.9%) | 40 (11.7%) |
| 75 Years and over | 0 (0.0%) | 45 (66.2%) |
Disability Class: Self-Care Difficulty
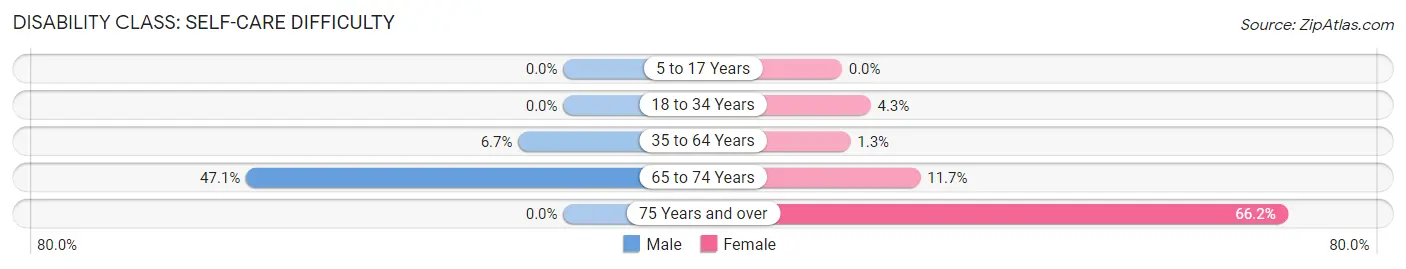
| Age Bracket | Male | Female |
| 5 to 17 Years | 0 (0.0%) | 0 (0.0%) |
| 18 to 34 Years | 0 (0.0%) | 37 (4.3%) |
| 35 to 64 Years | 36 (6.7%) | 9 (1.3%) |
| 65 to 74 Years | 65 (47.1%) | 40 (11.7%) |
| 75 Years and over | 0 (0.0%) | 45 (66.2%) |
Technology Access in Kayenta
Computing Device Access in Kayenta
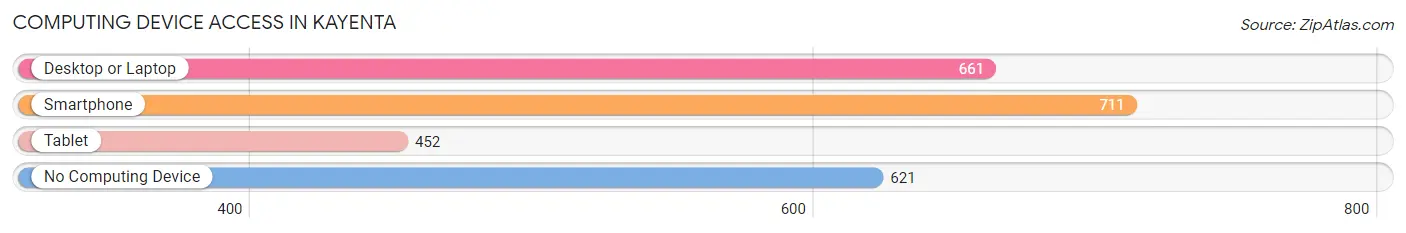
| Device Type | # Households | % Households |
| Desktop or Laptop | 661 | 43.3% |
| Smartphone | 711 | 46.6% |
| Tablet | 452 | 29.6% |
| No Computing Device | 621 | 40.7% |
| Total | 1,527 | 100.0% |
Internet Access in Kayenta
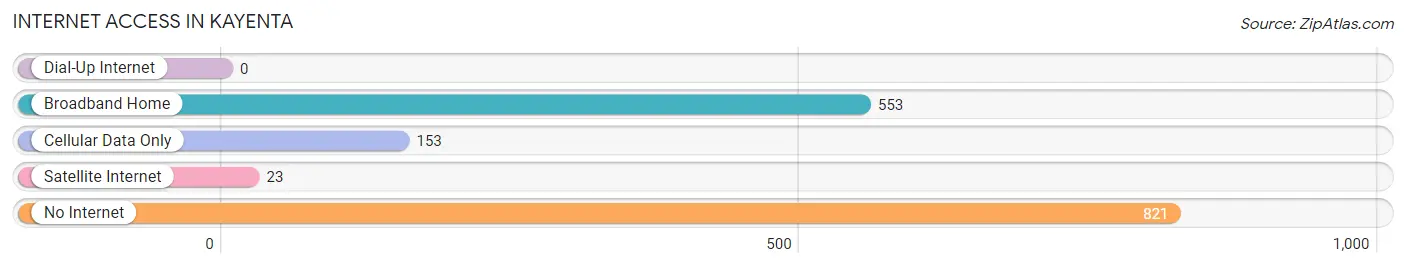
| Internet Type | # Households | % Households |
| Dial-Up Internet | 0 | 0.0% |
| Broadband Home | 553 | 36.2% |
| Cellular Data Only | 153 | 10.0% |
| Satellite Internet | 23 | 1.5% |
| No Internet | 821 | 53.8% |
| Total | 1,527 | 100.0% |
Kayenta Summary
Kayenta is a small town located in the Navajo Nation in northeastern Arizona. It is situated in the heart of the Navajo Nation, which is the largest Native American reservation in the United States. The town is located in the heart of the Navajo Nation, which is the largest Native American reservation in the United States. The town is located in the heart of the Navajo Nation, which is the largest Native American reservation in the United States.
History
Kayenta was founded in the late 1800s by the Navajo people. The town was originally known as “Tse’ah Haltsooi” which means “the place of the red willows” in the Navajo language. The town was established as a trading post and was used as a stopover for travelers and traders. The town was also used as a base for the US Army during the Navajo Wars in the late 1800s.
In the early 1900s, the town began to grow and develop. The first school was built in the town in 1912 and the first post office was established in 1915. The town was incorporated in 1921 and the first mayor was elected in 1922.
In the 1950s, the town began to experience a population boom due to the discovery of oil and gas in the area. The town was also the site of the first uranium mine in the United States. The uranium mine was opened in 1954 and was operated by the United Nuclear Corporation.
Geography
Kayenta is located in the northeastern corner of Arizona, in the heart of the Navajo Nation. The town is situated in the middle of the Navajo Nation, which is the largest Native American reservation in the United States. The town is located in the heart of the Navajo Nation, which is the largest Native American reservation in the United States.
The town is located in the middle of the Navajo Nation, which is the largest Native American reservation in the United States. The town is located in the middle of the Navajo Nation, which is the largest Native American reservation in the United States. The town is located in the middle of the Navajo Nation, which is the largest Native American reservation in the United States.
The town is located in the middle of the Navajo Nation, which is the largest Native American reservation in the United States. The town is located in the middle of the Navajo Nation, which is the largest Native American reservation in the United States. The town is located in the middle of the Navajo Nation, which is the largest Native American reservation in the United States.
The town is located in the middle of the Navajo Nation, which is the largest Native American reservation in the United States. The town is located in the middle of the Navajo Nation, which is the largest Native American reservation in the United States. The town is located in the middle of the Navajo Nation, which is the largest Native American reservation in the United States.
The town is located in the middle of the Navajo Nation, which is the largest Native American reservation in the United States. The town is located in the middle of the Navajo Nation, which is the largest Native American reservation in the United States. The town is located in the middle of the Navajo Nation, which is the largest Native American reservation in the United States.
Economy
The economy of Kayenta is largely based on tourism, agriculture, and mining. The town is home to a number of tourist attractions, including Monument Valley, which is a popular destination for visitors from around the world. The town is also home to a number of agricultural operations, including cattle ranches and farms.
The town is also home to a number of mining operations, including the United Nuclear Corporation’s uranium mine. The mine was opened in 1954 and is still in operation today. The mine is the largest uranium mine in the United States.
Demographics
As of the 2010 census, the population of Kayenta was 5,189. The town is predominantly Native American, with the majority of the population being Navajo. The town also has a small Hispanic population, as well as a small population of other ethnicities. The median household income in the town is $30,000, which is lower than the national average. The town has a poverty rate of 28.3%, which is higher than the national average.
Common Questions
What is Per Capita Income in Kayenta?
Per Capita income in Kayenta is $18,643.
What is the Median Family Income in Kayenta?
Median Family Income in Kayenta is $57,734.
What is the Median Household income in Kayenta?
Median Household Income in Kayenta is $54,051.
What is Income or Wage Gap in Kayenta?
Income or Wage Gap in Kayenta is 32.5%.
Women in Kayenta earn 67.5 cents for every dollar earned by a man.
What is Inequality or Gini Index in Kayenta?
Inequality or Gini Index in Kayenta is 0.43.
What is the Total Population of Kayenta?
Total Population of Kayenta is 5,366.
What is the Total Male Population of Kayenta?
Total Male Population of Kayenta is 2,388.
What is the Total Female Population of Kayenta?
Total Female Population of Kayenta is 2,978.
What is the Ratio of Males per 100 Females in Kayenta?
There are 80.19 Males per 100 Females in Kayenta.
What is the Ratio of Females per 100 Males in Kayenta?
There are 124.71 Females per 100 Males in Kayenta.
What is the Median Population Age in Kayenta?
Median Population Age in Kayenta is 27.6 Years.
What is the Average Family Size in Kayenta
Average Family Size in Kayenta is 3.7 People.
What is the Average Household Size in Kayenta
Average Household Size in Kayenta is 3.5 People.
How Large is the Labor Force in Kayenta?
There are 1,759 People in the Labor Forcein in Kayenta.
What is the Percentage of People in the Labor Force in Kayenta?
47.4% of People are in the Labor Force in Kayenta.
What is the Unemployment Rate in Kayenta?
Unemployment Rate in Kayenta is 7.3%.