Goodyear Village, AZ Map & Demographics
Goodyear Village Map
Goodyear Village Overview
$20,267
PER CAPITA INCOME
$125,278
AVG FAMILY INCOME
11.9%
WAGE / INCOME GAP [ % ]
88.1¢/ $1
WAGE / INCOME GAP [ $ ]
0.56
INEQUALITY / GINI INDEX
332
TOTAL POPULATION
164
MALE POPULATION
168
FEMALE POPULATION
97.62
MALES / 100 FEMALES
102.44
FEMALES / 100 MALES
36.9
MEDIAN AGE
5.0
AVG FAMILY SIZE
3.4
AVG HOUSEHOLD SIZE
162
LABOR FORCE [ PEOPLE ]
57.4%
PERCENT IN LABOR FORCE
17.9%
UNEMPLOYMENT RATE
Income in Goodyear Village
Income Overview in Goodyear Village
| Characteristic | Number | Measure |
| Per Capita Income | 332 | $20,267 |
| Median Family Income | 58 | $125,278 |
| Mean Family Income | 58 | $90,971 |
| Median Household Income | 99 | $0 |
| Mean Household Income | 99 | $54,726 |
| Income Deficit | 58 | $0 |
| Wage / Income Gap (%) | 332 | 11.89% |
| Wage / Income Gap ($) | 332 | 88.11¢ per $1 |
| Gini / Inequality Index | 332 | 0.56 |
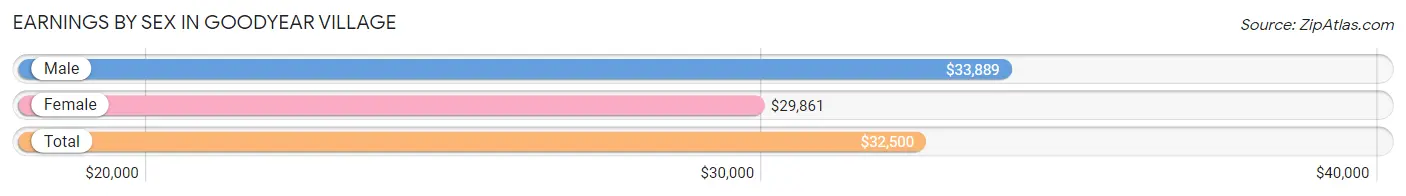
Earnings by Sex in Goodyear Village
Average Earnings in Goodyear Village are $32,500, $33,889 for men and $29,861 for women, a difference of 11.9%.
| Sex | Number | Average Earnings |
| Male | 48 (33.8%) | $33,889 |
| Female | 94 (66.2%) | $29,861 |
| Total | 142 (100.0%) | $32,500 |
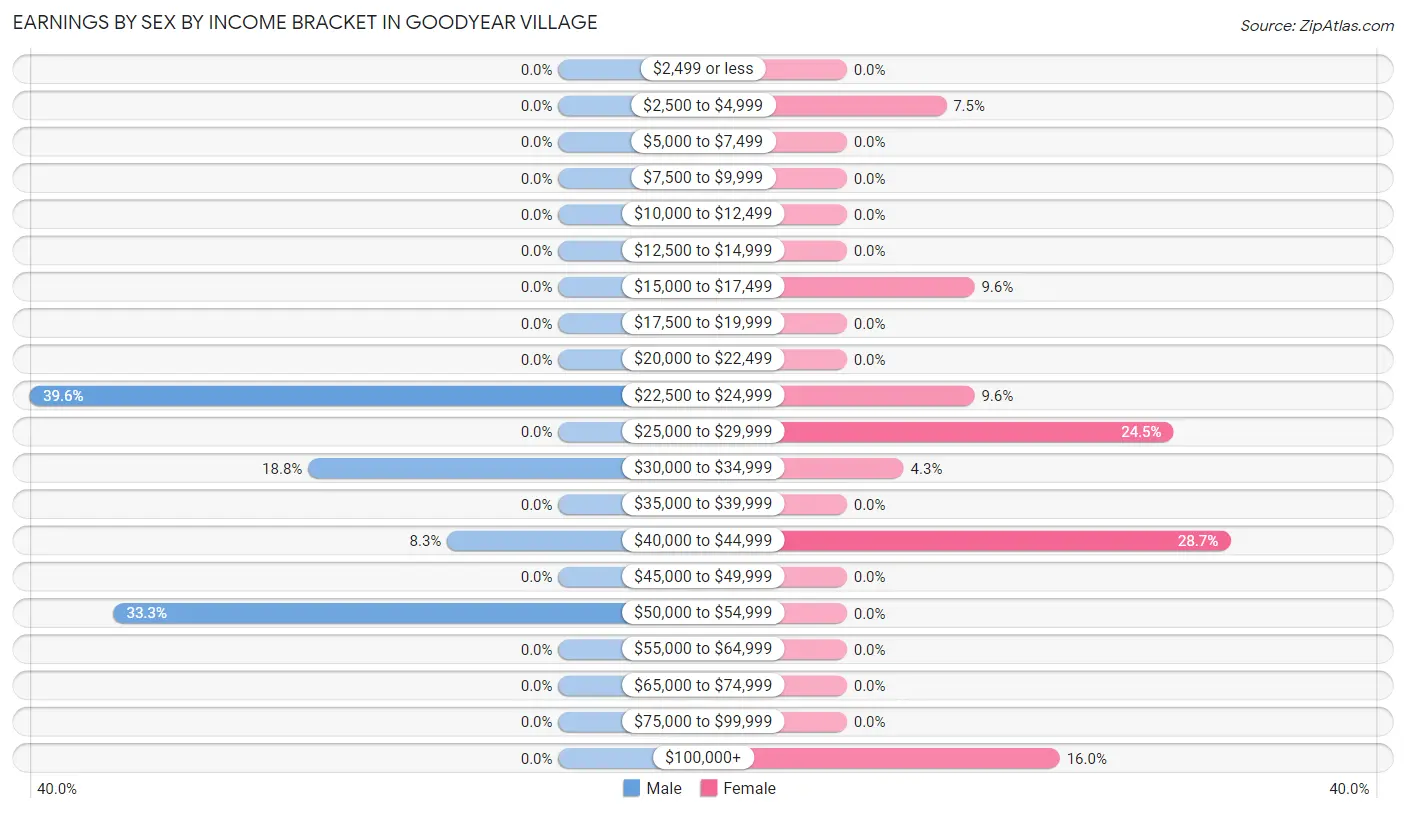
Earnings by Sex by Income Bracket in Goodyear Village
The most common earnings brackets in Goodyear Village are $22,500 to $24,999 for men (19 | 39.6%) and $40,000 to $44,999 for women (27 | 28.7%).
| Income | Male | Female |
| $2,499 or less | 0 (0.0%) | 0 (0.0%) |
| $2,500 to $4,999 | 0 (0.0%) | 7 (7.4%) |
| $5,000 to $7,499 | 0 (0.0%) | 0 (0.0%) |
| $7,500 to $9,999 | 0 (0.0%) | 0 (0.0%) |
| $10,000 to $12,499 | 0 (0.0%) | 0 (0.0%) |
| $12,500 to $14,999 | 0 (0.0%) | 0 (0.0%) |
| $15,000 to $17,499 | 0 (0.0%) | 9 (9.6%) |
| $17,500 to $19,999 | 0 (0.0%) | 0 (0.0%) |
| $20,000 to $22,499 | 0 (0.0%) | 0 (0.0%) |
| $22,500 to $24,999 | 19 (39.6%) | 9 (9.6%) |
| $25,000 to $29,999 | 0 (0.0%) | 23 (24.5%) |
| $30,000 to $34,999 | 9 (18.8%) | 4 (4.3%) |
| $35,000 to $39,999 | 0 (0.0%) | 0 (0.0%) |
| $40,000 to $44,999 | 4 (8.3%) | 27 (28.7%) |
| $45,000 to $49,999 | 0 (0.0%) | 0 (0.0%) |
| $50,000 to $54,999 | 16 (33.3%) | 0 (0.0%) |
| $55,000 to $64,999 | 0 (0.0%) | 0 (0.0%) |
| $65,000 to $74,999 | 0 (0.0%) | 0 (0.0%) |
| $75,000 to $99,999 | 0 (0.0%) | 0 (0.0%) |
| $100,000+ | 0 (0.0%) | 15 (16.0%) |
| Total | 48 (100.0%) | 94 (100.0%) |
Earnings by Sex by Educational Attainment in Goodyear Village
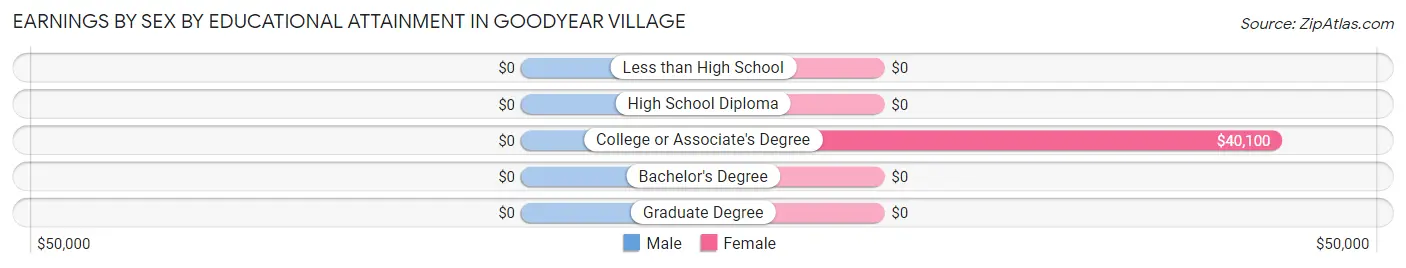
| Educational Attainment | Male Income | Female Income |
| Less than High School | - | - |
| High School Diploma | - | - |
| College or Associate's Degree | - | - |
| Bachelor's Degree | - | - |
| Graduate Degree | - | - |
| Total | $33,889 | $29,861 |
Family Income in Goodyear Village
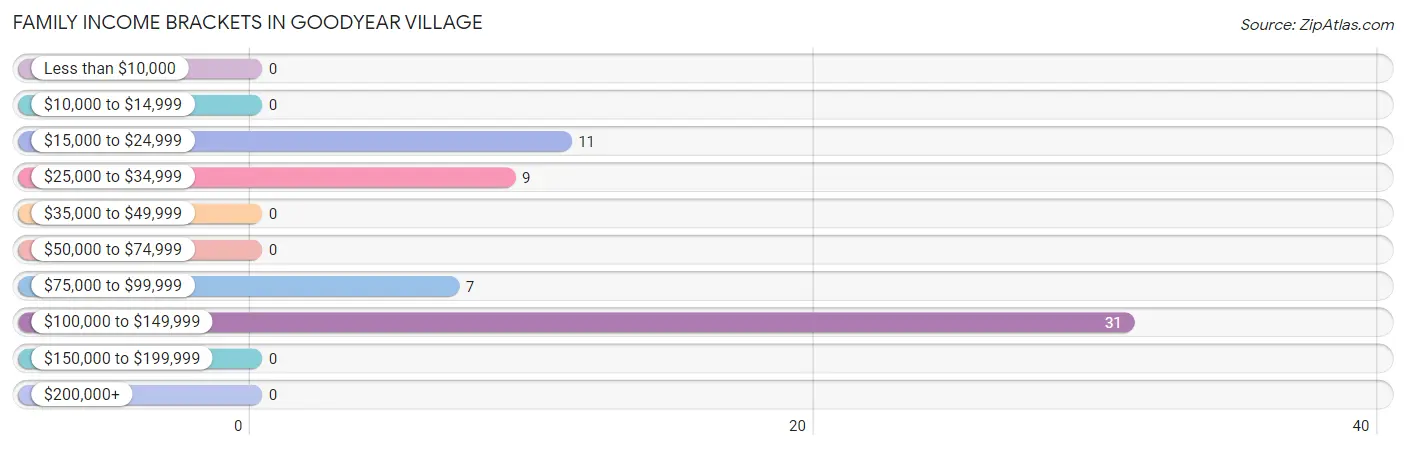
Family Income Brackets in Goodyear Village
According to the Goodyear Village family income data, there are 31 families falling into the $100,000 to $149,999 income range, which is the most common income bracket and makes up 53.4% of all families.
| Income Bracket | # Families | % Families |
| Less than $10,000 | 0 | 0.0% |
| $10,000 to $14,999 | 0 | 0.0% |
| $15,000 to $24,999 | 11 | 19.0% |
| $25,000 to $34,999 | 9 | 15.5% |
| $35,000 to $49,999 | 0 | 0.0% |
| $50,000 to $74,999 | 0 | 0.0% |
| $75,000 to $99,999 | 7 | 12.1% |
| $100,000 to $149,999 | 31 | 53.4% |
| $150,000 to $199,999 | 0 | 0.0% |
| $200,000+ | 0 | 0.0% |
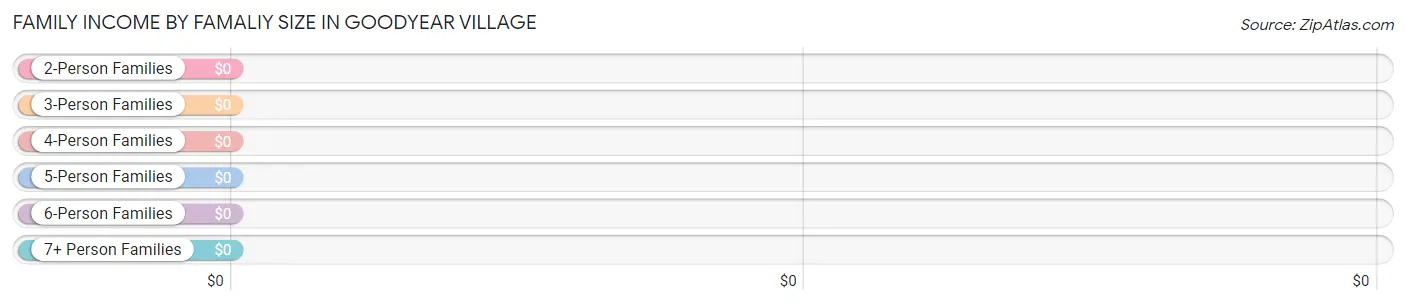
Family Income by Famaliy Size in Goodyear Village
| Income Bracket | # Families | Median Income |
| 2-Person Families | 9 (15.5%) | $0 |
| 3-Person Families | 29 (50.0%) | $0 |
| 4-Person Families | 9 (15.5%) | $0 |
| 5-Person Families | 0 (0.0%) | $0 |
| 6-Person Families | 11 (19.0%) | $0 |
| 7+ Person Families | 0 (0.0%) | $0 |
| Total | 58 (100.0%) | $125,278 |
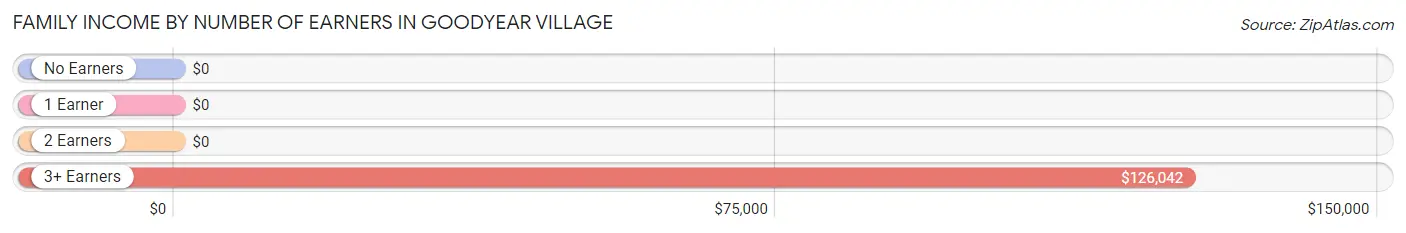
Family Income by Number of Earners in Goodyear Village
| Number of Earners | # Families | Median Income |
| No Earners | 11 (19.0%) | $0 |
| 1 Earner | 9 (15.5%) | $0 |
| 2 Earners | 9 (15.5%) | $0 |
| 3+ Earners | 29 (50.0%) | $126,042 |
| Total | 58 (100.0%) | $125,278 |
Household Income in Goodyear Village
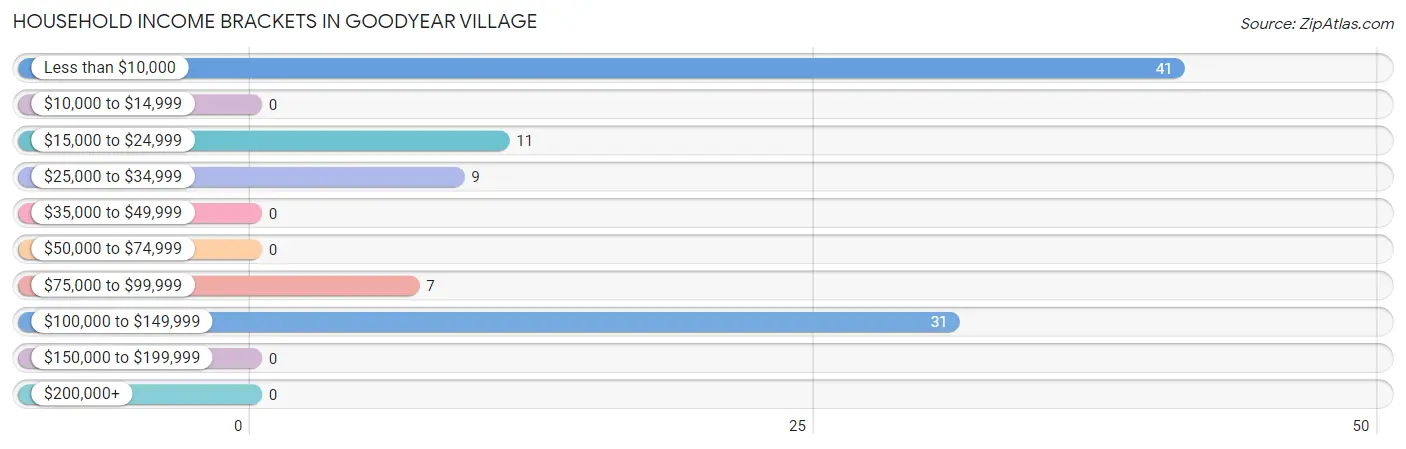
Household Income Brackets in Goodyear Village
With 41 households falling in the category, the less than $10,000 income range is the most frequent in Goodyear Village, accounting for 41.4% of all households.
| Income Bracket | # Households | % Households |
| Less than $10,000 | 41 | 41.4% |
| $10,000 to $14,999 | 0 | 0.0% |
| $15,000 to $24,999 | 11 | 11.1% |
| $25,000 to $34,999 | 9 | 9.1% |
| $35,000 to $49,999 | 0 | 0.0% |
| $50,000 to $74,999 | 0 | 0.0% |
| $75,000 to $99,999 | 7 | 7.1% |
| $100,000 to $149,999 | 31 | 31.3% |
| $150,000 to $199,999 | 0 | 0.0% |
| $200,000+ | 0 | 0.0% |
Household Income by Householder Age in Goodyear Village
| Income Bracket | # Households | Median Income |
| 15 to 24 Years | 0 (0.0%) | $0 |
| 25 to 44 Years | 18 (18.2%) | $0 |
| 45 to 64 Years | 73 (73.7%) | $0 |
| 65+ Years | 8 (8.1%) | $0 |
| Total | 99 (100.0%) | $0 |
Poverty in Goodyear Village
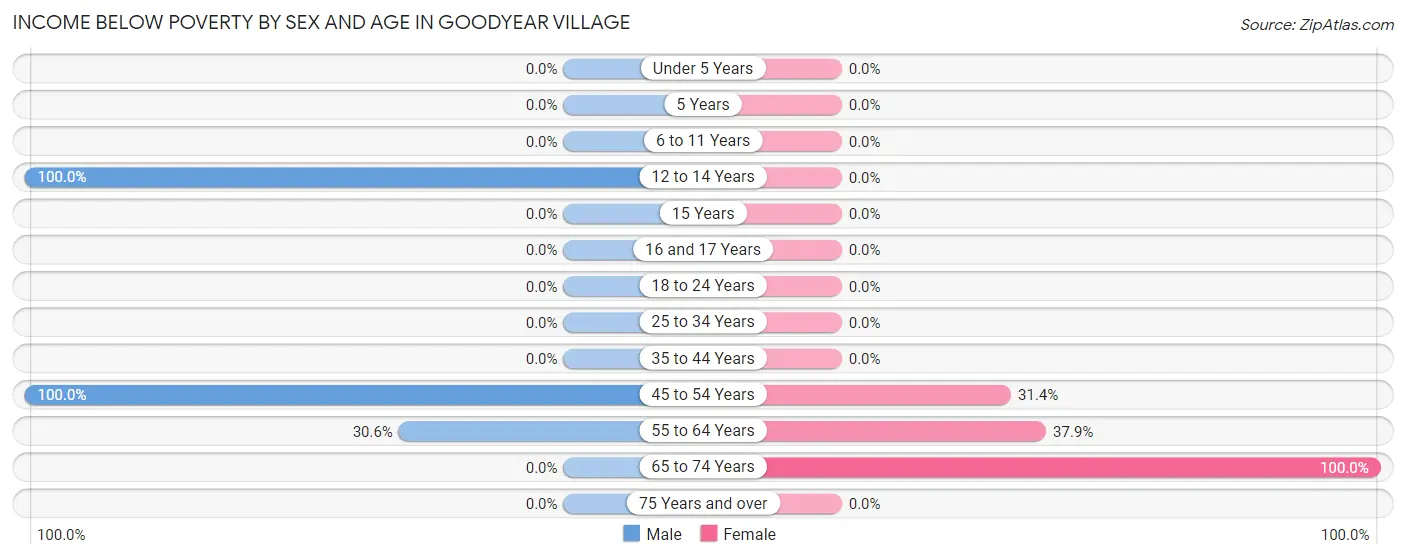
Income Below Poverty by Sex and Age in Goodyear Village
With 29.9% poverty level for males and 24.4% for females among the residents of Goodyear Village, 12 to 14 year old males and 65 to 74 year old females are the most vulnerable to poverty, with 18 males (100.0%) and 8 females (100.0%) in their respective age groups living below the poverty level.
| Age Bracket | Male | Female |
| Under 5 Years | 0 (0.0%) | 0 (0.0%) |
| 5 Years | 0 (0.0%) | 0 (0.0%) |
| 6 to 11 Years | 0 (0.0%) | 0 (0.0%) |
| 12 to 14 Years | 18 (100.0%) | 0 (0.0%) |
| 15 Years | 0 (0.0%) | 0 (0.0%) |
| 16 and 17 Years | 0 (0.0%) | 0 (0.0%) |
| 18 to 24 Years | 0 (0.0%) | 0 (0.0%) |
| 25 to 34 Years | 0 (0.0%) | 0 (0.0%) |
| 35 to 44 Years | 0 (0.0%) | 0 (0.0%) |
| 45 to 54 Years | 20 (100.0%) | 11 (31.4%) |
| 55 to 64 Years | 11 (30.6%) | 22 (37.9%) |
| 65 to 74 Years | 0 (0.0%) | 8 (100.0%) |
| 75 Years and over | 0 (0.0%) | 0 (0.0%) |
| Total | 49 (29.9%) | 41 (24.4%) |
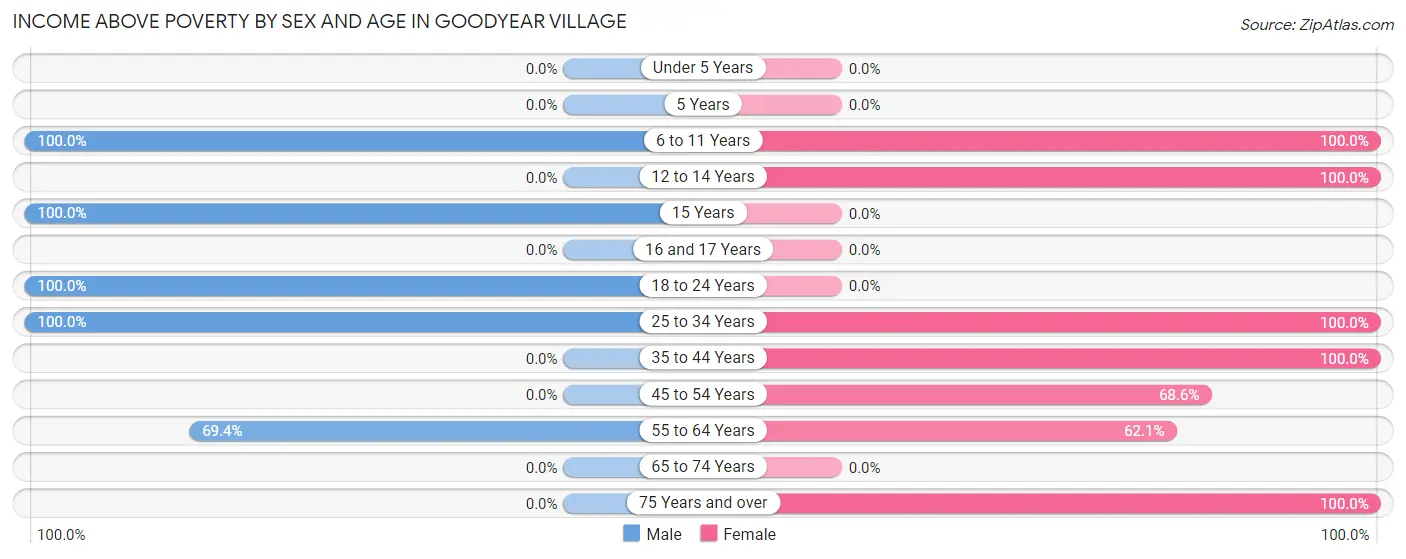
Income Above Poverty by Sex and Age in Goodyear Village
According to the poverty statistics in Goodyear Village, males aged 6 to 11 years and females aged 6 to 11 years are the age groups that are most secure financially, with 100.0% of males and 100.0% of females in these age groups living above the poverty line.
| Age Bracket | Male | Female |
| Under 5 Years | 0 (0.0%) | 0 (0.0%) |
| 5 Years | 0 (0.0%) | 0 (0.0%) |
| 6 to 11 Years | 7 (100.0%) | 8 (100.0%) |
| 12 to 14 Years | 0 (0.0%) | 15 (100.0%) |
| 15 Years | 2 (100.0%) | 0 (0.0%) |
| 16 and 17 Years | 0 (0.0%) | 0 (0.0%) |
| 18 to 24 Years | 58 (100.0%) | 0 (0.0%) |
| 25 to 34 Years | 23 (100.0%) | 18 (100.0%) |
| 35 to 44 Years | 0 (0.0%) | 18 (100.0%) |
| 45 to 54 Years | 0 (0.0%) | 24 (68.6%) |
| 55 to 64 Years | 25 (69.4%) | 36 (62.1%) |
| 65 to 74 Years | 0 (0.0%) | 0 (0.0%) |
| 75 Years and over | 0 (0.0%) | 8 (100.0%) |
| Total | 115 (70.1%) | 127 (75.6%) |
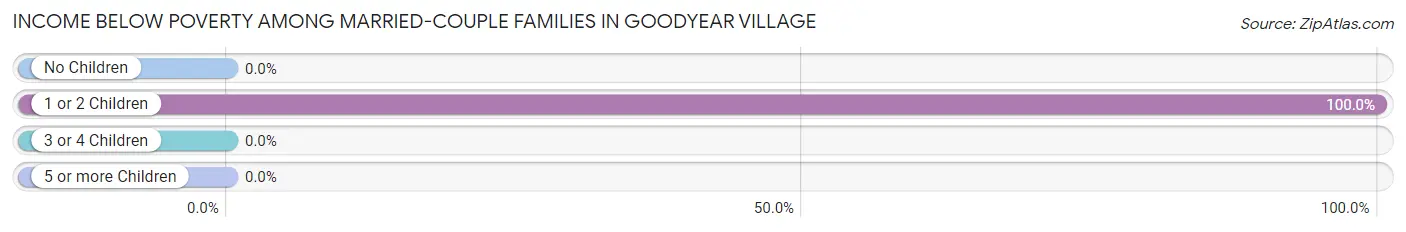
Income Below Poverty Among Married-Couple Families in Goodyear Village
The poverty statistics for married-couple families in Goodyear Village show that 55.0% or 11 of the total 20 families live below the poverty line. Families with 1 or 2 children have the highest poverty rate of 100.0%, comprising of 11 families. On the other hand, families with no children have the lowest poverty rate of 0.0%, which includes 0 families.
| Children | Above Poverty | Below Poverty |
| No Children | 9 (100.0%) | 0 (0.0%) |
| 1 or 2 Children | 0 (0.0%) | 11 (100.0%) |
| 3 or 4 Children | 0 (0.0%) | 0 (0.0%) |
| 5 or more Children | 0 (0.0%) | 0 (0.0%) |
| Total | 9 (45.0%) | 11 (55.0%) |
Income Below Poverty Among Single-Parent Households in Goodyear Village
| Children | Single Father | Single Mother |
| No Children | 0 (0.0%) | 0 (0.0%) |
| 1 or 2 Children | 0 (0.0%) | 0 (0.0%) |
| 3 or 4 Children | 0 (0.0%) | 0 (0.0%) |
| 5 or more Children | 0 (0.0%) | 0 (0.0%) |
| Total | 0 (0.0%) | 0 (0.0%) |
Income Below Poverty Among Married-Couple vs Single-Parent Households in Goodyear Village
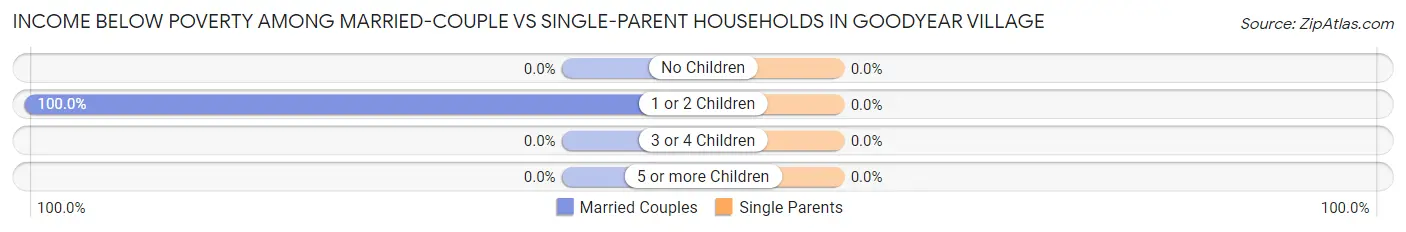
| Children | Married-Couple Families | Single-Parent Households |
| No Children | 0 (0.0%) | 0 (0.0%) |
| 1 or 2 Children | 11 (100.0%) | 0 (0.0%) |
| 3 or 4 Children | 0 (0.0%) | 0 (0.0%) |
| 5 or more Children | 0 (0.0%) | 0 (0.0%) |
| Total | 11 (55.0%) | 0 (0.0%) |
Race in Goodyear Village
The most populous races in Goodyear Village are Native / Alaskan (294 | 88.5%), Hispanic or Latino (53 | 16.0%), and Some other Race (20 | 6.0%).
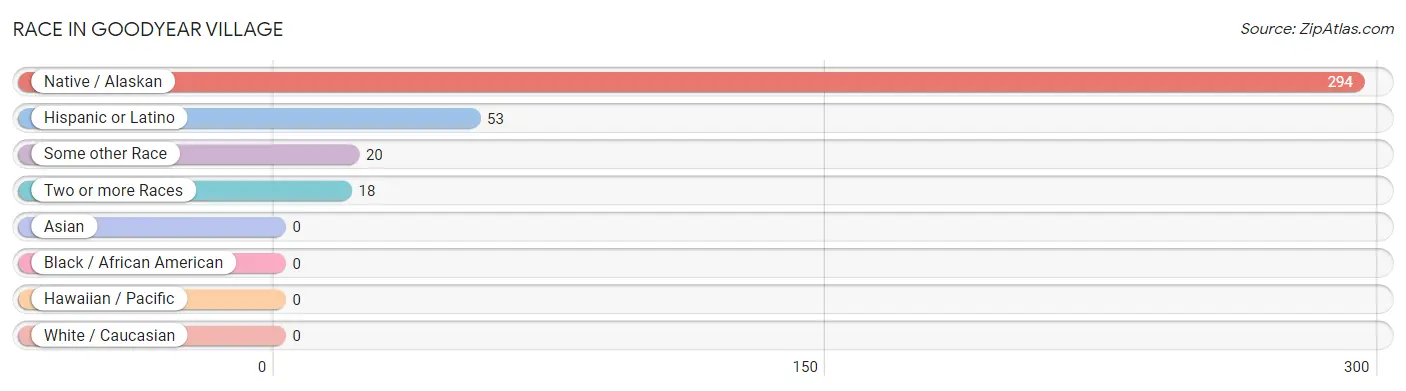
| Race | # Population | % Population |
| Asian | 0 | 0.0% |
| Black / African American | 0 | 0.0% |
| Hawaiian / Pacific | 0 | 0.0% |
| Hispanic or Latino | 53 | 16.0% |
| Native / Alaskan | 294 | 88.5% |
| White / Caucasian | 0 | 0.0% |
| Two or more Races | 18 | 5.4% |
| Some other Race | 20 | 6.0% |
| Total | 332 | 100.0% |
Ancestry in Goodyear Village
The most populous ancestries reported in Goodyear Village are Pima (229 | 69.0%), Navajo (83 | 25.0%), Mexican (53 | 16.0%), and German (11 | 3.3%), together accounting for 113.2% of all Goodyear Village residents.
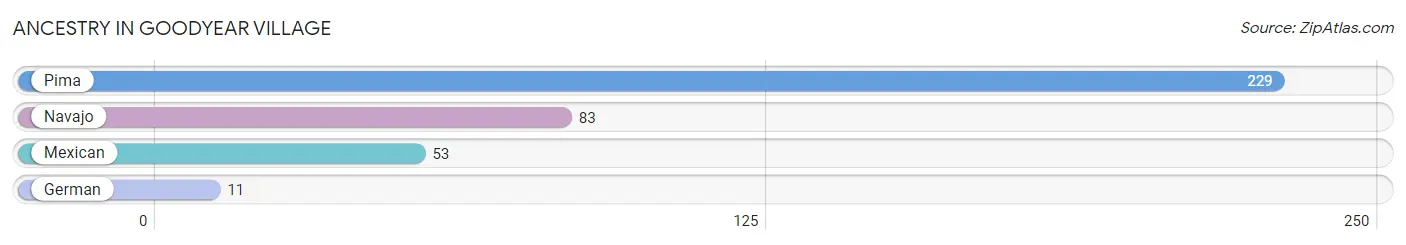
| Ancestry | # Population | % Population |
| German | 11 | 3.3% |
| Mexican | 53 | 16.0% |
| Navajo | 83 | 25.0% |
| Pima | 229 | 69.0% | View All 4 Rows |
Immigrants in Goodyear Village

| Immigration Origin | # Population | % Population | View All 0 Rows |
Sex and Age in Goodyear Village
Sex and Age in Goodyear Village
The most populous age groups in Goodyear Village are 20 to 24 Years (58 | 35.4%) for men and 55 to 59 Years (58 | 34.5%) for women.
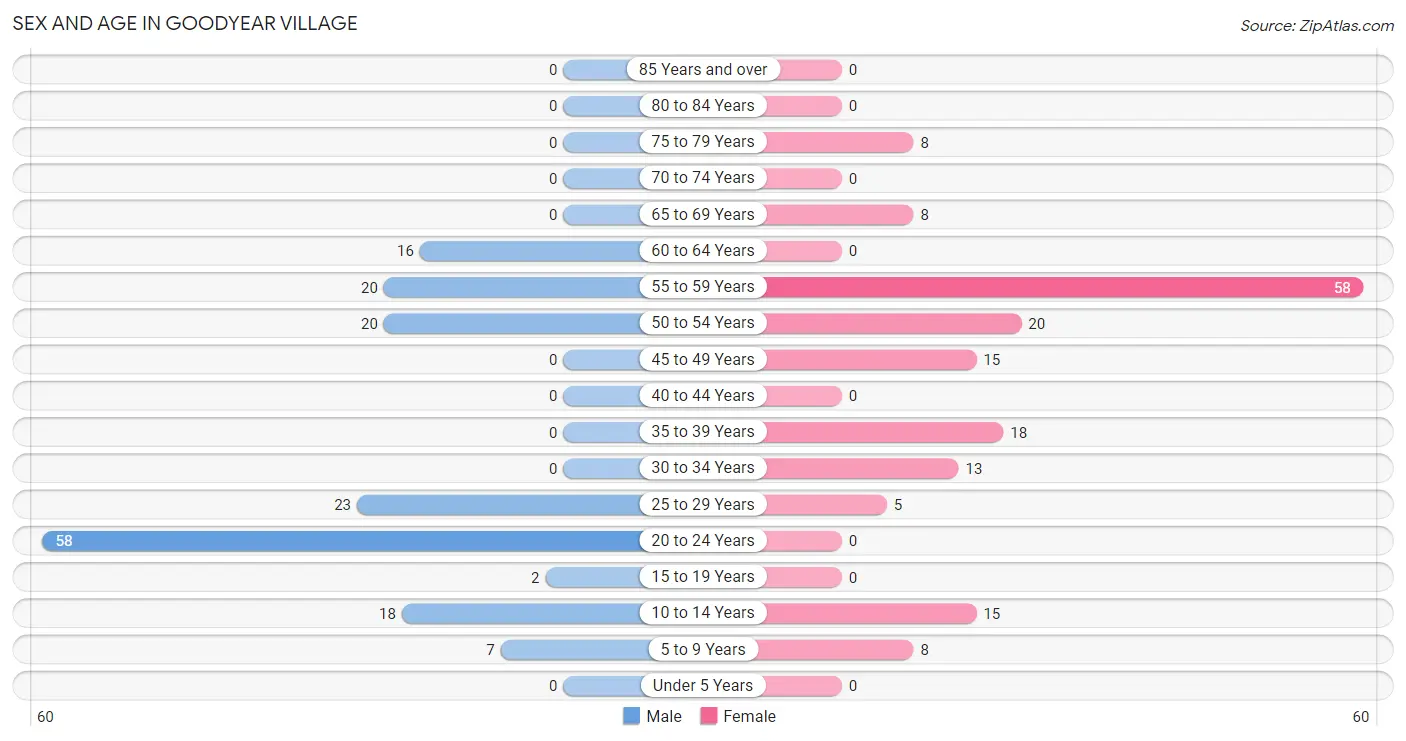
| Age Bracket | Male | Female |
| Under 5 Years | 0 (0.0%) | 0 (0.0%) |
| 5 to 9 Years | 7 (4.3%) | 8 (4.8%) |
| 10 to 14 Years | 18 (11.0%) | 15 (8.9%) |
| 15 to 19 Years | 2 (1.2%) | 0 (0.0%) |
| 20 to 24 Years | 58 (35.4%) | 0 (0.0%) |
| 25 to 29 Years | 23 (14.0%) | 5 (3.0%) |
| 30 to 34 Years | 0 (0.0%) | 13 (7.7%) |
| 35 to 39 Years | 0 (0.0%) | 18 (10.7%) |
| 40 to 44 Years | 0 (0.0%) | 0 (0.0%) |
| 45 to 49 Years | 0 (0.0%) | 15 (8.9%) |
| 50 to 54 Years | 20 (12.2%) | 20 (11.9%) |
| 55 to 59 Years | 20 (12.2%) | 58 (34.5%) |
| 60 to 64 Years | 16 (9.8%) | 0 (0.0%) |
| 65 to 69 Years | 0 (0.0%) | 8 (4.8%) |
| 70 to 74 Years | 0 (0.0%) | 0 (0.0%) |
| 75 to 79 Years | 0 (0.0%) | 8 (4.8%) |
| 80 to 84 Years | 0 (0.0%) | 0 (0.0%) |
| 85 Years and over | 0 (0.0%) | 0 (0.0%) |
| Total | 164 (100.0%) | 168 (100.0%) |
Families and Households in Goodyear Village
Median Family Size in Goodyear Village
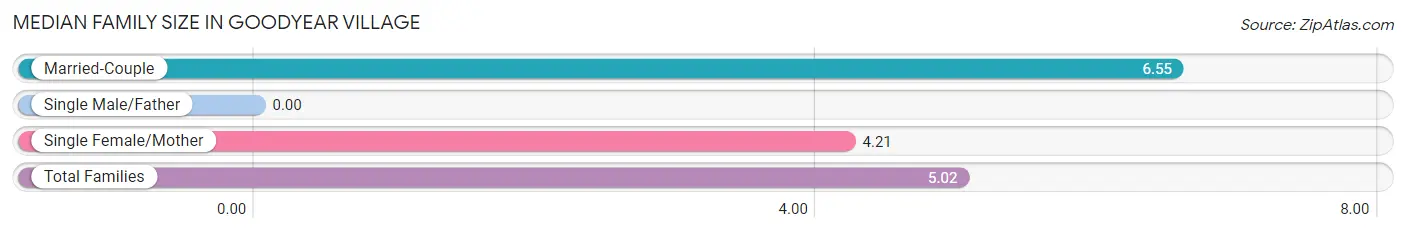
| Family Type | # Families | Family Size |
| Married-Couple | 20 (34.5%) | 6.55 |
| Single Male/Father | 0 (0.0%) | - |
| Single Female/Mother | 38 (65.5%) | 4.21 |
| Total Families | 58 (100.0%) | 5.02 |
Median Household Size in Goodyear Village
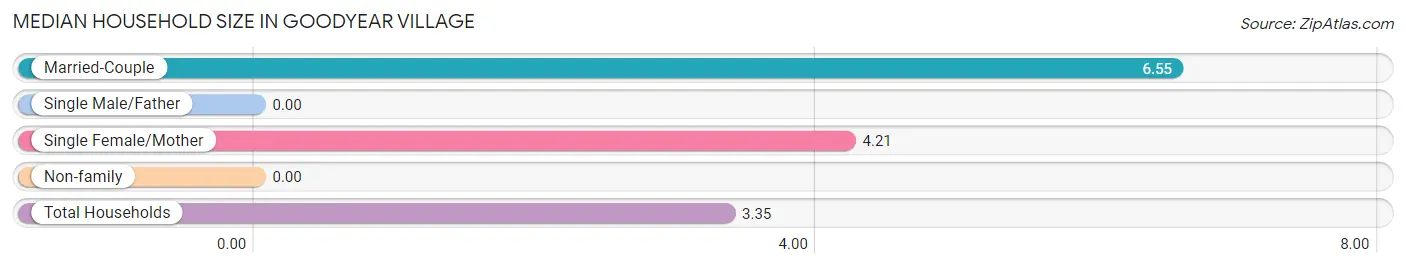
| Household Type | # Households | Household Size |
| Married-Couple | 20 (20.2%) | 6.55 |
| Single Male/Father | 0 (0.0%) | - |
| Single Female/Mother | 38 (38.4%) | 4.21 |
| Non-family | 41 (41.4%) | - |
| Total Households | 99 (100.0%) | 3.35 |
Household Size by Marriage Status in Goodyear Village
Out of a total of 99 households in Goodyear Village, 58 (58.6%) are family households, while 41 (41.4%) are nonfamily households. The most numerous type of family households are 3-person households, comprising 29, and the most common type of nonfamily households are 1-person households, comprising 41.
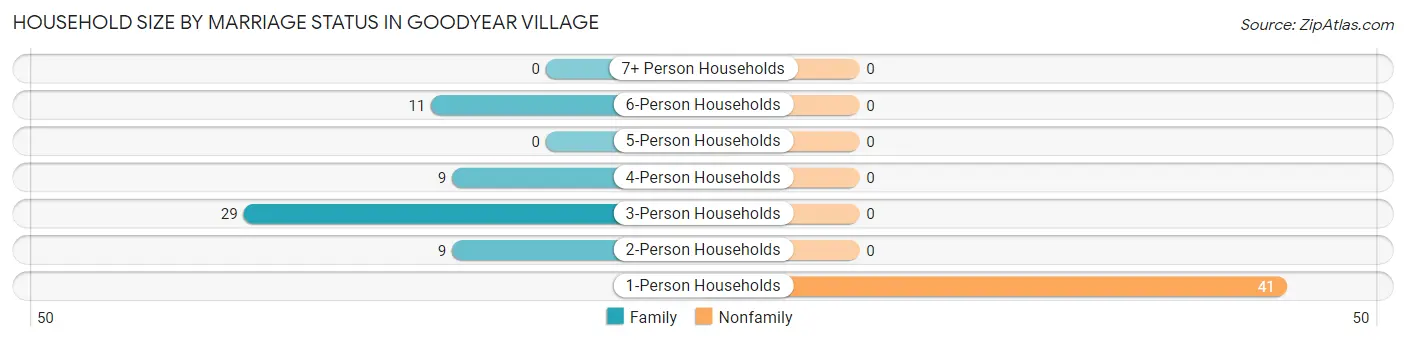
| Household Size | Family Households | Nonfamily Households |
| 1-Person Households | - | 41 (41.4%) |
| 2-Person Households | 9 (9.1%) | 0 (0.0%) |
| 3-Person Households | 29 (29.3%) | 0 (0.0%) |
| 4-Person Households | 9 (9.1%) | 0 (0.0%) |
| 5-Person Households | 0 (0.0%) | 0 (0.0%) |
| 6-Person Households | 11 (11.1%) | 0 (0.0%) |
| 7+ Person Households | 0 (0.0%) | 0 (0.0%) |
| Total | 58 (58.6%) | 41 (41.4%) |
Female Fertility in Goodyear Village
Fertility by Age in Goodyear Village
| Age Bracket | Women with Births | Births / 1,000 Women |
| 15 to 19 years | 0 (0.0%) | 0.0 |
| 20 to 34 years | 0 (0.0%) | 0.0 |
| 35 to 50 years | 0 (0.0%) | 0.0 |
| Total | 0 (0.0%) | 0.0 |
Fertility by Age by Marriage Status in Goodyear Village
| Age Bracket | Married | Unmarried |
| 15 to 19 years | 0 (0.0%) | 0 (0.0%) |
| 20 to 34 years | 0 (0.0%) | 0 (0.0%) |
| 35 to 50 years | 0 (0.0%) | 0 (0.0%) |
| Total | 0 (0.0%) | 0 (0.0%) |
Fertility by Education in Goodyear Village
| Educational Attainment | Women with Births | Births / 1,000 Women |
| Less than High School | 0 (0.0%) | 0.0 |
| High School Diploma | 0 (0.0%) | 0.0 |
| College or Associate's Degree | 0 (0.0%) | 0.0 |
| Bachelor's Degree | 0 (0.0%) | 0.0 |
| Graduate Degree | 0 (0.0%) | 0.0 |
| Total | 0 (0.0%) | 0.0 |
Fertility by Education by Marriage Status in Goodyear Village
| Educational Attainment | Married | Unmarried |
| Less than High School | 0 (0.0%) | 0 (0.0%) |
| High School Diploma | 0 (0.0%) | 0 (0.0%) |
| College or Associate's Degree | 0 (0.0%) | 0 (0.0%) |
| Bachelor's Degree | 0 (0.0%) | 0 (0.0%) |
| Graduate Degree | 0 (0.0%) | 0 (0.0%) |
| Total | 0 (0.0%) | 0 (0.0%) |
Employment Characteristics in Goodyear Village
Employment by Class of Employer in Goodyear Village
Among the 124 employed individuals in Goodyear Village, private company employees (82 | 66.1%), not-for-profit organizations (28 | 22.6%), and local government employees (7 | 5.7%) make up the most common classes of employment.
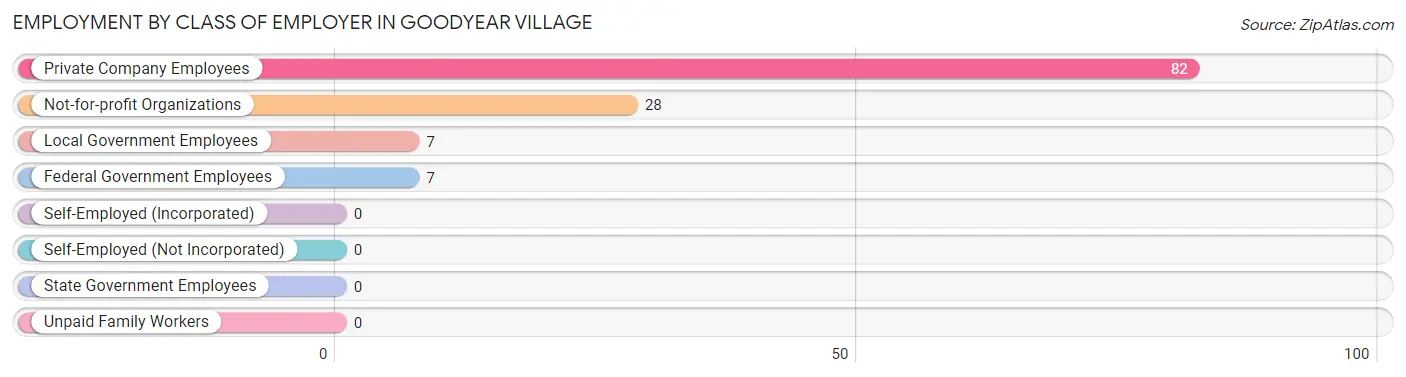
| Employer Class | # Employees | % Employees |
| Private Company Employees | 82 | 66.1% |
| Self-Employed (Incorporated) | 0 | 0.0% |
| Self-Employed (Not Incorporated) | 0 | 0.0% |
| Not-for-profit Organizations | 28 | 22.6% |
| Local Government Employees | 7 | 5.7% |
| State Government Employees | 0 | 0.0% |
| Federal Government Employees | 7 | 5.7% |
| Unpaid Family Workers | 0 | 0.0% |
| Total | 124 | 100.0% |
Employment Status by Age in Goodyear Village
According to the labor force statistics for Goodyear Village, out of the total population over 16 years of age (282), 57.4% or 162 individuals are in the labor force, with 17.9% or 29 of them unemployed. The age group with the highest labor force participation rate is 25 to 29 years, with 100.0% or 28 individuals in the labor force. Within the labor force, the 20 to 24 years age range has the highest percentage of unemployed individuals, with 100.0% or 29 of them being unemployed.
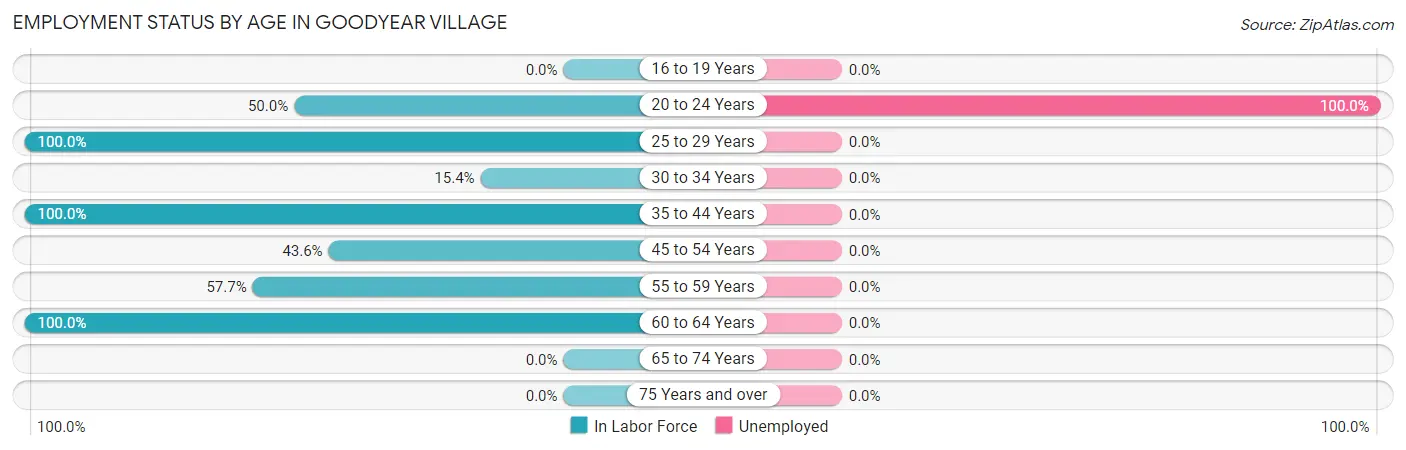
| Age Bracket | In Labor Force | Unemployed |
| 16 to 19 Years | 0 (0.0%) | 0 (0.0%) |
| 20 to 24 Years | 29 (50.0%) | 29 (100.0%) |
| 25 to 29 Years | 28 (100.0%) | 0 (0.0%) |
| 30 to 34 Years | 2 (15.4%) | 0 (0.0%) |
| 35 to 44 Years | 18 (100.0%) | 0 (0.0%) |
| 45 to 54 Years | 24 (43.6%) | 0 (0.0%) |
| 55 to 59 Years | 45 (57.7%) | 0 (0.0%) |
| 60 to 64 Years | 16 (100.0%) | 0 (0.0%) |
| 65 to 74 Years | 0 (0.0%) | 0 (0.0%) |
| 75 Years and over | 0 (0.0%) | 0 (0.0%) |
| Total | 162 (57.4%) | 29 (17.9%) |
Employment Status by Educational Attainment in Goodyear Village
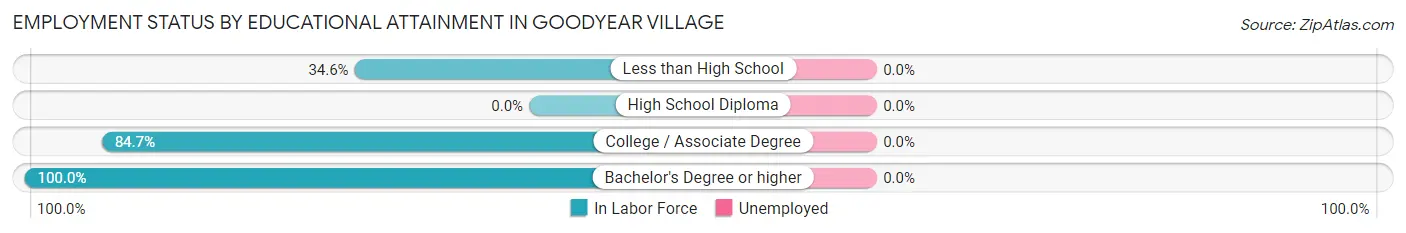
| Educational Attainment | In Labor Force | Unemployed |
| Less than High School | 28 (34.6%) | 0 (0.0%) |
| High School Diploma | 0 (0.0%) | 0 (0.0%) |
| College / Associate Degree | 72 (84.7%) | 0 (0.0%) |
| Bachelor's Degree or higher | 33 (100.0%) | 0 (0.0%) |
| Total | 133 (63.9%) | 0 (0.0%) |
Employment Occupations by Sex in Goodyear Village
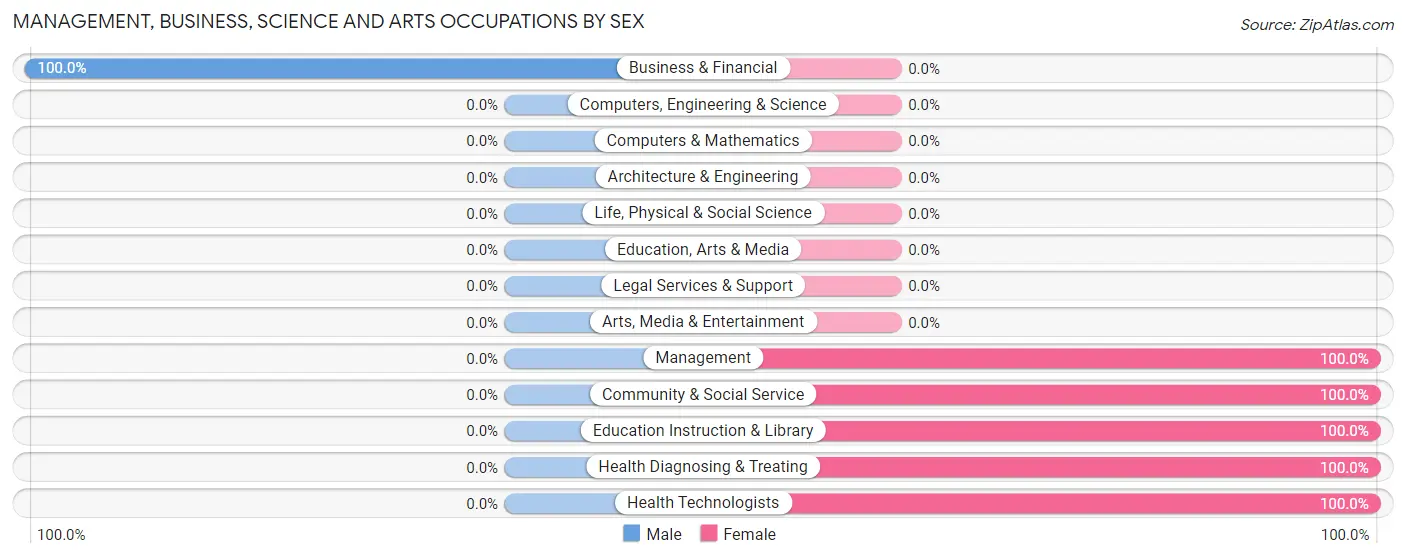
Management, Business, Science and Arts Occupations
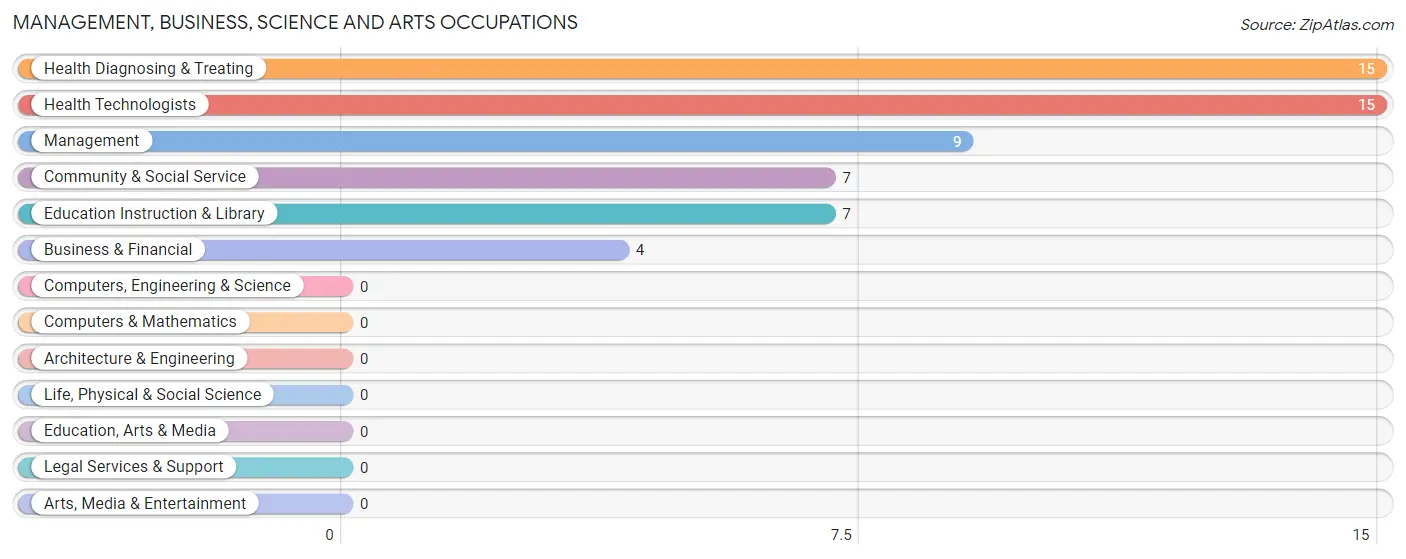
The most common Management, Business, Science and Arts occupations in Goodyear Village are Health Diagnosing & Treating (15 | 11.3%), Health Technologists (15 | 11.3%), Management (9 | 6.8%), Community & Social Service (7 | 5.3%), and Education Instruction & Library (7 | 5.3%).
Management, Business, Science and Arts Occupations by Sex
| Occupation | Male | Female |
| Management | 0 (0.0%) | 9 (100.0%) |
| Business & Financial | 4 (100.0%) | 0 (0.0%) |
| Computers, Engineering & Science | 0 (0.0%) | 0 (0.0%) |
| Computers & Mathematics | 0 (0.0%) | 0 (0.0%) |
| Architecture & Engineering | 0 (0.0%) | 0 (0.0%) |
| Life, Physical & Social Science | 0 (0.0%) | 0 (0.0%) |
| Community & Social Service | 0 (0.0%) | 7 (100.0%) |
| Education, Arts & Media | 0 (0.0%) | 0 (0.0%) |
| Legal Services & Support | 0 (0.0%) | 0 (0.0%) |
| Education Instruction & Library | 0 (0.0%) | 7 (100.0%) |
| Arts, Media & Entertainment | 0 (0.0%) | 0 (0.0%) |
| Health Diagnosing & Treating | 0 (0.0%) | 15 (100.0%) |
| Health Technologists | 0 (0.0%) | 15 (100.0%) |
| Total (Category) | 4 (11.4%) | 31 (88.6%) |
| Total (Overall) | 48 (36.1%) | 85 (63.9%) |
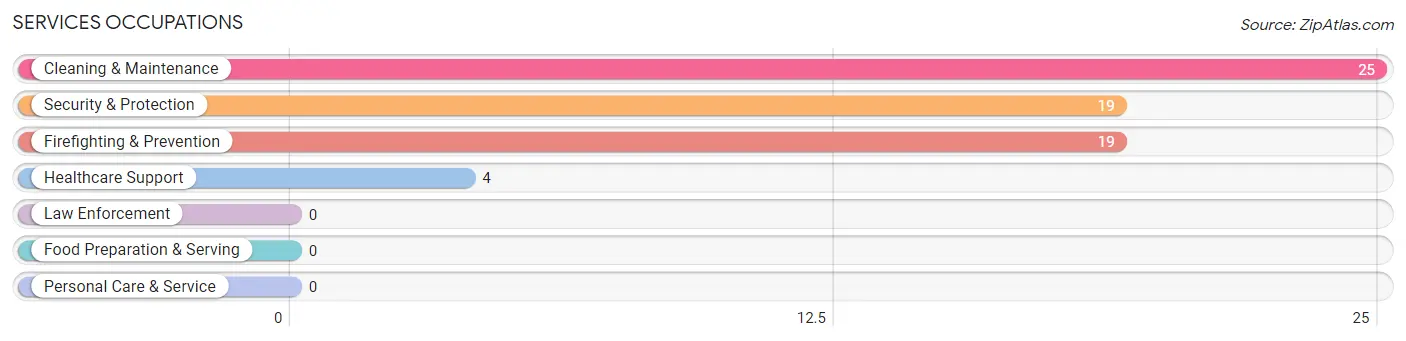
Services Occupations
The most common Services occupations in Goodyear Village are Cleaning & Maintenance (25 | 18.8%), Security & Protection (19 | 14.3%), Firefighting & Prevention (19 | 14.3%), and Healthcare Support (4 | 3.0%).
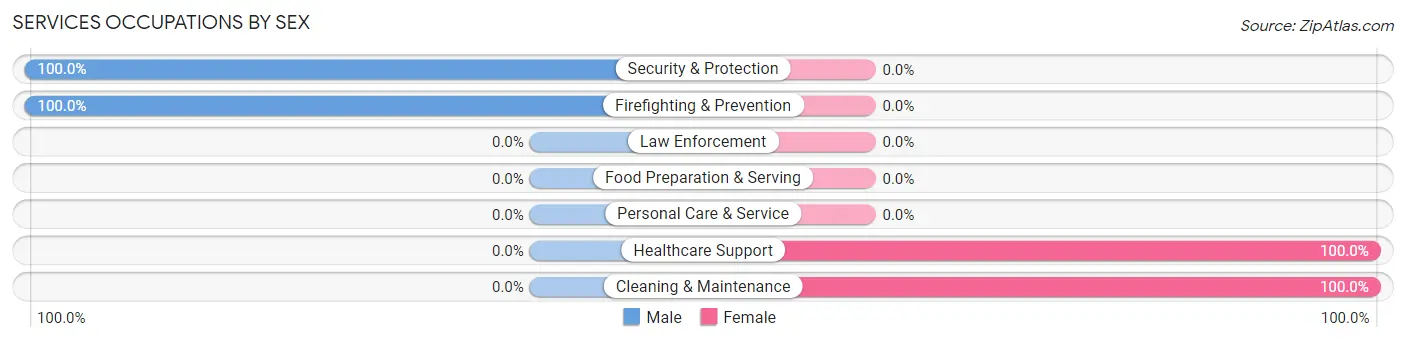
Services Occupations by Sex
Within the Services occupations in Goodyear Village, the most male-oriented occupations are Security & Protection (100.0%), and Firefighting & Prevention (100.0%), while the most female-oriented occupations are Healthcare Support (100.0%), and Cleaning & Maintenance (100.0%).
| Occupation | Male | Female |
| Healthcare Support | 0 (0.0%) | 4 (100.0%) |
| Security & Protection | 19 (100.0%) | 0 (0.0%) |
| Firefighting & Prevention | 19 (100.0%) | 0 (0.0%) |
| Law Enforcement | 0 (0.0%) | 0 (0.0%) |
| Food Preparation & Serving | 0 (0.0%) | 0 (0.0%) |
| Cleaning & Maintenance | 0 (0.0%) | 25 (100.0%) |
| Personal Care & Service | 0 (0.0%) | 0 (0.0%) |
| Total (Category) | 19 (39.6%) | 29 (60.4%) |
| Total (Overall) | 48 (36.1%) | 85 (63.9%) |
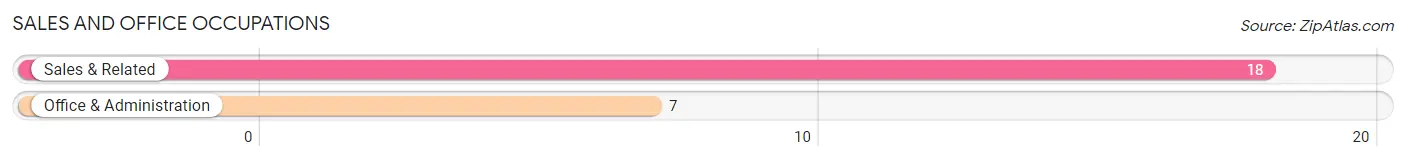
Sales and Office Occupations
The most common Sales and Office occupations in Goodyear Village are Sales & Related (18 | 13.5%), and Office & Administration (7 | 5.3%).
Sales and Office Occupations by Sex
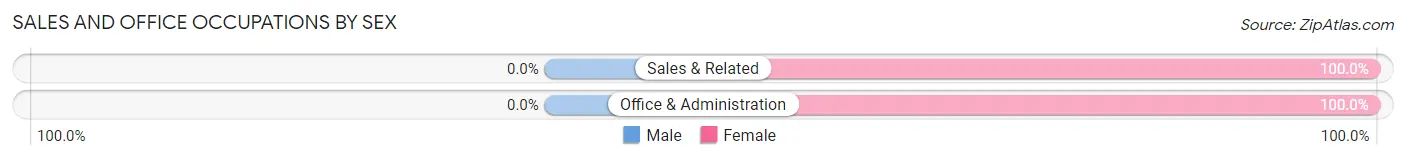
| Occupation | Male | Female |
| Sales & Related | 0 (0.0%) | 18 (100.0%) |
| Office & Administration | 0 (0.0%) | 7 (100.0%) |
| Total (Category) | 0 (0.0%) | 25 (100.0%) |
| Total (Overall) | 48 (36.1%) | 85 (63.9%) |
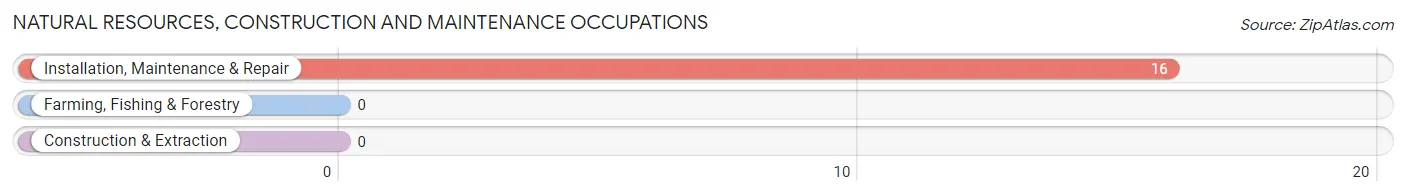
Natural Resources, Construction and Maintenance Occupations
The most common Natural Resources, Construction and Maintenance occupations in Goodyear Village are , and Installation, Maintenance & Repair (16 | 12.0%).
Natural Resources, Construction and Maintenance Occupations by Sex
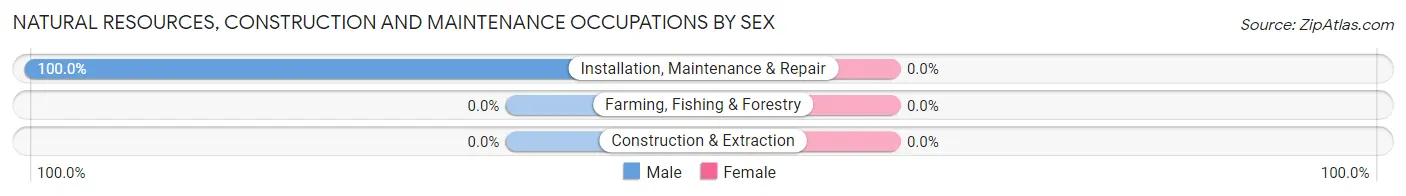
| Occupation | Male | Female |
| Farming, Fishing & Forestry | 0 (0.0%) | 0 (0.0%) |
| Construction & Extraction | 0 (0.0%) | 0 (0.0%) |
| Installation, Maintenance & Repair | 16 (100.0%) | 0 (0.0%) |
| Total (Category) | 16 (100.0%) | 0 (0.0%) |
| Total (Overall) | 48 (36.1%) | 85 (63.9%) |
Production, Transportation and Moving Occupations
The most common Production, Transportation and Moving occupations in Goodyear Village are , and Material Moving (9 | 6.8%).
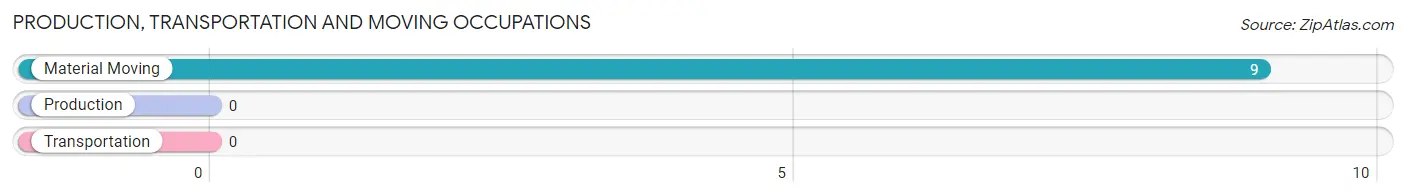
Production, Transportation and Moving Occupations by Sex
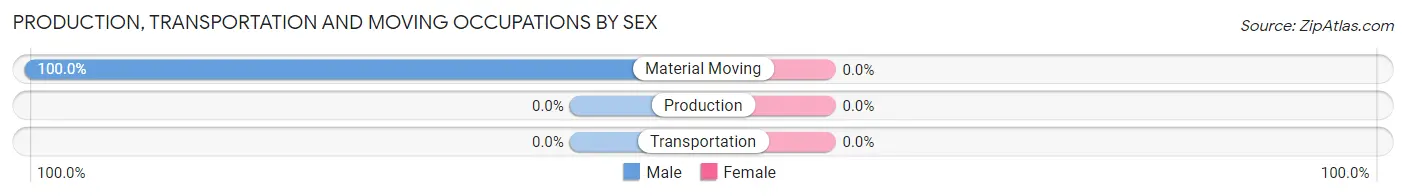
| Occupation | Male | Female |
| Production | 0 (0.0%) | 0 (0.0%) |
| Transportation | 0 (0.0%) | 0 (0.0%) |
| Material Moving | 9 (100.0%) | 0 (0.0%) |
| Total (Category) | 9 (100.0%) | 0 (0.0%) |
| Total (Overall) | 48 (36.1%) | 85 (63.9%) |
Employment Industries by Sex in Goodyear Village
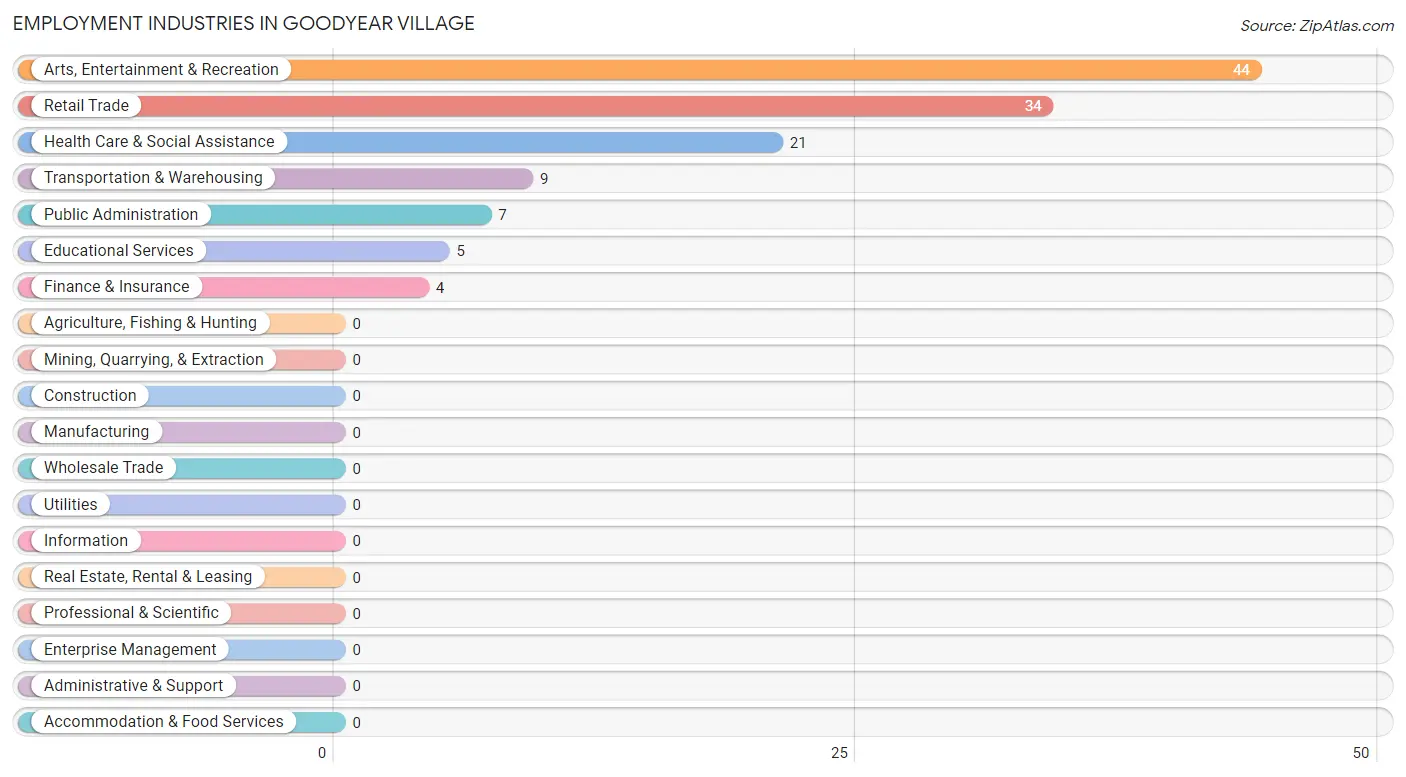
Employment Industries in Goodyear Village
The major employment industries in Goodyear Village include Arts, Entertainment & Recreation (44 | 33.1%), Retail Trade (34 | 25.6%), Health Care & Social Assistance (21 | 15.8%), Transportation & Warehousing (9 | 6.8%), and Public Administration (7 | 5.3%).
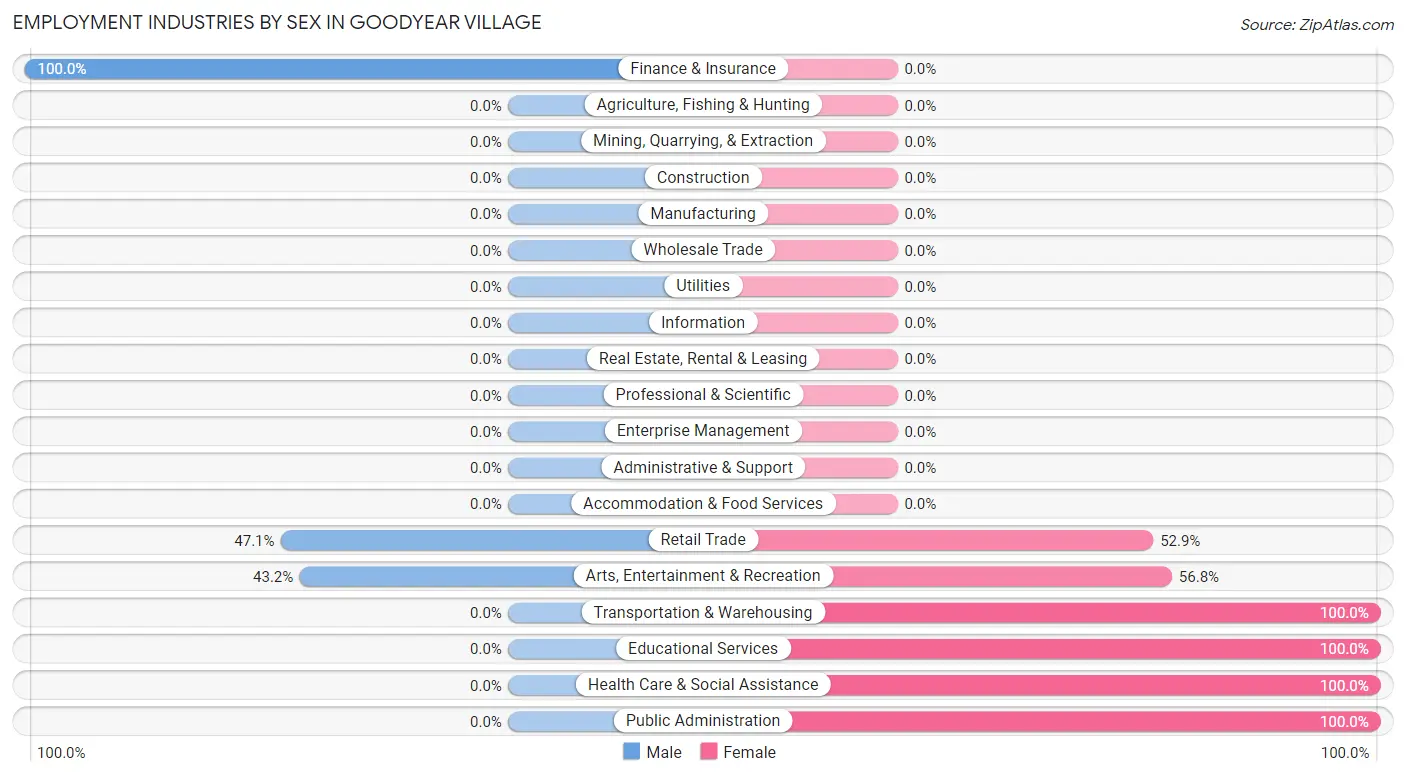
Employment Industries by Sex in Goodyear Village
The Goodyear Village industries that see more men than women are Finance & Insurance (100.0%), Retail Trade (47.1%), and Arts, Entertainment & Recreation (43.2%), whereas the industries that tend to have a higher number of women are Transportation & Warehousing (100.0%), Educational Services (100.0%), and Health Care & Social Assistance (100.0%).
| Industry | Male | Female |
| Agriculture, Fishing & Hunting | 0 (0.0%) | 0 (0.0%) |
| Mining, Quarrying, & Extraction | 0 (0.0%) | 0 (0.0%) |
| Construction | 0 (0.0%) | 0 (0.0%) |
| Manufacturing | 0 (0.0%) | 0 (0.0%) |
| Wholesale Trade | 0 (0.0%) | 0 (0.0%) |
| Retail Trade | 16 (47.1%) | 18 (52.9%) |
| Transportation & Warehousing | 0 (0.0%) | 9 (100.0%) |
| Utilities | 0 (0.0%) | 0 (0.0%) |
| Information | 0 (0.0%) | 0 (0.0%) |
| Finance & Insurance | 4 (100.0%) | 0 (0.0%) |
| Real Estate, Rental & Leasing | 0 (0.0%) | 0 (0.0%) |
| Professional & Scientific | 0 (0.0%) | 0 (0.0%) |
| Enterprise Management | 0 (0.0%) | 0 (0.0%) |
| Administrative & Support | 0 (0.0%) | 0 (0.0%) |
| Educational Services | 0 (0.0%) | 5 (100.0%) |
| Health Care & Social Assistance | 0 (0.0%) | 21 (100.0%) |
| Arts, Entertainment & Recreation | 19 (43.2%) | 25 (56.8%) |
| Accommodation & Food Services | 0 (0.0%) | 0 (0.0%) |
| Public Administration | 0 (0.0%) | 7 (100.0%) |
| Total | 48 (36.1%) | 85 (63.9%) |
Education in Goodyear Village
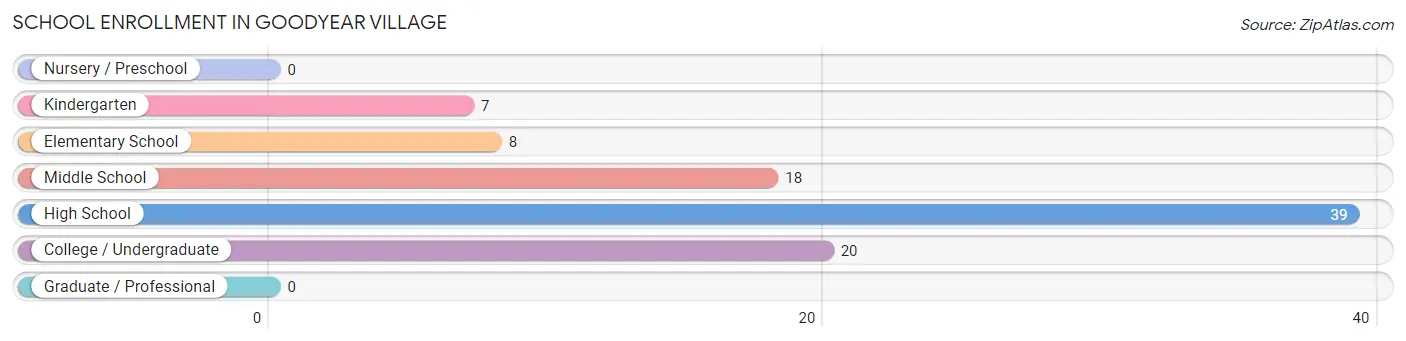
School Enrollment in Goodyear Village
The most common levels of schooling among the 92 students in Goodyear Village are high school (39 | 42.4%), college / undergraduate (20 | 21.7%), and middle school (18 | 19.6%).
| School Level | # Students | % Students |
| Nursery / Preschool | 0 | 0.0% |
| Kindergarten | 7 | 7.6% |
| Elementary School | 8 | 8.7% |
| Middle School | 18 | 19.6% |
| High School | 39 | 42.4% |
| College / Undergraduate | 20 | 21.7% |
| Graduate / Professional | 0 | 0.0% |
| Total | 92 | 100.0% |
School Enrollment by Age by Funding Source in Goodyear Village
Out of a total of 92 students who are enrolled in schools in Goodyear Village, 18 (19.6%) attend a private institution, while the remaining 74 (80.4%) are enrolled in public schools. The age group of 10 to 14 year olds has the highest likelihood of being enrolled in private schools, with 18 (54.5% in the age bracket) enrolled. Conversely, the age group of 5 to 9 year old has the lowest likelihood of being enrolled in a private school, with 15 (100.0% in the age bracket) attending a public institution.
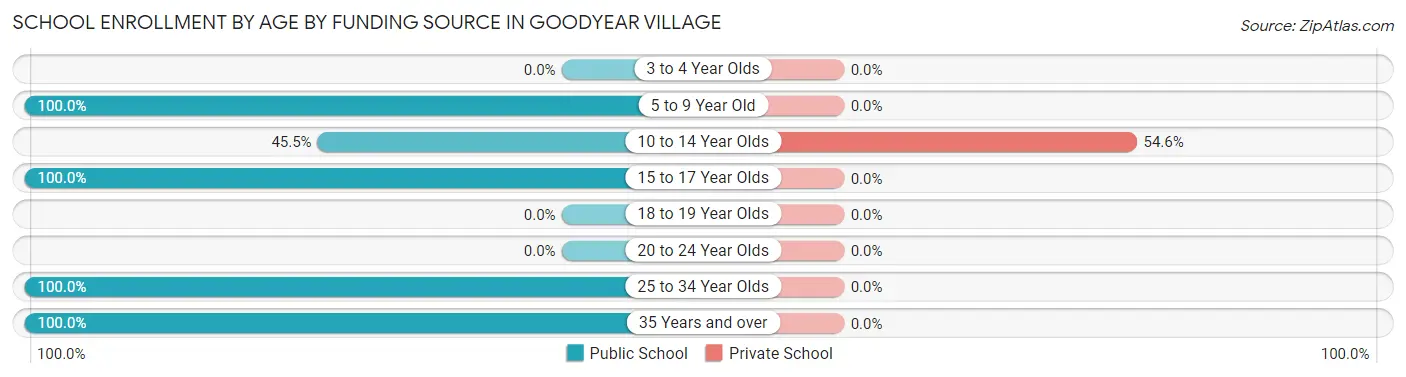
| Age Bracket | Public School | Private School |
| 3 to 4 Year Olds | 0 (0.0%) | 0 (0.0%) |
| 5 to 9 Year Old | 15 (100.0%) | 0 (0.0%) |
| 10 to 14 Year Olds | 15 (45.5%) | 18 (54.5%) |
| 15 to 17 Year Olds | 2 (100.0%) | 0 (0.0%) |
| 18 to 19 Year Olds | 0 (0.0%) | 0 (0.0%) |
| 20 to 24 Year Olds | 0 (0.0%) | 0 (0.0%) |
| 25 to 34 Year Olds | 2 (100.0%) | 0 (0.0%) |
| 35 Years and over | 40 (100.0%) | 0 (0.0%) |
| Total | 74 (80.4%) | 18 (19.6%) |
Educational Attainment by Field of Study in Goodyear Village
Physical & health sciences (18 | 54.5%), and science & technology (15 | 45.5%) are the most common fields of study among 33 individuals in Goodyear Village who have obtained a bachelor's degree or higher.
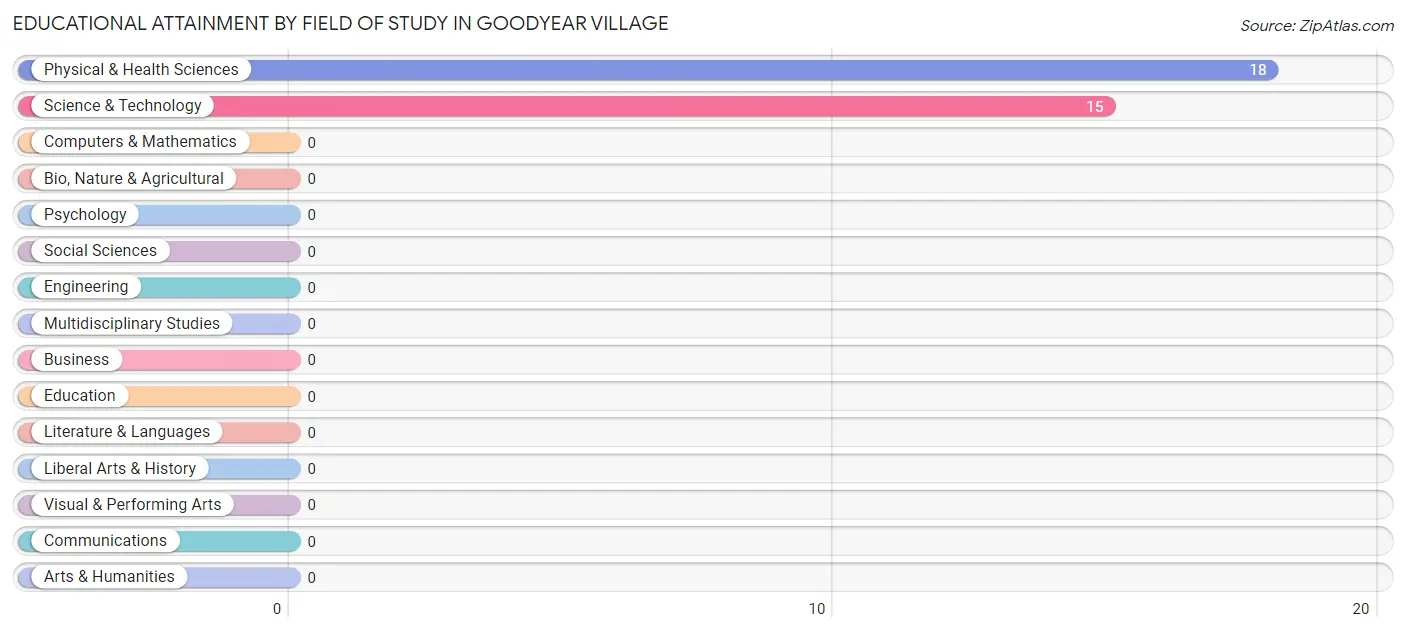
| Field of Study | # Graduates | % Graduates |
| Computers & Mathematics | 0 | 0.0% |
| Bio, Nature & Agricultural | 0 | 0.0% |
| Physical & Health Sciences | 18 | 54.5% |
| Psychology | 0 | 0.0% |
| Social Sciences | 0 | 0.0% |
| Engineering | 0 | 0.0% |
| Multidisciplinary Studies | 0 | 0.0% |
| Science & Technology | 15 | 45.5% |
| Business | 0 | 0.0% |
| Education | 0 | 0.0% |
| Literature & Languages | 0 | 0.0% |
| Liberal Arts & History | 0 | 0.0% |
| Visual & Performing Arts | 0 | 0.0% |
| Communications | 0 | 0.0% |
| Arts & Humanities | 0 | 0.0% |
| Total | 33 | 100.0% |
Transportation & Commute in Goodyear Village
Vehicle Availability by Sex in Goodyear Village
The most prevalent vehicle ownership categories in Goodyear Village are males with 3 vehicles (25, accounting for 52.1%) and females with 3 vehicles (58, making up 32.9%).
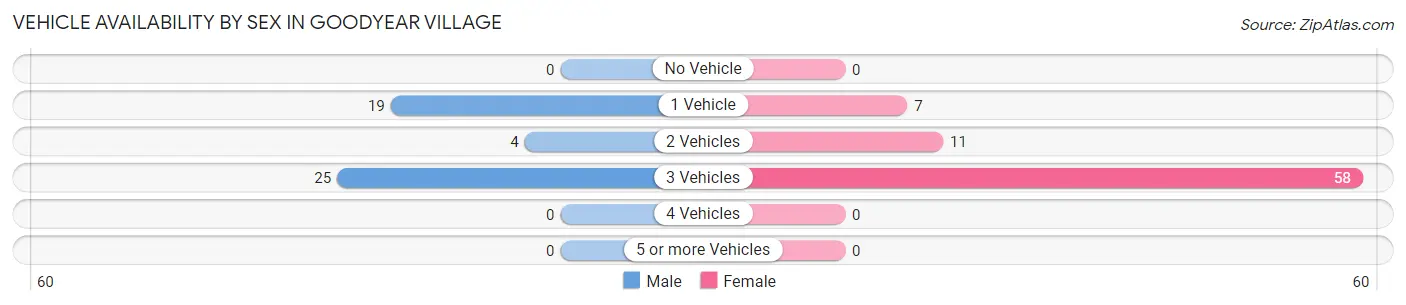
| Vehicles Available | Male | Female |
| No Vehicle | 0 (0.0%) | 0 (0.0%) |
| 1 Vehicle | 19 (39.6%) | 7 (9.2%) |
| 2 Vehicles | 4 (8.3%) | 11 (14.5%) |
| 3 Vehicles | 25 (52.1%) | 58 (76.3%) |
| 4 Vehicles | 0 (0.0%) | 0 (0.0%) |
| 5 or more Vehicles | 0 (0.0%) | 0 (0.0%) |
| Total | 48 (100.0%) | 76 (100.0%) |
Commute Time in Goodyear Village
The most frequently occuring commute durations in Goodyear Village are 15 to 19 minutes (34 commuters, 29.6%), 30 to 34 minutes (26 commuters, 22.6%), and 20 to 24 minutes (18 commuters, 15.7%).
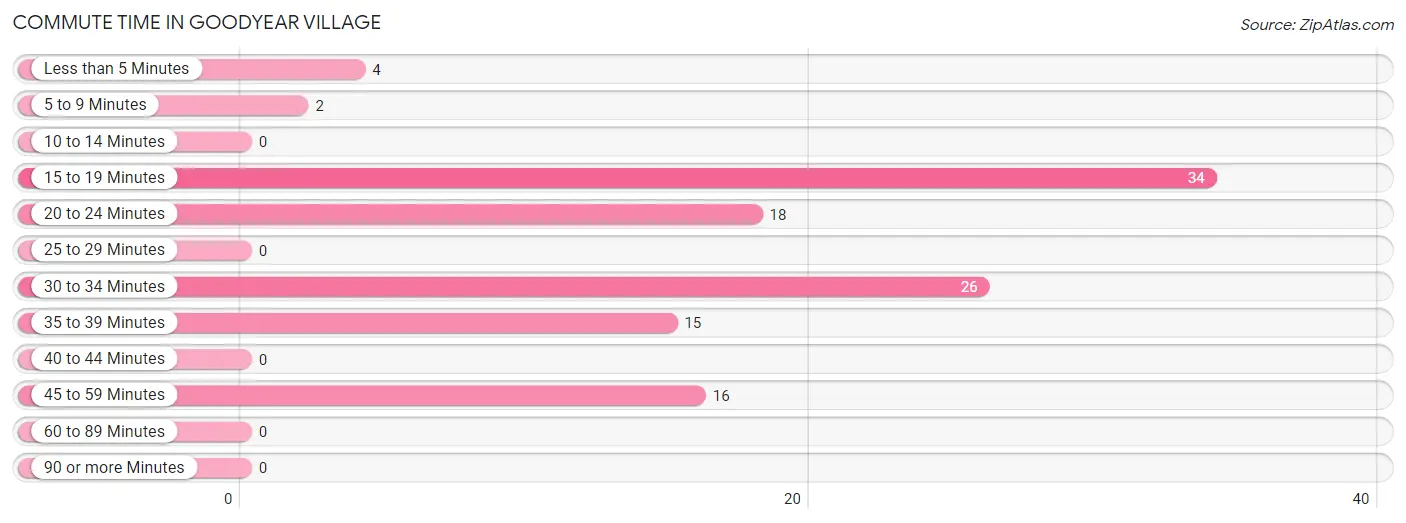
| Commute Time | # Commuters | % Commuters |
| Less than 5 Minutes | 4 | 3.5% |
| 5 to 9 Minutes | 2 | 1.7% |
| 10 to 14 Minutes | 0 | 0.0% |
| 15 to 19 Minutes | 34 | 29.6% |
| 20 to 24 Minutes | 18 | 15.7% |
| 25 to 29 Minutes | 0 | 0.0% |
| 30 to 34 Minutes | 26 | 22.6% |
| 35 to 39 Minutes | 15 | 13.0% |
| 40 to 44 Minutes | 0 | 0.0% |
| 45 to 59 Minutes | 16 | 13.9% |
| 60 to 89 Minutes | 0 | 0.0% |
| 90 or more Minutes | 0 | 0.0% |
Commute Time by Sex in Goodyear Village
The most common commute times in Goodyear Village are 30 to 34 minutes (19 commuters, 43.2%) for males and 15 to 19 minutes (25 commuters, 35.2%) for females.
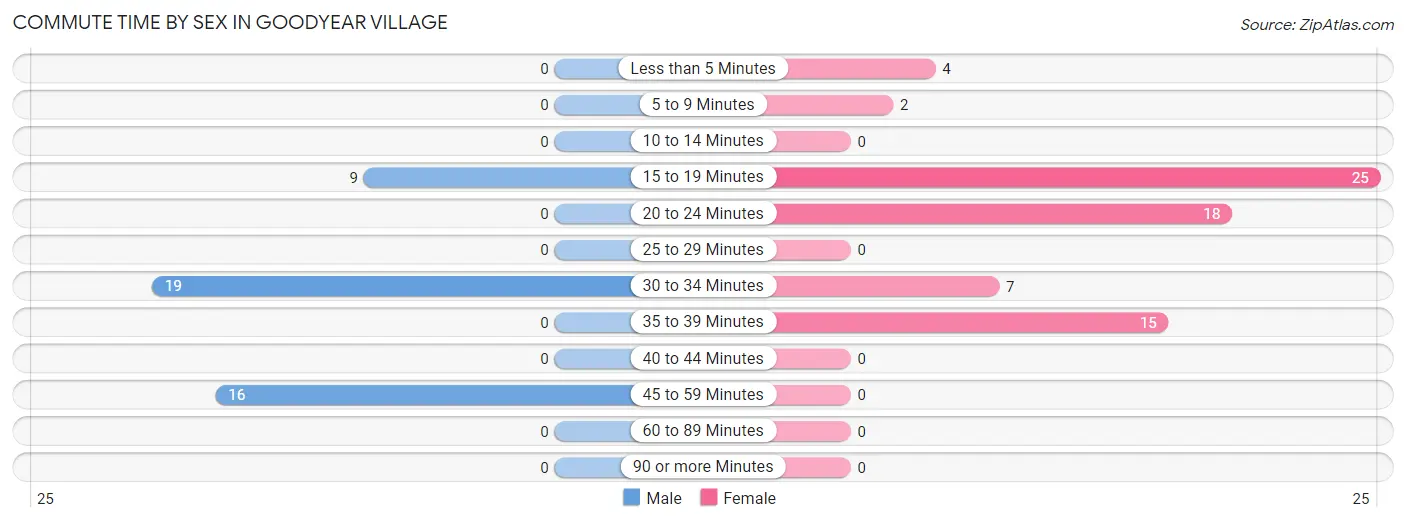
| Commute Time | Male | Female |
| Less than 5 Minutes | 0 (0.0%) | 4 (5.6%) |
| 5 to 9 Minutes | 0 (0.0%) | 2 (2.8%) |
| 10 to 14 Minutes | 0 (0.0%) | 0 (0.0%) |
| 15 to 19 Minutes | 9 (20.4%) | 25 (35.2%) |
| 20 to 24 Minutes | 0 (0.0%) | 18 (25.4%) |
| 25 to 29 Minutes | 0 (0.0%) | 0 (0.0%) |
| 30 to 34 Minutes | 19 (43.2%) | 7 (9.9%) |
| 35 to 39 Minutes | 0 (0.0%) | 15 (21.1%) |
| 40 to 44 Minutes | 0 (0.0%) | 0 (0.0%) |
| 45 to 59 Minutes | 16 (36.4%) | 0 (0.0%) |
| 60 to 89 Minutes | 0 (0.0%) | 0 (0.0%) |
| 90 or more Minutes | 0 (0.0%) | 0 (0.0%) |
Time of Departure to Work by Sex in Goodyear Village
The most frequent times of departure to work in Goodyear Village are 4:00 PM to 11:59 PM (19, 43.2%) for males and 5:30 AM to 5:59 AM (40, 56.3%) for females.
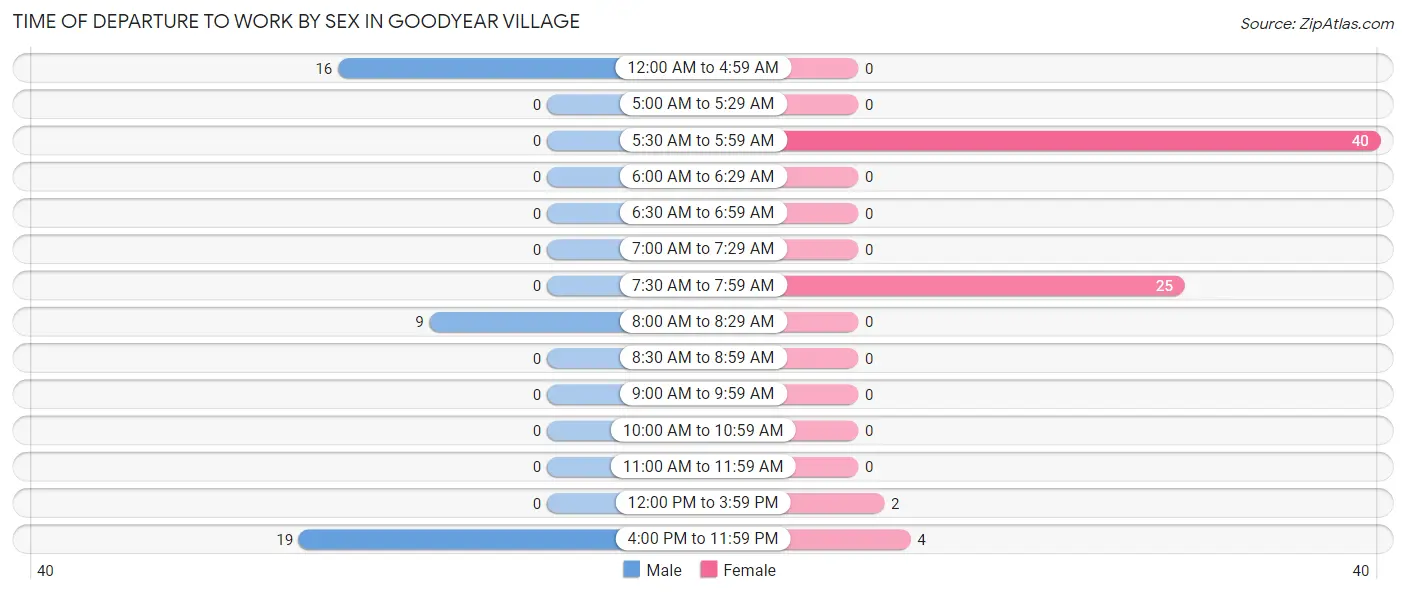
| Time of Departure | Male | Female |
| 12:00 AM to 4:59 AM | 16 (36.4%) | 0 (0.0%) |
| 5:00 AM to 5:29 AM | 0 (0.0%) | 0 (0.0%) |
| 5:30 AM to 5:59 AM | 0 (0.0%) | 40 (56.3%) |
| 6:00 AM to 6:29 AM | 0 (0.0%) | 0 (0.0%) |
| 6:30 AM to 6:59 AM | 0 (0.0%) | 0 (0.0%) |
| 7:00 AM to 7:29 AM | 0 (0.0%) | 0 (0.0%) |
| 7:30 AM to 7:59 AM | 0 (0.0%) | 25 (35.2%) |
| 8:00 AM to 8:29 AM | 9 (20.4%) | 0 (0.0%) |
| 8:30 AM to 8:59 AM | 0 (0.0%) | 0 (0.0%) |
| 9:00 AM to 9:59 AM | 0 (0.0%) | 0 (0.0%) |
| 10:00 AM to 10:59 AM | 0 (0.0%) | 0 (0.0%) |
| 11:00 AM to 11:59 AM | 0 (0.0%) | 0 (0.0%) |
| 12:00 PM to 3:59 PM | 0 (0.0%) | 2 (2.8%) |
| 4:00 PM to 11:59 PM | 19 (43.2%) | 4 (5.6%) |
| Total | 44 (100.0%) | 71 (100.0%) |
Housing Occupancy in Goodyear Village
Occupancy by Ownership in Goodyear Village
Of the total 99 dwellings in Goodyear Village, owner-occupied units account for 56 (56.6%), while renter-occupied units make up 43 (43.4%).
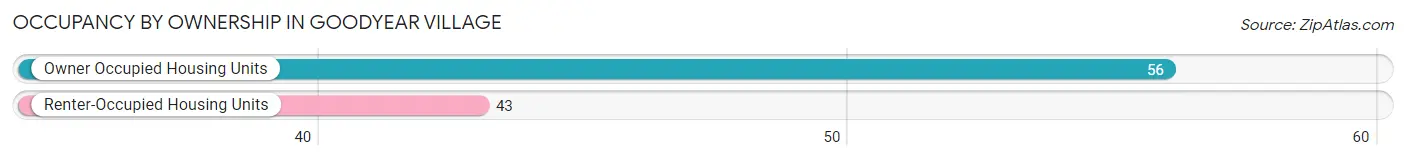
| Occupancy | # Housing Units | % Housing Units |
| Owner Occupied Housing Units | 56 | 56.6% |
| Renter-Occupied Housing Units | 43 | 43.4% |
| Total Occupied Housing Units | 99 | 100.0% |
Occupancy by Household Size in Goodyear Village
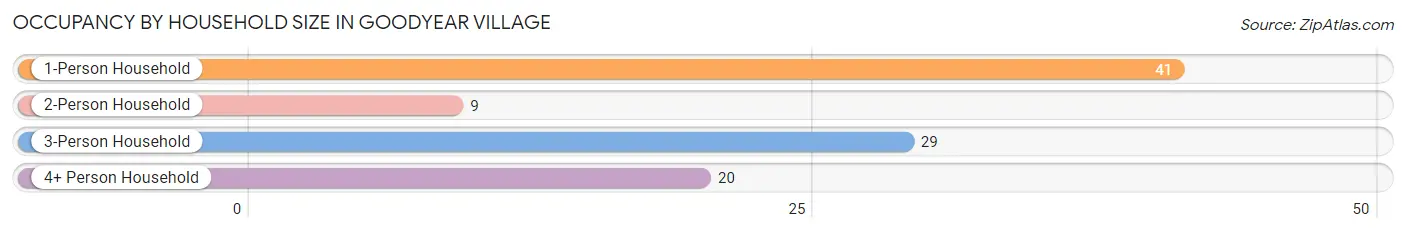
| Household Size | # Housing Units | % Housing Units |
| 1-Person Household | 41 | 41.4% |
| 2-Person Household | 9 | 9.1% |
| 3-Person Household | 29 | 29.3% |
| 4+ Person Household | 20 | 20.2% |
| Total Housing Units | 99 | 100.0% |
Occupancy by Ownership by Household Size in Goodyear Village
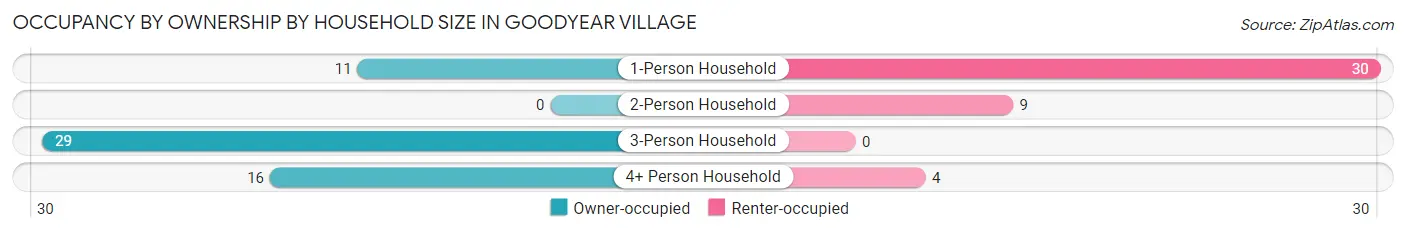
| Household Size | Owner-occupied | Renter-occupied |
| 1-Person Household | 11 (26.8%) | 30 (73.2%) |
| 2-Person Household | 0 (0.0%) | 9 (100.0%) |
| 3-Person Household | 29 (100.0%) | 0 (0.0%) |
| 4+ Person Household | 16 (80.0%) | 4 (20.0%) |
| Total Housing Units | 56 (56.6%) | 43 (43.4%) |
Occupancy by Educational Attainment in Goodyear Village
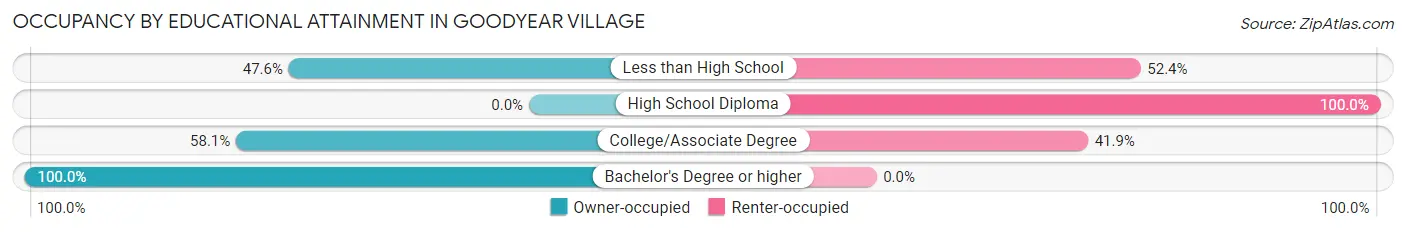
| Household Size | Owner-occupied | Renter-occupied |
| Less than High School | 20 (47.6%) | 22 (52.4%) |
| High School Diploma | 0 (0.0%) | 8 (100.0%) |
| College/Associate Degree | 18 (58.1%) | 13 (41.9%) |
| Bachelor's Degree or higher | 18 (100.0%) | 0 (0.0%) |
Occupancy by Age of Householder in Goodyear Village
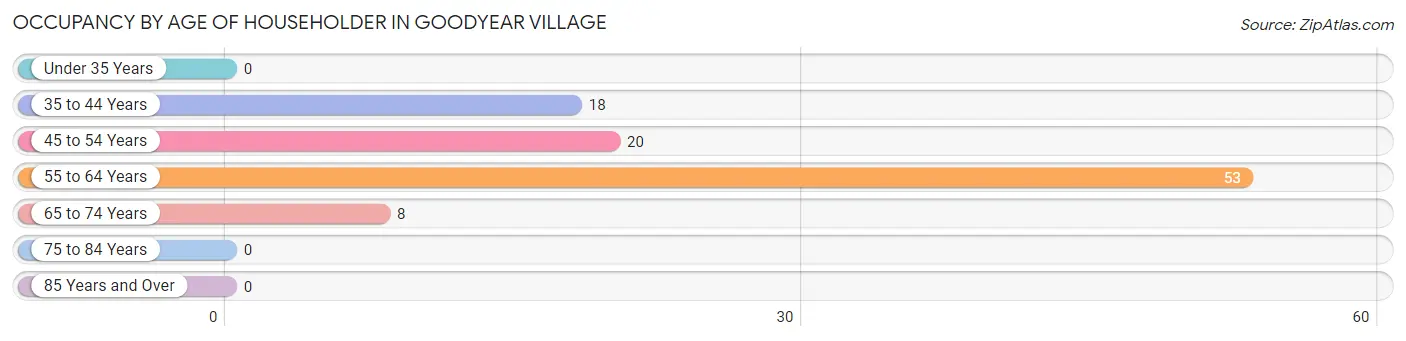
| Age Bracket | # Households | % Households |
| Under 35 Years | 0 | 0.0% |
| 35 to 44 Years | 18 | 18.2% |
| 45 to 54 Years | 20 | 20.2% |
| 55 to 64 Years | 53 | 53.5% |
| 65 to 74 Years | 8 | 8.1% |
| 75 to 84 Years | 0 | 0.0% |
| 85 Years and Over | 0 | 0.0% |
| Total | 99 | 100.0% |
Housing Finances in Goodyear Village
Median Income by Occupancy in Goodyear Village

| Occupancy Type | # Households | Median Income |
| Owner-Occupied | 56 (56.6%) | $0 |
| Renter-Occupied | 43 (43.4%) | $0 |
| Average | 99 (100.0%) | $0 |
Occupancy by Householder Income Bracket in Goodyear Village
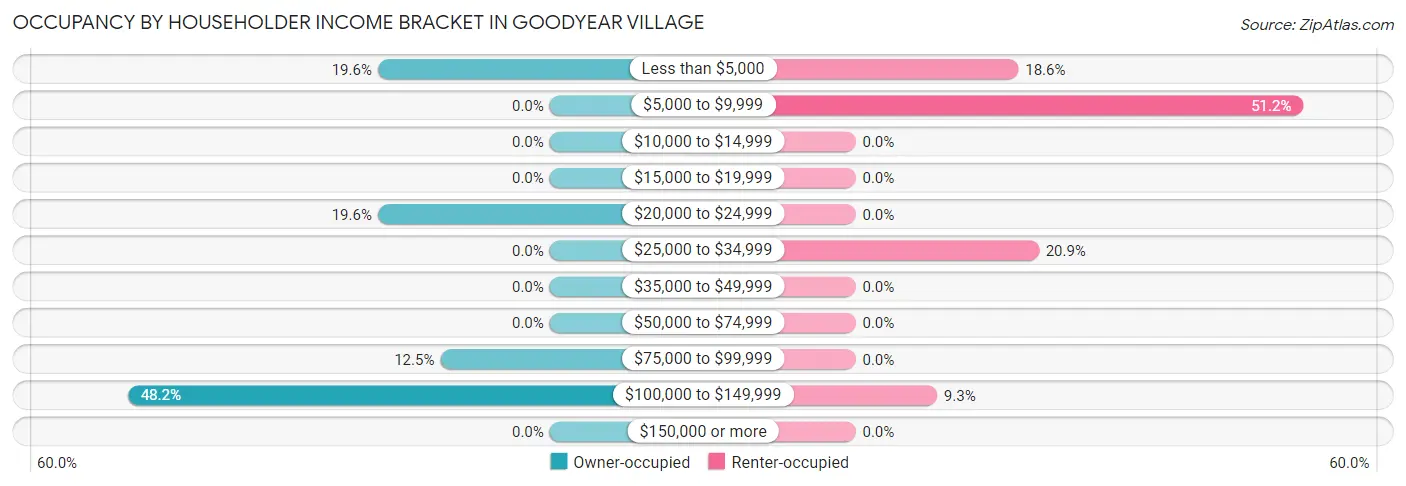
| Income Bracket | Owner-occupied | Renter-occupied |
| Less than $5,000 | 11 (19.6%) | 8 (18.6%) |
| $5,000 to $9,999 | 0 (0.0%) | 22 (51.2%) |
| $10,000 to $14,999 | 0 (0.0%) | 0 (0.0%) |
| $15,000 to $19,999 | 0 (0.0%) | 0 (0.0%) |
| $20,000 to $24,999 | 11 (19.6%) | 0 (0.0%) |
| $25,000 to $34,999 | 0 (0.0%) | 9 (20.9%) |
| $35,000 to $49,999 | 0 (0.0%) | 0 (0.0%) |
| $50,000 to $74,999 | 0 (0.0%) | 0 (0.0%) |
| $75,000 to $99,999 | 7 (12.5%) | 0 (0.0%) |
| $100,000 to $149,999 | 27 (48.2%) | 4 (9.3%) |
| $150,000 or more | 0 (0.0%) | 0 (0.0%) |
| Total | 56 (100.0%) | 43 (100.0%) |
Monthly Housing Cost Tiers in Goodyear Village
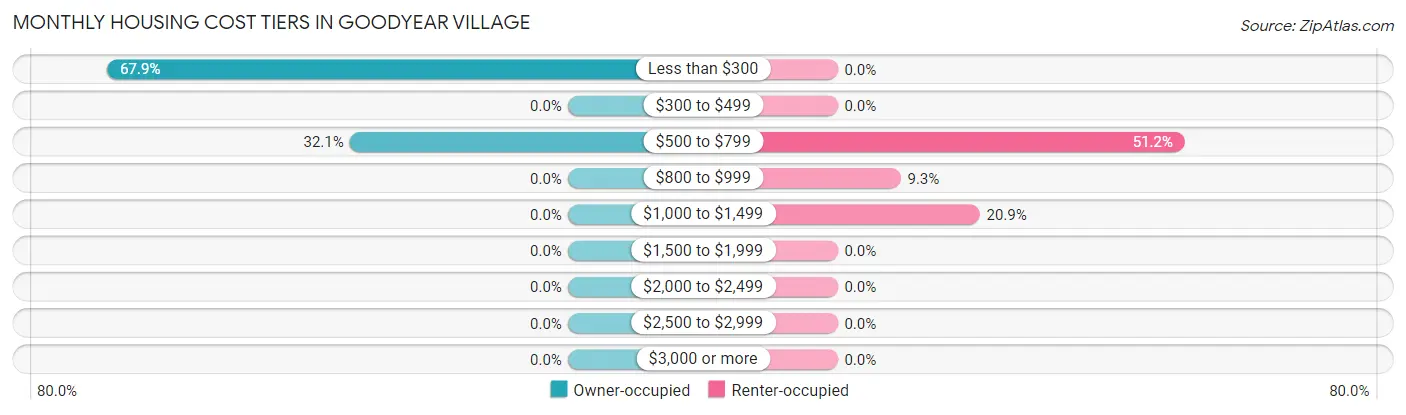
| Monthly Cost | Owner-occupied | Renter-occupied |
| Less than $300 | 38 (67.9%) | 0 (0.0%) |
| $300 to $499 | 0 (0.0%) | 0 (0.0%) |
| $500 to $799 | 18 (32.1%) | 22 (51.2%) |
| $800 to $999 | 0 (0.0%) | 4 (9.3%) |
| $1,000 to $1,499 | 0 (0.0%) | 9 (20.9%) |
| $1,500 to $1,999 | 0 (0.0%) | 0 (0.0%) |
| $2,000 to $2,499 | 0 (0.0%) | 0 (0.0%) |
| $2,500 to $2,999 | 0 (0.0%) | 0 (0.0%) |
| $3,000 or more | 0 (0.0%) | 0 (0.0%) |
| Total | 56 (100.0%) | 43 (100.0%) |
Physical Housing Characteristics in Goodyear Village
Housing Structures in Goodyear Village
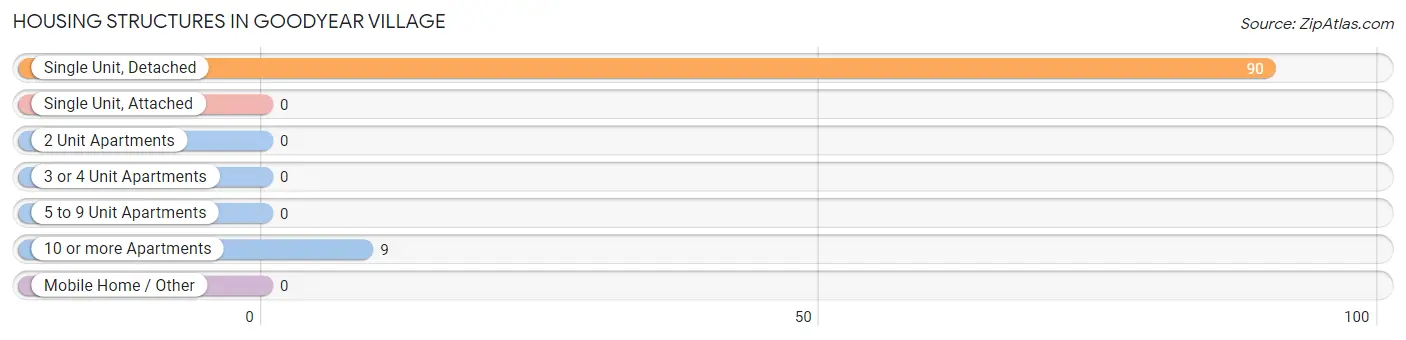
| Structure Type | # Housing Units | % Housing Units |
| Single Unit, Detached | 90 | 90.9% |
| Single Unit, Attached | 0 | 0.0% |
| 2 Unit Apartments | 0 | 0.0% |
| 3 or 4 Unit Apartments | 0 | 0.0% |
| 5 to 9 Unit Apartments | 0 | 0.0% |
| 10 or more Apartments | 9 | 9.1% |
| Mobile Home / Other | 0 | 0.0% |
| Total | 99 | 100.0% |
Housing Structures by Occupancy in Goodyear Village
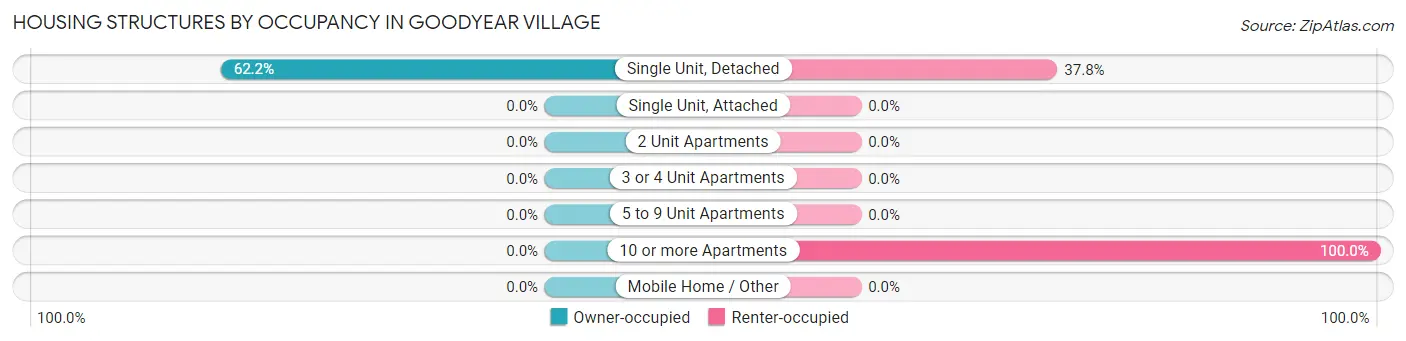
| Structure Type | Owner-occupied | Renter-occupied |
| Single Unit, Detached | 56 (62.2%) | 34 (37.8%) |
| Single Unit, Attached | 0 (0.0%) | 0 (0.0%) |
| 2 Unit Apartments | 0 (0.0%) | 0 (0.0%) |
| 3 or 4 Unit Apartments | 0 (0.0%) | 0 (0.0%) |
| 5 to 9 Unit Apartments | 0 (0.0%) | 0 (0.0%) |
| 10 or more Apartments | 0 (0.0%) | 9 (100.0%) |
| Mobile Home / Other | 0 (0.0%) | 0 (0.0%) |
| Total | 56 (56.6%) | 43 (43.4%) |
Housing Structures by Number of Rooms in Goodyear Village
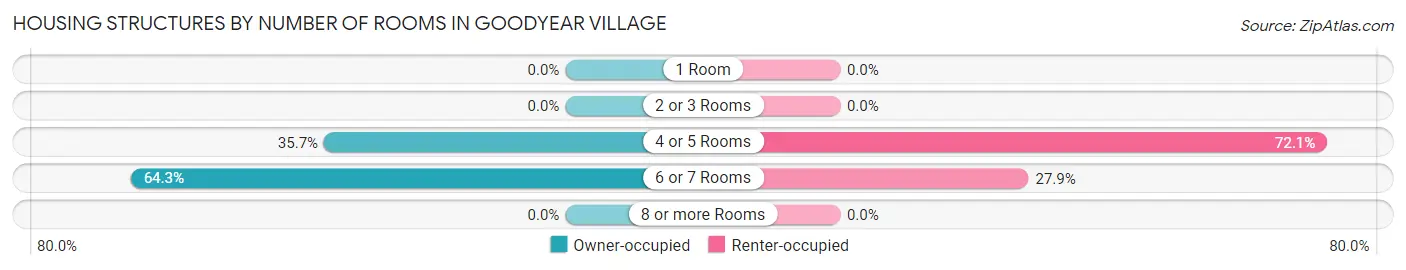
| Number of Rooms | Owner-occupied | Renter-occupied |
| 1 Room | 0 (0.0%) | 0 (0.0%) |
| 2 or 3 Rooms | 0 (0.0%) | 0 (0.0%) |
| 4 or 5 Rooms | 20 (35.7%) | 31 (72.1%) |
| 6 or 7 Rooms | 36 (64.3%) | 12 (27.9%) |
| 8 or more Rooms | 0 (0.0%) | 0 (0.0%) |
| Total | 56 (100.0%) | 43 (100.0%) |
Housing Structure by Heating Type in Goodyear Village
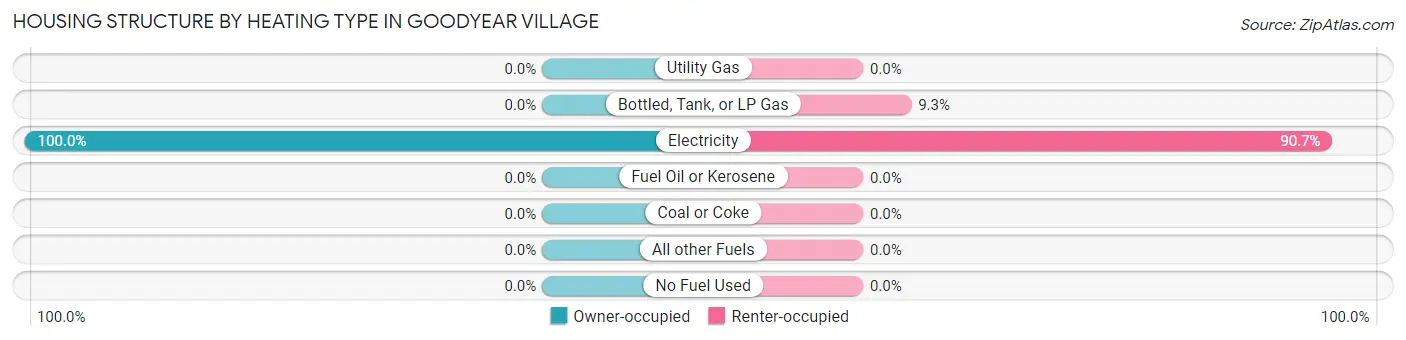
| Heating Type | Owner-occupied | Renter-occupied |
| Utility Gas | 0 (0.0%) | 0 (0.0%) |
| Bottled, Tank, or LP Gas | 0 (0.0%) | 4 (9.3%) |
| Electricity | 56 (100.0%) | 39 (90.7%) |
| Fuel Oil or Kerosene | 0 (0.0%) | 0 (0.0%) |
| Coal or Coke | 0 (0.0%) | 0 (0.0%) |
| All other Fuels | 0 (0.0%) | 0 (0.0%) |
| No Fuel Used | 0 (0.0%) | 0 (0.0%) |
| Total | 56 (100.0%) | 43 (100.0%) |
Household Vehicle Usage in Goodyear Village
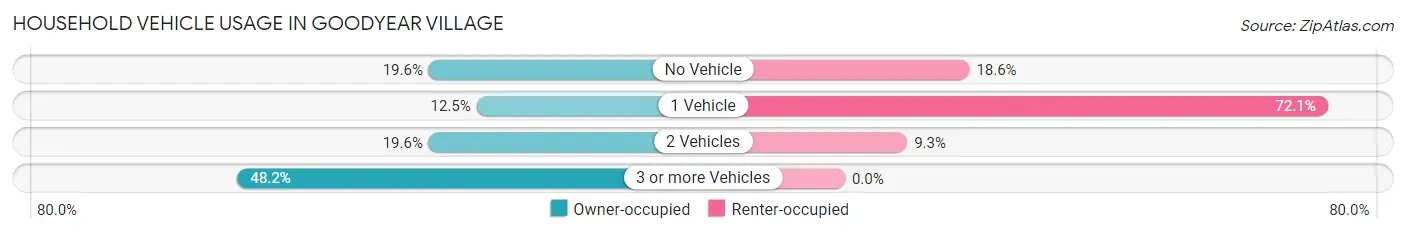
| Vehicles per Household | Owner-occupied | Renter-occupied |
| No Vehicle | 11 (19.6%) | 8 (18.6%) |
| 1 Vehicle | 7 (12.5%) | 31 (72.1%) |
| 2 Vehicles | 11 (19.6%) | 4 (9.3%) |
| 3 or more Vehicles | 27 (48.2%) | 0 (0.0%) |
| Total | 56 (100.0%) | 43 (100.0%) |
Real Estate & Mortgages in Goodyear Village
Real Estate and Mortgage Overview in Goodyear Village
| Characteristic | Without Mortgage | With Mortgage |
| Housing Units | 38 | 18 |
| Median Property Value | $91,100 | $0 |
| Median Household Income | - | - |
| Monthly Housing Costs | $114 | $0 |
| Real Estate Taxes | - | - |
Property Value by Mortgage Status in Goodyear Village
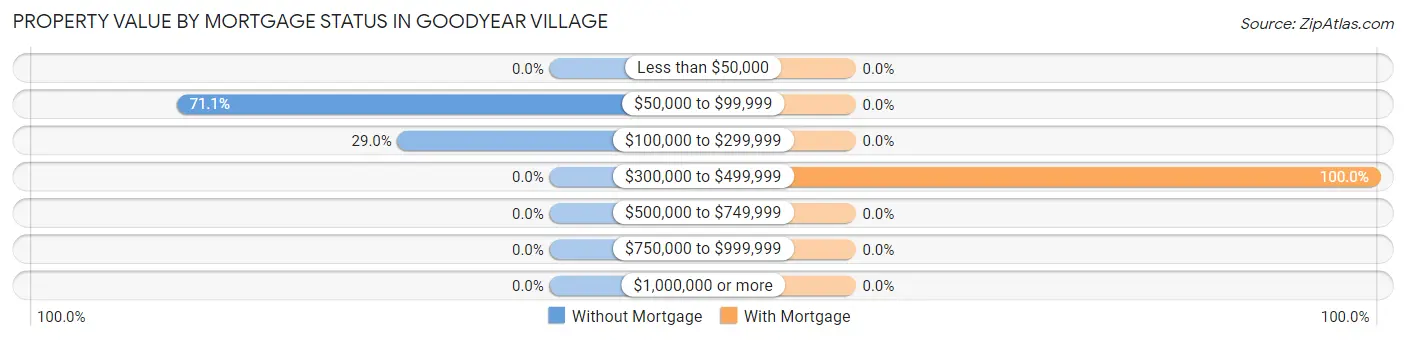
| Property Value | Without Mortgage | With Mortgage |
| Less than $50,000 | 0 (0.0%) | 0 (0.0%) |
| $50,000 to $99,999 | 27 (71.1%) | 0 (0.0%) |
| $100,000 to $299,999 | 11 (28.9%) | 0 (0.0%) |
| $300,000 to $499,999 | 0 (0.0%) | 18 (100.0%) |
| $500,000 to $749,999 | 0 (0.0%) | 0 (0.0%) |
| $750,000 to $999,999 | 0 (0.0%) | 0 (0.0%) |
| $1,000,000 or more | 0 (0.0%) | 0 (0.0%) |
| Total | 38 (100.0%) | 18 (100.0%) |
Household Income by Mortgage Status in Goodyear Village
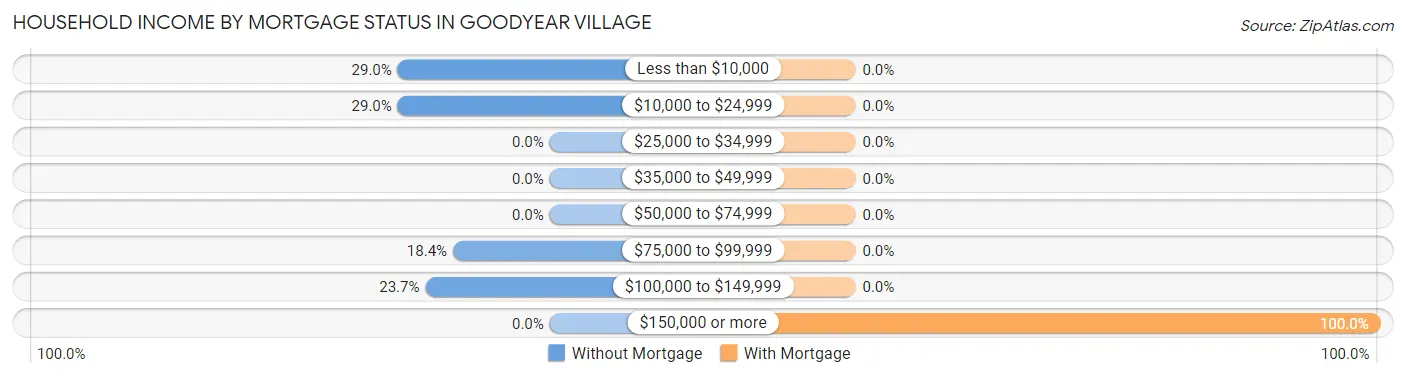
| Household Income | Without Mortgage | With Mortgage |
| Less than $10,000 | 11 (28.9%) | 0 (0.0%) |
| $10,000 to $24,999 | 11 (28.9%) | 0 (0.0%) |
| $25,000 to $34,999 | 0 (0.0%) | 0 (0.0%) |
| $35,000 to $49,999 | 0 (0.0%) | 0 (0.0%) |
| $50,000 to $74,999 | 0 (0.0%) | 0 (0.0%) |
| $75,000 to $99,999 | 7 (18.4%) | 0 (0.0%) |
| $100,000 to $149,999 | 9 (23.7%) | 0 (0.0%) |
| $150,000 or more | 0 (0.0%) | 18 (100.0%) |
| Total | 38 (100.0%) | 18 (100.0%) |
Property Value to Household Income Ratio in Goodyear Village
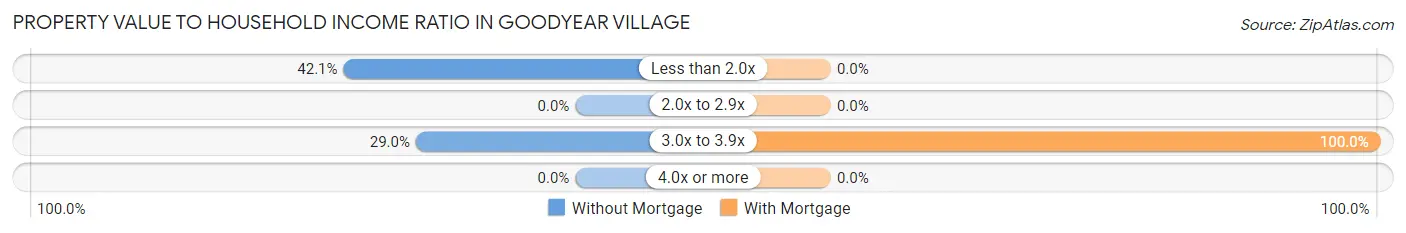
| Value-to-Income Ratio | Without Mortgage | With Mortgage |
| Less than 2.0x | 16 (42.1%) | 0 (0.0%) |
| 2.0x to 2.9x | 0 (0.0%) | 0 (0.0%) |
| 3.0x to 3.9x | 11 (28.9%) | 18 (100.0%) |
| 4.0x or more | 0 (0.0%) | 0 (0.0%) |
| Total | 38 (100.0%) | 18 (100.0%) |
Real Estate Taxes by Mortgage Status in Goodyear Village
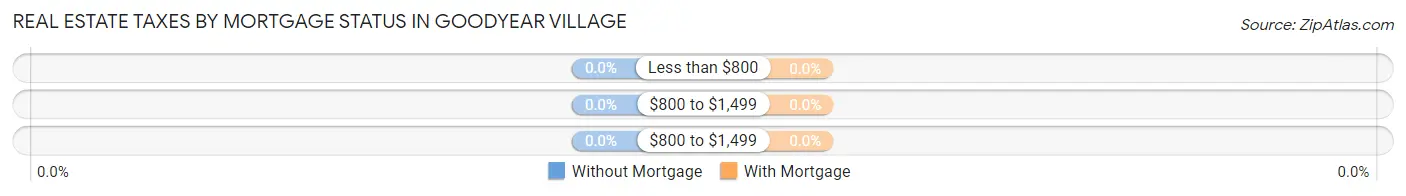
| Property Taxes | Without Mortgage | With Mortgage |
| Less than $800 | 0 (0.0%) | 0 (0.0%) |
| $800 to $1,499 | 0 (0.0%) | 0 (0.0%) |
| $800 to $1,499 | 0 (0.0%) | 0 (0.0%) |
| Total | 38 (100.0%) | 18 (100.0%) |
Health & Disability in Goodyear Village
Health Insurance Coverage by Age in Goodyear Village
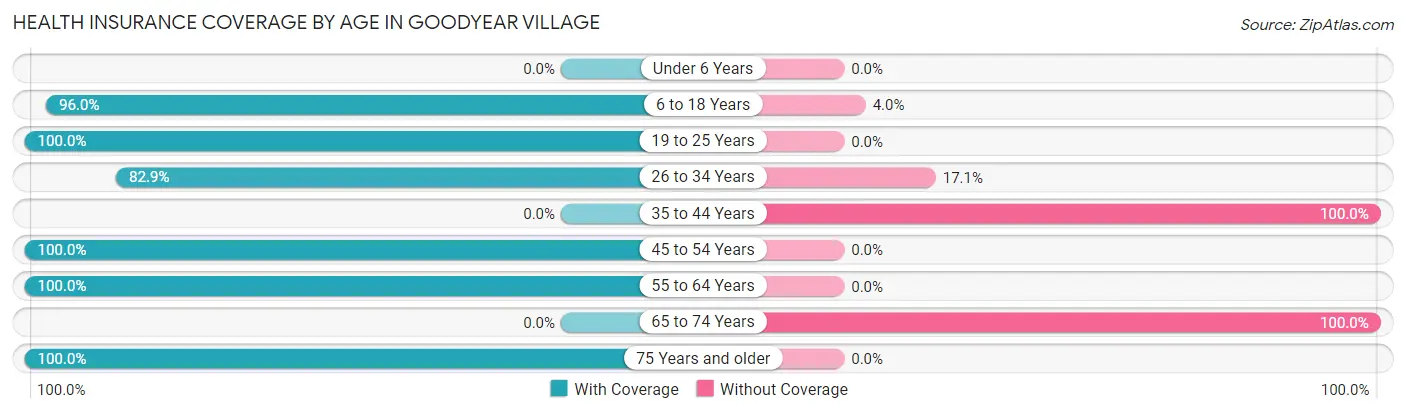
| Age Bracket | With Coverage | Without Coverage |
| Under 6 Years | 0 (0.0%) | 0 (0.0%) |
| 6 to 18 Years | 48 (96.0%) | 2 (4.0%) |
| 19 to 25 Years | 58 (100.0%) | 0 (0.0%) |
| 26 to 34 Years | 34 (82.9%) | 7 (17.1%) |
| 35 to 44 Years | 0 (0.0%) | 18 (100.0%) |
| 45 to 54 Years | 55 (100.0%) | 0 (0.0%) |
| 55 to 64 Years | 94 (100.0%) | 0 (0.0%) |
| 65 to 74 Years | 0 (0.0%) | 8 (100.0%) |
| 75 Years and older | 8 (100.0%) | 0 (0.0%) |
| Total | 297 (89.5%) | 35 (10.5%) |
Health Insurance Coverage by Citizenship Status in Goodyear Village
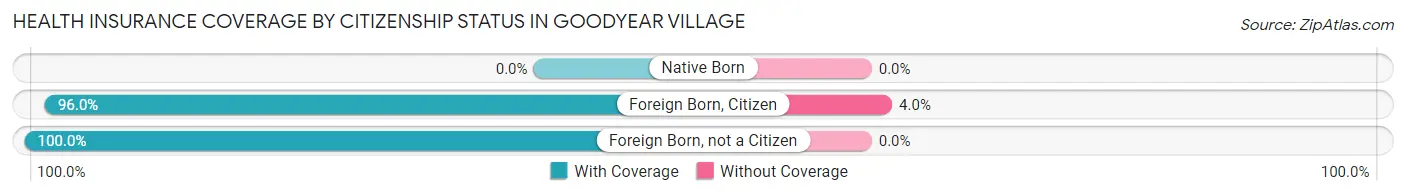
| Citizenship Status | With Coverage | Without Coverage |
| Native Born | 0 (0.0%) | 0 (0.0%) |
| Foreign Born, Citizen | 48 (96.0%) | 2 (4.0%) |
| Foreign Born, not a Citizen | 58 (100.0%) | 0 (0.0%) |
Health Insurance Coverage by Household Income in Goodyear Village
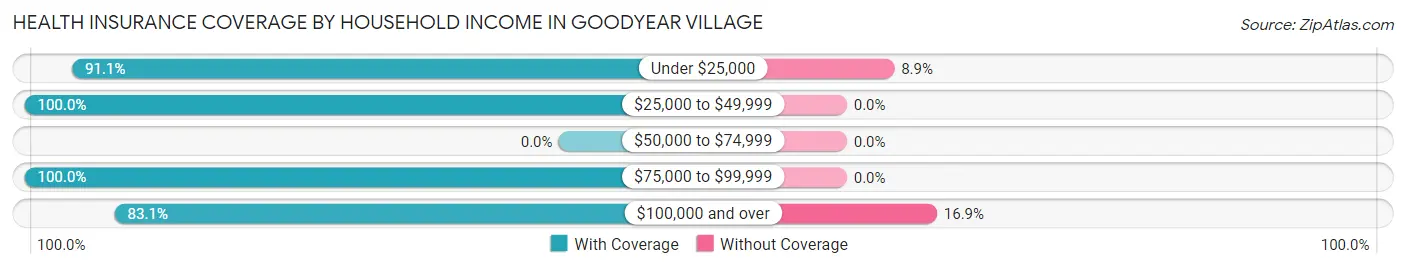
| Household Income | With Coverage | Without Coverage |
| Under $25,000 | 82 (91.1%) | 8 (8.9%) |
| $25,000 to $49,999 | 24 (100.0%) | 0 (0.0%) |
| $50,000 to $74,999 | 0 (0.0%) | 0 (0.0%) |
| $75,000 to $99,999 | 58 (100.0%) | 0 (0.0%) |
| $100,000 and over | 133 (83.1%) | 27 (16.9%) |
Public vs Private Health Insurance Coverage by Age in Goodyear Village
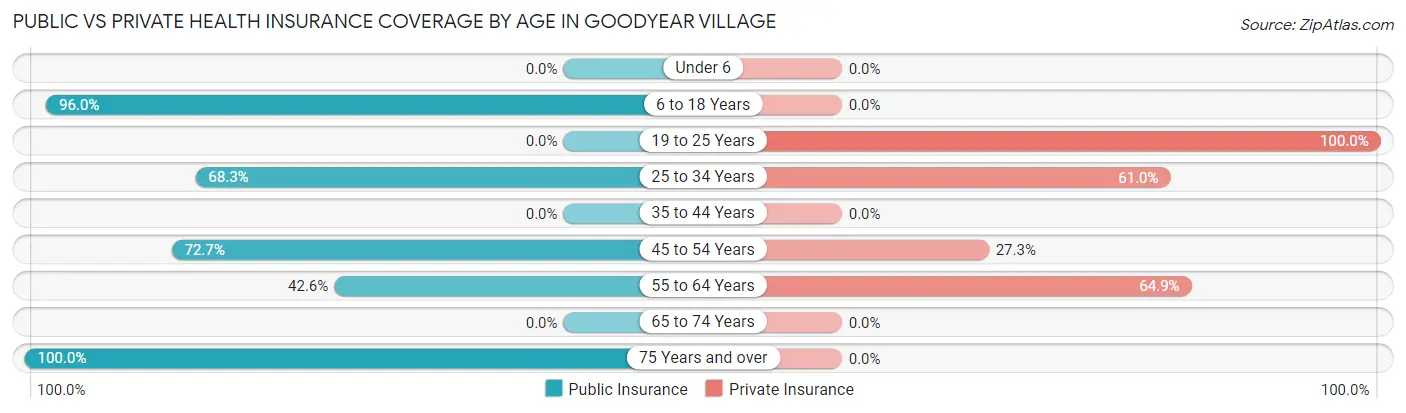
| Age Bracket | Public Insurance | Private Insurance |
| Under 6 | 0 (0.0%) | 0 (0.0%) |
| 6 to 18 Years | 48 (96.0%) | 0 (0.0%) |
| 19 to 25 Years | 0 (0.0%) | 58 (100.0%) |
| 25 to 34 Years | 28 (68.3%) | 25 (61.0%) |
| 35 to 44 Years | 0 (0.0%) | 0 (0.0%) |
| 45 to 54 Years | 40 (72.7%) | 15 (27.3%) |
| 55 to 64 Years | 40 (42.5%) | 61 (64.9%) |
| 65 to 74 Years | 0 (0.0%) | 0 (0.0%) |
| 75 Years and over | 8 (100.0%) | 0 (0.0%) |
| Total | 164 (49.4%) | 159 (47.9%) |
Disability Status by Sex by Age in Goodyear Village
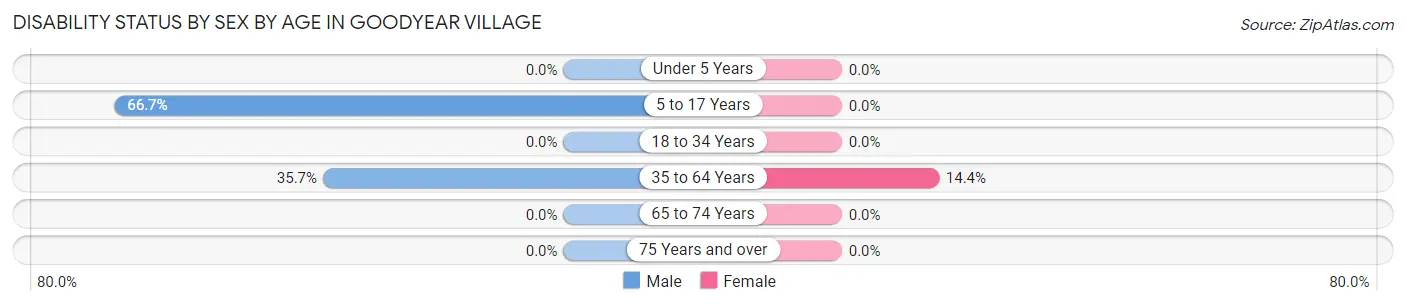
| Age Bracket | Male | Female |
| Under 5 Years | 0 (0.0%) | 0 (0.0%) |
| 5 to 17 Years | 18 (66.7%) | 0 (0.0%) |
| 18 to 34 Years | 0 (0.0%) | 0 (0.0%) |
| 35 to 64 Years | 20 (35.7%) | 16 (14.4%) |
| 65 to 74 Years | 0 (0.0%) | 0 (0.0%) |
| 75 Years and over | 0 (0.0%) | 0 (0.0%) |
Disability Class by Sex by Age in Goodyear Village
Disability Class: Hearing Difficulty
| Age Bracket | Male | Female |
| Under 5 Years | 0 (0.0%) | 0 (0.0%) |
| 5 to 17 Years | 0 (0.0%) | 0 (0.0%) |
| 18 to 34 Years | 0 (0.0%) | 0 (0.0%) |
| 35 to 64 Years | 0 (0.0%) | 0 (0.0%) |
| 65 to 74 Years | 0 (0.0%) | 0 (0.0%) |
| 75 Years and over | 0 (0.0%) | 0 (0.0%) |
Disability Class: Vision Difficulty
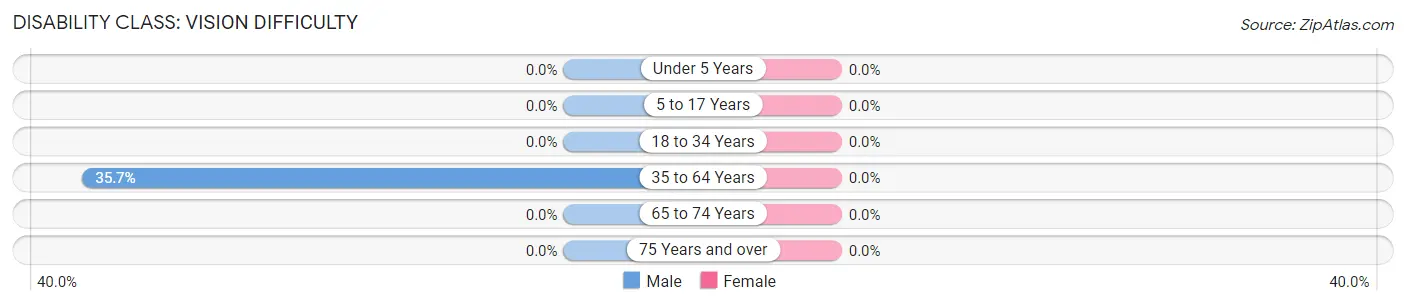
| Age Bracket | Male | Female |
| Under 5 Years | 0 (0.0%) | 0 (0.0%) |
| 5 to 17 Years | 0 (0.0%) | 0 (0.0%) |
| 18 to 34 Years | 0 (0.0%) | 0 (0.0%) |
| 35 to 64 Years | 20 (35.7%) | 0 (0.0%) |
| 65 to 74 Years | 0 (0.0%) | 0 (0.0%) |
| 75 Years and over | 0 (0.0%) | 0 (0.0%) |
Disability Class: Cognitive Difficulty
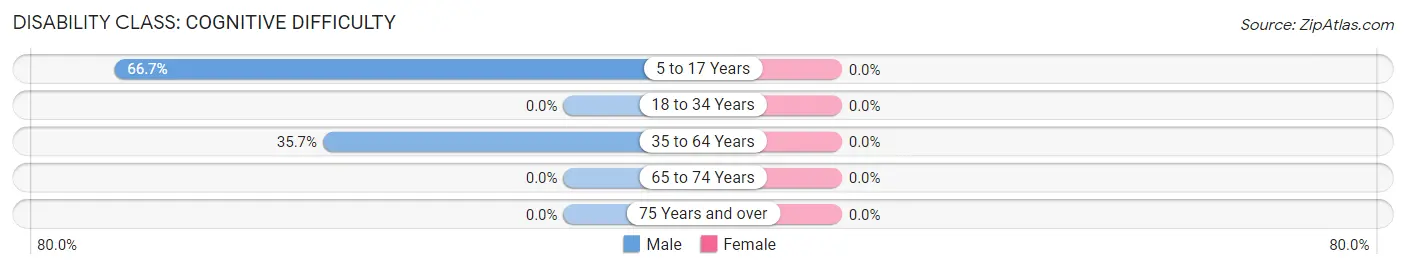
| Age Bracket | Male | Female |
| 5 to 17 Years | 18 (66.7%) | 0 (0.0%) |
| 18 to 34 Years | 0 (0.0%) | 0 (0.0%) |
| 35 to 64 Years | 20 (35.7%) | 0 (0.0%) |
| 65 to 74 Years | 0 (0.0%) | 0 (0.0%) |
| 75 Years and over | 0 (0.0%) | 0 (0.0%) |
Disability Class: Ambulatory Difficulty
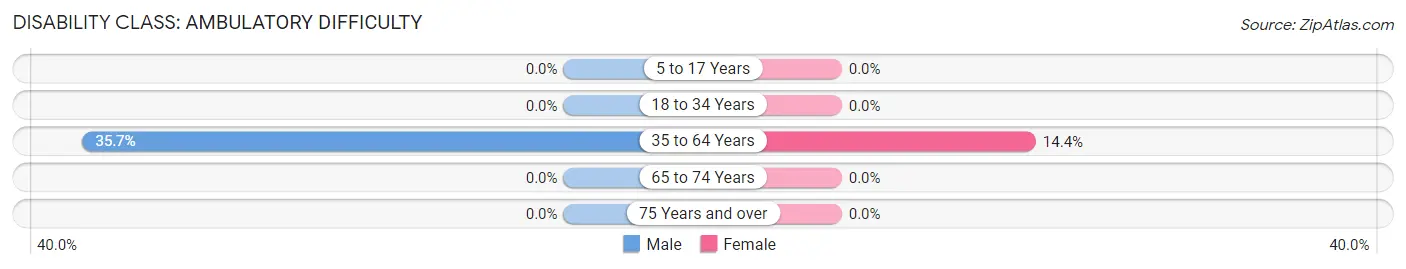
| Age Bracket | Male | Female |
| 5 to 17 Years | 0 (0.0%) | 0 (0.0%) |
| 18 to 34 Years | 0 (0.0%) | 0 (0.0%) |
| 35 to 64 Years | 20 (35.7%) | 16 (14.4%) |
| 65 to 74 Years | 0 (0.0%) | 0 (0.0%) |
| 75 Years and over | 0 (0.0%) | 0 (0.0%) |
Disability Class: Self-Care Difficulty
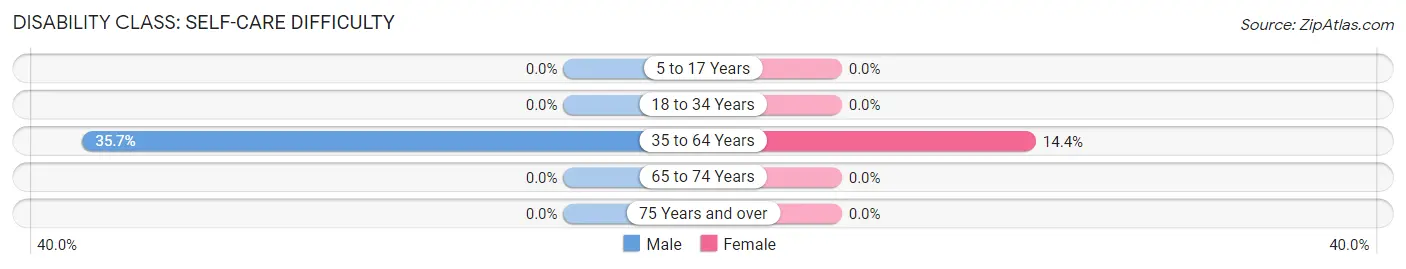
| Age Bracket | Male | Female |
| 5 to 17 Years | 0 (0.0%) | 0 (0.0%) |
| 18 to 34 Years | 0 (0.0%) | 0 (0.0%) |
| 35 to 64 Years | 20 (35.7%) | 16 (14.4%) |
| 65 to 74 Years | 0 (0.0%) | 0 (0.0%) |
| 75 Years and over | 0 (0.0%) | 0 (0.0%) |
Technology Access in Goodyear Village
Computing Device Access in Goodyear Village
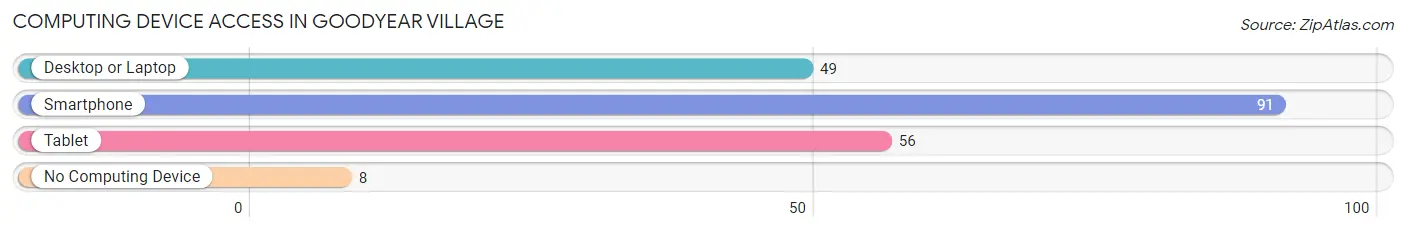
| Device Type | # Households | % Households |
| Desktop or Laptop | 49 | 49.5% |
| Smartphone | 91 | 91.9% |
| Tablet | 56 | 56.6% |
| No Computing Device | 8 | 8.1% |
| Total | 99 | 100.0% |
Internet Access in Goodyear Village
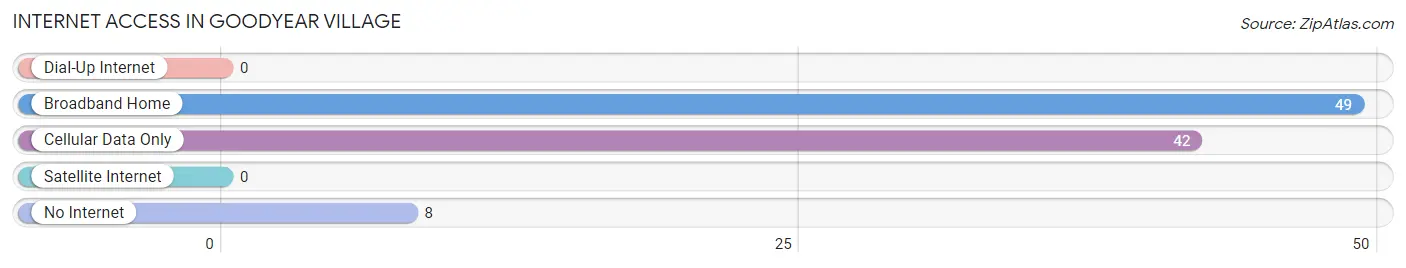
| Internet Type | # Households | % Households |
| Dial-Up Internet | 0 | 0.0% |
| Broadband Home | 49 | 49.5% |
| Cellular Data Only | 42 | 42.4% |
| Satellite Internet | 0 | 0.0% |
| No Internet | 8 | 8.1% |
| Total | 99 | 100.0% |
Goodyear Village Summary
Goodyear Village is a small, unincorporated community located in Maricopa County, Arizona. It is situated in the Sonoran Desert, approximately 25 miles west of Phoenix. The community is bordered by the cities of Avondale, Buckeye, and Litchfield Park. Goodyear Village is home to approximately 1,000 people, and is known for its rural atmosphere and small-town charm.
Geography
Goodyear Village is located in the Sonoran Desert, at an elevation of 1,100 feet. The area is characterized by its hot, dry climate, with temperatures ranging from the mid-90s in the summer to the mid-60s in the winter. The area receives an average of 8 inches of rain per year. The terrain is mostly flat, with some rolling hills. The area is home to a variety of wildlife, including coyotes, jackrabbits, and roadrunners.
Economy
Goodyear Village is primarily a residential community, with most of its residents employed in nearby cities. The area is home to a few small businesses, including a convenience store, a gas station, and a few restaurants. The community is also home to a number of farms, which produce a variety of crops, including cotton, alfalfa, and wheat.
Demographics
As of the 2010 census, Goodyear Village had a population of 1,000 people. The population is predominantly white (90%), with the remaining 10% being Hispanic or Latino. The median household income is $45,000, and the median home value is $150,000. The unemployment rate is 5.5%.
History
Goodyear Village was founded in the late 1800s by a group of settlers from the Midwest. The area was originally known as “Goodyear’s Ranch”, after the family who owned the land. The area was primarily used for farming and ranching, and the community grew slowly over the years. In the early 1900s, the area was renamed “Goodyear Village”, and the first post office was established in 1912.
In the 1950s, the area began to experience rapid growth, as more people moved to the area to take advantage of the area’s rural atmosphere and proximity to Phoenix. The population continued to grow throughout the 1960s and 1970s, and the area was eventually annexed by the city of Avondale in the 1980s.
Today, Goodyear Village is a small, unincorporated community that is known for its rural atmosphere and small-town charm. The area is home to a variety of businesses, farms, and restaurants, and is a popular destination for those looking to escape the hustle and bustle of the city.
Common Questions
What is Per Capita Income in Goodyear Village?
Per Capita income in Goodyear Village is $20,267.
What is the Median Family Income in Goodyear Village?
Median Family Income in Goodyear Village is $125,278.
What is Income or Wage Gap in Goodyear Village?
Income or Wage Gap in Goodyear Village is 11.9%.
Women in Goodyear Village earn 88.1 cents for every dollar earned by a man.
What is Inequality or Gini Index in Goodyear Village?
Inequality or Gini Index in Goodyear Village is 0.56.
What is the Total Population of Goodyear Village?
Total Population of Goodyear Village is 332.
What is the Total Male Population of Goodyear Village?
Total Male Population of Goodyear Village is 164.
What is the Total Female Population of Goodyear Village?
Total Female Population of Goodyear Village is 168.
What is the Ratio of Males per 100 Females in Goodyear Village?
There are 97.62 Males per 100 Females in Goodyear Village.
What is the Ratio of Females per 100 Males in Goodyear Village?
There are 102.44 Females per 100 Males in Goodyear Village.
What is the Median Population Age in Goodyear Village?
Median Population Age in Goodyear Village is 36.9 Years.
What is the Average Family Size in Goodyear Village
Average Family Size in Goodyear Village is 5.0 People.
What is the Average Household Size in Goodyear Village
Average Household Size in Goodyear Village is 3.4 People.
How Large is the Labor Force in Goodyear Village?
There are 162 People in the Labor Forcein in Goodyear Village.
What is the Percentage of People in the Labor Force in Goodyear Village?
57.4% of People are in the Labor Force in Goodyear Village.
What is the Unemployment Rate in Goodyear Village?
Unemployment Rate in Goodyear Village is 17.9%.