Tlingit-Haida 3 or more Vehicles in Household
COMPARE
Tlingit-Haida
Select to Compare
3 or more Vehicles in Household
Tlingit-Haida 3 or more Vehicles in Household
19.9%
3+ VEHICLES AVAILABLE
73.4/ 100
METRIC RATING
155th/ 347
METRIC RANK
Tlingit-Haida 3 or more Vehicles in Household Correlation Chart
The statistical analysis conducted on geographies consisting of 60,850,573 people shows a weak negative correlation between the proportion of Tlingit-Haida and percentage of households with 3 or more vehicles available in the United States with a correlation coefficient (R) of -0.295 and weighted average of 19.9%. On average, for every 1% (one percent) increase in Tlingit-Haida within a typical geography, there is a decrease of 0.12% in percentage of households with 3 or more vehicles available.
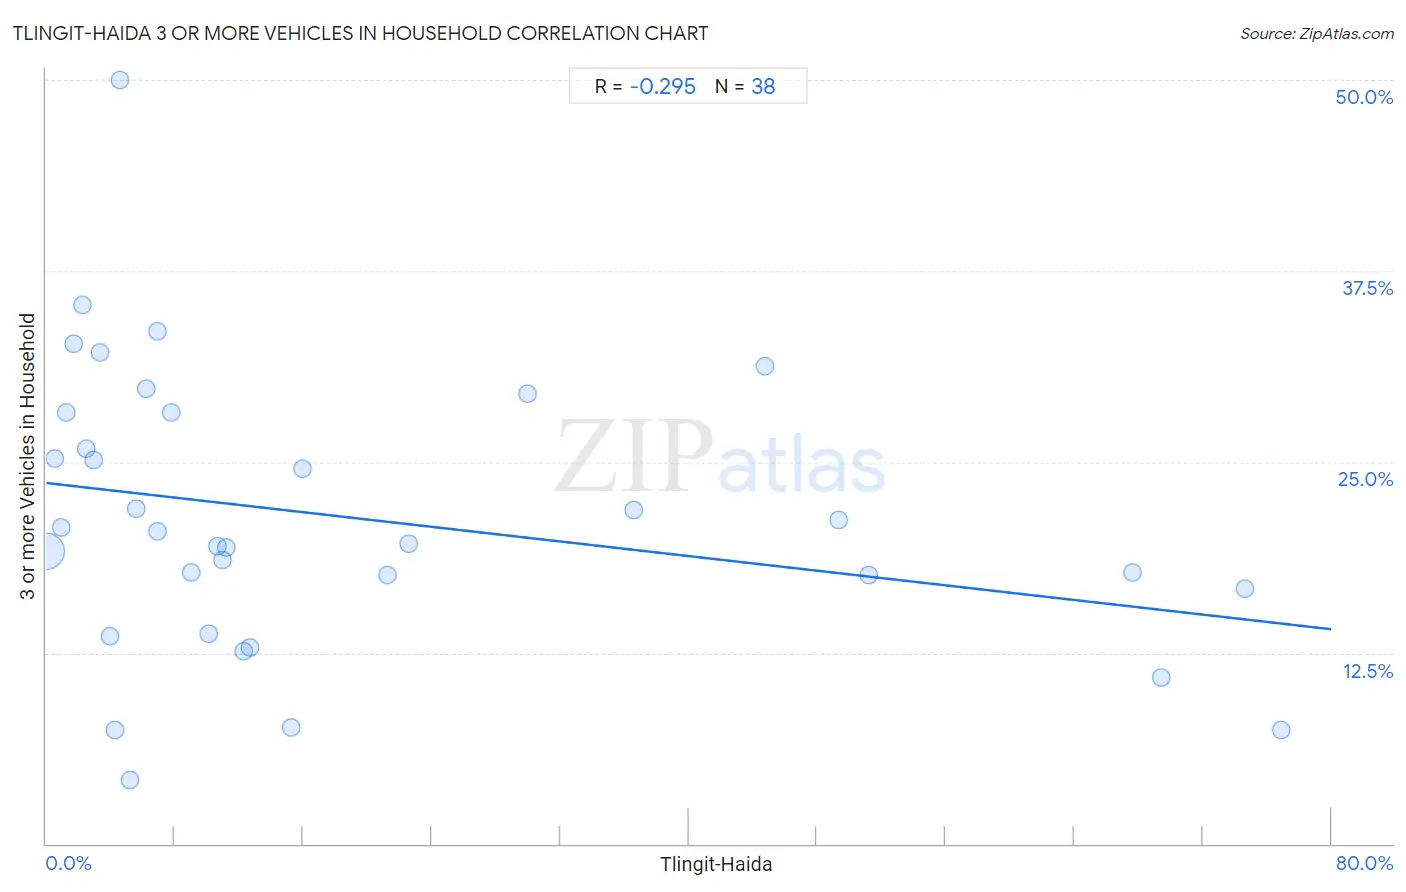
It is essential to understand that the correlation between the percentage of Tlingit-Haida and percentage of households with 3 or more vehicles available does not imply a direct cause-and-effect relationship. It remains uncertain whether the presence of Tlingit-Haida influences an upward or downward trend in the level of percentage of households with 3 or more vehicles available within an area, or if Tlingit-Haida simply ended up residing in those areas with higher or lower levels of percentage of households with 3 or more vehicles available due to other factors.
Demographics Similar to Tlingit-Haida by 3 or more Vehicles in Household
In terms of 3 or more vehicles in household, the demographic groups most similar to Tlingit-Haida are Immigrants from Jordan (19.9%, a difference of 0.15%), Thai (19.8%, a difference of 0.21%), Yuman (19.9%, a difference of 0.22%), Hungarian (19.8%, a difference of 0.26%), and Armenian (19.8%, a difference of 0.42%).
| Demographics | Rating | Rank | 3 or more Vehicles in Household |
| Guatemalans | 82.6 /100 | #148 | Excellent 20.1% |
| Immigrants from Iran | 80.9 /100 | #149 | Excellent 20.0% |
| Immigrants | 80.8 /100 | #150 | Excellent 20.0% |
| Taiwanese | 80.6 /100 | #151 | Excellent 20.0% |
| Lebanese | 79.8 /100 | #152 | Good 20.0% |
| Yuman | 75.6 /100 | #153 | Good 19.9% |
| Immigrants from Jordan | 75.0 /100 | #154 | Good 19.9% |
| Tlingit-Haida | 73.4 /100 | #155 | Good 19.9% |
| Thais | 71.1 /100 | #156 | Good 19.8% |
| Hungarians | 70.5 /100 | #157 | Good 19.8% |
| Armenians | 68.8 /100 | #158 | Good 19.8% |
| Immigrants from Pakistan | 68.2 /100 | #159 | Good 19.8% |
| Immigrants from Lebanon | 67.6 /100 | #160 | Good 19.8% |
| Immigrants from Guatemala | 65.6 /100 | #161 | Good 19.7% |
| Estonians | 63.2 /100 | #162 | Good 19.7% |
Tlingit-Haida 3 or more Vehicles in Household Correlation Summary
| Measurement | Tlingit-Haida Data | 3 or more Vehicles in Household Data |
| Minimum | 0.036% | 4.2% |
| Maximum | 76.8% | 50.0% |
| Range | 76.8% | 45.8% |
| Mean | 18.9% | 21.4% |
| Median | 9.6% | 20.0% |
| Interquartile 25% (IQ1) | 4.0% | 16.7% |
| Interquartile 75% (IQ3) | 22.6% | 28.2% |
| Interquartile Range (IQR) | 18.6% | 11.5% |
| Standard Deviation (Sample) | 22.8% | 9.2% |
| Standard Deviation (Population) | 22.5% | 9.1% |
Correlation Details
| Tlingit-Haida Percentile | Sample Size | 3 or more Vehicles in Household |
[ 0.0% - 0.5% ] 0.036% | 59,016,735 | 19.1% |
[ 0.5% - 1.0% ] 0.54% | 1,311,133 | 25.2% |
[ 0.5% - 1.0% ] 0.91% | 246,810 | 20.7% |
[ 1.0% - 1.5% ] 1.24% | 85,687 | 28.3% |
[ 1.5% - 2.0% ] 1.71% | 23,263 | 32.8% |
[ 2.0% - 2.5% ] 2.28% | 8,447 | 35.3% |
[ 2.0% - 2.5% ] 2.46% | 3,655 | 25.8% |
[ 2.5% - 3.0% ] 2.92% | 6,231 | 25.1% |
[ 3.0% - 3.5% ] 3.33% | 10,388 | 32.2% |
[ 3.5% - 4.0% ] 3.97% | 1,964 | 13.6% |
[ 4.0% - 4.5% ] 4.26% | 47 | 7.4% |
[ 4.5% - 5.0% ] 4.62% | 822 | 50.0% |
[ 5.0% - 5.5% ] 5.24% | 420 | 4.2% |
[ 5.5% - 6.0% ] 5.62% | 1,762 | 22.0% |
[ 6.0% - 6.5% ] 6.21% | 177 | 29.8% |
[ 6.5% - 7.0% ] 6.91% | 564 | 33.6% |
[ 6.5% - 7.0% ] 6.94% | 2,146 | 20.5% |
[ 7.5% - 8.0% ] 7.80% | 1,257 | 28.2% |
[ 8.5% - 9.0% ] 9.00% | 6,691 | 17.8% |
[ 10.0% - 10.5% ] 10.13% | 2,902 | 13.7% |
[ 10.5% - 11.0% ] 10.70% | 29,933 | 19.5% |
[ 11.0% - 11.5% ] 11.00% | 32,108 | 18.5% |
[ 11.0% - 11.5% ] 11.18% | 13,913 | 19.4% |
[ 12.0% - 12.5% ] 12.26% | 18,041 | 12.6% |
[ 12.5% - 13.0% ] 12.66% | 8,647 | 12.8% |
[ 15.0% - 15.5% ] 15.26% | 2,169 | 7.6% |
[ 15.5% - 16.0% ] 15.92% | 1,727 | 24.6% |
[ 21.0% - 21.5% ] 21.23% | 4,267 | 17.6% |
[ 22.5% - 23.0% ] 22.55% | 1,073 | 19.6% |
[ 29.5% - 30.0% ] 29.96% | 1,128 | 29.4% |
[ 36.5% - 37.0% ] 36.59% | 82 | 21.9% |
[ 44.5% - 45.0% ] 44.78% | 920 | 31.3% |
[ 49.0% - 49.5% ] 49.33% | 1,792 | 21.2% |
[ 51.0% - 51.5% ] 51.24% | 804 | 17.6% |
[ 67.5% - 68.0% ] 67.59% | 361 | 17.8% |
[ 69.0% - 69.5% ] 69.41% | 1,602 | 10.9% |
[ 74.5% - 75.0% ] 74.63% | 67 | 16.7% |
[ 76.5% - 77.0% ] 76.85% | 838 | 7.4% |