Immigrants from Senegal 3 or more Vehicles in Household

COMPARE

Immigrants from Senegal
Race
Ancestry
AfghanAfricanAlaska NativeAlaskan AthabascanAlbanianAleutAlsatianAmericanApacheArabArapahoArgentineanArmenianAssyrian/Chaldean/SyriacAustralianAustrianBahamianBangladeshiBarbadianBasqueBelgianBelizeanBermudanBhutaneseBlackfeetBolivianBrazilianBritishBritish West IndianBulgarianBurmeseCajunCambodianCanadianCape VerdeanCarpatho RusynCelticCentral AmericanCentral American IndianCherokeeCheyenneChickasawChileanChineseChippewaChoctawColombianColvilleComancheCosta RicanCreeCreekCroatianCrowCubanCypriotCzechCzechoslovakianDanishDelawareDominicanDutchDutch West IndianEastern EuropeanEcuadorianEgyptianEnglishEstonianEthiopianEuropeanFijianFilipinoFinnishFrenchFrench American IndianFrench CanadianGermanGerman RussianGhanaianGreekGuamanian/ChamorroGuatemalanGuyaneseHaitianHmongHonduranHopiHoumaHungarianIcelanderIndian (Asian)IndonesianInupiatIranianIraqiIrishIroquoisIsraeliItalianJamaicanJapaneseJordanianKenyanKiowaKoreanLaotianLatvianLebaneseLiberianLithuanianLumbeeLuxembourgerMacedonianMalaysianMalteseMarshalleseMenomineeMexicanMexican American IndianMongolianMoroccanNative HawaiianNavajoNepaleseNew ZealanderNicaraguanNigerianNorthern EuropeanNorwegianOkinawanOsageOttawaPaiutePakistaniPalestinianPanamanianParaguayanPennsylvania GermanPeruvianPimaPolishPortuguesePotawatomiPuebloPuerto RicanPuget Sound SalishRomanianRussianSalvadoranSamoanScandinavianScotch-IrishScottishSeminoleSenegaleseSerbianShoshoneSierra LeoneanSiouxSlavicSlovakSloveneSomaliSouth AfricanSouth AmericanSouth American IndianSoviet UnionSpaniardSpanishSpanish AmericanSpanish American IndianSri LankanSubsaharan AfricanSudaneseSwedishSwissSyrianTaiwaneseThaiTlingit-HaidaTohono O'OdhamTonganTrinidadian and TobagonianTsimshianTurkishU.S. Virgin IslanderUgandanUkrainianUruguayanUteVenezuelanVietnameseWelshWest IndianYakamaYaquiYugoslavianYumanYup'ikZimbabwean
Immigration
NonimmigrantsImmigrantsAfghanistanAfricaAlbaniaArgentinaArmeniaAsiaAustraliaAustriaBahamasBangladeshBarbadosBelarusBelgiumBelizeBoliviaBosnia and HerzegovinaBrazilBulgariaBurma/MyanmarCabo VerdeCambodiaCameroonCanadaCaribbeanCentral AmericaChileChinaColombiaCongoCosta RicaCroatiaCubaCzechoslovakiaDenmarkDominicaDominican RepublicEastern AfricaEastern AsiaEastern EuropeEcuadorEgyptEl SalvadorEnglandEritreaEthiopiaEuropeFijiFranceGermanyGhanaGreeceGrenadaGuatemalaGuyanaHaitiHondurasHong KongHungaryIndiaIndonesiaIranIraqIrelandIsraelItalyJamaicaJapanJordanKazakhstanKenyaKoreaKuwaitLaosLatin AmericaLatviaLebanonLiberiaLithuaniaMalaysiaMexicoMicronesiaMiddle AfricaMoldovaMoroccoNepalNetherlandsNicaraguaNigeriaNorth AmericaNorth MacedoniaNorthern AfricaNorthern EuropeNorwayOceaniaPakistanPanamaPeruPhilippinesPolandPortugalRomaniaRussiaSaudi ArabiaScotlandSenegalSerbiaSierra LeoneSingaporeSomaliaSouth AfricaSouth AmericaSouth Central AsiaSouth Eastern AsiaSouthern EuropeSpainSri LankaSt. Vincent and the GrenadinesSudanSwedenSwitzerlandSyriaTaiwanThailandTrinidad and TobagoTurkeyUgandaUkraineUruguayUzbekistanVenezuelaVietnamWest IndiesWestern AfricaWestern AsiaWestern EuropeYemenZaireZimbabweAzores
Select to Compare
Race
Ancestry
AfghanAfricanAlaska NativeAlaskan AthabascanAlbanianAleutAlsatianAmericanApacheArabArapahoArgentineanArmenianAssyrian/Chaldean/SyriacAustralianAustrianBahamianBangladeshiBarbadianBasqueBelgianBelizeanBermudanBhutaneseBlackfeetBolivianBrazilianBritishBritish West IndianBulgarianBurmeseCajunCambodianCanadianCape VerdeanCarpatho RusynCelticCentral AmericanCentral American IndianCherokeeCheyenneChickasawChileanChineseChippewaChoctawColombianColvilleComancheCosta RicanCreeCreekCroatianCrowCubanCypriotCzechCzechoslovakianDanishDelawareDominicanDutchDutch West IndianEastern EuropeanEcuadorianEgyptianEnglishEstonianEthiopianEuropeanFijianFilipinoFinnishFrenchFrench American IndianFrench CanadianGermanGerman RussianGhanaianGreekGuamanian/ChamorroGuatemalanGuyaneseHaitianHmongHonduranHopiHoumaHungarianIcelanderIndian (Asian)IndonesianInupiatIranianIraqiIrishIroquoisIsraeliItalianJamaicanJapaneseJordanianKenyanKiowaKoreanLaotianLatvianLebaneseLiberianLithuanianLumbeeLuxembourgerMacedonianMalaysianMalteseMarshalleseMenomineeMexicanMexican American IndianMongolianMoroccanNative HawaiianNavajoNepaleseNew ZealanderNicaraguanNigerianNorthern EuropeanNorwegianOkinawanOsageOttawaPaiutePakistaniPalestinianPanamanianParaguayanPennsylvania GermanPeruvianPimaPolishPortuguesePotawatomiPuebloPuerto RicanPuget Sound SalishRomanianRussianSalvadoranSamoanScandinavianScotch-IrishScottishSeminoleSenegaleseSerbianShoshoneSierra LeoneanSiouxSlavicSlovakSloveneSomaliSouth AfricanSouth AmericanSouth American IndianSoviet UnionSpaniardSpanishSpanish AmericanSpanish American IndianSri LankanSubsaharan AfricanSudaneseSwedishSwissSyrianTaiwaneseThaiTlingit-HaidaTohono O'OdhamTonganTrinidadian and TobagonianTsimshianTurkishU.S. Virgin IslanderUgandanUkrainianUruguayanUteVenezuelanVietnameseWelshWest IndianYakamaYaquiYugoslavianYumanYup'ikZimbabwean
Immigration
NonimmigrantsImmigrantsAfghanistanAfricaAlbaniaArgentinaArmeniaAsiaAustraliaAustriaBahamasBangladeshBarbadosBelarusBelgiumBelizeBoliviaBosnia and HerzegovinaBrazilBulgariaBurma/MyanmarCabo VerdeCambodiaCameroonCanadaCaribbeanCentral AmericaChileChinaColombiaCongoCosta RicaCroatiaCubaCzechoslovakiaDenmarkDominicaDominican RepublicEastern AfricaEastern AsiaEastern EuropeEcuadorEgyptEl SalvadorEnglandEritreaEthiopiaEuropeFijiFranceGermanyGhanaGreeceGrenadaGuatemalaGuyanaHaitiHondurasHong KongHungaryIndiaIndonesiaIranIraqIrelandIsraelItalyJamaicaJapanJordanKazakhstanKenyaKoreaKuwaitLaosLatin AmericaLatviaLebanonLiberiaLithuaniaMalaysiaMexicoMicronesiaMiddle AfricaMoldovaMoroccoNepalNetherlandsNicaraguaNigeriaNorth AmericaNorth MacedoniaNorthern AfricaNorthern EuropeNorwayOceaniaPakistanPanamaPeruPhilippinesPolandPortugalRomaniaRussiaSaudi ArabiaScotlandSerbiaSierra LeoneSingaporeSomaliaSouth AfricaSouth AmericaSouth Central AsiaSouth Eastern AsiaSouthern EuropeSpainSri LankaSt. Vincent and the GrenadinesSudanSwedenSwitzerlandSyriaTaiwanThailandTrinidad and TobagoTurkeyUgandaUkraineUruguayUzbekistanVenezuelaVietnamWest IndiesWestern AfricaWestern AsiaWestern EuropeYemenZaireZimbabweAzores
3 or more Vehicles in Household
Income
Poverty
Unemployment
Labor Participation
Family Structure
Vehicle Availability
Education Level
Disability

Immigrants from Senegal 3 or more Vehicles in Household
Tragic

13.8%
3+ VEHICLES AVAILABLE
0.0/ 100
METRIC RATING
329th/ 347
METRIC RANK

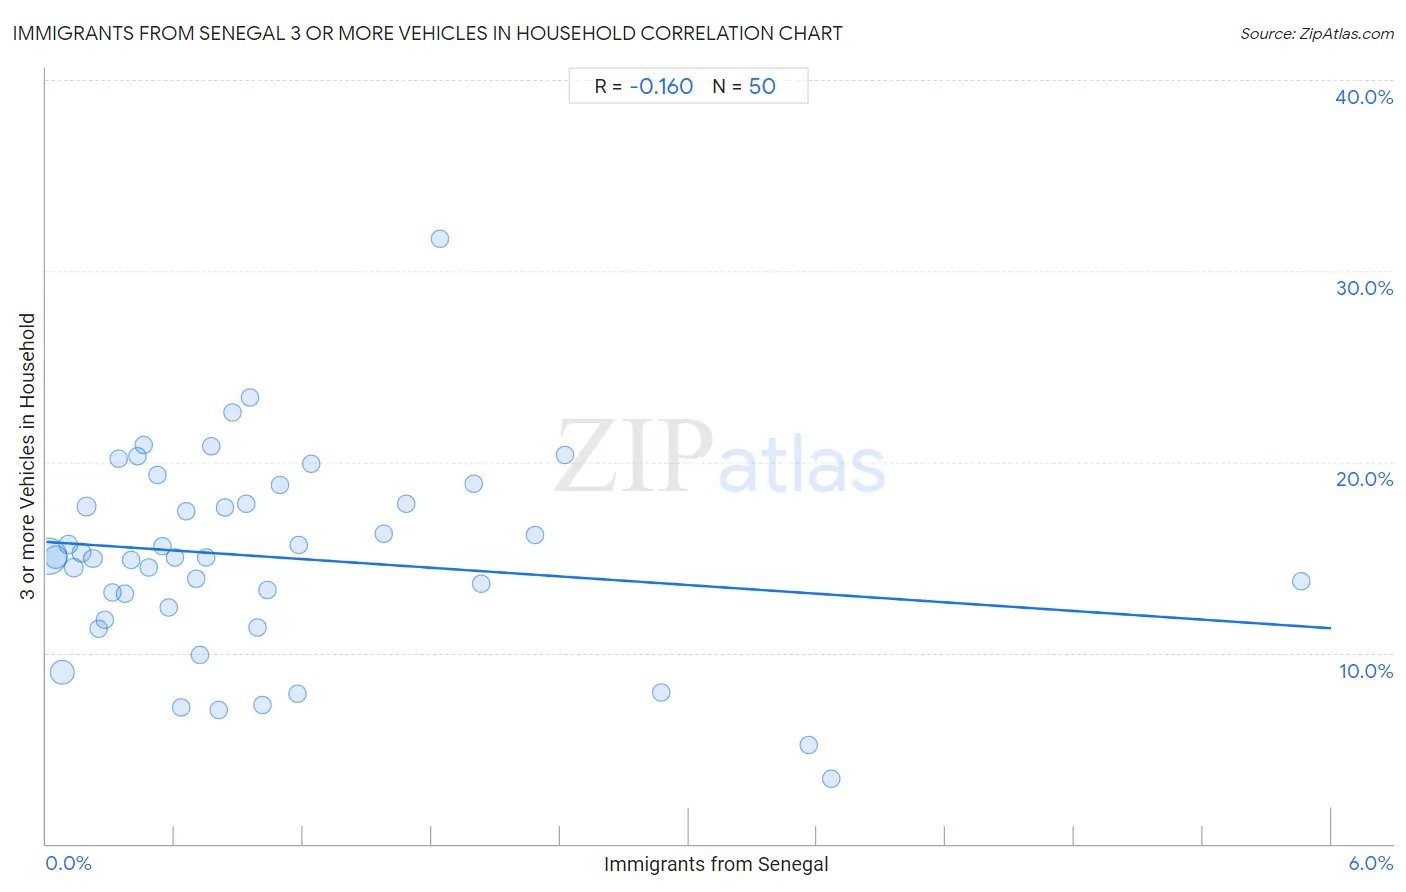
Immigrants from Senegal 3 or more Vehicles in Household Correlation Chart

The statistical analysis conducted on geographies consisting of 90,108,682 people shows a poor negative correlation between the proportion of Immigrants from Senegal and percentage of households with 3 or more vehicles available in the United States with a correlation coefficient (R) of -0.160 and weighted average of 13.8%. On average, for every 1% (one percent) increase in Immigrants from Senegal within a typical geography, there is a decrease of 0.75% in percentage of households with 3 or more vehicles available.
Immigrants from Senegal 3 or more Vehicles in Household
It is essential to understand that the correlation between the percentage of Immigrants from Senegal and percentage of households with 3 or more vehicles available does not imply a direct cause-and-effect relationship. It remains uncertain whether the presence of Immigrants from Senegal influences an upward or downward trend in the level of percentage of households with 3 or more vehicles available within an area, or if Immigrants from Senegal simply ended up residing in those areas with higher or lower levels of percentage of households with 3 or more vehicles available due to other factors.

Demographics Similar to Immigrants from Senegal by 3 or more Vehicles in Household

In terms of 3 or more vehicles in household, the demographic groups most similar to Immigrants from Senegal are West Indian (13.7%, a difference of 0.33%), Immigrants from Dominica (13.7%, a difference of 0.55%), Immigrants from Albania (14.0%, a difference of 1.2%), Trinidadian and Tobagonian (13.6%, a difference of 1.3%), and Immigrants from Cabo Verde (13.6%, a difference of 1.6%).
DemographicsRating | Rank3 or more Vehicles in Household
Immigrants from West Indies
0.0
/100
|
#322
Tragic
14.6%
Immigrants from Caribbean
0.0
/100
|
#323
Tragic
14.6%
Immigrants from Yemen
0.0
/100
|
#324
Tragic
14.2%
Senegalese
0.0
/100
|
#325
Tragic
14.2%
Soviet Union
0.0
/100
|
#326
Tragic
14.2%
Ecuadorians
0.0
/100
|
#327
Tragic
14.1%
Immigrants from Albania
0.0
/100
|
#328
Tragic
14.0%
Immigrants from Senegal
0.0
/100
|
#329
Tragic
13.8%
West Indians
0.0
/100
|
#330
Tragic
13.7%
Immigrants from Dominica
0.0
/100
|
#331
Tragic
13.7%
Trinidadians and Tobagonians
0.0
/100
|
#332
Tragic
13.6%
Immigrants from Cabo Verde
0.0
/100
|
#333
Tragic
13.6%
Immigrants from Ecuador
0.0
/100
|
#334
Tragic
13.4%
Immigrants from Trinidad and Tobago
0.0
/100
|
#335
Tragic
13.3%
Barbadians
0.0
/100
|
#336
Tragic
12.6%

Immigrants from Senegal 3 or more Vehicles in Household Correlation Summary

MeasurementImmigrants from Senegal Data3 or more Vehicles in Household Data
Minimum0.0099%3.4%
Maximum5.9%31.7%
Range5.9%28.3%
Mean1.1%15.0%
Median0.73%15.0%
Interquartile 25% (IQ1)0.37%12.4%
Interquartile 75% (IQ3)1.2%17.8%
Interquartile Range (IQR)0.82%5.4%
Standard Deviation (Sample)1.1%5.2%
Standard Deviation (Population)1.1%5.1%

Correlation Details

Immigrants from Senegal PercentileSample Size3 or more Vehicles in Household
[
0.0%
-
0.5%
]
0.0099%
44,150,96315.0%
[
0.0%
-
0.5%
]
0.045%
13,485,88915.0%
[
0.0%
-
0.5%
]
0.076%
15,770,1709.0%
[
0.0%
-
0.5%
]
0.10%
4,728,69615.7%
[
0.0%
-
0.5%
]
0.13%
2,642,53914.5%
[
0.0%
-
0.5%
]
0.16%
1,918,60315.2%
[
0.0%
-
0.5%
]
0.19%
1,441,70617.6%
[
0.0%
-
0.5%
]
0.22%
983,12914.9%
[
0.0%
-
0.5%
]
0.25%
367,83411.3%
[
0.0%
-
0.5%
]
0.27%
761,52111.7%
[
0.0%
-
0.5%
]
0.31%
255,89013.2%
[
0.0%
-
0.5%
]
0.34%
385,81420.2%
[
0.0%
-
0.5%
]
0.37%
290,41713.1%
[
0.0%
-
0.5%
]
0.40%
379,70114.9%
[
0.0%
-
0.5%
]
0.43%
189,98820.3%
[
0.0%
-
0.5%
]
0.45%
174,04120.9%
[
0.0%
-
0.5%
]
0.48%
143,44314.5%
[
0.5%
-
1.0%
]
0.52%
163,39919.3%
[
0.5%
-
1.0%
]
0.54%
262,27715.6%
[
0.5%
-
1.0%
]
0.57%
198,69512.4%
[
0.5%
-
1.0%
]
0.60%
124,26915.0%
[
0.5%
-
1.0%
]
0.63%
262,1637.1%
[
0.5%
-
1.0%
]
0.65%
119,30217.4%
[
0.5%
-
1.0%
]
0.70%
32,50413.9%
[
0.5%
-
1.0%
]
0.72%
154,2379.9%
[
0.5%
-
1.0%
]
0.75%
94,69215.0%
[
0.5%
-
1.0%
]
0.77%
36,44820.8%
[
0.5%
-
1.0%
]
0.80%
124,5047.0%
[
0.5%
-
1.0%
]
0.84%
10,52717.6%
[
0.5%
-
1.0%
]
0.87%
80,15922.6%
[
0.5%
-
1.0%
]
0.93%
5,88417.8%
[
0.5%
-
1.0%
]
0.95%
63,10423.3%
[
0.5%
-
1.0%
]
0.98%
18,09111.3%
[
1.0%
-
1.5%
]
1.01%
63,9387.3%
[
1.0%
-
1.5%
]
1.03%
16,07113.3%
[
1.0%
-
1.5%
]
1.09%
21,93718.8%
[
1.0%
-
1.5%
]
1.17%
53,0127.8%
[
1.0%
-
1.5%
]
1.18%
20,90315.7%
[
1.0%
-
1.5%
]
1.24%
38,23519.9%
[
1.5%
-
2.0%
]
1.57%
19,06916.2%
[
1.5%
-
2.0%
]
1.68%
3,57517.8%
[
1.5%
-
2.0%
]
1.84%
8,25531.7%
[
1.5%
-
2.0%
]
2.00%
13,32318.9%
[
2.0%
-
2.5%
]
2.03%
3,49713.6%
[
2.0%
-
2.5%
]
2.28%
87616.2%
[
2.0%
-
2.5%
]
2.42%
10,99120.3%
[
2.5%
-
3.0%
]
2.87%
4,4937.9%
[
3.5%
-
4.0%
]
3.56%
3,6225.2%
[
3.5%
-
4.0%
]
3.67%
1,9363.4%
[
5.5%
-
6.0%
]
5.86%
4,35013.7%