Tlingit-Haida Median Family Income
COMPARE
Tlingit-Haida
Select to Compare
Median Family Income
Tlingit-Haida Median Family Income
$101,092
FAMILY INCOME
30.8/ 100
METRIC RATING
187th/ 347
METRIC RANK
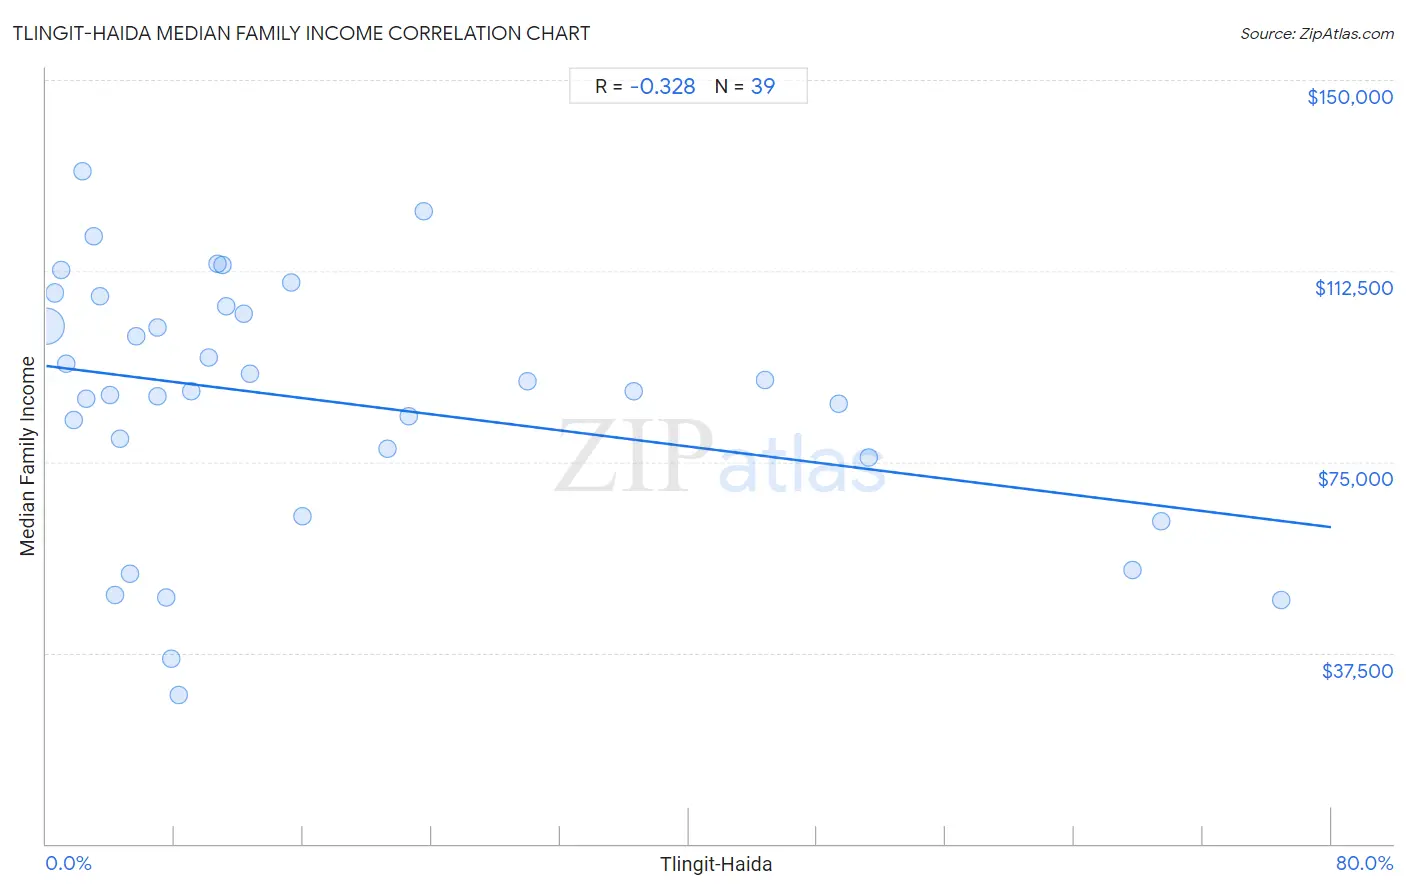
Tlingit-Haida Median Family Income Correlation Chart
The statistical analysis conducted on geographies consisting of 60,853,273 people shows a mild negative correlation between the proportion of Tlingit-Haida and median family income in the United States with a correlation coefficient (R) of -0.328 and weighted average of $101,092. On average, for every 1% (one percent) increase in Tlingit-Haida within a typical geography, there is a decrease of $396 in median family income.
It is essential to understand that the correlation between the percentage of Tlingit-Haida and median family income does not imply a direct cause-and-effect relationship. It remains uncertain whether the presence of Tlingit-Haida influences an upward or downward trend in the level of median family income within an area, or if Tlingit-Haida simply ended up residing in those areas with higher or lower levels of median family income due to other factors.
Demographics Similar to Tlingit-Haida by Median Family Income
In terms of median family income, the demographic groups most similar to Tlingit-Haida are Guamanian/Chamorro ($101,061, a difference of 0.030%), Celtic ($101,139, a difference of 0.050%), Dutch ($101,192, a difference of 0.10%), Immigrants from Portugal ($100,984, a difference of 0.11%), and Immigrants ($100,962, a difference of 0.13%).
| Demographics | Rating | Rank | Median Family Income |
| French Canadians | 37.0 /100 | #180 | Fair $101,634 |
| Spaniards | 36.8 /100 | #181 | Fair $101,617 |
| Tsimshian | 35.9 /100 | #182 | Fair $101,543 |
| Kenyans | 34.5 /100 | #183 | Fair $101,417 |
| Immigrants from Costa Rica | 33.7 /100 | #184 | Fair $101,354 |
| Dutch | 31.9 /100 | #185 | Fair $101,192 |
| Celtics | 31.3 /100 | #186 | Fair $101,139 |
| Tlingit-Haida | 30.8 /100 | #187 | Fair $101,092 |
| Guamanians/Chamorros | 30.5 /100 | #188 | Fair $101,061 |
| Immigrants from Portugal | 29.6 /100 | #189 | Fair $100,984 |
| Immigrants | 29.4 /100 | #190 | Fair $100,962 |
| Colombians | 27.2 /100 | #191 | Fair $100,750 |
| Immigrants from Kenya | 26.5 /100 | #192 | Fair $100,679 |
| Iraqis | 26.3 /100 | #193 | Fair $100,658 |
| Uruguayans | 26.3 /100 | #194 | Fair $100,656 |
Tlingit-Haida Median Family Income Correlation Summary
| Measurement | Tlingit-Haida Data | Median Family Income Data |
| Minimum | 0.036% | $29,250 |
| Maximum | 76.8% | $132,184 |
| Range | 76.8% | $102,934 |
| Mean | 17.4% | $86,951 |
| Median | 9.0% | $88,958 |
| Interquartile 25% (IQ1) | 4.0% | $75,972 |
| Interquartile 75% (IQ3) | 22.6% | $105,493 |
| Interquartile Range (IQR) | 18.6% | $29,521 |
| Standard Deviation (Sample) | 20.6% | $24,804 |
| Standard Deviation (Population) | 20.3% | $24,484 |
Correlation Details
| Tlingit-Haida Percentile | Sample Size | Median Family Income |
[ 0.0% - 0.5% ] 0.036% | 59,016,735 | $101,525 |
[ 0.5% - 1.0% ] 0.54% | 1,311,920 | $108,178 |
[ 0.5% - 1.0% ] 0.91% | 246,810 | $112,779 |
[ 1.0% - 1.5% ] 1.24% | 85,331 | $94,224 |
[ 1.5% - 2.0% ] 1.71% | 25,685 | $83,150 |
[ 2.0% - 2.5% ] 2.28% | 8,447 | $132,184 |
[ 2.0% - 2.5% ] 2.46% | 3,655 | $87,401 |
[ 2.5% - 3.0% ] 2.92% | 6,231 | $119,233 |
[ 3.0% - 3.5% ] 3.33% | 10,208 | $107,454 |
[ 3.5% - 4.0% ] 3.97% | 1,964 | $88,212 |
[ 4.0% - 4.5% ] 4.26% | 47 | $48,750 |
[ 4.5% - 5.0% ] 4.62% | 822 | $79,643 |
[ 5.0% - 5.5% ] 5.24% | 420 | $53,125 |
[ 5.5% - 6.0% ] 5.62% | 1,762 | $99,583 |
[ 6.5% - 7.0% ] 6.91% | 564 | $87,917 |
[ 6.5% - 7.0% ] 6.94% | 2,146 | $101,500 |
[ 7.0% - 7.5% ] 7.50% | 40 | $48,333 |
[ 7.5% - 8.0% ] 7.80% | 1,257 | $36,406 |
[ 8.0% - 8.5% ] 8.22% | 146 | $29,250 |
[ 8.5% - 9.0% ] 9.00% | 6,691 | $88,903 |
[ 10.0% - 10.5% ] 10.13% | 2,902 | $95,416 |
[ 10.5% - 11.0% ] 10.70% | 29,933 | $114,000 |
[ 11.0% - 11.5% ] 11.00% | 32,108 | $113,750 |
[ 11.0% - 11.5% ] 11.18% | 13,913 | $105,493 |
[ 12.0% - 12.5% ] 12.26% | 18,041 | $104,088 |
[ 12.5% - 13.0% ] 12.66% | 8,647 | $92,389 |
[ 15.0% - 15.5% ] 15.26% | 2,169 | $110,208 |
[ 15.5% - 16.0% ] 15.92% | 1,727 | $64,306 |
[ 21.0% - 21.5% ] 21.23% | 4,267 | $77,500 |
[ 22.5% - 23.0% ] 22.55% | 1,073 | $84,000 |
[ 23.5% - 24.0% ] 23.53% | 85 | $124,107 |
[ 29.5% - 30.0% ] 29.96% | 1,128 | $90,750 |
[ 36.5% - 37.0% ] 36.59% | 82 | $88,958 |
[ 44.5% - 45.0% ] 44.78% | 920 | $91,042 |
[ 49.0% - 49.5% ] 49.33% | 1,792 | $86,389 |
[ 51.0% - 51.5% ] 51.24% | 804 | $75,972 |
[ 67.5% - 68.0% ] 67.59% | 361 | $53,750 |
[ 69.0% - 69.5% ] 69.41% | 1,602 | $63,284 |
[ 76.5% - 77.0% ] 76.85% | 838 | $47,917 |