Tlingit-Haida Average Family Size

COMPARE

Tlingit-Haida
Race
Ancestry
AfghanAfricanAlaska NativeAlaskan AthabascanAlbanianAleutAlsatianAmericanApacheArabArapahoArgentineanArmenianAssyrian/Chaldean/SyriacAustralianAustrianBahamianBangladeshiBarbadianBasqueBelgianBelizeanBermudanBhutaneseBlackfeetBolivianBrazilianBritishBritish West IndianBulgarianBurmeseCajunCambodianCanadianCape VerdeanCarpatho RusynCelticCentral AmericanCentral American IndianCherokeeCheyenneChickasawChileanChineseChippewaChoctawColombianColvilleComancheCosta RicanCreeCreekCroatianCrowCubanCypriotCzechCzechoslovakianDanishDelawareDominicanDutchDutch West IndianEastern EuropeanEcuadorianEgyptianEnglishEstonianEthiopianEuropeanFijianFilipinoFinnishFrenchFrench American IndianFrench CanadianGermanGerman RussianGhanaianGreekGuamanian/ChamorroGuatemalanGuyaneseHaitianHmongHonduranHopiHoumaHungarianIcelanderIndian (Asian)IndonesianInupiatIranianIraqiIrishIroquoisIsraeliItalianJamaicanJapaneseJordanianKenyanKiowaKoreanLaotianLatvianLebaneseLiberianLithuanianLumbeeLuxembourgerMacedonianMalaysianMalteseMarshalleseMenomineeMexicanMexican American IndianMongolianMoroccanNative HawaiianNavajoNepaleseNew ZealanderNicaraguanNigerianNorthern EuropeanNorwegianOkinawanOsageOttawaPaiutePakistaniPalestinianPanamanianParaguayanPennsylvania GermanPeruvianPimaPolishPortuguesePotawatomiPuebloPuerto RicanPuget Sound SalishRomanianRussianSalvadoranSamoanScandinavianScotch-IrishScottishSeminoleSenegaleseSerbianShoshoneSierra LeoneanSiouxSlavicSlovakSloveneSomaliSouth AfricanSouth AmericanSouth American IndianSoviet UnionSpaniardSpanishSpanish AmericanSpanish American IndianSri LankanSubsaharan AfricanSudaneseSwedishSwissSyrianTaiwaneseThaiTlingit-HaidaTohono O'OdhamTonganTrinidadian and TobagonianTsimshianTurkishU.S. Virgin IslanderUgandanUkrainianUruguayanUteVenezuelanVietnameseWelshWest IndianYakamaYaquiYugoslavianYumanYup'ikZimbabwean
Immigration
NonimmigrantsImmigrantsAfghanistanAfricaAlbaniaArgentinaArmeniaAsiaAustraliaAustriaBahamasBangladeshBarbadosBelarusBelgiumBelizeBoliviaBosnia and HerzegovinaBrazilBulgariaBurma/MyanmarCabo VerdeCambodiaCameroonCanadaCaribbeanCentral AmericaChileChinaColombiaCongoCosta RicaCroatiaCubaCzechoslovakiaDenmarkDominicaDominican RepublicEastern AfricaEastern AsiaEastern EuropeEcuadorEgyptEl SalvadorEnglandEritreaEthiopiaEuropeFijiFranceGermanyGhanaGreeceGrenadaGuatemalaGuyanaHaitiHondurasHong KongHungaryIndiaIndonesiaIranIraqIrelandIsraelItalyJamaicaJapanJordanKazakhstanKenyaKoreaKuwaitLaosLatin AmericaLatviaLebanonLiberiaLithuaniaMalaysiaMexicoMicronesiaMiddle AfricaMoldovaMoroccoNepalNetherlandsNicaraguaNigeriaNorth AmericaNorth MacedoniaNorthern AfricaNorthern EuropeNorwayOceaniaPakistanPanamaPeruPhilippinesPolandPortugalRomaniaRussiaSaudi ArabiaScotlandSenegalSerbiaSierra LeoneSingaporeSomaliaSouth AfricaSouth AmericaSouth Central AsiaSouth Eastern AsiaSouthern EuropeSpainSri LankaSt. Vincent and the GrenadinesSudanSwedenSwitzerlandSyriaTaiwanThailandTrinidad and TobagoTurkeyUgandaUkraineUruguayUzbekistanVenezuelaVietnamWest IndiesWestern AfricaWestern AsiaWestern EuropeYemenZaireZimbabweAzores
Select to Compare
Race
Ancestry
AfghanAfricanAlaska NativeAlaskan AthabascanAlbanianAleutAlsatianAmericanApacheArabArapahoArgentineanArmenianAssyrian/Chaldean/SyriacAustralianAustrianBahamianBangladeshiBarbadianBasqueBelgianBelizeanBermudanBhutaneseBlackfeetBolivianBrazilianBritishBritish West IndianBulgarianBurmeseCajunCambodianCanadianCape VerdeanCarpatho RusynCelticCentral AmericanCentral American IndianCherokeeCheyenneChickasawChileanChineseChippewaChoctawColombianColvilleComancheCosta RicanCreeCreekCroatianCrowCubanCypriotCzechCzechoslovakianDanishDelawareDominicanDutchDutch West IndianEastern EuropeanEcuadorianEgyptianEnglishEstonianEthiopianEuropeanFijianFilipinoFinnishFrenchFrench American IndianFrench CanadianGermanGerman RussianGhanaianGreekGuamanian/ChamorroGuatemalanGuyaneseHaitianHmongHonduranHopiHoumaHungarianIcelanderIndian (Asian)IndonesianInupiatIranianIraqiIrishIroquoisIsraeliItalianJamaicanJapaneseJordanianKenyanKiowaKoreanLaotianLatvianLebaneseLiberianLithuanianLumbeeLuxembourgerMacedonianMalaysianMalteseMarshalleseMenomineeMexicanMexican American IndianMongolianMoroccanNative HawaiianNavajoNepaleseNew ZealanderNicaraguanNigerianNorthern EuropeanNorwegianOkinawanOsageOttawaPaiutePakistaniPalestinianPanamanianParaguayanPennsylvania GermanPeruvianPimaPolishPortuguesePotawatomiPuebloPuerto RicanPuget Sound SalishRomanianRussianSalvadoranSamoanScandinavianScotch-IrishScottishSeminoleSenegaleseSerbianShoshoneSierra LeoneanSiouxSlavicSlovakSloveneSomaliSouth AfricanSouth AmericanSouth American IndianSoviet UnionSpaniardSpanishSpanish AmericanSpanish American IndianSri LankanSubsaharan AfricanSudaneseSwedishSwissSyrianTaiwaneseThaiTohono O'OdhamTonganTrinidadian and TobagonianTsimshianTurkishU.S. Virgin IslanderUgandanUkrainianUruguayanUteVenezuelanVietnameseWelshWest IndianYakamaYaquiYugoslavianYumanYup'ikZimbabwean
Immigration
NonimmigrantsImmigrantsAfghanistanAfricaAlbaniaArgentinaArmeniaAsiaAustraliaAustriaBahamasBangladeshBarbadosBelarusBelgiumBelizeBoliviaBosnia and HerzegovinaBrazilBulgariaBurma/MyanmarCabo VerdeCambodiaCameroonCanadaCaribbeanCentral AmericaChileChinaColombiaCongoCosta RicaCroatiaCubaCzechoslovakiaDenmarkDominicaDominican RepublicEastern AfricaEastern AsiaEastern EuropeEcuadorEgyptEl SalvadorEnglandEritreaEthiopiaEuropeFijiFranceGermanyGhanaGreeceGrenadaGuatemalaGuyanaHaitiHondurasHong KongHungaryIndiaIndonesiaIranIraqIrelandIsraelItalyJamaicaJapanJordanKazakhstanKenyaKoreaKuwaitLaosLatin AmericaLatviaLebanonLiberiaLithuaniaMalaysiaMexicoMicronesiaMiddle AfricaMoldovaMoroccoNepalNetherlandsNicaraguaNigeriaNorth AmericaNorth MacedoniaNorthern AfricaNorthern EuropeNorwayOceaniaPakistanPanamaPeruPhilippinesPolandPortugalRomaniaRussiaSaudi ArabiaScotlandSenegalSerbiaSierra LeoneSingaporeSomaliaSouth AfricaSouth AmericaSouth Central AsiaSouth Eastern AsiaSouthern EuropeSpainSri LankaSt. Vincent and the GrenadinesSudanSwedenSwitzerlandSyriaTaiwanThailandTrinidad and TobagoTurkeyUgandaUkraineUruguayUzbekistanVenezuelaVietnamWest IndiesWestern AfricaWestern AsiaWestern EuropeYemenZaireZimbabweAzores
Average Family Size
Income
Poverty
Unemployment
Labor Participation
Family Structure
Vehicle Availability
Education Level
Disability

Tlingit-Haida Average Family Size
Tragic

3.16
AVERAGE FAMILY SIZE
0.7/ 100
METRIC RATING
270th/ 347
METRIC RANK

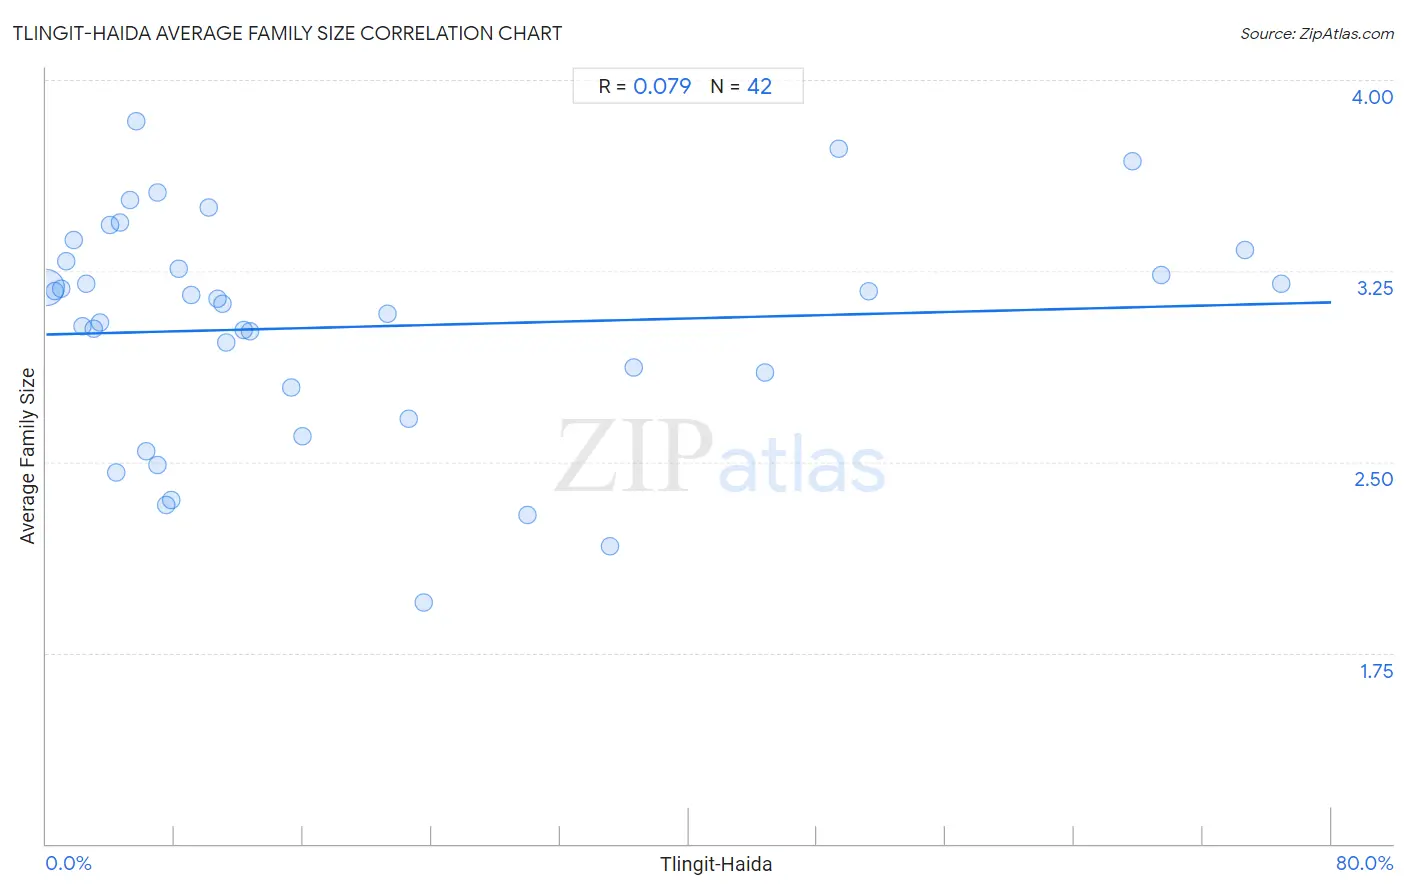
Tlingit-Haida Average Family Size Correlation Chart

The statistical analysis conducted on geographies consisting of 60,855,605 people shows a slight positive correlation between the proportion of Tlingit-Haida and average family size in the United States with a correlation coefficient (R) of 0.079 and weighted average of 3.16. On average, for every 1% (one percent) increase in Tlingit-Haida within a typical geography, there is an increase of 0.00 in average family size.
Tlingit-Haida Average Family Size
It is essential to understand that the correlation between the percentage of Tlingit-Haida and average family size does not imply a direct cause-and-effect relationship. It remains uncertain whether the presence of Tlingit-Haida influences an upward or downward trend in the level of average family size within an area, or if Tlingit-Haida simply ended up residing in those areas with higher or lower levels of average family size due to other factors.

Demographics Similar to Tlingit-Haida by Average Family Size

In terms of average family size, the demographic groups most similar to Tlingit-Haida are Immigrants from Germany (3.15, a difference of 0.020%), Immigrants from Singapore (3.16, a difference of 0.030%), Maltese (3.16, a difference of 0.040%), Immigrants from Lithuania (3.15, a difference of 0.040%), and New Zealander (3.15, a difference of 0.060%).
DemographicsRating | RankAverage Family Size
Immigrants from Bulgaria
1.0
/100
|
#263
Tragic
3.16
Americans
1.0
/100
|
#264
Tragic
3.16
Immigrants from South Africa
0.9
/100
|
#265
Tragic
3.16
Immigrants from Greece
0.9
/100
|
#266
Tragic
3.16
Iroquois
0.8
/100
|
#267
Tragic
3.16
Maltese
0.8
/100
|
#268
Tragic
3.16
Immigrants from Singapore
0.7
/100
|
#269
Tragic
3.16
Tlingit-Haida
0.7
/100
|
#270
Tragic
3.16
Immigrants from Germany
0.7
/100
|
#271
Tragic
3.15
Immigrants from Lithuania
0.6
/100
|
#272
Tragic
3.15
New Zealanders
0.6
/100
|
#273
Tragic
3.15
Immigrants from Belgium
0.6
/100
|
#274
Tragic
3.15
Cambodians
0.6
/100
|
#275
Tragic
3.15
Immigrants from Bosnia and Herzegovina
0.5
/100
|
#276
Tragic
3.15
Swiss
0.5
/100
|
#277
Tragic
3.15

Tlingit-Haida Average Family Size Correlation Summary

MeasurementTlingit-Haida DataAverage Family Size Data
Minimum0.036%1.95
Maximum76.8%3.84
Range76.8%1.89
Mean18.9%3.03
Median9.6%3.13
Interquartile 25% (IQ1)4.3%2.79
Interquartile 75% (IQ3)23.5%3.29
Interquartile Range (IQR)19.2%0.50
Standard Deviation (Sample)21.9%0.44
Standard Deviation (Population)21.7%0.43

Correlation Details

Tlingit-Haida PercentileSample SizeAverage Family Size
[
0.0%
-
0.5%
]
0.036%
59,016,7353.18
[
0.5%
-
1.0%
]
0.54%
1,312,3393.17
[
0.5%
-
1.0%
]
0.91%
247,8183.18
[
1.0%
-
1.5%
]
1.24%
85,6873.29
[
1.5%
-
2.0%
]
1.71%
25,6853.37
[
2.0%
-
2.5%
]
2.28%
8,4473.03
[
2.0%
-
2.5%
]
2.46%
3,6553.20
[
2.5%
-
3.0%
]
2.92%
6,2313.02
[
3.0%
-
3.5%
]
3.33%
10,3883.05
[
3.5%
-
4.0%
]
3.97%
1,9643.43
[
4.0%
-
4.5%
]
4.35%
1152.46
[
4.5%
-
5.0%
]
4.62%
8223.44
[
5.0%
-
5.5%
]
5.24%
4203.53
[
5.5%
-
6.0%
]
5.62%
1,7623.84
[
6.0%
-
6.5%
]
6.21%
1772.54
[
6.5%
-
7.0%
]
6.91%
5642.49
[
6.5%
-
7.0%
]
6.94%
2,1463.56
[
7.0%
-
7.5%
]
7.50%
402.33
[
7.5%
-
8.0%
]
7.80%
1,2572.35
[
8.0%
-
8.5%
]
8.22%
1463.26
[
8.5%
-
9.0%
]
9.00%
6,6913.15
[
10.0%
-
10.5%
]
10.13%
2,9023.50
[
10.5%
-
11.0%
]
10.70%
29,9333.14
[
11.0%
-
11.5%
]
11.00%
32,1083.12
[
11.0%
-
11.5%
]
11.18%
13,9132.97
[
12.0%
-
12.5%
]
12.26%
18,0413.02
[
12.5%
-
13.0%
]
12.66%
8,6473.02
[
15.0%
-
15.5%
]
15.26%
2,1692.79
[
15.5%
-
16.0%
]
15.92%
1,7272.60
[
21.0%
-
21.5%
]
21.23%
4,2673.08
[
22.5%
-
23.0%
]
22.55%
1,0732.67
[
23.5%
-
24.0%
]
23.53%
851.95
[
29.5%
-
30.0%
]
29.96%
1,1282.29
[
35.0%
-
35.5%
]
35.09%
572.17
[
36.5%
-
37.0%
]
36.59%
822.87
[
44.5%
-
45.0%
]
44.78%
9202.85
[
49.0%
-
49.5%
]
49.33%
1,7923.73
[
51.0%
-
51.5%
]
51.24%
8043.17
[
67.5%
-
68.0%
]
67.59%
3613.68
[
69.0%
-
69.5%
]
69.41%
1,6023.24
[
74.5%
-
75.0%
]
74.63%
673.33
[
76.5%
-
77.0%
]
76.85%
8383.20