Tlingit-Haida Disability Age Over 75
COMPARE
Tlingit-Haida
Select to Compare
Disability Age Over 75
Tlingit-Haida Disability Age Over 75
50.6%
DISABILITY | AGE OVER 75
0.0/ 100
METRIC RATING
310th/ 347
METRIC RANK
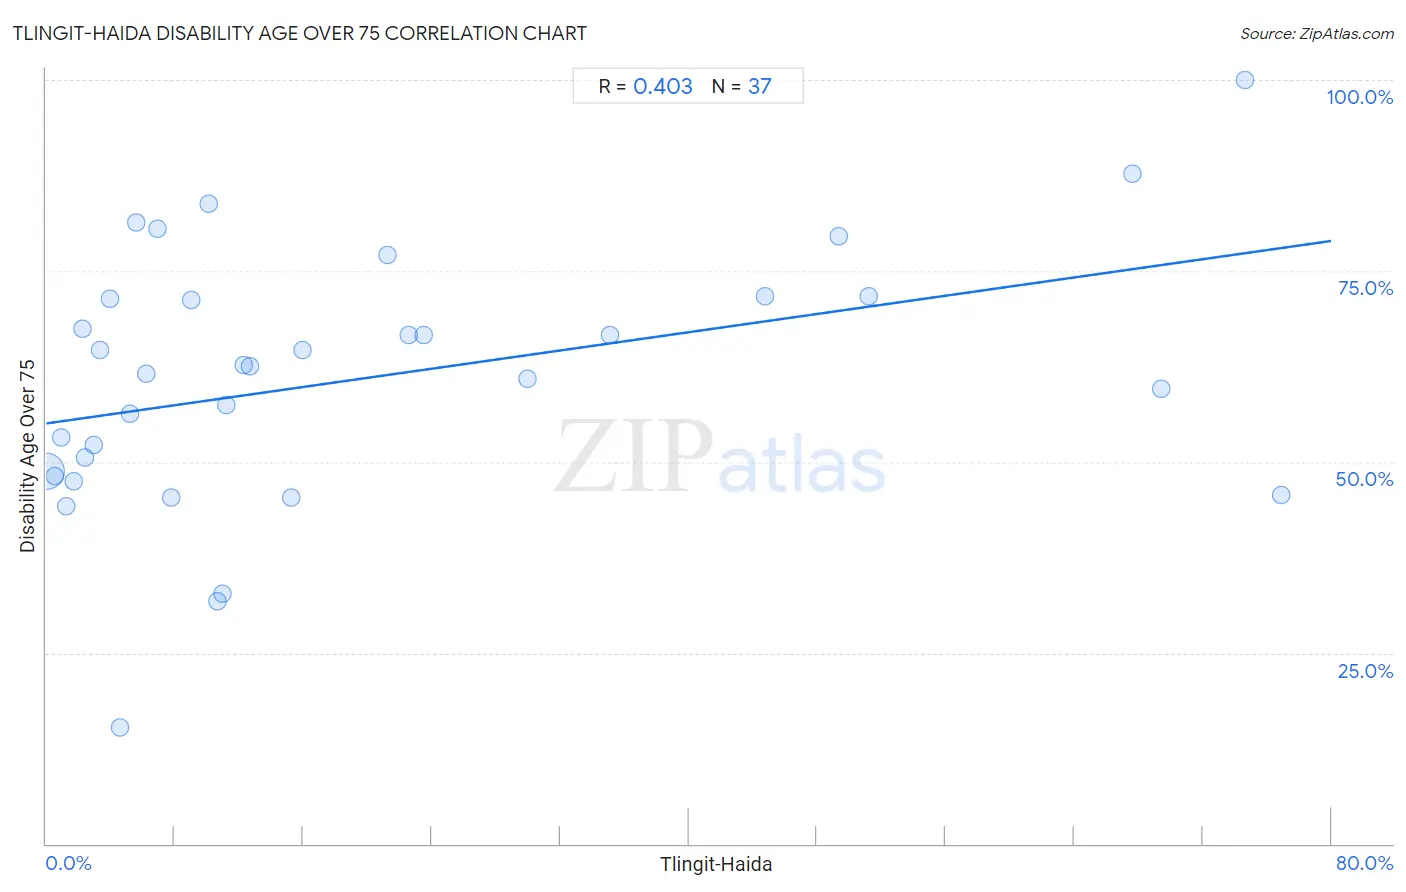
Tlingit-Haida Disability Age Over 75 Correlation Chart
The statistical analysis conducted on geographies consisting of 60,768,842 people shows a moderate positive correlation between the proportion of Tlingit-Haida and percentage of population with a disability over the age of 75 in the United States with a correlation coefficient (R) of 0.403 and weighted average of 50.6%. On average, for every 1% (one percent) increase in Tlingit-Haida within a typical geography, there is an increase of 0.30% in percentage of population with a disability over the age of 75.
It is essential to understand that the correlation between the percentage of Tlingit-Haida and percentage of population with a disability over the age of 75 does not imply a direct cause-and-effect relationship. It remains uncertain whether the presence of Tlingit-Haida influences an upward or downward trend in the level of percentage of population with a disability over the age of 75 within an area, or if Tlingit-Haida simply ended up residing in those areas with higher or lower levels of percentage of population with a disability over the age of 75 due to other factors.
Demographics Similar to Tlingit-Haida by Disability Age Over 75
In terms of disability age over 75, the demographic groups most similar to Tlingit-Haida are Hispanic or Latino (50.6%, a difference of 0.040%), Aleut (50.6%, a difference of 0.040%), Immigrants from Fiji (50.6%, a difference of 0.070%), Cajun (50.7%, a difference of 0.10%), and Immigrants from Central America (50.5%, a difference of 0.12%).
| Demographics | Rating | Rank | Disability Age Over 75 |
| Japanese | 0.0 /100 | #303 | Tragic 50.2% |
| Immigrants from Dominican Republic | 0.0 /100 | #304 | Tragic 50.3% |
| Central American Indians | 0.0 /100 | #305 | Tragic 50.5% |
| Immigrants from Central America | 0.0 /100 | #306 | Tragic 50.5% |
| Immigrants from Fiji | 0.0 /100 | #307 | Tragic 50.6% |
| Hispanics or Latinos | 0.0 /100 | #308 | Tragic 50.6% |
| Aleuts | 0.0 /100 | #309 | Tragic 50.6% |
| Tlingit-Haida | 0.0 /100 | #310 | Tragic 50.6% |
| Cajuns | 0.0 /100 | #311 | Tragic 50.7% |
| Cheyenne | 0.0 /100 | #312 | Tragic 50.9% |
| Immigrants from the Azores | 0.0 /100 | #313 | Tragic 50.9% |
| Immigrants from Mexico | 0.0 /100 | #314 | Tragic 51.1% |
| Mexicans | 0.0 /100 | #315 | Tragic 51.1% |
| Chickasaw | 0.0 /100 | #316 | Tragic 51.2% |
| Yakama | 0.0 /100 | #317 | Tragic 51.3% |
Tlingit-Haida Disability Age Over 75 Correlation Summary
| Measurement | Tlingit-Haida Data | Disability Age Over 75 Data |
| Minimum | 0.036% | 15.2% |
| Maximum | 76.8% | 100.0% |
| Range | 76.8% | 84.8% |
| Mean | 19.7% | 60.9% |
| Median | 10.7% | 62.5% |
| Interquartile 25% (IQ1) | 3.6% | 48.4% |
| Interquartile 75% (IQ3) | 26.7% | 71.5% |
| Interquartile Range (IQR) | 23.1% | 23.0% |
| Standard Deviation (Sample) | 22.8% | 16.9% |
| Standard Deviation (Population) | 22.5% | 16.7% |
Correlation Details
| Tlingit-Haida Percentile | Sample Size | Disability Age Over 75 |
[ 0.0% - 0.5% ] 0.036% | 58,950,335 | 48.7% |
[ 0.5% - 1.0% ] 0.54% | 1,304,578 | 48.2% |
[ 0.5% - 1.0% ] 0.91% | 243,205 | 53.3% |
[ 1.0% - 1.5% ] 1.23% | 82,812 | 44.2% |
[ 1.5% - 2.0% ] 1.72% | 23,612 | 47.4% |
[ 2.0% - 2.5% ] 2.28% | 8,447 | 67.4% |
[ 2.0% - 2.5% ] 2.45% | 2,372 | 50.5% |
[ 2.5% - 3.0% ] 2.92% | 6,231 | 52.2% |
[ 3.0% - 3.5% ] 3.33% | 10,326 | 64.6% |
[ 3.5% - 4.0% ] 3.96% | 1,694 | 71.3% |
[ 4.5% - 5.0% ] 4.62% | 822 | 15.2% |
[ 5.0% - 5.5% ] 5.24% | 420 | 56.2% |
[ 5.5% - 6.0% ] 5.62% | 1,762 | 81.3% |
[ 6.0% - 6.5% ] 6.21% | 177 | 61.5% |
[ 6.5% - 7.0% ] 6.94% | 2,146 | 80.6% |
[ 7.5% - 8.0% ] 7.80% | 1,257 | 45.4% |
[ 8.5% - 9.0% ] 9.00% | 6,691 | 71.1% |
[ 10.0% - 10.5% ] 10.13% | 2,902 | 83.8% |
[ 10.5% - 11.0% ] 10.70% | 29,933 | 31.7% |
[ 11.0% - 11.5% ] 11.00% | 32,108 | 32.8% |
[ 11.0% - 11.5% ] 11.18% | 13,913 | 57.4% |
[ 12.0% - 12.5% ] 12.26% | 18,041 | 62.7% |
[ 12.5% - 13.0% ] 12.67% | 8,168 | 62.5% |
[ 15.0% - 15.5% ] 15.26% | 2,169 | 45.4% |
[ 15.5% - 16.0% ] 15.92% | 1,727 | 64.7% |
[ 21.0% - 21.5% ] 21.23% | 4,267 | 77.2% |
[ 22.5% - 23.0% ] 22.55% | 1,073 | 66.7% |
[ 23.5% - 24.0% ] 23.53% | 85 | 66.7% |
[ 29.5% - 30.0% ] 29.96% | 1,128 | 60.9% |
[ 35.0% - 35.5% ] 35.09% | 57 | 66.7% |
[ 44.5% - 45.0% ] 44.78% | 920 | 71.6% |
[ 49.0% - 49.5% ] 49.33% | 1,792 | 79.6% |
[ 51.0% - 51.5% ] 51.24% | 804 | 71.6% |
[ 67.5% - 68.0% ] 67.59% | 361 | 87.8% |
[ 69.0% - 69.5% ] 69.41% | 1,602 | 59.6% |
[ 74.5% - 75.0% ] 74.63% | 67 | 100.0% |
[ 76.5% - 77.0% ] 76.85% | 838 | 45.7% |