Immigrants from Romania 3 or more Vehicles in Household
COMPARE
Immigrants from Romania
Select to Compare
3 or more Vehicles in Household
Immigrants from Romania 3 or more Vehicles in Household
18.9%
3+ VEHICLES AVAILABLE
14.6/ 100
METRIC RATING
204th/ 347
METRIC RANK
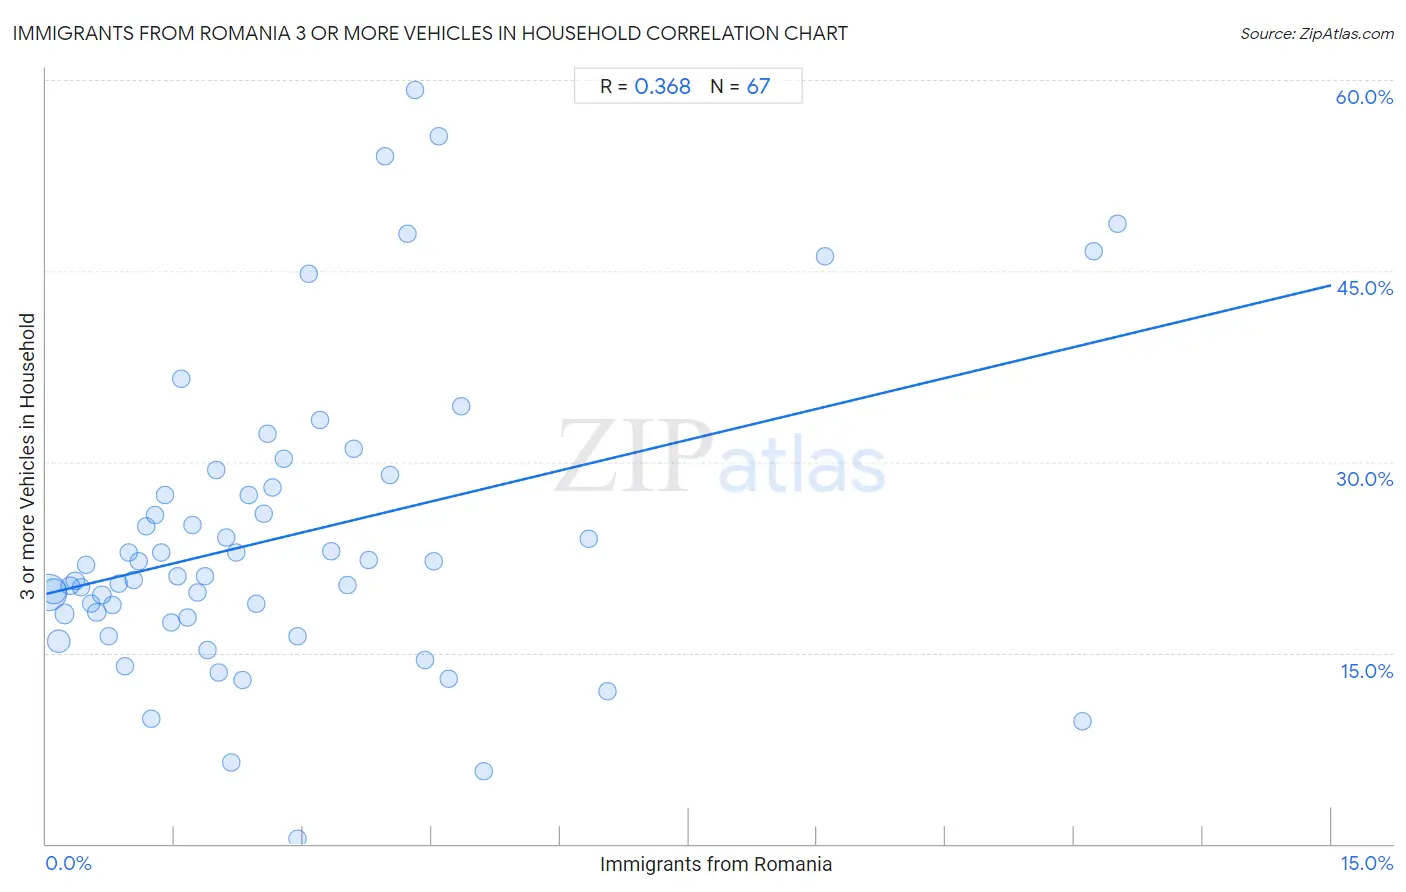
Immigrants from Romania 3 or more Vehicles in Household Correlation Chart
The statistical analysis conducted on geographies consisting of 256,899,833 people shows a mild positive correlation between the proportion of Immigrants from Romania and percentage of households with 3 or more vehicles available in the United States with a correlation coefficient (R) of 0.368 and weighted average of 18.9%. On average, for every 1% (one percent) increase in Immigrants from Romania within a typical geography, there is an increase of 1.6% in percentage of households with 3 or more vehicles available.
It is essential to understand that the correlation between the percentage of Immigrants from Romania and percentage of households with 3 or more vehicles available does not imply a direct cause-and-effect relationship. It remains uncertain whether the presence of Immigrants from Romania influences an upward or downward trend in the level of percentage of households with 3 or more vehicles available within an area, or if Immigrants from Romania simply ended up residing in those areas with higher or lower levels of percentage of households with 3 or more vehicles available due to other factors.
Demographics Similar to Immigrants from Romania by 3 or more Vehicles in Household
In terms of 3 or more vehicles in household, the demographic groups most similar to Immigrants from Romania are Tohono O'odham (18.9%, a difference of 0.030%), Russian (18.8%, a difference of 0.070%), Immigrants from Eastern Asia (18.8%, a difference of 0.080%), Immigrants from Austria (18.9%, a difference of 0.12%), and Immigrants from Chile (18.8%, a difference of 0.16%).
| Demographics | Rating | Rank | 3 or more Vehicles in Household |
| Immigrants from Japan | 22.0 /100 | #197 | Fair 19.0% |
| Egyptians | 19.5 /100 | #198 | Poor 19.0% |
| Immigrants from Norway | 19.0 /100 | #199 | Poor 19.0% |
| Argentineans | 18.2 /100 | #200 | Poor 18.9% |
| Arabs | 17.7 /100 | #201 | Poor 18.9% |
| Immigrants from Austria | 15.4 /100 | #202 | Poor 18.9% |
| Tohono O'odham | 14.8 /100 | #203 | Poor 18.9% |
| Immigrants from Romania | 14.6 /100 | #204 | Poor 18.9% |
| Russians | 14.2 /100 | #205 | Poor 18.8% |
| Immigrants from Eastern Asia | 14.1 /100 | #206 | Poor 18.8% |
| Immigrants from Chile | 13.6 /100 | #207 | Poor 18.8% |
| Immigrants from Burma/Myanmar | 13.6 /100 | #208 | Poor 18.8% |
| Immigrants from Egypt | 13.5 /100 | #209 | Poor 18.8% |
| Bulgarians | 13.1 /100 | #210 | Poor 18.8% |
| Immigrants from Kenya | 12.4 /100 | #211 | Poor 18.8% |
Immigrants from Romania 3 or more Vehicles in Household Correlation Summary
| Measurement | Immigrants from Romania Data | 3 or more Vehicles in Household Data |
| Minimum | 0.030% | 0.43% |
| Maximum | 12.5% | 59.2% |
| Range | 12.5% | 58.8% |
| Mean | 2.8% | 24.2% |
| Median | 2.1% | 21.0% |
| Interquartile 25% (IQ1) | 1.0% | 17.8% |
| Interquartile 75% (IQ3) | 3.8% | 28.0% |
| Interquartile Range (IQR) | 2.7% | 10.2% |
| Standard Deviation (Sample) | 2.7% | 11.9% |
| Standard Deviation (Population) | 2.7% | 11.8% |
Correlation Details
| Immigrants from Romania Percentile | Sample Size | 3 or more Vehicles in Household |
[ 0.0% - 0.5% ] 0.030% | 129,786,958 | 19.7% |
[ 0.0% - 0.5% ] 0.089% | 50,818,726 | 19.9% |
[ 0.0% - 0.5% ] 0.15% | 35,113,541 | 15.9% |
[ 0.0% - 0.5% ] 0.21% | 15,167,246 | 18.1% |
[ 0.0% - 0.5% ] 0.28% | 7,232,149 | 20.3% |
[ 0.0% - 0.5% ] 0.34% | 5,104,568 | 20.6% |
[ 0.0% - 0.5% ] 0.40% | 3,613,030 | 20.1% |
[ 0.0% - 0.5% ] 0.46% | 2,247,268 | 21.9% |
[ 0.5% - 1.0% ] 0.52% | 1,756,005 | 18.9% |
[ 0.5% - 1.0% ] 0.59% | 1,517,557 | 18.2% |
[ 0.5% - 1.0% ] 0.65% | 767,870 | 19.6% |
[ 0.5% - 1.0% ] 0.72% | 624,238 | 16.3% |
[ 0.5% - 1.0% ] 0.78% | 690,550 | 18.7% |
[ 0.5% - 1.0% ] 0.85% | 293,064 | 20.4% |
[ 0.5% - 1.0% ] 0.91% | 513,892 | 13.9% |
[ 0.5% - 1.0% ] 0.97% | 274,214 | 22.9% |
[ 1.0% - 1.5% ] 1.03% | 114,945 | 20.7% |
[ 1.0% - 1.5% ] 1.09% | 132,567 | 22.2% |
[ 1.0% - 1.5% ] 1.17% | 77,806 | 24.9% |
[ 1.0% - 1.5% ] 1.23% | 191,066 | 9.9% |
[ 1.0% - 1.5% ] 1.27% | 50,767 | 25.8% |
[ 1.0% - 1.5% ] 1.34% | 181,360 | 22.9% |
[ 1.0% - 1.5% ] 1.39% | 52,825 | 27.4% |
[ 1.0% - 1.5% ] 1.46% | 52,075 | 17.3% |
[ 1.5% - 2.0% ] 1.54% | 36,802 | 21.0% |
[ 1.5% - 2.0% ] 1.57% | 6,667 | 36.5% |
[ 1.5% - 2.0% ] 1.65% | 12,050 | 17.8% |
[ 1.5% - 2.0% ] 1.70% | 7,232 | 25.0% |
[ 1.5% - 2.0% ] 1.76% | 66,164 | 19.7% |
[ 1.5% - 2.0% ] 1.85% | 7,828 | 21.0% |
[ 1.5% - 2.0% ] 1.89% | 93,713 | 15.2% |
[ 1.5% - 2.0% ] 1.98% | 63,866 | 29.4% |
[ 2.0% - 2.5% ] 2.02% | 65,890 | 13.5% |
[ 2.0% - 2.5% ] 2.10% | 11,056 | 24.0% |
[ 2.0% - 2.5% ] 2.15% | 41,134 | 6.4% |
[ 2.0% - 2.5% ] 2.21% | 11,062 | 22.8% |
[ 2.0% - 2.5% ] 2.29% | 523 | 12.9% |
[ 2.0% - 2.5% ] 2.36% | 2,369 | 27.4% |
[ 2.0% - 2.5% ] 2.46% | 27,951 | 18.9% |
[ 2.5% - 3.0% ] 2.54% | 14,652 | 25.9% |
[ 2.5% - 3.0% ] 2.58% | 1,125 | 32.2% |
[ 2.5% - 3.0% ] 2.65% | 1,814 | 28.0% |
[ 2.5% - 3.0% ] 2.77% | 1,048 | 30.3% |
[ 2.5% - 3.0% ] 2.93% | 852 | 16.3% |
[ 2.5% - 3.0% ] 2.94% | 26,939 | 0.43% |
[ 3.0% - 3.5% ] 3.06% | 457 | 44.8% |
[ 3.0% - 3.5% ] 3.19% | 1,003 | 33.3% |
[ 3.0% - 3.5% ] 3.33% | 3,064 | 23.0% |
[ 3.5% - 4.0% ] 3.52% | 426 | 20.3% |
[ 3.5% - 4.0% ] 3.59% | 390 | 31.1% |
[ 3.5% - 4.0% ] 3.77% | 2,812 | 22.3% |
[ 3.5% - 4.0% ] 3.95% | 1,899 | 54.0% |
[ 4.0% - 4.5% ] 4.01% | 673 | 29.0% |
[ 4.0% - 4.5% ] 4.21% | 5,555 | 47.9% |
[ 4.0% - 4.5% ] 4.31% | 116 | 59.2% |
[ 4.0% - 4.5% ] 4.42% | 1,153 | 14.4% |
[ 4.5% - 5.0% ] 4.52% | 974 | 22.2% |
[ 4.5% - 5.0% ] 4.59% | 676 | 55.6% |
[ 4.5% - 5.0% ] 4.70% | 532 | 12.9% |
[ 4.5% - 5.0% ] 4.85% | 268 | 34.4% |
[ 5.0% - 5.5% ] 5.10% | 98 | 5.7% |
[ 6.0% - 6.5% ] 6.33% | 411 | 23.9% |
[ 6.5% - 7.0% ] 6.55% | 412 | 12.0% |
[ 9.0% - 9.5% ] 9.09% | 297 | 46.2% |
[ 12.0% - 12.5% ] 12.10% | 1,885 | 9.6% |
[ 12.0% - 12.5% ] 12.23% | 1,668 | 46.6% |
[ 12.0% - 12.5% ] 12.50% | 40 | 48.7% |