Potawatomi 3 or more Vehicles in Household
COMPARE
Potawatomi
Select to Compare
3 or more Vehicles in Household
Potawatomi 3 or more Vehicles in Household
21.9%
3+ VEHICLES AVAILABLE
99.8/ 100
METRIC RATING
71st/ 347
METRIC RANK
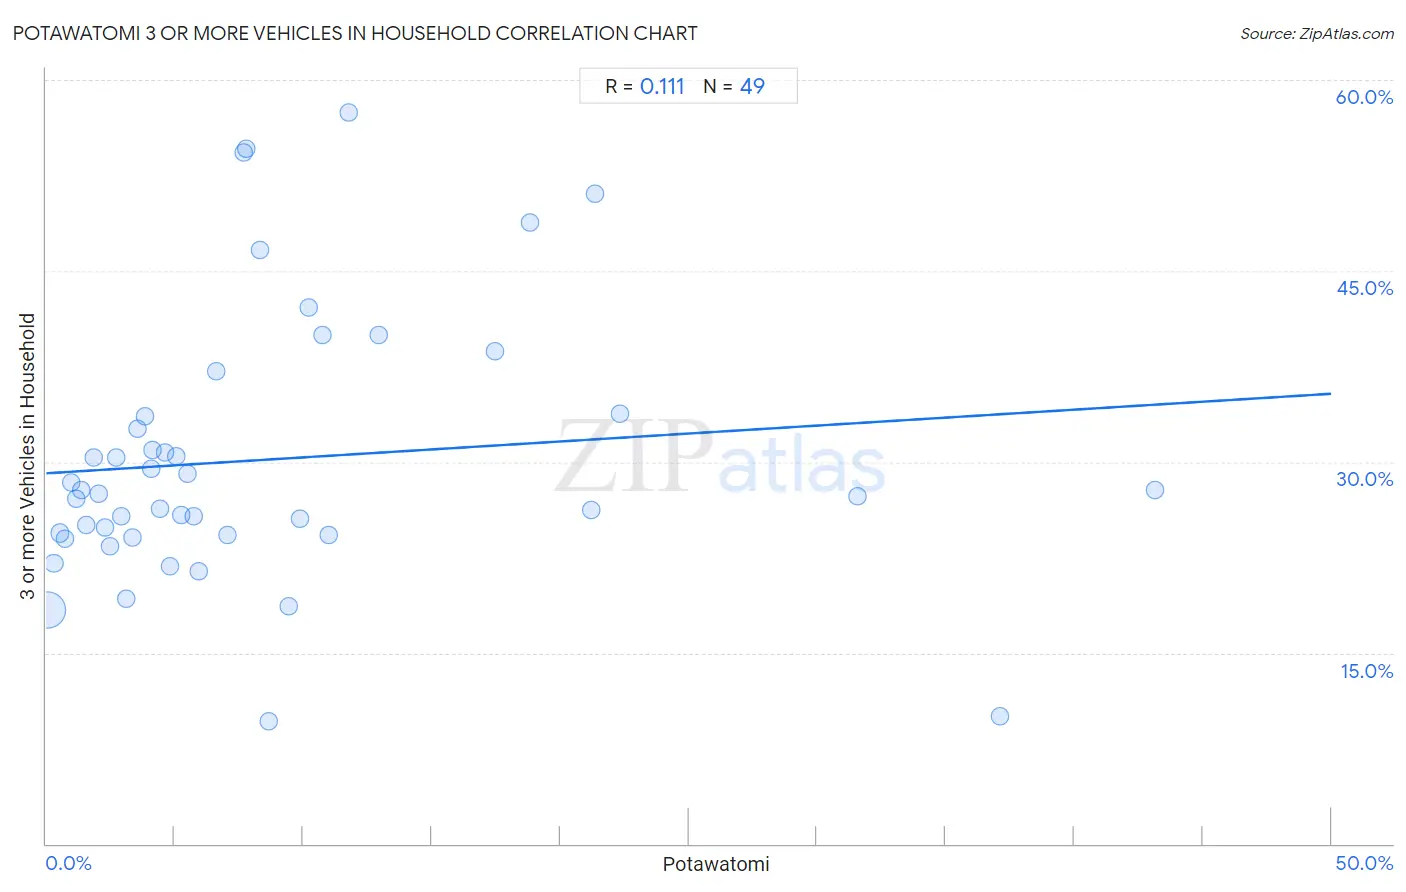
Potawatomi 3 or more Vehicles in Household Correlation Chart
The statistical analysis conducted on geographies consisting of 117,753,482 people shows a poor positive correlation between the proportion of Potawatomi and percentage of households with 3 or more vehicles available in the United States with a correlation coefficient (R) of 0.111 and weighted average of 21.9%. On average, for every 1% (one percent) increase in Potawatomi within a typical geography, there is an increase of 0.13% in percentage of households with 3 or more vehicles available.
It is essential to understand that the correlation between the percentage of Potawatomi and percentage of households with 3 or more vehicles available does not imply a direct cause-and-effect relationship. It remains uncertain whether the presence of Potawatomi influences an upward or downward trend in the level of percentage of households with 3 or more vehicles available within an area, or if Potawatomi simply ended up residing in those areas with higher or lower levels of percentage of households with 3 or more vehicles available due to other factors.
Demographics Similar to Potawatomi by 3 or more Vehicles in Household
In terms of 3 or more vehicles in household, the demographic groups most similar to Potawatomi are Bangladeshi (21.9%, a difference of 0.010%), Portuguese (21.8%, a difference of 0.18%), Creek (21.9%, a difference of 0.20%), British (21.9%, a difference of 0.23%), and Salvadoran (21.8%, a difference of 0.27%).
| Demographics | Rating | Rank | 3 or more Vehicles in Household |
| Immigrants from Taiwan | 99.9 /100 | #64 | Exceptional 22.1% |
| Pima | 99.9 /100 | #65 | Exceptional 22.0% |
| Northern Europeans | 99.9 /100 | #66 | Exceptional 22.0% |
| Alaskan Athabascans | 99.9 /100 | #67 | Exceptional 21.9% |
| British | 99.9 /100 | #68 | Exceptional 21.9% |
| Creek | 99.9 /100 | #69 | Exceptional 21.9% |
| Bangladeshis | 99.8 /100 | #70 | Exceptional 21.9% |
| Potawatomi | 99.8 /100 | #71 | Exceptional 21.9% |
| Portuguese | 99.8 /100 | #72 | Exceptional 21.8% |
| Salvadorans | 99.8 /100 | #73 | Exceptional 21.8% |
| Immigrants from Oceania | 99.8 /100 | #74 | Exceptional 21.8% |
| Japanese | 99.8 /100 | #75 | Exceptional 21.8% |
| Nonimmigrants | 99.8 /100 | #76 | Exceptional 21.8% |
| Irish | 99.8 /100 | #77 | Exceptional 21.8% |
| Czechoslovakians | 99.8 /100 | #78 | Exceptional 21.7% |
Potawatomi 3 or more Vehicles in Household Correlation Summary
| Measurement | Potawatomi Data | 3 or more Vehicles in Household Data |
| Minimum | 0.027% | 9.7% |
| Maximum | 43.2% | 57.4% |
| Range | 43.1% | 47.8% |
| Mean | 8.6% | 30.2% |
| Median | 5.2% | 27.5% |
| Interquartile 25% (IQ1) | 2.6% | 24.2% |
| Interquartile 75% (IQ3) | 10.5% | 33.7% |
| Interquartile Range (IQR) | 7.9% | 9.4% |
| Standard Deviation (Sample) | 9.4% | 10.5% |
| Standard Deviation (Population) | 9.3% | 10.4% |
Correlation Details
| Potawatomi Percentile | Sample Size | 3 or more Vehicles in Household |
[ 0.0% - 0.5% ] 0.027% | 110,247,728 | 18.3% |
[ 0.0% - 0.5% ] 0.29% | 5,312,854 | 22.0% |
[ 0.5% - 1.0% ] 0.53% | 1,024,893 | 24.4% |
[ 0.5% - 1.0% ] 0.73% | 401,480 | 23.9% |
[ 0.5% - 1.0% ] 0.95% | 316,240 | 28.4% |
[ 1.0% - 1.5% ] 1.17% | 92,346 | 27.1% |
[ 1.0% - 1.5% ] 1.37% | 64,289 | 27.7% |
[ 1.5% - 2.0% ] 1.57% | 64,395 | 25.0% |
[ 1.5% - 2.0% ] 1.86% | 30,276 | 30.4% |
[ 2.0% - 2.5% ] 2.04% | 49,501 | 27.5% |
[ 2.0% - 2.5% ] 2.26% | 26,288 | 24.8% |
[ 2.0% - 2.5% ] 2.47% | 47,216 | 23.4% |
[ 2.5% - 3.0% ] 2.71% | 8,626 | 30.4% |
[ 2.5% - 3.0% ] 2.94% | 7,007 | 25.7% |
[ 3.0% - 3.5% ] 3.13% | 5,020 | 19.3% |
[ 3.0% - 3.5% ] 3.37% | 4,689 | 24.0% |
[ 3.5% - 4.0% ] 3.55% | 2,957 | 32.6% |
[ 3.5% - 4.0% ] 3.84% | 1,692 | 33.6% |
[ 4.0% - 4.5% ] 4.08% | 147 | 29.5% |
[ 4.0% - 4.5% ] 4.15% | 3,494 | 30.9% |
[ 4.0% - 4.5% ] 4.41% | 2,132 | 26.4% |
[ 4.5% - 5.0% ] 4.62% | 8,745 | 30.8% |
[ 4.5% - 5.0% ] 4.83% | 5,757 | 21.8% |
[ 5.0% - 5.5% ] 5.06% | 158 | 30.4% |
[ 5.0% - 5.5% ] 5.24% | 2,081 | 25.8% |
[ 5.0% - 5.5% ] 5.50% | 4,948 | 29.0% |
[ 5.5% - 6.0% ] 5.73% | 994 | 25.7% |
[ 5.5% - 6.0% ] 5.95% | 4,572 | 21.4% |
[ 6.5% - 7.0% ] 6.61% | 772 | 37.1% |
[ 7.0% - 7.5% ] 7.06% | 2,607 | 24.3% |
[ 7.5% - 8.0% ] 7.69% | 221 | 54.3% |
[ 7.5% - 8.0% ] 7.80% | 346 | 54.6% |
[ 8.0% - 8.5% ] 8.33% | 240 | 46.7% |
[ 8.5% - 9.0% ] 8.67% | 773 | 9.7% |
[ 9.0% - 9.5% ] 9.43% | 244 | 18.7% |
[ 9.5% - 10.0% ] 9.86% | 487 | 25.6% |
[ 10.0% - 10.5% ] 10.20% | 49 | 42.1% |
[ 10.5% - 11.0% ] 10.73% | 382 | 40.0% |
[ 10.5% - 11.0% ] 10.99% | 182 | 24.2% |
[ 11.5% - 12.0% ] 11.76% | 136 | 57.4% |
[ 12.5% - 13.0% ] 12.93% | 495 | 40.0% |
[ 17.0% - 17.5% ] 17.48% | 143 | 38.7% |
[ 18.5% - 19.0% ] 18.85% | 2,462 | 48.8% |
[ 21.0% - 21.5% ] 21.23% | 1,404 | 26.2% |
[ 21.0% - 21.5% ] 21.37% | 117 | 51.1% |
[ 22.0% - 22.5% ] 22.33% | 1,702 | 33.8% |
[ 31.5% - 32.0% ] 31.58% | 38 | 27.3% |
[ 37.0% - 37.5% ] 37.10% | 62 | 10.0% |
[ 43.0% - 43.5% ] 43.16% | 95 | 27.8% |