Tlingit-Haida Family Poverty

COMPARE

Tlingit-Haida
Race
Ancestry
AfghanAfricanAlaska NativeAlaskan AthabascanAlbanianAleutAlsatianAmericanApacheArabArapahoArgentineanArmenianAssyrian/Chaldean/SyriacAustralianAustrianBahamianBangladeshiBarbadianBasqueBelgianBelizeanBermudanBhutaneseBlackfeetBolivianBrazilianBritishBritish West IndianBulgarianBurmeseCajunCambodianCanadianCape VerdeanCarpatho RusynCelticCentral AmericanCentral American IndianCherokeeCheyenneChickasawChileanChineseChippewaChoctawColombianColvilleComancheCosta RicanCreeCreekCroatianCrowCubanCypriotCzechCzechoslovakianDanishDelawareDominicanDutchDutch West IndianEastern EuropeanEcuadorianEgyptianEnglishEstonianEthiopianEuropeanFijianFilipinoFinnishFrenchFrench American IndianFrench CanadianGermanGerman RussianGhanaianGreekGuamanian/ChamorroGuatemalanGuyaneseHaitianHmongHonduranHopiHoumaHungarianIcelanderIndian (Asian)IndonesianInupiatIranianIraqiIrishIroquoisIsraeliItalianJamaicanJapaneseJordanianKenyanKiowaKoreanLaotianLatvianLebaneseLiberianLithuanianLumbeeLuxembourgerMacedonianMalaysianMalteseMarshalleseMenomineeMexicanMexican American IndianMongolianMoroccanNative HawaiianNavajoNepaleseNew ZealanderNicaraguanNigerianNorthern EuropeanNorwegianOkinawanOsageOttawaPaiutePakistaniPalestinianPanamanianParaguayanPennsylvania GermanPeruvianPimaPolishPortuguesePotawatomiPuebloPuerto RicanPuget Sound SalishRomanianRussianSalvadoranSamoanScandinavianScotch-IrishScottishSeminoleSenegaleseSerbianShoshoneSierra LeoneanSiouxSlavicSlovakSloveneSomaliSouth AfricanSouth AmericanSouth American IndianSoviet UnionSpaniardSpanishSpanish AmericanSpanish American IndianSri LankanSubsaharan AfricanSudaneseSwedishSwissSyrianTaiwaneseThaiTlingit-HaidaTohono O'OdhamTonganTrinidadian and TobagonianTsimshianTurkishU.S. Virgin IslanderUgandanUkrainianUruguayanUteVenezuelanVietnameseWelshWest IndianYakamaYaquiYugoslavianYumanYup'ikZimbabwean
Immigration
NonimmigrantsImmigrantsAfghanistanAfricaAlbaniaArgentinaArmeniaAsiaAustraliaAustriaBahamasBangladeshBarbadosBelarusBelgiumBelizeBoliviaBosnia and HerzegovinaBrazilBulgariaBurma/MyanmarCabo VerdeCambodiaCameroonCanadaCaribbeanCentral AmericaChileChinaColombiaCongoCosta RicaCroatiaCubaCzechoslovakiaDenmarkDominicaDominican RepublicEastern AfricaEastern AsiaEastern EuropeEcuadorEgyptEl SalvadorEnglandEritreaEthiopiaEuropeFijiFranceGermanyGhanaGreeceGrenadaGuatemalaGuyanaHaitiHondurasHong KongHungaryIndiaIndonesiaIranIraqIrelandIsraelItalyJamaicaJapanJordanKazakhstanKenyaKoreaKuwaitLaosLatin AmericaLatviaLebanonLiberiaLithuaniaMalaysiaMexicoMicronesiaMiddle AfricaMoldovaMoroccoNepalNetherlandsNicaraguaNigeriaNorth AmericaNorth MacedoniaNorthern AfricaNorthern EuropeNorwayOceaniaPakistanPanamaPeruPhilippinesPolandPortugalRomaniaRussiaSaudi ArabiaScotlandSenegalSerbiaSierra LeoneSingaporeSomaliaSouth AfricaSouth AmericaSouth Central AsiaSouth Eastern AsiaSouthern EuropeSpainSri LankaSt. Vincent and the GrenadinesSudanSwedenSwitzerlandSyriaTaiwanThailandTrinidad and TobagoTurkeyUgandaUkraineUruguayUzbekistanVenezuelaVietnamWest IndiesWestern AfricaWestern AsiaWestern EuropeYemenZaireZimbabweAzores
Select to Compare
Race
Ancestry
AfghanAfricanAlaska NativeAlaskan AthabascanAlbanianAleutAlsatianAmericanApacheArabArapahoArgentineanArmenianAssyrian/Chaldean/SyriacAustralianAustrianBahamianBangladeshiBarbadianBasqueBelgianBelizeanBermudanBhutaneseBlackfeetBolivianBrazilianBritishBritish West IndianBulgarianBurmeseCajunCambodianCanadianCape VerdeanCarpatho RusynCelticCentral AmericanCentral American IndianCherokeeCheyenneChickasawChileanChineseChippewaChoctawColombianColvilleComancheCosta RicanCreeCreekCroatianCrowCubanCypriotCzechCzechoslovakianDanishDelawareDominicanDutchDutch West IndianEastern EuropeanEcuadorianEgyptianEnglishEstonianEthiopianEuropeanFijianFilipinoFinnishFrenchFrench American IndianFrench CanadianGermanGerman RussianGhanaianGreekGuamanian/ChamorroGuatemalanGuyaneseHaitianHmongHonduranHopiHoumaHungarianIcelanderIndian (Asian)IndonesianInupiatIranianIraqiIrishIroquoisIsraeliItalianJamaicanJapaneseJordanianKenyanKiowaKoreanLaotianLatvianLebaneseLiberianLithuanianLumbeeLuxembourgerMacedonianMalaysianMalteseMarshalleseMenomineeMexicanMexican American IndianMongolianMoroccanNative HawaiianNavajoNepaleseNew ZealanderNicaraguanNigerianNorthern EuropeanNorwegianOkinawanOsageOttawaPaiutePakistaniPalestinianPanamanianParaguayanPennsylvania GermanPeruvianPimaPolishPortuguesePotawatomiPuebloPuerto RicanPuget Sound SalishRomanianRussianSalvadoranSamoanScandinavianScotch-IrishScottishSeminoleSenegaleseSerbianShoshoneSierra LeoneanSiouxSlavicSlovakSloveneSomaliSouth AfricanSouth AmericanSouth American IndianSoviet UnionSpaniardSpanishSpanish AmericanSpanish American IndianSri LankanSubsaharan AfricanSudaneseSwedishSwissSyrianTaiwaneseThaiTohono O'OdhamTonganTrinidadian and TobagonianTsimshianTurkishU.S. Virgin IslanderUgandanUkrainianUruguayanUteVenezuelanVietnameseWelshWest IndianYakamaYaquiYugoslavianYumanYup'ikZimbabwean
Immigration
NonimmigrantsImmigrantsAfghanistanAfricaAlbaniaArgentinaArmeniaAsiaAustraliaAustriaBahamasBangladeshBarbadosBelarusBelgiumBelizeBoliviaBosnia and HerzegovinaBrazilBulgariaBurma/MyanmarCabo VerdeCambodiaCameroonCanadaCaribbeanCentral AmericaChileChinaColombiaCongoCosta RicaCroatiaCubaCzechoslovakiaDenmarkDominicaDominican RepublicEastern AfricaEastern AsiaEastern EuropeEcuadorEgyptEl SalvadorEnglandEritreaEthiopiaEuropeFijiFranceGermanyGhanaGreeceGrenadaGuatemalaGuyanaHaitiHondurasHong KongHungaryIndiaIndonesiaIranIraqIrelandIsraelItalyJamaicaJapanJordanKazakhstanKenyaKoreaKuwaitLaosLatin AmericaLatviaLebanonLiberiaLithuaniaMalaysiaMexicoMicronesiaMiddle AfricaMoldovaMoroccoNepalNetherlandsNicaraguaNigeriaNorth AmericaNorth MacedoniaNorthern AfricaNorthern EuropeNorwayOceaniaPakistanPanamaPeruPhilippinesPolandPortugalRomaniaRussiaSaudi ArabiaScotlandSenegalSerbiaSierra LeoneSingaporeSomaliaSouth AfricaSouth AmericaSouth Central AsiaSouth Eastern AsiaSouthern EuropeSpainSri LankaSt. Vincent and the GrenadinesSudanSwedenSwitzerlandSyriaTaiwanThailandTrinidad and TobagoTurkeyUgandaUkraineUruguayUzbekistanVenezuelaVietnamWest IndiesWestern AfricaWestern AsiaWestern EuropeYemenZaireZimbabweAzores
Family Poverty
Income
Poverty
Unemployment
Labor Participation
Family Structure
Vehicle Availability
Education Level
Disability

Tlingit-Haida Family Poverty
Exceptional

8.0%
POVERTY | FAMILIES
96.7/ 100
METRIC RATING
93rd/ 347
METRIC RANK

Tlingit-Haida Family Poverty Correlation Chart

The statistical analysis conducted on geographies consisting of 60,804,034 people shows a weak positive correlation between the proportion of Tlingit-Haida and poverty level among families in the United States with a correlation coefficient (R) of 0.292 and weighted average of 8.0%. On average, for every 1% (one percent) increase in Tlingit-Haida within a typical geography, there is an increase of 0.061% in poverty level among families.
Tlingit-Haida Family Poverty
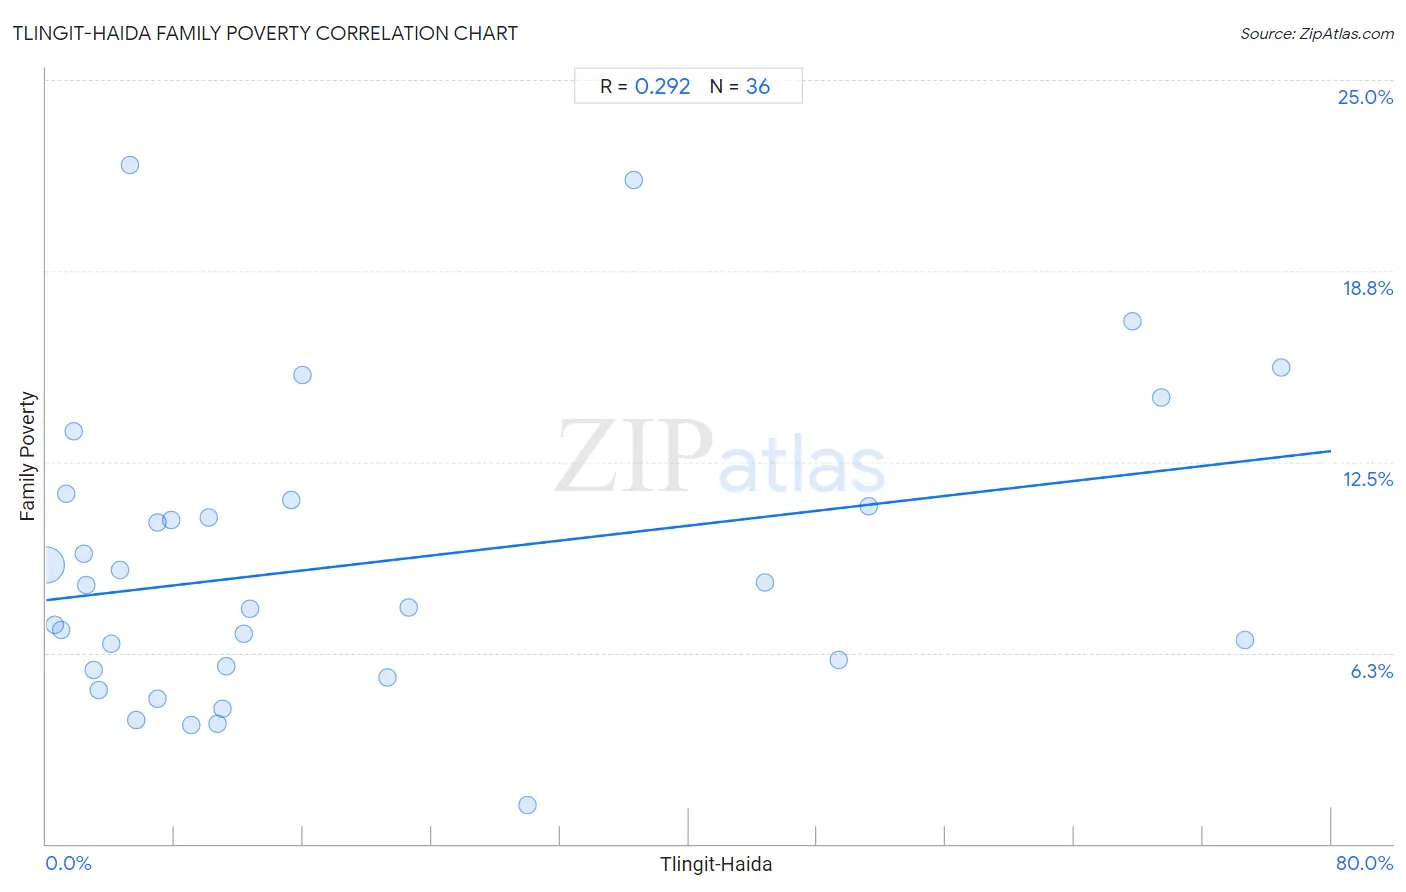
It is essential to understand that the correlation between the percentage of Tlingit-Haida and poverty level among families does not imply a direct cause-and-effect relationship. It remains uncertain whether the presence of Tlingit-Haida influences an upward or downward trend in the level of poverty level among families within an area, or if Tlingit-Haida simply ended up residing in those areas with higher or lower levels of poverty level among families due to other factors.

Demographics Similar to Tlingit-Haida by Family Poverty

In terms of family poverty, the demographic groups most similar to Tlingit-Haida are Immigrants from Pakistan (8.0%, a difference of 0.11%), Immigrants from Philippines (8.0%, a difference of 0.12%), Immigrants from Turkey (8.0%, a difference of 0.14%), Czechoslovakian (8.0%, a difference of 0.18%), and Immigrants from Italy (8.0%, a difference of 0.42%).
DemographicsRating | RankFamily Poverty
Scottish
97.3
/100
|
#86
Exceptional
7.9%
Belgians
97.3
/100
|
#87
Exceptional
8.0%
Serbians
97.2
/100
|
#88
Exceptional
8.0%
Immigrants from Denmark
97.1
/100
|
#89
Exceptional
8.0%
Immigrants from England
97.1
/100
|
#90
Exceptional
8.0%
Immigrants from Italy
97.0
/100
|
#91
Exceptional
8.0%
Czechoslovakians
96.8
/100
|
#92
Exceptional
8.0%
Tlingit-Haida
96.7
/100
|
#93
Exceptional
8.0%
Immigrants from Pakistan
96.6
/100
|
#94
Exceptional
8.0%
Immigrants from Philippines
96.5
/100
|
#95
Exceptional
8.0%
Immigrants from Turkey
96.5
/100
|
#96
Exceptional
8.0%
Immigrants from Switzerland
96.1
/100
|
#97
Exceptional
8.1%
Immigrants from South Africa
95.9
/100
|
#98
Exceptional
8.1%
Welsh
95.8
/100
|
#99
Exceptional
8.1%
New Zealanders
95.8
/100
|
#100
Exceptional
8.1%

Tlingit-Haida Family Poverty Correlation Summary

MeasurementTlingit-Haida DataFamily Poverty Data
Minimum0.036%1.3%
Maximum76.8%22.2%
Range76.8%21.0%
Mean19.7%9.2%
Median10.4%8.1%
Interquartile 25% (IQ1)3.7%5.8%
Interquartile 75% (IQ3)26.3%11.2%
Interquartile Range (IQR)22.6%5.4%
Standard Deviation (Sample)23.2%4.8%
Standard Deviation (Population)22.8%4.8%

Correlation Details

Tlingit-Haida PercentileSample SizeFamily Poverty
[
0.0%
-
0.5%
]
0.036%
58,984,3509.1%
[
0.5%
-
1.0%
]
0.54%
1,309,8327.2%
[
0.5%
-
1.0%
]
0.91%
246,6147.0%
[
1.0%
-
1.5%
]
1.24%
83,27211.5%
[
1.5%
-
2.0%
]
1.71%
25,68513.5%
[
2.0%
-
2.5%
]
2.30%
7,5319.5%
[
2.0%
-
2.5%
]
2.46%
3,4118.5%
[
2.5%
-
3.0%
]
2.95%
3,7265.7%
[
3.0%
-
3.5%
]
3.27%
3,5125.0%
[
4.0%
-
4.5%
]
4.04%
5446.6%
[
4.5%
-
5.0%
]
4.62%
8229.0%
[
5.0%
-
5.5%
]
5.24%
42022.2%
[
5.5%
-
6.0%
]
5.62%
1,7624.0%
[
6.5%
-
7.0%
]
6.91%
56410.5%
[
6.5%
-
7.0%
]
6.94%
2,1464.8%
[
7.5%
-
8.0%
]
7.80%
1,25710.6%
[
8.5%
-
9.0%
]
9.00%
6,6913.9%
[
10.0%
-
10.5%
]
10.13%
2,90210.7%
[
10.5%
-
11.0%
]
10.70%
29,9333.9%
[
11.0%
-
11.5%
]
11.00%
32,1084.4%
[
11.0%
-
11.5%
]
11.18%
13,9135.8%
[
12.0%
-
12.5%
]
12.26%
18,0416.9%
[
12.5%
-
13.0%
]
12.67%
8,1687.7%
[
15.0%
-
15.5%
]
15.26%
2,16911.3%
[
15.5%
-
16.0%
]
15.92%
1,72715.3%
[
21.0%
-
21.5%
]
21.23%
4,2675.4%
[
22.5%
-
23.0%
]
22.55%
1,0737.8%
[
29.5%
-
30.0%
]
29.96%
1,1281.3%
[
36.5%
-
37.0%
]
36.59%
8221.7%
[
44.5%
-
45.0%
]
44.78%
9208.5%
[
49.0%
-
49.5%
]
49.33%
1,7926.0%
[
51.0%
-
51.5%
]
51.24%
80411.0%
[
67.5%
-
68.0%
]
67.59%
36117.1%
[
69.0%
-
69.5%
]
69.41%
1,60214.6%
[
74.5%
-
75.0%
]
74.63%
676.7%
[
76.5%
-
77.0%
]
76.85%
83815.6%