Tlingit-Haida Male Unemployment
COMPARE
Tlingit-Haida
Select to Compare
Male Unemployment
Tlingit-Haida Male Unemployment
6.0%
UNEMPLOYMENT | MALES
0.0/ 100
METRIC RATING
276th/ 347
METRIC RANK
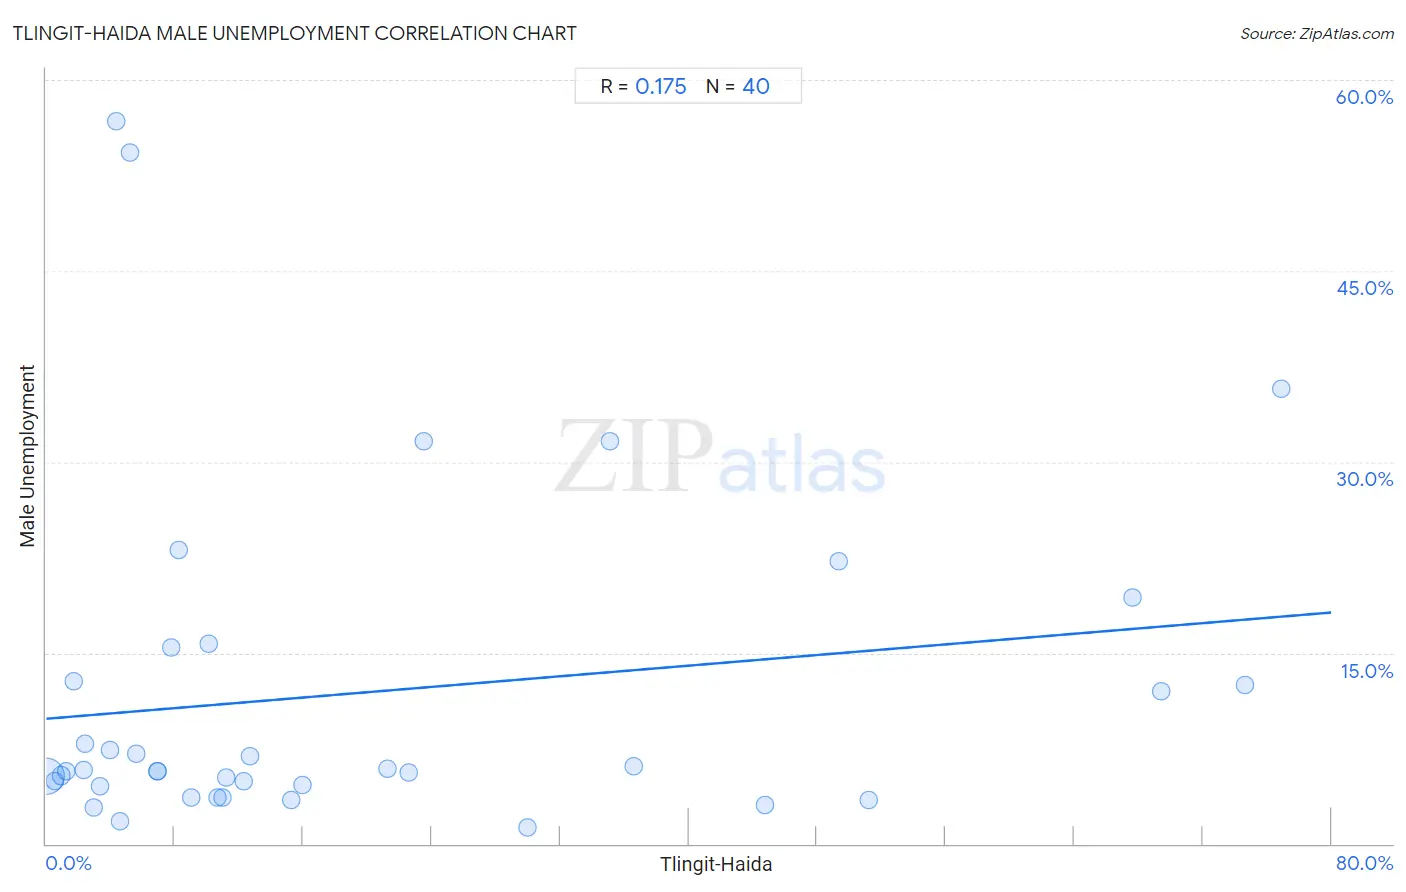
Tlingit-Haida Male Unemployment Correlation Chart
The statistical analysis conducted on geographies consisting of 60,678,234 people shows a poor positive correlation between the proportion of Tlingit-Haida and unemployment rate among males in the United States with a correlation coefficient (R) of 0.175 and weighted average of 6.0%. On average, for every 1% (one percent) increase in Tlingit-Haida within a typical geography, there is an increase of 0.10% in unemployment rate among males.
It is essential to understand that the correlation between the percentage of Tlingit-Haida and unemployment rate among males does not imply a direct cause-and-effect relationship. It remains uncertain whether the presence of Tlingit-Haida influences an upward or downward trend in the level of unemployment rate among males within an area, or if Tlingit-Haida simply ended up residing in those areas with higher or lower levels of unemployment rate among males due to other factors.
Demographics Similar to Tlingit-Haida by Male Unemployment
In terms of male unemployment, the demographic groups most similar to Tlingit-Haida are Menominee (6.0%, a difference of 0.10%), Immigrants from Sierra Leone (6.0%, a difference of 0.25%), Immigrants from Liberia (6.1%, a difference of 0.42%), Immigrants from Uzbekistan (6.0%, a difference of 0.43%), and Armenian (6.0%, a difference of 0.43%).
| Demographics | Rating | Rank | Male Unemployment |
| Immigrants from Nigeria | 0.0 /100 | #269 | Tragic 6.0% |
| Sub-Saharan Africans | 0.0 /100 | #270 | Tragic 6.0% |
| Blackfeet | 0.0 /100 | #271 | Tragic 6.0% |
| Immigrants from Uzbekistan | 0.0 /100 | #272 | Tragic 6.0% |
| Armenians | 0.0 /100 | #273 | Tragic 6.0% |
| Immigrants from Sierra Leone | 0.0 /100 | #274 | Tragic 6.0% |
| Menominee | 0.0 /100 | #275 | Tragic 6.0% |
| Tlingit-Haida | 0.0 /100 | #276 | Tragic 6.0% |
| Immigrants from Liberia | 0.0 /100 | #277 | Tragic 6.1% |
| Immigrants from Fiji | 0.0 /100 | #278 | Tragic 6.1% |
| Ghanaians | 0.0 /100 | #279 | Tragic 6.1% |
| Immigrants from Ghana | 0.0 /100 | #280 | Tragic 6.2% |
| Sierra Leoneans | 0.0 /100 | #281 | Tragic 6.2% |
| Ecuadorians | 0.0 /100 | #282 | Tragic 6.2% |
| Immigrants from Western Africa | 0.0 /100 | #283 | Tragic 6.2% |
Tlingit-Haida Male Unemployment Correlation Summary
| Measurement | Tlingit-Haida Data | Male Unemployment Data |
| Minimum | 0.036% | 1.3% |
| Maximum | 76.8% | 56.8% |
| Range | 76.8% | 55.5% |
| Mean | 19.5% | 11.9% |
| Median | 10.4% | 5.8% |
| Interquartile 25% (IQ1) | 4.2% | 4.6% |
| Interquartile 75% (IQ3) | 26.7% | 14.1% |
| Interquartile Range (IQR) | 22.6% | 9.5% |
| Standard Deviation (Sample) | 22.3% | 13.3% |
| Standard Deviation (Population) | 22.0% | 13.1% |
Correlation Details
| Tlingit-Haida Percentile | Sample Size | Male Unemployment |
[ 0.0% - 0.5% ] 0.036% | 58,883,837 | 5.3% |
[ 0.5% - 1.0% ] 0.55% | 1,293,388 | 4.9% |
[ 0.5% - 1.0% ] 0.91% | 239,018 | 5.4% |
[ 1.0% - 1.5% ] 1.23% | 81,286 | 5.7% |
[ 1.5% - 2.0% ] 1.74% | 21,107 | 12.8% |
[ 2.0% - 2.5% ] 2.30% | 7,382 | 5.8% |
[ 2.0% - 2.5% ] 2.45% | 2,372 | 7.9% |
[ 2.5% - 3.0% ] 2.92% | 6,194 | 2.9% |
[ 3.0% - 3.5% ] 3.35% | 5,726 | 4.6% |
[ 3.5% - 4.0% ] 3.97% | 1,964 | 7.4% |
[ 4.0% - 4.5% ] 4.35% | 115 | 56.8% |
[ 4.5% - 5.0% ] 4.62% | 822 | 1.8% |
[ 5.0% - 5.5% ] 5.24% | 420 | 54.3% |
[ 5.5% - 6.0% ] 5.62% | 1,762 | 7.1% |
[ 6.5% - 7.0% ] 6.91% | 564 | 5.7% |
[ 6.5% - 7.0% ] 6.94% | 2,146 | 5.7% |
[ 7.5% - 8.0% ] 7.80% | 1,257 | 15.4% |
[ 8.0% - 8.5% ] 8.22% | 146 | 23.1% |
[ 8.5% - 9.0% ] 9.00% | 6,691 | 3.6% |
[ 10.0% - 10.5% ] 10.13% | 2,902 | 15.7% |
[ 10.5% - 11.0% ] 10.70% | 29,933 | 3.6% |
[ 11.0% - 11.5% ] 11.00% | 32,108 | 3.6% |
[ 11.0% - 11.5% ] 11.18% | 13,913 | 5.2% |
[ 12.0% - 12.5% ] 12.26% | 18,041 | 4.9% |
[ 12.5% - 13.0% ] 12.67% | 8,168 | 6.9% |
[ 15.0% - 15.5% ] 15.26% | 2,169 | 3.4% |
[ 15.5% - 16.0% ] 15.92% | 1,727 | 4.6% |
[ 21.0% - 21.5% ] 21.23% | 4,267 | 5.9% |
[ 22.5% - 23.0% ] 22.55% | 1,073 | 5.6% |
[ 23.5% - 24.0% ] 23.53% | 85 | 31.6% |
[ 29.5% - 30.0% ] 29.96% | 1,128 | 1.3% |
[ 35.0% - 35.5% ] 35.09% | 57 | 31.6% |
[ 36.5% - 37.0% ] 36.59% | 82 | 6.1% |
[ 44.5% - 45.0% ] 44.78% | 920 | 3.0% |
[ 49.0% - 49.5% ] 49.33% | 1,792 | 22.2% |
[ 51.0% - 51.5% ] 51.24% | 804 | 3.4% |
[ 67.5% - 68.0% ] 67.59% | 361 | 19.3% |
[ 69.0% - 69.5% ] 69.41% | 1,602 | 12.0% |
[ 74.5% - 75.0% ] 74.63% | 67 | 12.5% |
[ 76.5% - 77.0% ] 76.85% | 838 | 35.7% |