Immigrants from Africa 3 or more Vehicles in Household
COMPARE
Immigrants from Africa
Select to Compare
3 or more Vehicles in Household
Immigrants from Africa 3 or more Vehicles in Household
17.6%
3+ VEHICLES AVAILABLE
0.5/ 100
METRIC RATING
272nd/ 347
METRIC RANK
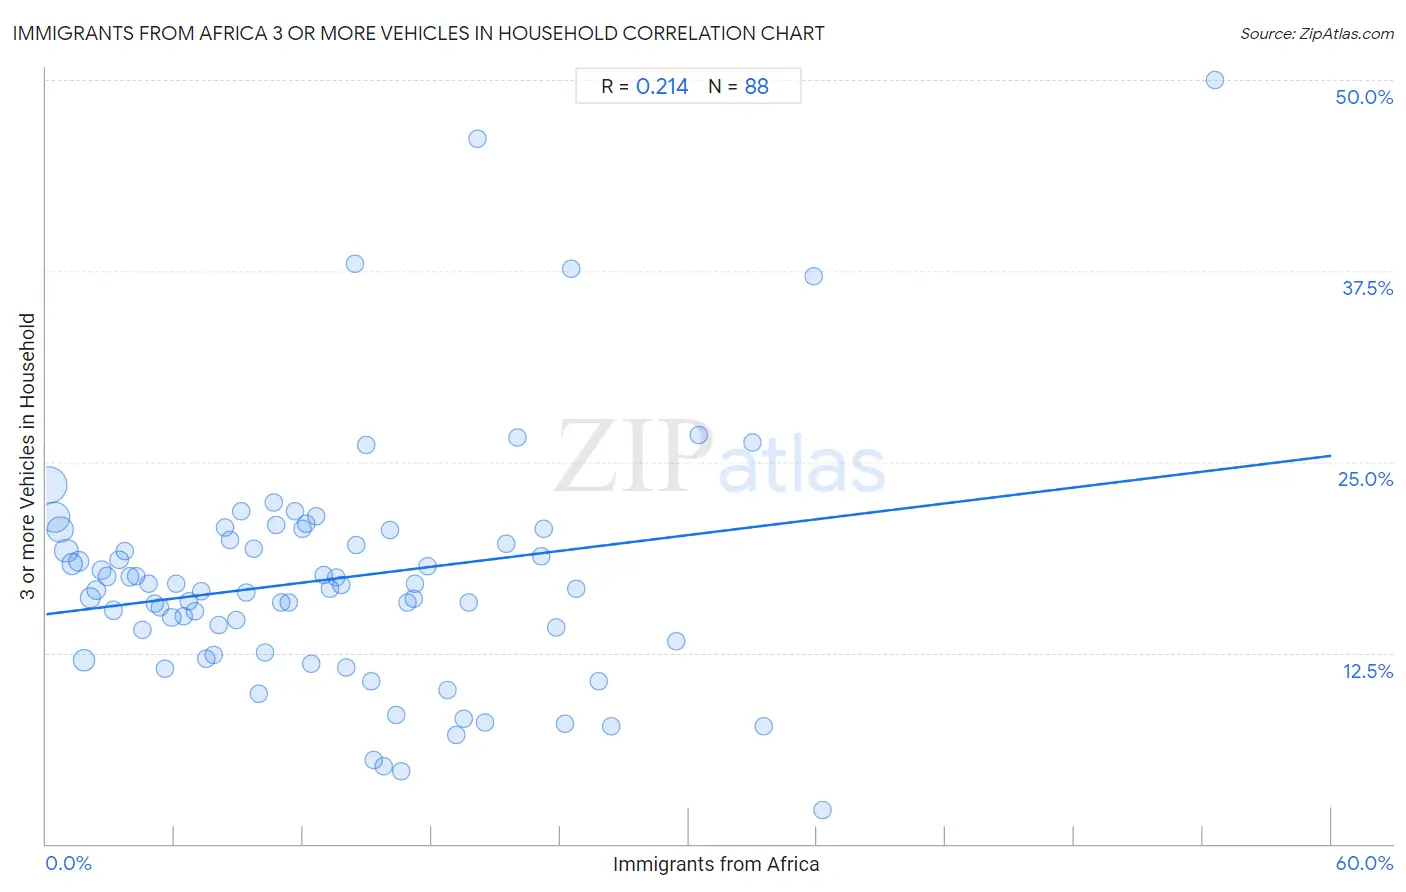
Immigrants from Africa 3 or more Vehicles in Household Correlation Chart
The statistical analysis conducted on geographies consisting of 468,754,030 people shows a weak positive correlation between the proportion of Immigrants from Africa and percentage of households with 3 or more vehicles available in the United States with a correlation coefficient (R) of 0.214 and weighted average of 17.6%. On average, for every 1% (one percent) increase in Immigrants from Africa within a typical geography, there is an increase of 0.17% in percentage of households with 3 or more vehicles available.
It is essential to understand that the correlation between the percentage of Immigrants from Africa and percentage of households with 3 or more vehicles available does not imply a direct cause-and-effect relationship. It remains uncertain whether the presence of Immigrants from Africa influences an upward or downward trend in the level of percentage of households with 3 or more vehicles available within an area, or if Immigrants from Africa simply ended up residing in those areas with higher or lower levels of percentage of households with 3 or more vehicles available due to other factors.
Demographics Similar to Immigrants from Africa by 3 or more Vehicles in Household
In terms of 3 or more vehicles in household, the demographic groups most similar to Immigrants from Africa are Immigrants from Sudan (17.6%, a difference of 0.040%), Immigrants from Bosnia and Herzegovina (17.5%, a difference of 0.18%), Immigrants from Nepal (17.6%, a difference of 0.41%), South American (17.6%, a difference of 0.41%), and Immigrants from France (17.6%, a difference of 0.46%).
| Demographics | Rating | Rank | 3 or more Vehicles in Household |
| Immigrants from Panama | 0.8 /100 | #265 | Tragic 17.7% |
| Macedonians | 0.8 /100 | #266 | Tragic 17.7% |
| Immigrants from Venezuela | 0.8 /100 | #267 | Tragic 17.7% |
| Immigrants from Bulgaria | 0.8 /100 | #268 | Tragic 17.7% |
| Immigrants from France | 0.6 /100 | #269 | Tragic 17.6% |
| Immigrants from Nepal | 0.6 /100 | #270 | Tragic 17.6% |
| South Americans | 0.6 /100 | #271 | Tragic 17.6% |
| Immigrants from Africa | 0.5 /100 | #272 | Tragic 17.6% |
| Immigrants from Sudan | 0.5 /100 | #273 | Tragic 17.6% |
| Immigrants from Bosnia and Herzegovina | 0.5 /100 | #274 | Tragic 17.5% |
| Immigrants from Ukraine | 0.4 /100 | #275 | Tragic 17.5% |
| Okinawans | 0.4 /100 | #276 | Tragic 17.4% |
| Brazilians | 0.4 /100 | #277 | Tragic 17.4% |
| Immigrants from Bahamas | 0.3 /100 | #278 | Tragic 17.4% |
| Immigrants from Kazakhstan | 0.3 /100 | #279 | Tragic 17.4% |
Immigrants from Africa 3 or more Vehicles in Household Correlation Summary
| Measurement | Immigrants from Africa Data | 3 or more Vehicles in Household Data |
| Minimum | 0.13% | 2.2% |
| Maximum | 54.5% | 50.0% |
| Range | 54.4% | 47.8% |
| Mean | 13.5% | 17.4% |
| Median | 12.0% | 16.7% |
| Interquartile 25% (IQ1) | 6.0% | 12.9% |
| Interquartile 75% (IQ3) | 18.9% | 20.2% |
| Interquartile Range (IQR) | 13.0% | 7.3% |
| Standard Deviation (Sample) | 9.9% | 8.0% |
| Standard Deviation (Population) | 9.8% | 7.9% |
Correlation Details
| Immigrants from Africa Percentile | Sample Size | 3 or more Vehicles in Household |
[ 0.0% - 0.5% ] 0.13% | 137,479,477 | 23.5% |
[ 0.0% - 0.5% ] 0.40% | 95,707,372 | 21.4% |
[ 0.5% - 1.0% ] 0.67% | 61,983,152 | 20.6% |
[ 0.5% - 1.0% ] 0.94% | 44,258,291 | 19.2% |
[ 1.0% - 1.5% ] 1.21% | 24,049,670 | 18.3% |
[ 1.0% - 1.5% ] 1.50% | 17,747,016 | 18.5% |
[ 1.5% - 2.0% ] 1.78% | 23,433,781 | 12.0% |
[ 2.0% - 2.5% ] 2.04% | 14,439,421 | 16.1% |
[ 2.0% - 2.5% ] 2.32% | 7,964,010 | 16.6% |
[ 2.5% - 3.0% ] 2.59% | 5,365,130 | 17.9% |
[ 2.5% - 3.0% ] 2.85% | 5,885,545 | 17.5% |
[ 3.0% - 3.5% ] 3.14% | 4,493,997 | 15.3% |
[ 3.0% - 3.5% ] 3.41% | 3,459,474 | 18.6% |
[ 3.5% - 4.0% ] 3.67% | 2,666,470 | 19.2% |
[ 3.5% - 4.0% ] 3.92% | 1,619,338 | 17.5% |
[ 4.0% - 4.5% ] 4.22% | 1,694,685 | 17.5% |
[ 4.0% - 4.5% ] 4.49% | 1,414,744 | 14.0% |
[ 4.5% - 5.0% ] 4.78% | 1,543,031 | 17.0% |
[ 5.0% - 5.5% ] 5.09% | 2,197,397 | 15.7% |
[ 5.0% - 5.5% ] 5.30% | 1,237,242 | 15.5% |
[ 5.5% - 6.0% ] 5.56% | 756,600 | 11.5% |
[ 5.5% - 6.0% ] 5.86% | 1,503,848 | 14.8% |
[ 6.0% - 6.5% ] 6.08% | 791,592 | 17.0% |
[ 6.0% - 6.5% ] 6.40% | 587,650 | 14.9% |
[ 6.5% - 7.0% ] 6.67% | 509,020 | 15.9% |
[ 6.5% - 7.0% ] 6.92% | 548,437 | 15.2% |
[ 7.0% - 7.5% ] 7.23% | 484,039 | 16.5% |
[ 7.0% - 7.5% ] 7.50% | 236,890 | 12.2% |
[ 7.5% - 8.0% ] 7.80% | 464,663 | 12.4% |
[ 8.0% - 8.5% ] 8.05% | 249,770 | 14.3% |
[ 8.0% - 8.5% ] 8.32% | 273,494 | 20.7% |
[ 8.5% - 9.0% ] 8.61% | 224,610 | 19.9% |
[ 8.5% - 9.0% ] 8.88% | 165,878 | 14.7% |
[ 9.0% - 9.5% ] 9.13% | 271,410 | 21.7% |
[ 9.0% - 9.5% ] 9.34% | 175,960 | 16.4% |
[ 9.5% - 10.0% ] 9.71% | 414,213 | 19.3% |
[ 9.5% - 10.0% ] 9.94% | 112,394 | 9.8% |
[ 10.0% - 10.5% ] 10.23% | 199,793 | 12.5% |
[ 10.5% - 11.0% ] 10.60% | 106,915 | 22.3% |
[ 10.5% - 11.0% ] 10.74% | 31,403 | 20.8% |
[ 10.5% - 11.0% ] 10.99% | 219,819 | 15.8% |
[ 11.0% - 11.5% ] 11.33% | 129,038 | 15.8% |
[ 11.5% - 12.0% ] 11.59% | 174,030 | 21.8% |
[ 11.5% - 12.0% ] 11.94% | 47,305 | 20.6% |
[ 12.0% - 12.5% ] 12.12% | 198,710 | 21.0% |
[ 12.0% - 12.5% ] 12.39% | 85,199 | 11.8% |
[ 12.5% - 13.0% ] 12.60% | 31,679 | 21.5% |
[ 12.5% - 13.0% ] 12.94% | 214,064 | 17.6% |
[ 13.0% - 13.5% ] 13.24% | 108,203 | 16.7% |
[ 13.5% - 14.0% ] 13.57% | 152,655 | 17.5% |
[ 13.5% - 14.0% ] 13.77% | 65,413 | 16.9% |
[ 14.0% - 14.5% ] 14.03% | 54,073 | 11.5% |
[ 14.0% - 14.5% ] 14.44% | 2,348 | 38.0% |
[ 14.5% - 15.0% ] 14.50% | 29,687 | 19.6% |
[ 14.5% - 15.0% ] 14.95% | 37,693 | 26.1% |
[ 15.0% - 15.5% ] 15.19% | 29,516 | 10.7% |
[ 15.0% - 15.5% ] 15.28% | 28,172 | 5.5% |
[ 15.5% - 16.0% ] 15.75% | 16,076 | 5.1% |
[ 16.0% - 16.5% ] 16.03% | 36,105 | 20.5% |
[ 16.0% - 16.5% ] 16.33% | 72,959 | 8.4% |
[ 16.5% - 17.0% ] 16.59% | 31,151 | 4.7% |
[ 16.5% - 17.0% ] 16.87% | 26,071 | 15.8% |
[ 17.0% - 17.5% ] 17.14% | 3,588 | 16.0% |
[ 17.0% - 17.5% ] 17.20% | 56,532 | 17.0% |
[ 17.5% - 18.0% ] 17.78% | 27,919 | 18.1% |
[ 18.5% - 19.0% ] 18.73% | 19,999 | 10.0% |
[ 19.0% - 19.5% ] 19.16% | 981 | 7.1% |
[ 19.5% - 20.0% ] 19.51% | 82 | 8.2% |
[ 19.5% - 20.0% ] 19.71% | 13,580 | 15.8% |
[ 20.0% - 20.5% ] 20.12% | 825 | 46.2% |
[ 20.0% - 20.5% ] 20.48% | 332 | 7.9% |
[ 21.0% - 21.5% ] 21.47% | 8,290 | 19.6% |
[ 22.0% - 22.5% ] 22.01% | 309 | 26.6% |
[ 23.0% - 23.5% ] 23.11% | 7,703 | 18.8% |
[ 23.0% - 23.5% ] 23.22% | 267 | 20.6% |
[ 23.5% - 24.0% ] 23.82% | 14,553 | 14.1% |
[ 24.0% - 24.5% ] 24.22% | 2,849 | 7.9% |
[ 24.5% - 25.0% ] 24.51% | 5,011 | 37.7% |
[ 24.5% - 25.0% ] 24.74% | 97 | 16.7% |
[ 25.5% - 26.0% ] 25.78% | 26,762 | 10.6% |
[ 26.0% - 26.5% ] 26.36% | 1,157 | 7.7% |
[ 29.0% - 29.5% ] 29.42% | 15,489 | 13.2% |
[ 30.0% - 30.5% ] 30.48% | 105 | 26.8% |
[ 32.5% - 33.0% ] 32.97% | 182 | 26.2% |
[ 33.0% - 33.5% ] 33.48% | 660 | 7.7% |
[ 35.5% - 36.0% ] 35.82% | 67 | 37.1% |
[ 36.0% - 36.5% ] 36.22% | 8,892 | 2.2% |
[ 54.5% - 55.0% ] 54.55% | 11 | 50.0% |