Inupiat 3 or more Vehicles in Household

COMPARE

Inupiat
Race
Ancestry
AfghanAfricanAlaska NativeAlaskan AthabascanAlbanianAleutAlsatianAmericanApacheArabArapahoArgentineanArmenianAssyrian/Chaldean/SyriacAustralianAustrianBahamianBangladeshiBarbadianBasqueBelgianBelizeanBermudanBhutaneseBlackfeetBolivianBrazilianBritishBritish West IndianBulgarianBurmeseCajunCambodianCanadianCape VerdeanCarpatho RusynCelticCentral AmericanCentral American IndianCherokeeCheyenneChickasawChileanChineseChippewaChoctawColombianColvilleComancheCosta RicanCreeCreekCroatianCrowCubanCypriotCzechCzechoslovakianDanishDelawareDominicanDutchDutch West IndianEastern EuropeanEcuadorianEgyptianEnglishEstonianEthiopianEuropeanFijianFilipinoFinnishFrenchFrench American IndianFrench CanadianGermanGerman RussianGhanaianGreekGuamanian/ChamorroGuatemalanGuyaneseHaitianHmongHonduranHopiHoumaHungarianIcelanderIndian (Asian)IndonesianInupiatIranianIraqiIrishIroquoisIsraeliItalianJamaicanJapaneseJordanianKenyanKiowaKoreanLaotianLatvianLebaneseLiberianLithuanianLumbeeLuxembourgerMacedonianMalaysianMalteseMarshalleseMenomineeMexicanMexican American IndianMongolianMoroccanNative HawaiianNavajoNepaleseNew ZealanderNicaraguanNigerianNorthern EuropeanNorwegianOkinawanOsageOttawaPaiutePakistaniPalestinianPanamanianParaguayanPennsylvania GermanPeruvianPimaPolishPortuguesePotawatomiPuebloPuerto RicanPuget Sound SalishRomanianRussianSalvadoranSamoanScandinavianScotch-IrishScottishSeminoleSenegaleseSerbianShoshoneSierra LeoneanSiouxSlavicSlovakSloveneSomaliSouth AfricanSouth AmericanSouth American IndianSoviet UnionSpaniardSpanishSpanish AmericanSpanish American IndianSri LankanSubsaharan AfricanSudaneseSwedishSwissSyrianTaiwaneseThaiTlingit-HaidaTohono O'OdhamTonganTrinidadian and TobagonianTsimshianTurkishU.S. Virgin IslanderUgandanUkrainianUruguayanUteVenezuelanVietnameseWelshWest IndianYakamaYaquiYugoslavianYumanYup'ikZimbabwean
Immigration
NonimmigrantsImmigrantsAfghanistanAfricaAlbaniaArgentinaArmeniaAsiaAustraliaAustriaBahamasBangladeshBarbadosBelarusBelgiumBelizeBoliviaBosnia and HerzegovinaBrazilBulgariaBurma/MyanmarCabo VerdeCambodiaCameroonCanadaCaribbeanCentral AmericaChileChinaColombiaCongoCosta RicaCroatiaCubaCzechoslovakiaDenmarkDominicaDominican RepublicEastern AfricaEastern AsiaEastern EuropeEcuadorEgyptEl SalvadorEnglandEritreaEthiopiaEuropeFijiFranceGermanyGhanaGreeceGrenadaGuatemalaGuyanaHaitiHondurasHong KongHungaryIndiaIndonesiaIranIraqIrelandIsraelItalyJamaicaJapanJordanKazakhstanKenyaKoreaKuwaitLaosLatin AmericaLatviaLebanonLiberiaLithuaniaMalaysiaMexicoMicronesiaMiddle AfricaMoldovaMoroccoNepalNetherlandsNicaraguaNigeriaNorth AmericaNorth MacedoniaNorthern AfricaNorthern EuropeNorwayOceaniaPakistanPanamaPeruPhilippinesPolandPortugalRomaniaRussiaSaudi ArabiaScotlandSenegalSerbiaSierra LeoneSingaporeSomaliaSouth AfricaSouth AmericaSouth Central AsiaSouth Eastern AsiaSouthern EuropeSpainSri LankaSt. Vincent and the GrenadinesSudanSwedenSwitzerlandSyriaTaiwanThailandTrinidad and TobagoTurkeyUgandaUkraineUruguayUzbekistanVenezuelaVietnamWest IndiesWestern AfricaWestern AsiaWestern EuropeYemenZaireZimbabweAzores
Select to Compare
Race
Ancestry
AfghanAfricanAlaska NativeAlaskan AthabascanAlbanianAleutAlsatianAmericanApacheArabArapahoArgentineanArmenianAssyrian/Chaldean/SyriacAustralianAustrianBahamianBangladeshiBarbadianBasqueBelgianBelizeanBermudanBhutaneseBlackfeetBolivianBrazilianBritishBritish West IndianBulgarianBurmeseCajunCambodianCanadianCape VerdeanCarpatho RusynCelticCentral AmericanCentral American IndianCherokeeCheyenneChickasawChileanChineseChippewaChoctawColombianColvilleComancheCosta RicanCreeCreekCroatianCrowCubanCypriotCzechCzechoslovakianDanishDelawareDominicanDutchDutch West IndianEastern EuropeanEcuadorianEgyptianEnglishEstonianEthiopianEuropeanFijianFilipinoFinnishFrenchFrench American IndianFrench CanadianGermanGerman RussianGhanaianGreekGuamanian/ChamorroGuatemalanGuyaneseHaitianHmongHonduranHopiHoumaHungarianIcelanderIndian (Asian)IndonesianIranianIraqiIrishIroquoisIsraeliItalianJamaicanJapaneseJordanianKenyanKiowaKoreanLaotianLatvianLebaneseLiberianLithuanianLumbeeLuxembourgerMacedonianMalaysianMalteseMarshalleseMenomineeMexicanMexican American IndianMongolianMoroccanNative HawaiianNavajoNepaleseNew ZealanderNicaraguanNigerianNorthern EuropeanNorwegianOkinawanOsageOttawaPaiutePakistaniPalestinianPanamanianParaguayanPennsylvania GermanPeruvianPimaPolishPortuguesePotawatomiPuebloPuerto RicanPuget Sound SalishRomanianRussianSalvadoranSamoanScandinavianScotch-IrishScottishSeminoleSenegaleseSerbianShoshoneSierra LeoneanSiouxSlavicSlovakSloveneSomaliSouth AfricanSouth AmericanSouth American IndianSoviet UnionSpaniardSpanishSpanish AmericanSpanish American IndianSri LankanSubsaharan AfricanSudaneseSwedishSwissSyrianTaiwaneseThaiTlingit-HaidaTohono O'OdhamTonganTrinidadian and TobagonianTsimshianTurkishU.S. Virgin IslanderUgandanUkrainianUruguayanUteVenezuelanVietnameseWelshWest IndianYakamaYaquiYugoslavianYumanYup'ikZimbabwean
Immigration
NonimmigrantsImmigrantsAfghanistanAfricaAlbaniaArgentinaArmeniaAsiaAustraliaAustriaBahamasBangladeshBarbadosBelarusBelgiumBelizeBoliviaBosnia and HerzegovinaBrazilBulgariaBurma/MyanmarCabo VerdeCambodiaCameroonCanadaCaribbeanCentral AmericaChileChinaColombiaCongoCosta RicaCroatiaCubaCzechoslovakiaDenmarkDominicaDominican RepublicEastern AfricaEastern AsiaEastern EuropeEcuadorEgyptEl SalvadorEnglandEritreaEthiopiaEuropeFijiFranceGermanyGhanaGreeceGrenadaGuatemalaGuyanaHaitiHondurasHong KongHungaryIndiaIndonesiaIranIraqIrelandIsraelItalyJamaicaJapanJordanKazakhstanKenyaKoreaKuwaitLaosLatin AmericaLatviaLebanonLiberiaLithuaniaMalaysiaMexicoMicronesiaMiddle AfricaMoldovaMoroccoNepalNetherlandsNicaraguaNigeriaNorth AmericaNorth MacedoniaNorthern AfricaNorthern EuropeNorwayOceaniaPakistanPanamaPeruPhilippinesPolandPortugalRomaniaRussiaSaudi ArabiaScotlandSenegalSerbiaSierra LeoneSingaporeSomaliaSouth AfricaSouth AmericaSouth Central AsiaSouth Eastern AsiaSouthern EuropeSpainSri LankaSt. Vincent and the GrenadinesSudanSwedenSwitzerlandSyriaTaiwanThailandTrinidad and TobagoTurkeyUgandaUkraineUruguayUzbekistanVenezuelaVietnamWest IndiesWestern AfricaWestern AsiaWestern EuropeYemenZaireZimbabweAzores
3 or more Vehicles in Household
Income
Poverty
Unemployment
Labor Participation
Family Structure
Vehicle Availability
Education Level
Disability

Inupiat 3 or more Vehicles in Household
Tragic

16.9%
3+ VEHICLES AVAILABLE
0.1/ 100
METRIC RATING
296th/ 347
METRIC RANK

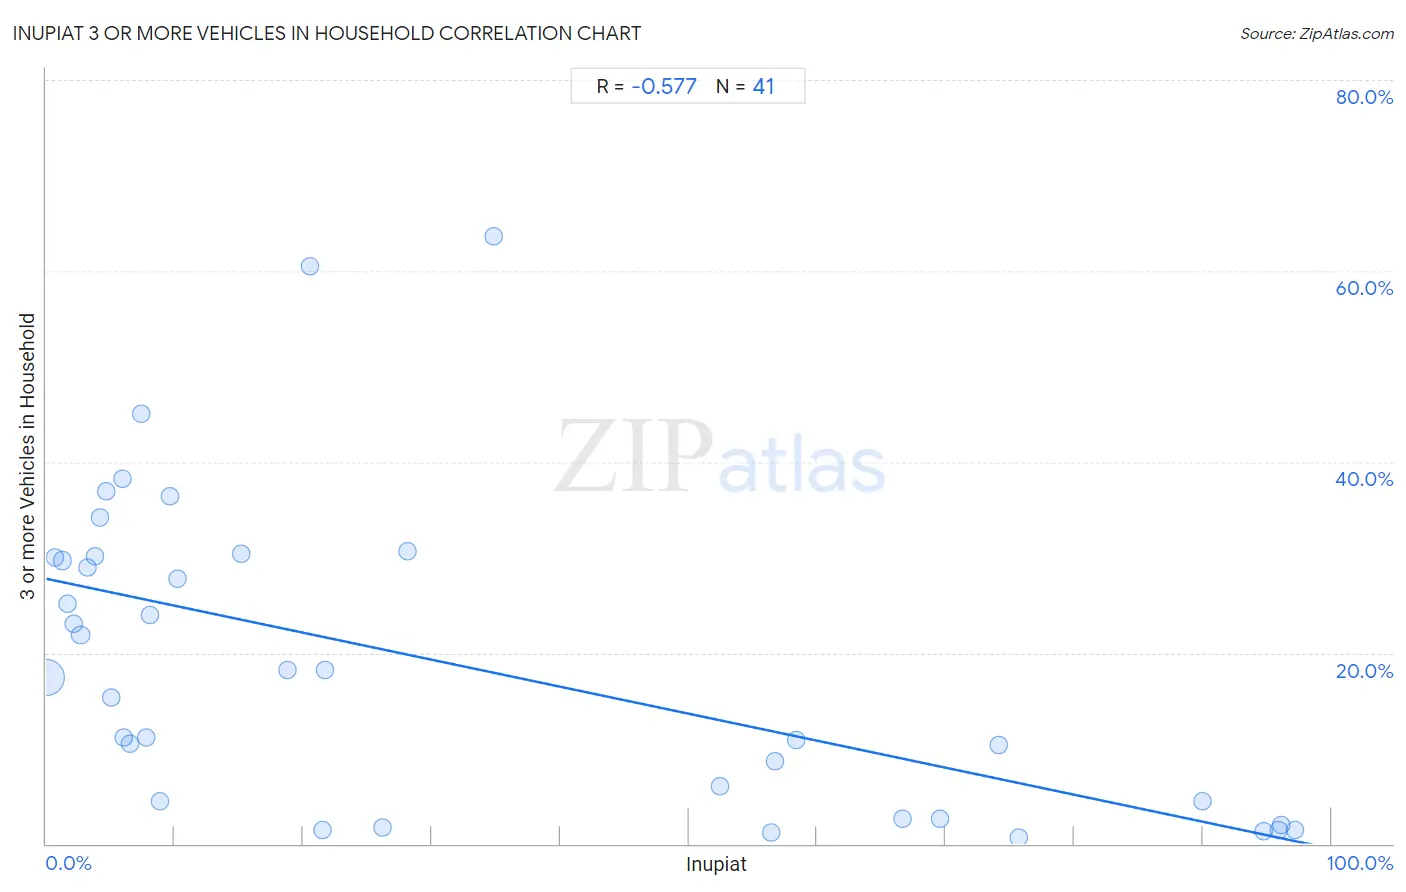
Inupiat 3 or more Vehicles in Household Correlation Chart

The statistical analysis conducted on geographies consisting of 96,277,833 people shows a substantial negative correlation between the proportion of Inupiat and percentage of households with 3 or more vehicles available in the United States with a correlation coefficient (R) of -0.577 and weighted average of 16.9%. On average, for every 1% (one percent) increase in Inupiat within a typical geography, there is a decrease of 0.28% in percentage of households with 3 or more vehicles available.
Inupiat 3 or more Vehicles in Household
It is essential to understand that the correlation between the percentage of Inupiat and percentage of households with 3 or more vehicles available does not imply a direct cause-and-effect relationship. It remains uncertain whether the presence of Inupiat influences an upward or downward trend in the level of percentage of households with 3 or more vehicles available within an area, or if Inupiat simply ended up residing in those areas with higher or lower levels of percentage of households with 3 or more vehicles available due to other factors.

Demographics Similar to Inupiat by 3 or more Vehicles in Household

In terms of 3 or more vehicles in household, the demographic groups most similar to Inupiat are Immigrants from Russia (16.9%, a difference of 0.36%), Immigrants from Western Africa (16.9%, a difference of 0.41%), Israeli (16.8%, a difference of 0.47%), Bahamian (16.9%, a difference of 0.52%), and Immigrants from Spain (17.0%, a difference of 0.60%).
DemographicsRating | Rank3 or more Vehicles in Household
Immigrants from Liberia
0.1
/100
|
#289
Tragic
17.1%
Liberians
0.1
/100
|
#290
Tragic
17.0%
Immigrants from Congo
0.1
/100
|
#291
Tragic
17.0%
Immigrants from Spain
0.1
/100
|
#292
Tragic
17.0%
Bahamians
0.1
/100
|
#293
Tragic
16.9%
Immigrants from Western Africa
0.1
/100
|
#294
Tragic
16.9%
Immigrants from Russia
0.1
/100
|
#295
Tragic
16.9%
Inupiat
0.1
/100
|
#296
Tragic
16.9%
Israelis
0.1
/100
|
#297
Tragic
16.8%
Immigrants from Zaire
0.1
/100
|
#298
Tragic
16.7%
Immigrants from South America
0.1
/100
|
#299
Tragic
16.7%
Cypriots
0.0
/100
|
#300
Tragic
16.6%
Paraguayans
0.0
/100
|
#301
Tragic
16.6%
Immigrants from Greece
0.0
/100
|
#302
Tragic
16.5%
Immigrants from Serbia
0.0
/100
|
#303
Tragic
16.4%

Inupiat 3 or more Vehicles in Household Correlation Summary

MeasurementInupiat Data3 or more Vehicles in Household Data
Minimum0.028%0.71%
Maximum97.1%63.6%
Range97.1%62.9%
Mean31.0%19.0%
Median15.2%17.4%
Interquartile 25% (IQ1)4.9%3.5%
Interquartile 75% (IQ3)57.5%30.0%
Interquartile Range (IQR)52.6%26.5%
Standard Deviation (Sample)33.1%16.3%
Standard Deviation (Population)32.7%16.1%

Correlation Details

Inupiat PercentileSample Size3 or more Vehicles in Household
[
0.0%
-
0.5%
]
0.028%
94,659,53817.4%
[
0.5%
-
1.0%
]
0.70%
422,95530.0%
[
1.0%
-
1.5%
]
1.25%
319,46929.7%
[
1.5%
-
2.0%
]
1.64%
94,80825.1%
[
2.0%
-
2.5%
]
2.16%
449,25623.1%
[
2.5%
-
3.0%
]
2.67%
165,72821.9%
[
3.0%
-
3.5%
]
3.19%
32,64029.0%
[
3.5%
-
4.0%
]
3.75%
68,65430.1%
[
4.0%
-
4.5%
]
4.18%
7,50834.1%
[
4.5%
-
5.0%
]
4.69%
3,07036.9%
[
5.0%
-
5.5%
]
5.06%
6,46415.3%
[
5.5%
-
6.0%
]
5.93%
84338.3%
[
6.0%
-
6.5%
]
6.06%
1,96411.1%
[
6.5%
-
7.0%
]
6.50%
2,76810.5%
[
7.0%
-
7.5%
]
7.41%
5445.0%
[
7.5%
-
8.0%
]
7.77%
92711.2%
[
8.0%
-
8.5%
]
8.05%
58424.0%
[
8.5%
-
9.0%
]
8.82%
4994.4%
[
9.5%
-
10.0%
]
9.60%
4,22936.4%
[
10.0%
-
10.5%
]
10.25%
47827.7%
[
15.0%
-
15.5%
]
15.20%
32930.4%
[
18.5%
-
19.0%
]
18.75%
1618.2%
[
20.5%
-
21.0%
]
20.51%
7860.5%
[
21.0%
-
21.5%
]
21.47%
8431.4%
[
21.5%
-
22.0%
]
21.74%
6918.2%
[
26.0%
-
26.5%
]
26.16%
6921.7%
[
28.0%
-
28.5%
]
28.09%
8930.6%
[
34.5%
-
35.0%
]
34.78%
4663.6%
[
52.0%
-
52.5%
]
52.38%
9,7556.1%
[
56.0%
-
56.5%
]
56.38%
7521.2%
[
56.5%
-
57.0%
]
56.68%
4,4538.6%
[
58.0%
-
58.5%
]
58.36%
4,15010.8%
[
66.5%
-
67.0%
]
66.61%
3,2552.6%
[
69.5%
-
70.0%
]
69.59%
3,0882.6%
[
74.0%
-
74.5%
]
74.11%
1,12810.3%
[
75.5%
-
76.0%
]
75.68%
1,2420.71%
[
89.5%
-
90.0%
]
89.95%
3784.4%
[
94.5%
-
95.0%
]
94.72%
1,1361.3%
[
95.5%
-
96.0%
]
95.96%
1,2881.5%
[
96.0%
-
96.5%
]
96.08%
1,0722.0%
[
97.0%
-
97.5%
]
97.14%
1,5381.4%