Tlingit-Haida Child Poverty Under the Age of 5

COMPARE

Tlingit-Haida
Race
Ancestry
AfghanAfricanAlaska NativeAlaskan AthabascanAlbanianAleutAlsatianAmericanApacheArabArapahoArgentineanArmenianAssyrian/Chaldean/SyriacAustralianAustrianBahamianBangladeshiBarbadianBasqueBelgianBelizeanBermudanBhutaneseBlackfeetBolivianBrazilianBritishBritish West IndianBulgarianBurmeseCajunCambodianCanadianCape VerdeanCarpatho RusynCelticCentral AmericanCentral American IndianCherokeeCheyenneChickasawChileanChineseChippewaChoctawColombianColvilleComancheCosta RicanCreeCreekCroatianCrowCubanCypriotCzechCzechoslovakianDanishDelawareDominicanDutchDutch West IndianEastern EuropeanEcuadorianEgyptianEnglishEstonianEthiopianEuropeanFijianFilipinoFinnishFrenchFrench American IndianFrench CanadianGermanGerman RussianGhanaianGreekGuamanian/ChamorroGuatemalanGuyaneseHaitianHmongHonduranHopiHoumaHungarianIcelanderIndian (Asian)IndonesianInupiatIranianIraqiIrishIroquoisIsraeliItalianJamaicanJapaneseJordanianKenyanKiowaKoreanLaotianLatvianLebaneseLiberianLithuanianLumbeeLuxembourgerMacedonianMalaysianMalteseMarshalleseMenomineeMexicanMexican American IndianMongolianMoroccanNative HawaiianNavajoNepaleseNew ZealanderNicaraguanNigerianNorthern EuropeanNorwegianOkinawanOsageOttawaPaiutePakistaniPalestinianPanamanianParaguayanPennsylvania GermanPeruvianPimaPolishPortuguesePotawatomiPuebloPuerto RicanPuget Sound SalishRomanianRussianSalvadoranSamoanScandinavianScotch-IrishScottishSeminoleSenegaleseSerbianShoshoneSierra LeoneanSiouxSlavicSlovakSloveneSomaliSouth AfricanSouth AmericanSouth American IndianSoviet UnionSpaniardSpanishSpanish AmericanSpanish American IndianSri LankanSubsaharan AfricanSudaneseSwedishSwissSyrianTaiwaneseThaiTlingit-HaidaTohono O'OdhamTonganTrinidadian and TobagonianTsimshianTurkishU.S. Virgin IslanderUgandanUkrainianUruguayanUteVenezuelanVietnameseWelshWest IndianYakamaYaquiYugoslavianYumanYup'ikZimbabwean
Immigration
NonimmigrantsImmigrantsAfghanistanAfricaAlbaniaArgentinaArmeniaAsiaAustraliaAustriaBahamasBangladeshBarbadosBelarusBelgiumBelizeBoliviaBosnia and HerzegovinaBrazilBulgariaBurma/MyanmarCabo VerdeCambodiaCameroonCanadaCaribbeanCentral AmericaChileChinaColombiaCongoCosta RicaCroatiaCubaCzechoslovakiaDenmarkDominicaDominican RepublicEastern AfricaEastern AsiaEastern EuropeEcuadorEgyptEl SalvadorEnglandEritreaEthiopiaEuropeFijiFranceGermanyGhanaGreeceGrenadaGuatemalaGuyanaHaitiHondurasHong KongHungaryIndiaIndonesiaIranIraqIrelandIsraelItalyJamaicaJapanJordanKazakhstanKenyaKoreaKuwaitLaosLatin AmericaLatviaLebanonLiberiaLithuaniaMalaysiaMexicoMicronesiaMiddle AfricaMoldovaMoroccoNepalNetherlandsNicaraguaNigeriaNorth AmericaNorth MacedoniaNorthern AfricaNorthern EuropeNorwayOceaniaPakistanPanamaPeruPhilippinesPolandPortugalRomaniaRussiaSaudi ArabiaScotlandSenegalSerbiaSierra LeoneSingaporeSomaliaSouth AfricaSouth AmericaSouth Central AsiaSouth Eastern AsiaSouthern EuropeSpainSri LankaSt. Vincent and the GrenadinesSudanSwedenSwitzerlandSyriaTaiwanThailandTrinidad and TobagoTurkeyUgandaUkraineUruguayUzbekistanVenezuelaVietnamWest IndiesWestern AfricaWestern AsiaWestern EuropeYemenZaireZimbabweAzores
Select to Compare
Race
Ancestry
AfghanAfricanAlaska NativeAlaskan AthabascanAlbanianAleutAlsatianAmericanApacheArabArapahoArgentineanArmenianAssyrian/Chaldean/SyriacAustralianAustrianBahamianBangladeshiBarbadianBasqueBelgianBelizeanBermudanBhutaneseBlackfeetBolivianBrazilianBritishBritish West IndianBulgarianBurmeseCajunCambodianCanadianCape VerdeanCarpatho RusynCelticCentral AmericanCentral American IndianCherokeeCheyenneChickasawChileanChineseChippewaChoctawColombianColvilleComancheCosta RicanCreeCreekCroatianCrowCubanCypriotCzechCzechoslovakianDanishDelawareDominicanDutchDutch West IndianEastern EuropeanEcuadorianEgyptianEnglishEstonianEthiopianEuropeanFijianFilipinoFinnishFrenchFrench American IndianFrench CanadianGermanGerman RussianGhanaianGreekGuamanian/ChamorroGuatemalanGuyaneseHaitianHmongHonduranHopiHoumaHungarianIcelanderIndian (Asian)IndonesianInupiatIranianIraqiIrishIroquoisIsraeliItalianJamaicanJapaneseJordanianKenyanKiowaKoreanLaotianLatvianLebaneseLiberianLithuanianLumbeeLuxembourgerMacedonianMalaysianMalteseMarshalleseMenomineeMexicanMexican American IndianMongolianMoroccanNative HawaiianNavajoNepaleseNew ZealanderNicaraguanNigerianNorthern EuropeanNorwegianOkinawanOsageOttawaPaiutePakistaniPalestinianPanamanianParaguayanPennsylvania GermanPeruvianPimaPolishPortuguesePotawatomiPuebloPuerto RicanPuget Sound SalishRomanianRussianSalvadoranSamoanScandinavianScotch-IrishScottishSeminoleSenegaleseSerbianShoshoneSierra LeoneanSiouxSlavicSlovakSloveneSomaliSouth AfricanSouth AmericanSouth American IndianSoviet UnionSpaniardSpanishSpanish AmericanSpanish American IndianSri LankanSubsaharan AfricanSudaneseSwedishSwissSyrianTaiwaneseThaiTohono O'OdhamTonganTrinidadian and TobagonianTsimshianTurkishU.S. Virgin IslanderUgandanUkrainianUruguayanUteVenezuelanVietnameseWelshWest IndianYakamaYaquiYugoslavianYumanYup'ikZimbabwean
Immigration
NonimmigrantsImmigrantsAfghanistanAfricaAlbaniaArgentinaArmeniaAsiaAustraliaAustriaBahamasBangladeshBarbadosBelarusBelgiumBelizeBoliviaBosnia and HerzegovinaBrazilBulgariaBurma/MyanmarCabo VerdeCambodiaCameroonCanadaCaribbeanCentral AmericaChileChinaColombiaCongoCosta RicaCroatiaCubaCzechoslovakiaDenmarkDominicaDominican RepublicEastern AfricaEastern AsiaEastern EuropeEcuadorEgyptEl SalvadorEnglandEritreaEthiopiaEuropeFijiFranceGermanyGhanaGreeceGrenadaGuatemalaGuyanaHaitiHondurasHong KongHungaryIndiaIndonesiaIranIraqIrelandIsraelItalyJamaicaJapanJordanKazakhstanKenyaKoreaKuwaitLaosLatin AmericaLatviaLebanonLiberiaLithuaniaMalaysiaMexicoMicronesiaMiddle AfricaMoldovaMoroccoNepalNetherlandsNicaraguaNigeriaNorth AmericaNorth MacedoniaNorthern AfricaNorthern EuropeNorwayOceaniaPakistanPanamaPeruPhilippinesPolandPortugalRomaniaRussiaSaudi ArabiaScotlandSenegalSerbiaSierra LeoneSingaporeSomaliaSouth AfricaSouth AmericaSouth Central AsiaSouth Eastern AsiaSouthern EuropeSpainSri LankaSt. Vincent and the GrenadinesSudanSwedenSwitzerlandSyriaTaiwanThailandTrinidad and TobagoTurkeyUgandaUkraineUruguayUzbekistanVenezuelaVietnamWest IndiesWestern AfricaWestern AsiaWestern EuropeYemenZaireZimbabweAzores
Child Poverty Under the Age of 5
Income
Poverty
Unemployment
Labor Participation
Family Structure
Vehicle Availability
Education Level
Disability

Tlingit-Haida Child Poverty Under the Age of 5
Exceptional

15.9%
POVERTY | CHILDREN < 5
94.7/ 100
METRIC RATING
106th/ 347
METRIC RANK

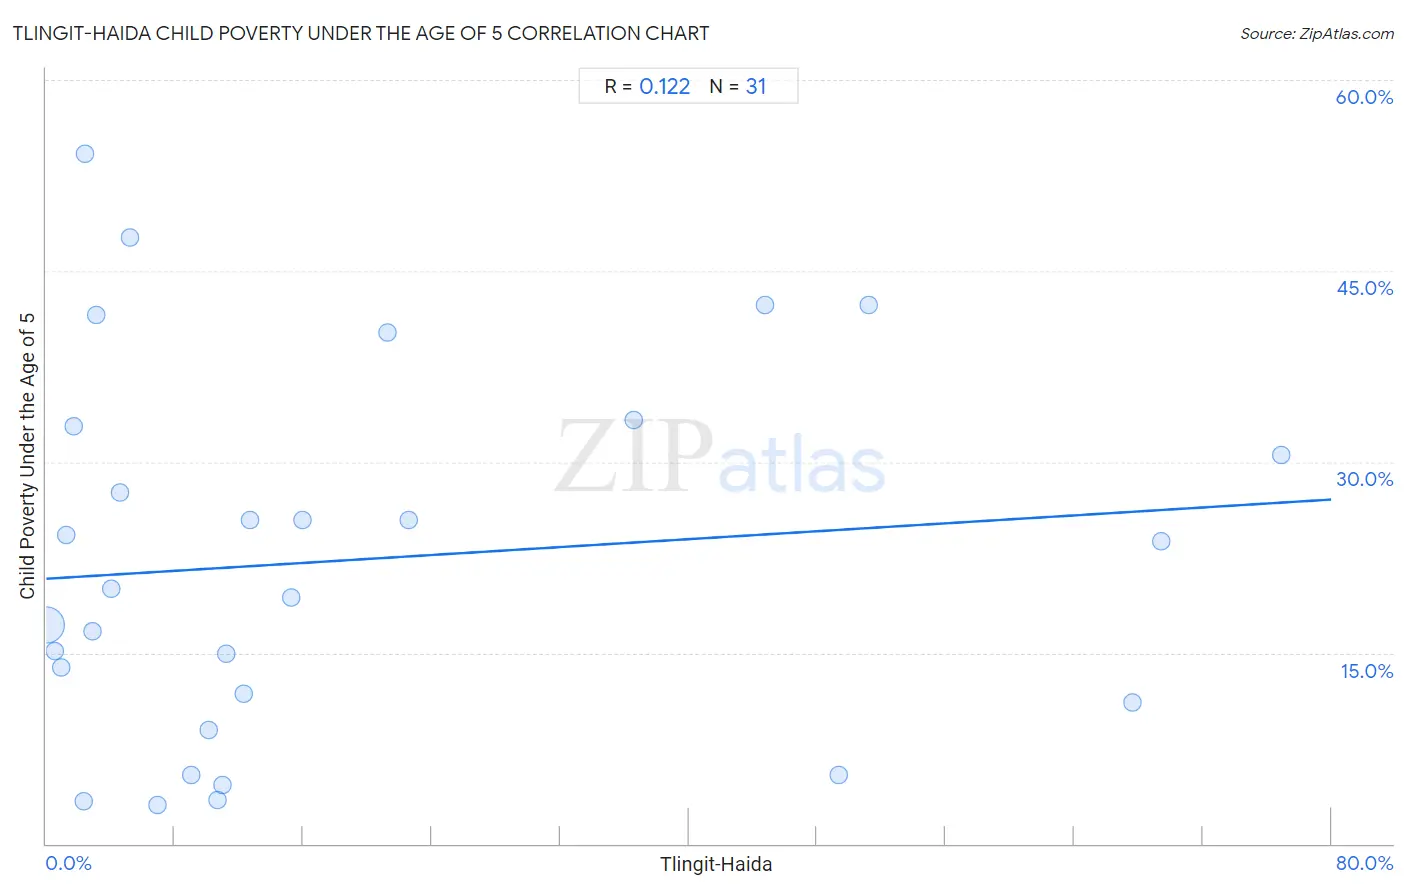
Tlingit-Haida Child Poverty Under the Age of 5 Correlation Chart

The statistical analysis conducted on geographies consisting of 59,941,006 people shows a poor positive correlation between the proportion of Tlingit-Haida and poverty level among children under the age of 5 in the United States with a correlation coefficient (R) of 0.122 and weighted average of 15.9%. On average, for every 1% (one percent) increase in Tlingit-Haida within a typical geography, there is an increase of 0.078% in poverty level among children under the age of 5.
Tlingit-Haida Child Poverty Under the Age of 5
It is essential to understand that the correlation between the percentage of Tlingit-Haida and poverty level among children under the age of 5 does not imply a direct cause-and-effect relationship. It remains uncertain whether the presence of Tlingit-Haida influences an upward or downward trend in the level of poverty level among children under the age of 5 within an area, or if Tlingit-Haida simply ended up residing in those areas with higher or lower levels of poverty level among children under the age of 5 due to other factors.

Demographics Similar to Tlingit-Haida by Child Poverty Under the Age of 5

In terms of child poverty under the age of 5, the demographic groups most similar to Tlingit-Haida are Immigrants from Spain (15.9%, a difference of 0.050%), Immigrants from North America (15.9%, a difference of 0.12%), Slovene (16.0%, a difference of 0.14%), Immigrants from Brazil (16.0%, a difference of 0.16%), and Northern European (16.0%, a difference of 0.24%).
DemographicsRating | RankChild Poverty Under the Age of 5
Palestinians
95.9
/100
|
#99
Exceptional
15.8%
Immigrants from Canada
95.9
/100
|
#100
Exceptional
15.8%
Immigrants from Zimbabwe
95.9
/100
|
#101
Exceptional
15.8%
Armenians
95.7
/100
|
#102
Exceptional
15.8%
Europeans
95.3
/100
|
#103
Exceptional
15.9%
Immigrants from North America
94.9
/100
|
#104
Exceptional
15.9%
Immigrants from Spain
94.8
/100
|
#105
Exceptional
15.9%
Tlingit-Haida
94.7
/100
|
#106
Exceptional
15.9%
Slovenes
94.4
/100
|
#107
Exceptional
16.0%
Immigrants from Brazil
94.4
/100
|
#108
Exceptional
16.0%
Northern Europeans
94.3
/100
|
#109
Exceptional
16.0%
Romanians
94.3
/100
|
#110
Exceptional
16.0%
Pakistanis
94.2
/100
|
#111
Exceptional
16.0%
Peruvians
94.1
/100
|
#112
Exceptional
16.0%
Puget Sound Salish
94.1
/100
|
#113
Exceptional
16.0%

Tlingit-Haida Child Poverty Under the Age of 5 Correlation Summary

MeasurementTlingit-Haida DataChild Poverty Under the Age of 5 Data
Minimum0.035%3.0%
Maximum76.8%54.2%
Range76.8%51.2%
Mean18.8%22.3%
Median10.7%20.0%
Interquartile 25% (IQ1)2.9%11.1%
Interquartile 75% (IQ3)22.6%32.8%
Interquartile Range (IQR)19.7%21.7%
Standard Deviation (Sample)22.5%14.3%
Standard Deviation (Population)22.1%14.1%

Correlation Details

Tlingit-Haida PercentileSample SizeChild Poverty Under the Age of 5
[
0.0%
-
0.5%
]
0.035%
58,296,29117.2%
[
0.5%
-
1.0%
]
0.55%
1,191,84215.1%
[
0.5%
-
1.0%
]
0.91%
214,43213.8%
[
1.0%
-
1.5%
]
1.22%
71,92424.3%
[
1.5%
-
2.0%
]
1.71%
25,20332.8%
[
2.0%
-
2.5%
]
2.30%
7,5313.4%
[
2.0%
-
2.5%
]
2.44%
2,12854.2%
[
2.5%
-
3.0%
]
2.87%
69816.7%
[
3.0%
-
3.5%
]
3.12%
1,21641.5%
[
4.0%
-
4.5%
]
4.04%
54420.0%
[
4.5%
-
5.0%
]
4.62%
82227.6%
[
5.0%
-
5.5%
]
5.24%
42047.6%
[
6.5%
-
7.0%
]
6.91%
5643.0%
[
8.5%
-
9.0%
]
9.00%
6,6915.4%
[
10.0%
-
10.5%
]
10.13%
2,9028.9%
[
10.5%
-
11.0%
]
10.70%
29,9333.4%
[
11.0%
-
11.5%
]
11.00%
32,1084.6%
[
11.0%
-
11.5%
]
11.18%
13,91314.9%
[
12.0%
-
12.5%
]
12.26%
18,04111.8%
[
12.5%
-
13.0%
]
12.67%
8,16825.4%
[
15.0%
-
15.5%
]
15.26%
2,16919.3%
[
15.5%
-
16.0%
]
15.92%
1,72725.4%
[
21.0%
-
21.5%
]
21.23%
4,26740.1%
[
22.5%
-
23.0%
]
22.55%
1,07325.5%
[
36.5%
-
37.0%
]
36.59%
8233.3%
[
44.5%
-
45.0%
]
44.78%
92042.3%
[
49.0%
-
49.5%
]
49.33%
1,7925.4%
[
51.0%
-
51.5%
]
51.24%
80442.3%
[
67.5%
-
68.0%
]
67.59%
36111.1%
[
69.0%
-
69.5%
]
69.41%
1,60223.7%
[
76.5%
-
77.0%
]
76.85%
83830.6%