Immigrants from North America 3 or more Vehicles in Household
COMPARE
Immigrants from North America
Select to Compare
3 or more Vehicles in Household
Immigrants from North America 3 or more Vehicles in Household
20.2%
3+ VEHICLES AVAILABLE
87.8/ 100
METRIC RATING
133rd/ 347
METRIC RANK
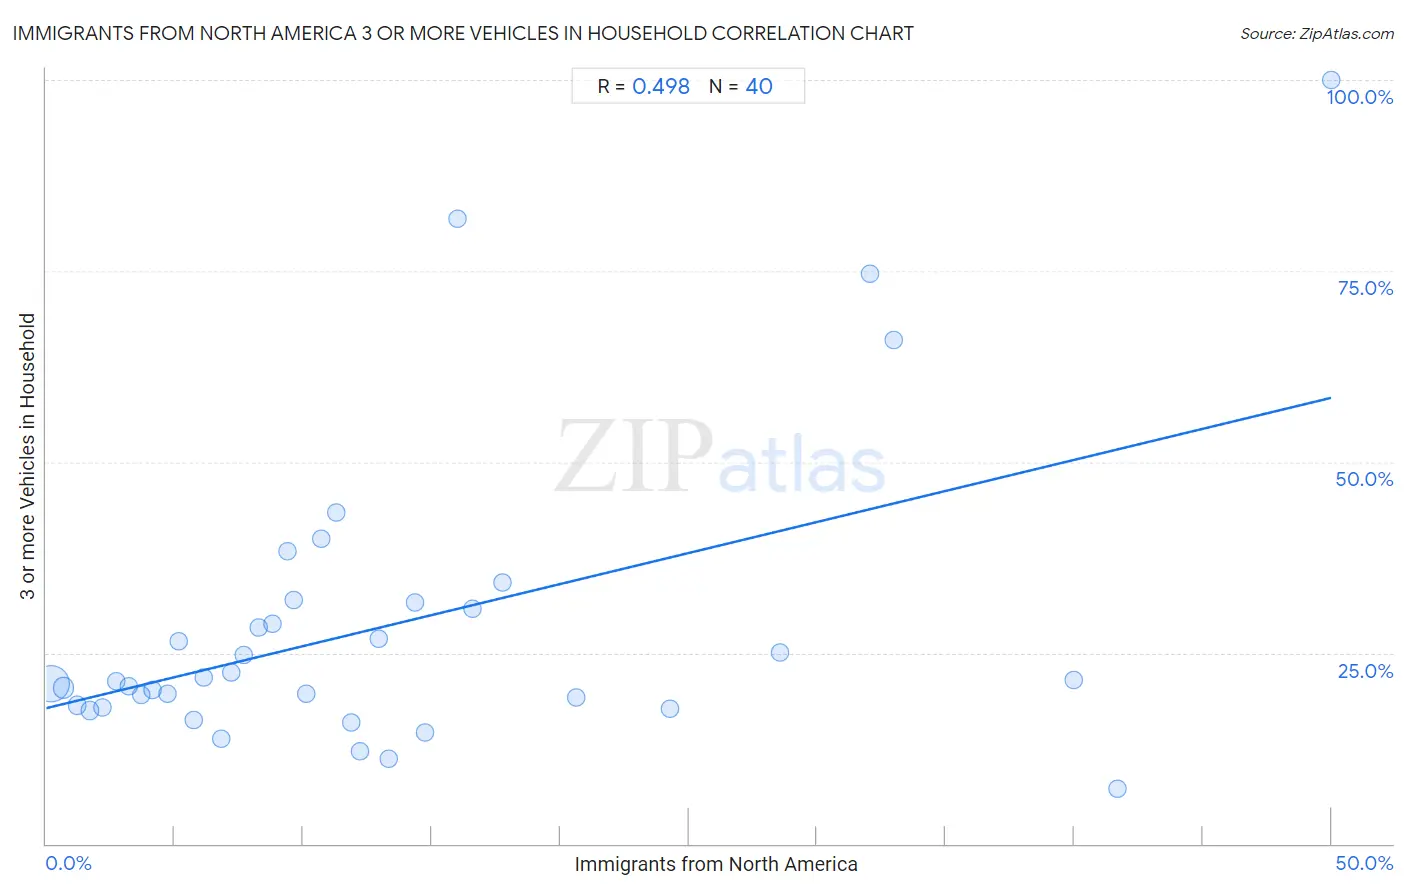
Immigrants from North America 3 or more Vehicles in Household Correlation Chart
The statistical analysis conducted on geographies consisting of 462,036,046 people shows a moderate positive correlation between the proportion of Immigrants from North America and percentage of households with 3 or more vehicles available in the United States with a correlation coefficient (R) of 0.498 and weighted average of 20.2%. On average, for every 1% (one percent) increase in Immigrants from North America within a typical geography, there is an increase of 0.81% in percentage of households with 3 or more vehicles available.
It is essential to understand that the correlation between the percentage of Immigrants from North America and percentage of households with 3 or more vehicles available does not imply a direct cause-and-effect relationship. It remains uncertain whether the presence of Immigrants from North America influences an upward or downward trend in the level of percentage of households with 3 or more vehicles available within an area, or if Immigrants from North America simply ended up residing in those areas with higher or lower levels of percentage of households with 3 or more vehicles available due to other factors.
Demographics Similar to Immigrants from North America by 3 or more Vehicles in Household
In terms of 3 or more vehicles in household, the demographic groups most similar to Immigrants from North America are Immigrants from Canada (20.2%, a difference of 0.0%), Immigrants from Asia (20.2%, a difference of 0.050%), Polish (20.2%, a difference of 0.090%), Immigrants from India (20.2%, a difference of 0.11%), and Immigrants from Nicaragua (20.2%, a difference of 0.12%).
| Demographics | Rating | Rank | 3 or more Vehicles in Household |
| Slavs | 92.1 /100 | #126 | Exceptional 20.4% |
| Immigrants from Bolivia | 92.0 /100 | #127 | Exceptional 20.4% |
| New Zealanders | 91.3 /100 | #128 | Exceptional 20.4% |
| Zimbabweans | 88.7 /100 | #129 | Excellent 20.3% |
| Greeks | 88.6 /100 | #130 | Excellent 20.3% |
| Immigrants from Asia | 88.1 /100 | #131 | Excellent 20.2% |
| Immigrants from Canada | 87.8 /100 | #132 | Excellent 20.2% |
| Immigrants from North America | 87.8 /100 | #133 | Excellent 20.2% |
| Poles | 87.3 /100 | #134 | Excellent 20.2% |
| Immigrants from India | 87.2 /100 | #135 | Excellent 20.2% |
| Immigrants from Nicaragua | 87.1 /100 | #136 | Excellent 20.2% |
| Immigrants from Iraq | 87.1 /100 | #137 | Excellent 20.2% |
| Aleuts | 86.3 /100 | #138 | Excellent 20.2% |
| Slovenes | 85.5 /100 | #139 | Excellent 20.2% |
| French American Indians | 85.3 /100 | #140 | Excellent 20.1% |
Immigrants from North America 3 or more Vehicles in Household Correlation Summary
| Measurement | Immigrants from North America Data | 3 or more Vehicles in Household Data |
| Minimum | 0.19% | 7.1% |
| Maximum | 50.0% | 100.0% |
| Range | 49.8% | 92.9% |
| Mean | 13.3% | 28.5% |
| Median | 9.9% | 21.4% |
| Interquartile 25% (IQ1) | 4.9% | 18.0% |
| Interquartile 75% (IQ3) | 16.3% | 31.1% |
| Interquartile Range (IQR) | 11.4% | 13.1% |
| Standard Deviation (Sample) | 12.0% | 19.6% |
| Standard Deviation (Population) | 11.9% | 19.4% |
Correlation Details
| Immigrants from North America Percentile | Sample Size | 3 or more Vehicles in Household |
[ 0.0% - 0.5% ] 0.19% | 379,621,189 | 20.9% |
[ 0.5% - 1.0% ] 0.68% | 61,110,707 | 20.4% |
[ 1.0% - 1.5% ] 1.20% | 13,770,668 | 18.1% |
[ 1.5% - 2.0% ] 1.70% | 4,610,596 | 17.4% |
[ 2.0% - 2.5% ] 2.21% | 1,495,062 | 17.9% |
[ 2.5% - 3.0% ] 2.72% | 664,630 | 21.4% |
[ 3.0% - 3.5% ] 3.22% | 207,031 | 20.7% |
[ 3.5% - 4.0% ] 3.69% | 148,333 | 19.5% |
[ 4.0% - 4.5% ] 4.13% | 157,430 | 20.2% |
[ 4.5% - 5.0% ] 4.71% | 47,696 | 19.6% |
[ 5.0% - 5.5% ] 5.15% | 47,067 | 26.5% |
[ 5.5% - 6.0% ] 5.76% | 20,389 | 16.3% |
[ 6.0% - 6.5% ] 6.15% | 33,184 | 21.8% |
[ 6.5% - 7.0% ] 6.81% | 17,464 | 13.7% |
[ 7.0% - 7.5% ] 7.20% | 32,520 | 22.5% |
[ 7.5% - 8.0% ] 7.67% | 14,868 | 24.7% |
[ 8.0% - 8.5% ] 8.25% | 2,110 | 28.3% |
[ 8.5% - 9.0% ] 8.82% | 5,592 | 28.9% |
[ 9.0% - 9.5% ] 9.37% | 128 | 38.4% |
[ 9.5% - 10.0% ] 9.62% | 1,549 | 31.9% |
[ 10.0% - 10.5% ] 10.11% | 2,383 | 19.7% |
[ 10.5% - 11.0% ] 10.69% | 2,413 | 39.9% |
[ 11.0% - 11.5% ] 11.27% | 71 | 43.4% |
[ 11.5% - 12.0% ] 11.87% | 5,275 | 15.9% |
[ 12.0% - 12.5% ] 12.20% | 3,156 | 12.1% |
[ 12.5% - 13.0% ] 12.94% | 626 | 26.8% |
[ 13.0% - 13.5% ] 13.33% | 15 | 11.1% |
[ 14.0% - 14.5% ] 14.34% | 1,220 | 31.5% |
[ 14.5% - 15.0% ] 14.74% | 1,323 | 14.5% |
[ 16.0% - 16.5% ] 16.00% | 100 | 81.8% |
[ 16.5% - 17.0% ] 16.59% | 4,196 | 30.7% |
[ 17.5% - 18.0% ] 17.74% | 3,907 | 34.2% |
[ 20.5% - 21.0% ] 20.62% | 160 | 19.1% |
[ 24.0% - 24.5% ] 24.26% | 2,498 | 17.7% |
[ 28.5% - 29.0% ] 28.57% | 56 | 25.0% |
[ 32.0% - 32.5% ] 32.05% | 156 | 74.7% |
[ 33.0% - 33.5% ] 33.00% | 200 | 65.9% |
[ 40.0% - 40.5% ] 40.00% | 50 | 21.4% |
[ 41.5% - 42.0% ] 41.67% | 24 | 7.1% |
[ 50.0% - 50.5% ] 50.00% | 4 | 100.0% |