Kenyan 3 or more Vehicles in Household

COMPARE

Kenyan
Race
Ancestry
AfghanAfricanAlaska NativeAlaskan AthabascanAlbanianAleutAlsatianAmericanApacheArabArapahoArgentineanArmenianAssyrian/Chaldean/SyriacAustralianAustrianBahamianBangladeshiBarbadianBasqueBelgianBelizeanBermudanBhutaneseBlackfeetBolivianBrazilianBritishBritish West IndianBulgarianBurmeseCajunCambodianCanadianCape VerdeanCarpatho RusynCelticCentral AmericanCentral American IndianCherokeeCheyenneChickasawChileanChineseChippewaChoctawColombianColvilleComancheCosta RicanCreeCreekCroatianCrowCubanCypriotCzechCzechoslovakianDanishDelawareDominicanDutchDutch West IndianEastern EuropeanEcuadorianEgyptianEnglishEstonianEthiopianEuropeanFijianFilipinoFinnishFrenchFrench American IndianFrench CanadianGermanGerman RussianGhanaianGreekGuamanian/ChamorroGuatemalanGuyaneseHaitianHmongHonduranHopiHoumaHungarianIcelanderIndian (Asian)IndonesianInupiatIranianIraqiIrishIroquoisIsraeliItalianJamaicanJapaneseJordanianKenyanKiowaKoreanLaotianLatvianLebaneseLiberianLithuanianLumbeeLuxembourgerMacedonianMalaysianMalteseMarshalleseMenomineeMexicanMexican American IndianMongolianMoroccanNative HawaiianNavajoNepaleseNew ZealanderNicaraguanNigerianNorthern EuropeanNorwegianOkinawanOsageOttawaPaiutePakistaniPalestinianPanamanianParaguayanPennsylvania GermanPeruvianPimaPolishPortuguesePotawatomiPuebloPuerto RicanPuget Sound SalishRomanianRussianSalvadoranSamoanScandinavianScotch-IrishScottishSeminoleSenegaleseSerbianShoshoneSierra LeoneanSiouxSlavicSlovakSloveneSomaliSouth AfricanSouth AmericanSouth American IndianSoviet UnionSpaniardSpanishSpanish AmericanSpanish American IndianSri LankanSubsaharan AfricanSudaneseSwedishSwissSyrianTaiwaneseThaiTlingit-HaidaTohono O'OdhamTonganTrinidadian and TobagonianTsimshianTurkishU.S. Virgin IslanderUgandanUkrainianUruguayanUteVenezuelanVietnameseWelshWest IndianYakamaYaquiYugoslavianYumanYup'ikZimbabwean
Immigration
NonimmigrantsImmigrantsAfghanistanAfricaAlbaniaArgentinaArmeniaAsiaAustraliaAustriaBahamasBangladeshBarbadosBelarusBelgiumBelizeBoliviaBosnia and HerzegovinaBrazilBulgariaBurma/MyanmarCabo VerdeCambodiaCameroonCanadaCaribbeanCentral AmericaChileChinaColombiaCongoCosta RicaCroatiaCubaCzechoslovakiaDenmarkDominicaDominican RepublicEastern AfricaEastern AsiaEastern EuropeEcuadorEgyptEl SalvadorEnglandEritreaEthiopiaEuropeFijiFranceGermanyGhanaGreeceGrenadaGuatemalaGuyanaHaitiHondurasHong KongHungaryIndiaIndonesiaIranIraqIrelandIsraelItalyJamaicaJapanJordanKazakhstanKenyaKoreaKuwaitLaosLatin AmericaLatviaLebanonLiberiaLithuaniaMalaysiaMexicoMicronesiaMiddle AfricaMoldovaMoroccoNepalNetherlandsNicaraguaNigeriaNorth AmericaNorth MacedoniaNorthern AfricaNorthern EuropeNorwayOceaniaPakistanPanamaPeruPhilippinesPolandPortugalRomaniaRussiaSaudi ArabiaScotlandSenegalSerbiaSierra LeoneSingaporeSomaliaSouth AfricaSouth AmericaSouth Central AsiaSouth Eastern AsiaSouthern EuropeSpainSri LankaSt. Vincent and the GrenadinesSudanSwedenSwitzerlandSyriaTaiwanThailandTrinidad and TobagoTurkeyUgandaUkraineUruguayUzbekistanVenezuelaVietnamWest IndiesWestern AfricaWestern AsiaWestern EuropeYemenZaireZimbabweAzores
Select to Compare
Race
Ancestry
AfghanAfricanAlaska NativeAlaskan AthabascanAlbanianAleutAlsatianAmericanApacheArabArapahoArgentineanArmenianAssyrian/Chaldean/SyriacAustralianAustrianBahamianBangladeshiBarbadianBasqueBelgianBelizeanBermudanBhutaneseBlackfeetBolivianBrazilianBritishBritish West IndianBulgarianBurmeseCajunCambodianCanadianCape VerdeanCarpatho RusynCelticCentral AmericanCentral American IndianCherokeeCheyenneChickasawChileanChineseChippewaChoctawColombianColvilleComancheCosta RicanCreeCreekCroatianCrowCubanCypriotCzechCzechoslovakianDanishDelawareDominicanDutchDutch West IndianEastern EuropeanEcuadorianEgyptianEnglishEstonianEthiopianEuropeanFijianFilipinoFinnishFrenchFrench American IndianFrench CanadianGermanGerman RussianGhanaianGreekGuamanian/ChamorroGuatemalanGuyaneseHaitianHmongHonduranHopiHoumaHungarianIcelanderIndian (Asian)IndonesianInupiatIranianIraqiIrishIroquoisIsraeliItalianJamaicanJapaneseJordanianKiowaKoreanLaotianLatvianLebaneseLiberianLithuanianLumbeeLuxembourgerMacedonianMalaysianMalteseMarshalleseMenomineeMexicanMexican American IndianMongolianMoroccanNative HawaiianNavajoNepaleseNew ZealanderNicaraguanNigerianNorthern EuropeanNorwegianOkinawanOsageOttawaPaiutePakistaniPalestinianPanamanianParaguayanPennsylvania GermanPeruvianPimaPolishPortuguesePotawatomiPuebloPuerto RicanPuget Sound SalishRomanianRussianSalvadoranSamoanScandinavianScotch-IrishScottishSeminoleSenegaleseSerbianShoshoneSierra LeoneanSiouxSlavicSlovakSloveneSomaliSouth AfricanSouth AmericanSouth American IndianSoviet UnionSpaniardSpanishSpanish AmericanSpanish American IndianSri LankanSubsaharan AfricanSudaneseSwedishSwissSyrianTaiwaneseThaiTlingit-HaidaTohono O'OdhamTonganTrinidadian and TobagonianTsimshianTurkishU.S. Virgin IslanderUgandanUkrainianUruguayanUteVenezuelanVietnameseWelshWest IndianYakamaYaquiYugoslavianYumanYup'ikZimbabwean
Immigration
NonimmigrantsImmigrantsAfghanistanAfricaAlbaniaArgentinaArmeniaAsiaAustraliaAustriaBahamasBangladeshBarbadosBelarusBelgiumBelizeBoliviaBosnia and HerzegovinaBrazilBulgariaBurma/MyanmarCabo VerdeCambodiaCameroonCanadaCaribbeanCentral AmericaChileChinaColombiaCongoCosta RicaCroatiaCubaCzechoslovakiaDenmarkDominicaDominican RepublicEastern AfricaEastern AsiaEastern EuropeEcuadorEgyptEl SalvadorEnglandEritreaEthiopiaEuropeFijiFranceGermanyGhanaGreeceGrenadaGuatemalaGuyanaHaitiHondurasHong KongHungaryIndiaIndonesiaIranIraqIrelandIsraelItalyJamaicaJapanJordanKazakhstanKenyaKoreaKuwaitLaosLatin AmericaLatviaLebanonLiberiaLithuaniaMalaysiaMexicoMicronesiaMiddle AfricaMoldovaMoroccoNepalNetherlandsNicaraguaNigeriaNorth AmericaNorth MacedoniaNorthern AfricaNorthern EuropeNorwayOceaniaPakistanPanamaPeruPhilippinesPolandPortugalRomaniaRussiaSaudi ArabiaScotlandSenegalSerbiaSierra LeoneSingaporeSomaliaSouth AfricaSouth AmericaSouth Central AsiaSouth Eastern AsiaSouthern EuropeSpainSri LankaSt. Vincent and the GrenadinesSudanSwedenSwitzerlandSyriaTaiwanThailandTrinidad and TobagoTurkeyUgandaUkraineUruguayUzbekistanVenezuelaVietnamWest IndiesWestern AfricaWestern AsiaWestern EuropeYemenZaireZimbabweAzores
3 or more Vehicles in Household
Income
Poverty
Unemployment
Labor Participation
Family Structure
Vehicle Availability
Education Level
Disability

Kenyan 3 or more Vehicles in Household
Fair

19.1%
3+ VEHICLES AVAILABLE
24.7/ 100
METRIC RATING
192nd/ 347
METRIC RANK

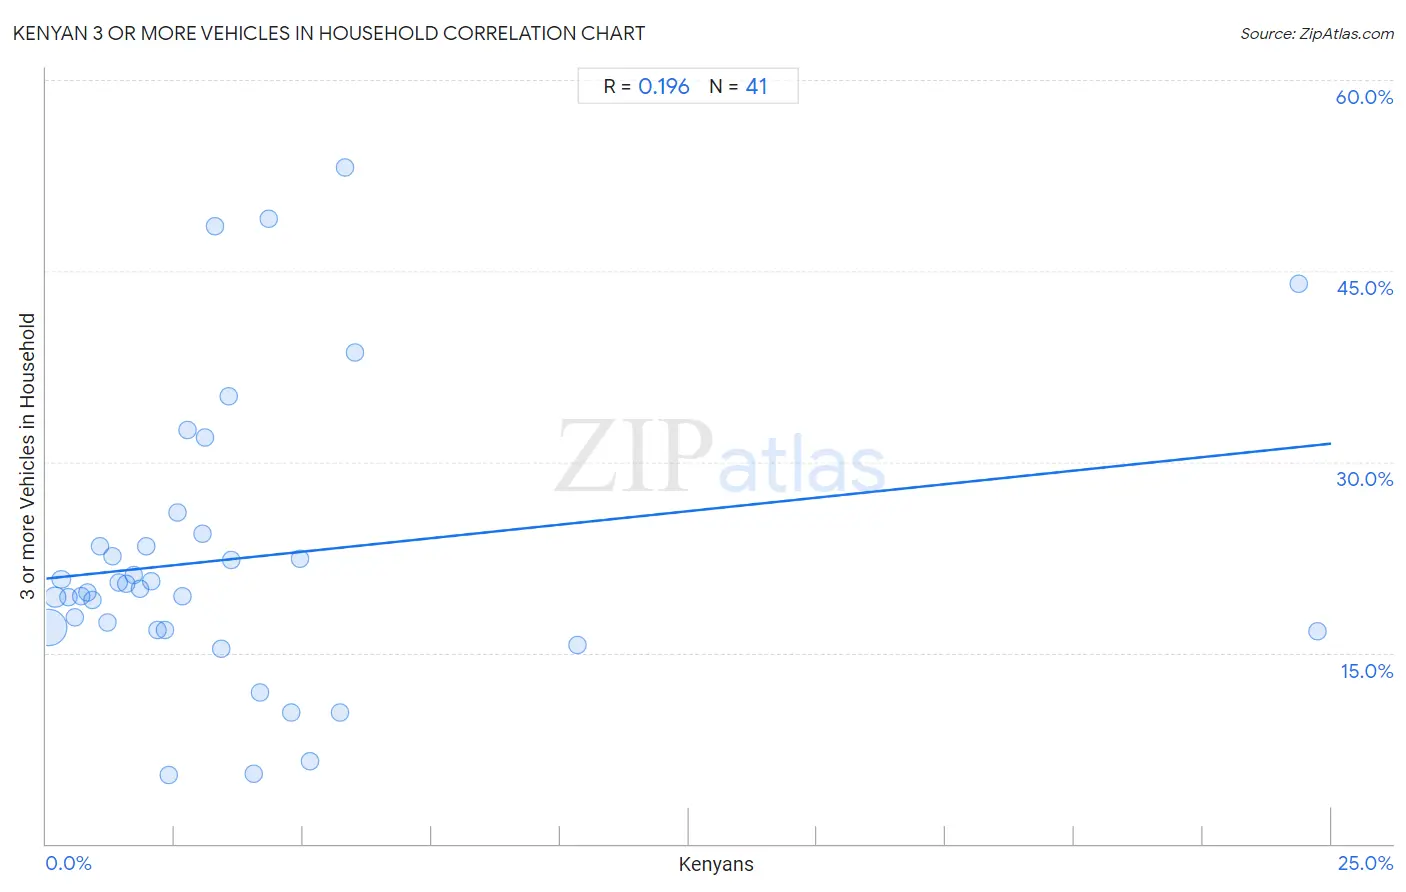
Kenyan 3 or more Vehicles in Household Correlation Chart

The statistical analysis conducted on geographies consisting of 168,140,381 people shows a poor positive correlation between the proportion of Kenyans and percentage of households with 3 or more vehicles available in the United States with a correlation coefficient (R) of 0.196 and weighted average of 19.1%. On average, for every 1% (one percent) increase in Kenyans within a typical geography, there is an increase of 0.42% in percentage of households with 3 or more vehicles available.
Kenyan 3 or more Vehicles in Household
It is essential to understand that the correlation between the percentage of Kenyans and percentage of households with 3 or more vehicles available does not imply a direct cause-and-effect relationship. It remains uncertain whether the presence of Kenyans influences an upward or downward trend in the level of percentage of households with 3 or more vehicles available within an area, or if Kenyans simply ended up residing in those areas with higher or lower levels of percentage of households with 3 or more vehicles available due to other factors.

Demographics Similar to Kenyans by 3 or more Vehicles in Household

In terms of 3 or more vehicles in household, the demographic groups most similar to Kenyans are Tsimshian (19.1%, a difference of 0.030%), South American Indian (19.1%, a difference of 0.060%), Immigrants from Zimbabwe (19.1%, a difference of 0.080%), Serbian (19.1%, a difference of 0.080%), and Immigrants from Moldova (19.1%, a difference of 0.11%).
DemographicsRating | Rank3 or more Vehicles in Household
Immigrants from Sri Lanka
30.7
/100
|
#185
Fair
19.2%
Immigrants from Sweden
29.0
/100
|
#186
Fair
19.2%
Immigrants from Hong Kong
28.3
/100
|
#187
Fair
19.2%
Immigrants from Kuwait
26.1
/100
|
#188
Fair
19.1%
Indians (Asian)
26.0
/100
|
#189
Fair
19.1%
Immigrants from Zimbabwe
25.5
/100
|
#190
Fair
19.1%
South American Indians
25.4
/100
|
#191
Fair
19.1%
Kenyans
24.7
/100
|
#192
Fair
19.1%
Tsimshian
24.4
/100
|
#193
Fair
19.1%
Serbians
24.0
/100
|
#194
Fair
19.1%
Immigrants from Moldova
23.6
/100
|
#195
Fair
19.1%
Central American Indians
22.2
/100
|
#196
Fair
19.0%
Immigrants from Japan
22.0
/100
|
#197
Fair
19.0%
Egyptians
19.5
/100
|
#198
Poor
19.0%
Immigrants from Norway
19.0
/100
|
#199
Poor
19.0%

Kenyan 3 or more Vehicles in Household Correlation Summary

MeasurementKenyan Data3 or more Vehicles in Household Data
Minimum0.039%5.4%
Maximum24.7%53.1%
Range24.7%47.7%
Mean3.8%22.5%
Median2.6%20.1%
Interquartile 25% (IQ1)1.2%16.8%
Interquartile 75% (IQ3)4.2%23.9%
Interquartile Range (IQR)3.0%7.1%
Standard Deviation (Sample)5.2%11.2%
Standard Deviation (Population)5.1%11.1%

Correlation Details

Kenyan PercentileSample Size3 or more Vehicles in Household
[
0.0%
-
0.5%
]
0.039%
126,501,51517.0%
[
0.0%
-
0.5%
]
0.17%
21,805,14419.4%
[
0.0%
-
0.5%
]
0.30%
8,419,17020.8%
[
0.0%
-
0.5%
]
0.43%
4,706,52819.4%
[
0.5%
-
1.0%
]
0.55%
2,134,66617.8%
[
0.5%
-
1.0%
]
0.67%
1,166,95919.5%
[
0.5%
-
1.0%
]
0.80%
964,80719.8%
[
0.5%
-
1.0%
]
0.90%
443,91919.2%
[
1.0%
-
1.5%
]
1.05%
433,16123.4%
[
1.0%
-
1.5%
]
1.19%
327,74017.4%
[
1.0%
-
1.5%
]
1.30%
231,59422.6%
[
1.0%
-
1.5%
]
1.41%
210,33320.5%
[
1.5%
-
2.0%
]
1.56%
192,25220.5%
[
1.5%
-
2.0%
]
1.69%
100,83821.1%
[
1.5%
-
2.0%
]
1.82%
30,10020.1%
[
1.5%
-
2.0%
]
1.95%
131,06923.4%
[
2.0%
-
2.5%
]
2.05%
69,61220.6%
[
2.0%
-
2.5%
]
2.17%
85,05916.8%
[
2.0%
-
2.5%
]
2.31%
63,72916.8%
[
2.0%
-
2.5%
]
2.38%
6,8635.4%
[
2.5%
-
3.0%
]
2.56%
58626.1%
[
2.5%
-
3.0%
]
2.65%
32,18619.4%
[
2.5%
-
3.0%
]
2.75%
8,23032.5%
[
3.0%
-
3.5%
]
3.03%
14,75624.4%
[
3.0%
-
3.5%
]
3.10%
8,38932.0%
[
3.0%
-
3.5%
]
3.29%
2,03448.5%
[
3.0%
-
3.5%
]
3.40%
2,76415.3%
[
3.5%
-
4.0%
]
3.56%
2,47335.1%
[
3.5%
-
4.0%
]
3.59%
3,78522.3%
[
4.0%
-
4.5%
]
4.03%
4,1445.5%
[
4.0%
-
4.5%
]
4.15%
9,82211.9%
[
4.0%
-
4.5%
]
4.32%
2,47449.1%
[
4.5%
-
5.0%
]
4.77%
9,33210.3%
[
4.5%
-
5.0%
]
4.94%
32422.4%
[
5.0%
-
5.5%
]
5.13%
4,9956.4%
[
5.5%
-
6.0%
]
5.71%
4,72810.3%
[
5.5%
-
6.0%
]
5.82%
3,21453.1%
[
6.0%
-
6.5%
]
6.01%
18338.6%
[
10.0%
-
10.5%
]
10.33%
36815.6%
[
24.0%
-
24.5%
]
24.37%
43944.0%
[
24.5%
-
25.0%
]
24.74%
9716.7%