Basque 3 or more Vehicles in Household
COMPARE
Basque
Select to Compare
3 or more Vehicles in Household
Basque 3 or more Vehicles in Household
24.3%
3+ VEHICLES AVAILABLE
100.0/ 100
METRIC RATING
16th/ 347
METRIC RANK
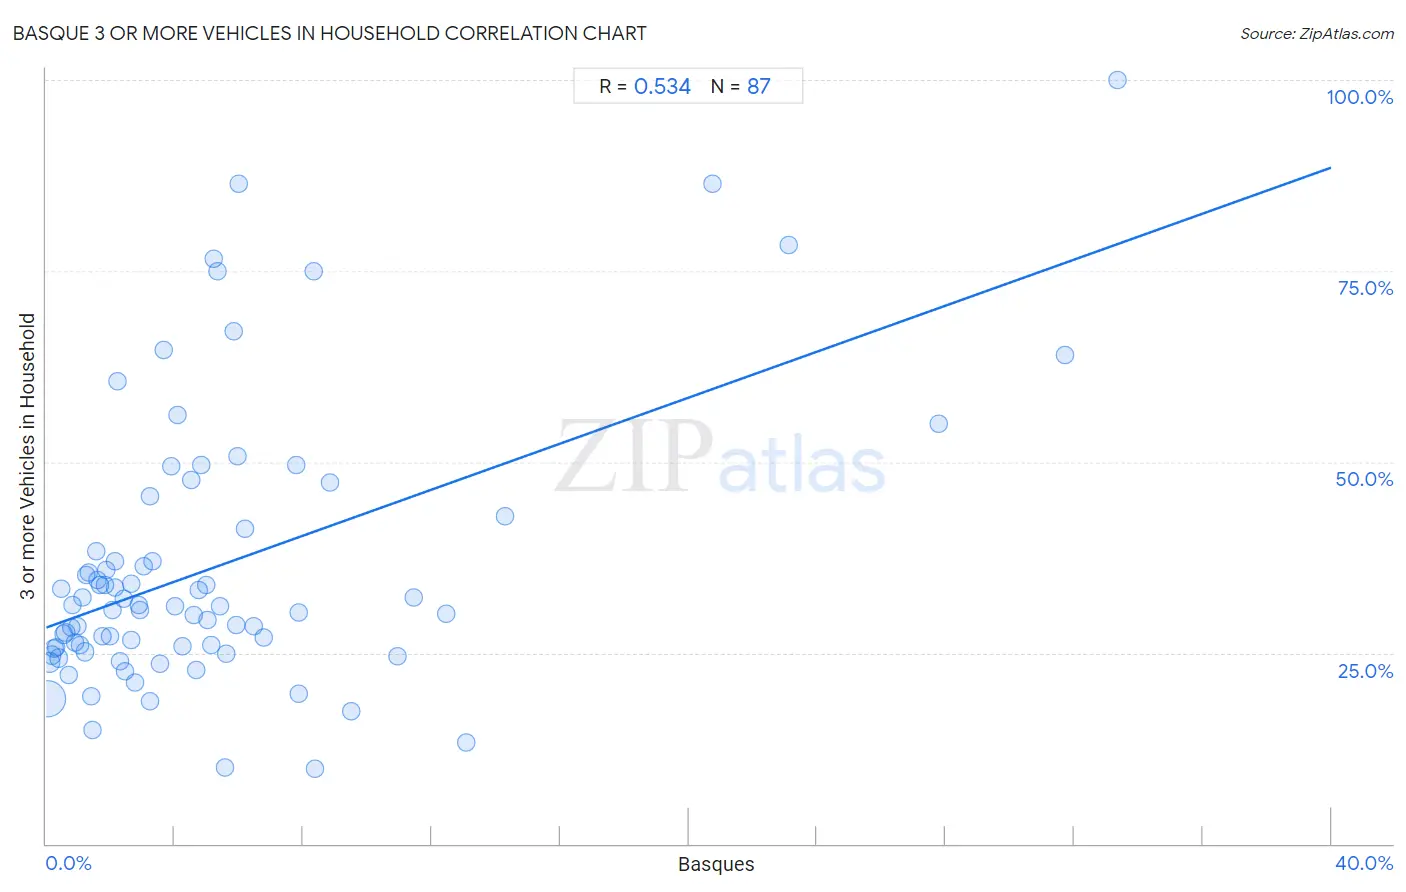
Basque 3 or more Vehicles in Household Correlation Chart
The statistical analysis conducted on geographies consisting of 165,726,625 people shows a substantial positive correlation between the proportion of Basques and percentage of households with 3 or more vehicles available in the United States with a correlation coefficient (R) of 0.534 and weighted average of 24.3%. On average, for every 1% (one percent) increase in Basques within a typical geography, there is an increase of 1.5% in percentage of households with 3 or more vehicles available.
It is essential to understand that the correlation between the percentage of Basques and percentage of households with 3 or more vehicles available does not imply a direct cause-and-effect relationship. It remains uncertain whether the presence of Basques influences an upward or downward trend in the level of percentage of households with 3 or more vehicles available within an area, or if Basques simply ended up residing in those areas with higher or lower levels of percentage of households with 3 or more vehicles available due to other factors.
Demographics Similar to Basques by 3 or more Vehicles in Household
In terms of 3 or more vehicles in household, the demographic groups most similar to Basques are Hawaiian (24.3%, a difference of 0.030%), Korean (24.1%, a difference of 0.80%), Immigrants from Mexico (24.6%, a difference of 1.4%), Norwegian (23.9%, a difference of 1.6%), and Chinese (23.9%, a difference of 1.6%).
| Demographics | Rating | Rank | 3 or more Vehicles in Household |
| Native Hawaiians | 100.0 /100 | #9 | Exceptional 24.9% |
| Nepalese | 100.0 /100 | #10 | Exceptional 24.9% |
| Shoshone | 100.0 /100 | #11 | Exceptional 24.9% |
| Danes | 100.0 /100 | #12 | Exceptional 24.7% |
| Mexicans | 100.0 /100 | #13 | Exceptional 24.7% |
| Immigrants from Mexico | 100.0 /100 | #14 | Exceptional 24.6% |
| Hawaiians | 100.0 /100 | #15 | Exceptional 24.3% |
| Basques | 100.0 /100 | #16 | Exceptional 24.3% |
| Koreans | 100.0 /100 | #17 | Exceptional 24.1% |
| Norwegians | 100.0 /100 | #18 | Exceptional 23.9% |
| Chinese | 100.0 /100 | #19 | Exceptional 23.9% |
| Paiute | 100.0 /100 | #20 | Exceptional 23.8% |
| Immigrants from Vietnam | 100.0 /100 | #21 | Exceptional 23.8% |
| Immigrants from Philippines | 100.0 /100 | #22 | Exceptional 23.8% |
| Scandinavians | 100.0 /100 | #23 | Exceptional 23.6% |
Basque 3 or more Vehicles in Household Correlation Summary
| Measurement | Basque Data | 3 or more Vehicles in Household Data |
| Minimum | 0.025% | 9.9% |
| Maximum | 33.3% | 100.0% |
| Range | 33.3% | 90.1% |
| Mean | 5.3% | 36.3% |
| Median | 3.3% | 31.1% |
| Interquartile 25% (IQ1) | 1.5% | 25.6% |
| Interquartile 75% (IQ3) | 6.0% | 41.2% |
| Interquartile Range (IQR) | 4.4% | 15.6% |
| Standard Deviation (Sample) | 6.4% | 18.1% |
| Standard Deviation (Population) | 6.4% | 18.0% |
Correlation Details
| Basque Percentile | Sample Size | 3 or more Vehicles in Household |
[ 0.0% - 0.5% ] 0.025% | 131,624,311 | 19.0% |
[ 0.0% - 0.5% ] 0.098% | 18,970,639 | 23.8% |
[ 0.0% - 0.5% ] 0.18% | 6,058,354 | 24.7% |
[ 0.0% - 0.5% ] 0.24% | 3,284,795 | 25.6% |
[ 0.0% - 0.5% ] 0.32% | 1,949,497 | 25.7% |
[ 0.0% - 0.5% ] 0.39% | 844,934 | 24.3% |
[ 0.0% - 0.5% ] 0.46% | 398,133 | 33.4% |
[ 0.5% - 1.0% ] 0.54% | 625,357 | 27.4% |
[ 0.5% - 1.0% ] 0.60% | 310,317 | 27.7% |
[ 0.5% - 1.0% ] 0.69% | 139,015 | 22.1% |
[ 0.5% - 1.0% ] 0.77% | 139,943 | 28.4% |
[ 0.5% - 1.0% ] 0.82% | 78,644 | 31.3% |
[ 0.5% - 1.0% ] 0.90% | 112,011 | 26.4% |
[ 0.5% - 1.0% ] 0.97% | 174,069 | 28.5% |
[ 1.0% - 1.5% ] 1.06% | 54,614 | 26.0% |
[ 1.0% - 1.5% ] 1.11% | 15,951 | 32.2% |
[ 1.0% - 1.5% ] 1.19% | 377,230 | 25.1% |
[ 1.0% - 1.5% ] 1.25% | 88,951 | 35.2% |
[ 1.0% - 1.5% ] 1.32% | 51,018 | 35.5% |
[ 1.0% - 1.5% ] 1.41% | 28,929 | 19.4% |
[ 1.0% - 1.5% ] 1.46% | 33,396 | 15.0% |
[ 1.5% - 2.0% ] 1.54% | 16,594 | 38.3% |
[ 1.5% - 2.0% ] 1.60% | 37,372 | 34.5% |
[ 1.5% - 2.0% ] 1.67% | 51,828 | 33.9% |
[ 1.5% - 2.0% ] 1.75% | 18,087 | 27.2% |
[ 1.5% - 2.0% ] 1.83% | 43,183 | 33.8% |
[ 1.5% - 2.0% ] 1.88% | 16,691 | 35.9% |
[ 1.5% - 2.0% ] 1.97% | 12,219 | 27.1% |
[ 2.0% - 2.5% ] 2.05% | 26,023 | 30.6% |
[ 2.0% - 2.5% ] 2.13% | 1,924 | 36.9% |
[ 2.0% - 2.5% ] 2.16% | 4,265 | 33.6% |
[ 2.0% - 2.5% ] 2.23% | 1,746 | 60.5% |
[ 2.0% - 2.5% ] 2.30% | 44,796 | 23.9% |
[ 2.0% - 2.5% ] 2.40% | 1,747 | 32.1% |
[ 2.0% - 2.5% ] 2.45% | 13,351 | 22.6% |
[ 2.5% - 3.0% ] 2.63% | 4,594 | 26.7% |
[ 2.5% - 3.0% ] 2.66% | 6,324 | 34.1% |
[ 2.5% - 3.0% ] 2.78% | 3,673 | 21.1% |
[ 2.5% - 3.0% ] 2.89% | 3,360 | 31.3% |
[ 2.5% - 3.0% ] 2.94% | 4,664 | 30.6% |
[ 3.0% - 3.5% ] 3.05% | 295 | 36.3% |
[ 3.0% - 3.5% ] 3.21% | 498 | 45.6% |
[ 3.0% - 3.5% ] 3.24% | 9,217 | 18.6% |
[ 3.0% - 3.5% ] 3.32% | 1,325 | 36.9% |
[ 3.5% - 4.0% ] 3.54% | 254 | 23.6% |
[ 3.5% - 4.0% ] 3.65% | 1,315 | 64.7% |
[ 3.5% - 4.0% ] 3.89% | 566 | 49.5% |
[ 4.0% - 4.5% ] 4.02% | 1,665 | 31.2% |
[ 4.0% - 4.5% ] 4.07% | 491 | 56.1% |
[ 4.0% - 4.5% ] 4.24% | 542 | 25.9% |
[ 4.5% - 5.0% ] 4.51% | 1,753 | 47.7% |
[ 4.5% - 5.0% ] 4.57% | 962 | 29.9% |
[ 4.5% - 5.0% ] 4.68% | 940 | 22.8% |
[ 4.5% - 5.0% ] 4.75% | 1,874 | 33.2% |
[ 4.5% - 5.0% ] 4.83% | 2,381 | 49.6% |
[ 4.5% - 5.0% ] 4.99% | 8,170 | 33.9% |
[ 5.0% - 5.5% ] 5.03% | 2,643 | 29.4% |
[ 5.0% - 5.5% ] 5.13% | 234 | 26.0% |
[ 5.0% - 5.5% ] 5.21% | 1,036 | 76.7% |
[ 5.0% - 5.5% ] 5.34% | 356 | 75.0% |
[ 5.0% - 5.5% ] 5.39% | 1,540 | 31.1% |
[ 5.5% - 6.0% ] 5.56% | 18 | 10.0% |
[ 5.5% - 6.0% ] 5.62% | 783 | 24.8% |
[ 5.5% - 6.0% ] 5.85% | 496 | 67.1% |
[ 5.5% - 6.0% ] 5.90% | 627 | 28.7% |
[ 5.5% - 6.0% ] 5.95% | 336 | 50.8% |
[ 6.0% - 6.5% ] 6.00% | 50 | 86.4% |
[ 6.0% - 6.5% ] 6.18% | 3,041 | 41.2% |
[ 6.0% - 6.5% ] 6.47% | 6,169 | 28.5% |
[ 6.5% - 7.0% ] 6.76% | 74 | 27.0% |
[ 7.5% - 8.0% ] 7.77% | 309 | 49.7% |
[ 7.5% - 8.0% ] 7.84% | 51 | 30.3% |
[ 7.5% - 8.0% ] 7.87% | 127 | 19.6% |
[ 8.0% - 8.5% ] 8.33% | 84 | 75.0% |
[ 8.0% - 8.5% ] 8.38% | 167 | 9.9% |
[ 8.5% - 9.0% ] 8.82% | 68 | 47.2% |
[ 9.0% - 9.5% ] 9.48% | 211 | 17.3% |
[ 10.5% - 11.0% ] 10.93% | 787 | 24.6% |
[ 11.0% - 11.5% ] 11.43% | 105 | 32.2% |
[ 12.0% - 12.5% ] 12.46% | 690 | 30.1% |
[ 13.0% - 13.5% ] 13.08% | 107 | 13.2% |
[ 14.0% - 14.5% ] 14.29% | 14 | 42.9% |
[ 20.5% - 21.0% ] 20.74% | 897 | 86.4% |
[ 23.0% - 23.5% ] 23.13% | 320 | 78.3% |
[ 27.5% - 28.0% ] 27.78% | 108 | 55.0% |
[ 31.5% - 32.0% ] 31.73% | 353 | 63.9% |
[ 33.0% - 33.5% ] 33.33% | 27 | 100.0% |