Tlingit-Haida Currently Married
COMPARE
Tlingit-Haida
Select to Compare
Currently Married
Tlingit-Haida Currently Married
46.7%
CURRENTLY MARRIED
51.2/ 100
METRIC RATING
173rd/ 347
METRIC RANK
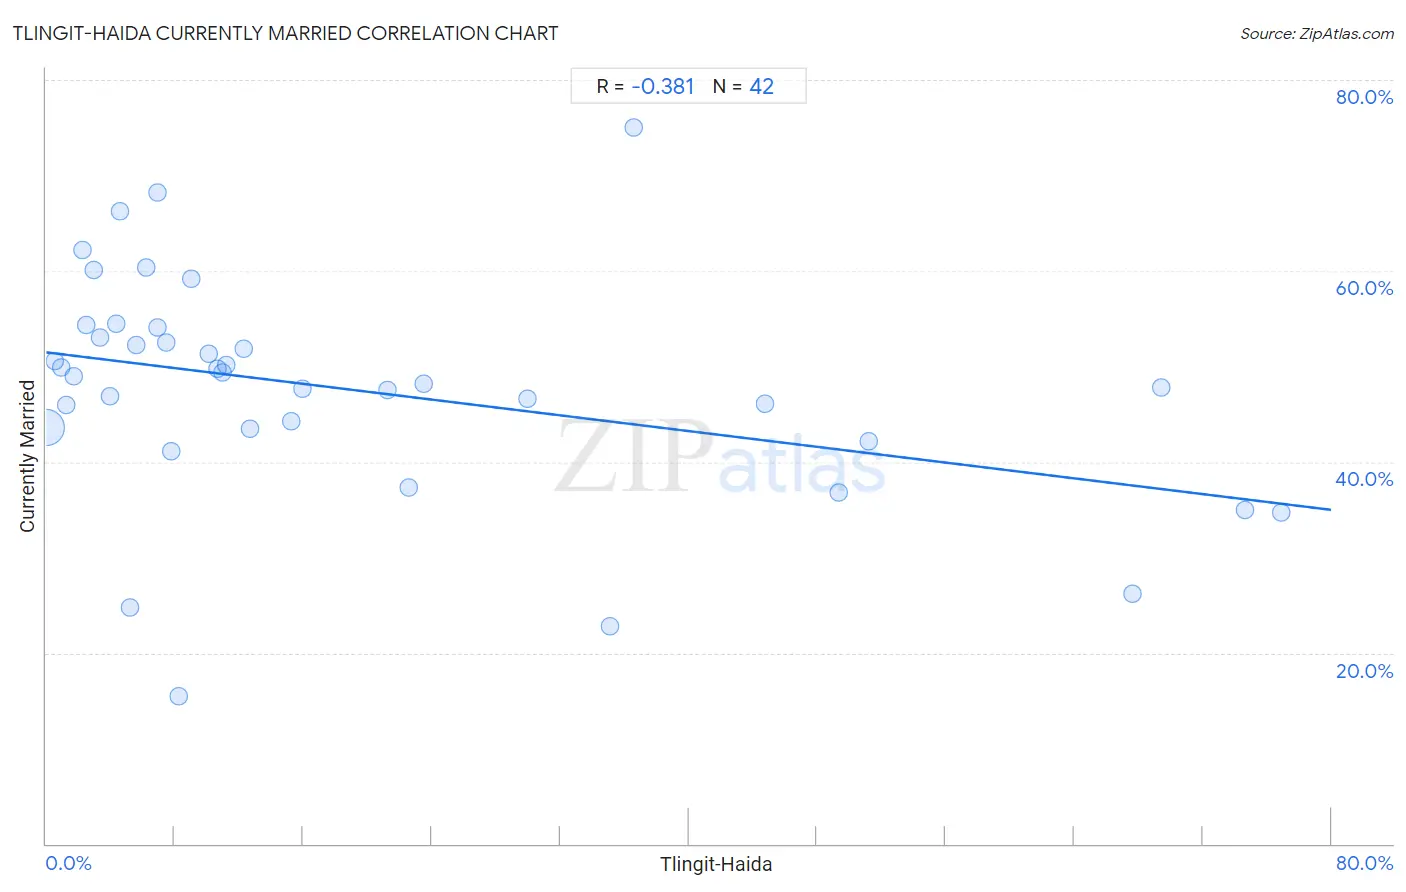
Tlingit-Haida Currently Married Correlation Chart
The statistical analysis conducted on geographies consisting of 60,872,339 people shows a mild negative correlation between the proportion of Tlingit-Haida and percentage of population currently married in the United States with a correlation coefficient (R) of -0.381 and weighted average of 46.7%. On average, for every 1% (one percent) increase in Tlingit-Haida within a typical geography, there is a decrease of 0.21% in percentage of population currently married.
It is essential to understand that the correlation between the percentage of Tlingit-Haida and percentage of population currently married does not imply a direct cause-and-effect relationship. It remains uncertain whether the presence of Tlingit-Haida influences an upward or downward trend in the level of percentage of population currently married within an area, or if Tlingit-Haida simply ended up residing in those areas with higher or lower levels of percentage of population currently married due to other factors.
Demographics Similar to Tlingit-Haida by Currently Married
In terms of currently married, the demographic groups most similar to Tlingit-Haida are Aleut (46.7%, a difference of 0.030%), Peruvian (46.6%, a difference of 0.040%), Immigrants from Zimbabwe (46.7%, a difference of 0.050%), Immigrants from Brazil (46.6%, a difference of 0.050%), and Hawaiian (46.6%, a difference of 0.090%).
| Demographics | Rating | Rank | Currently Married |
| Immigrants from Syria | 59.3 /100 | #166 | Average 46.8% |
| Spaniards | 58.8 /100 | #167 | Average 46.8% |
| Immigrants from Afghanistan | 58.2 /100 | #168 | Average 46.8% |
| Armenians | 58.2 /100 | #169 | Average 46.8% |
| Immigrants from Latvia | 56.7 /100 | #170 | Average 46.7% |
| Immigrants from Zimbabwe | 52.4 /100 | #171 | Average 46.7% |
| Aleuts | 52.0 /100 | #172 | Average 46.7% |
| Tlingit-Haida | 51.2 /100 | #173 | Average 46.7% |
| Peruvians | 50.0 /100 | #174 | Average 46.6% |
| Immigrants from Brazil | 49.9 /100 | #175 | Average 46.6% |
| Hawaiians | 48.6 /100 | #176 | Average 46.6% |
| Israelis | 48.6 /100 | #177 | Average 46.6% |
| Chickasaw | 47.8 /100 | #178 | Average 46.6% |
| Immigrants from Oceania | 44.6 /100 | #179 | Average 46.5% |
| Costa Ricans | 43.7 /100 | #180 | Average 46.5% |
Tlingit-Haida Currently Married Correlation Summary
| Measurement | Tlingit-Haida Data | Currently Married Data |
| Minimum | 0.036% | 15.4% |
| Maximum | 76.8% | 75.0% |
| Range | 76.8% | 59.6% |
| Mean | 18.9% | 47.6% |
| Median | 9.6% | 48.6% |
| Interquartile 25% (IQ1) | 4.3% | 43.5% |
| Interquartile 75% (IQ3) | 23.5% | 53.1% |
| Interquartile Range (IQR) | 19.2% | 9.6% |
| Standard Deviation (Sample) | 21.9% | 11.9% |
| Standard Deviation (Population) | 21.7% | 11.7% |
Correlation Details
| Tlingit-Haida Percentile | Sample Size | Currently Married |
[ 0.0% - 0.5% ] 0.036% | 59,033,062 | 43.7% |
[ 0.5% - 1.0% ] 0.54% | 1,312,339 | 50.6% |
[ 0.5% - 1.0% ] 0.91% | 247,818 | 49.9% |
[ 1.0% - 1.5% ] 1.24% | 85,687 | 45.9% |
[ 1.5% - 2.0% ] 1.71% | 25,685 | 49.0% |
[ 2.0% - 2.5% ] 2.28% | 8,447 | 62.2% |
[ 2.0% - 2.5% ] 2.46% | 3,821 | 54.4% |
[ 2.5% - 3.0% ] 2.92% | 6,472 | 60.1% |
[ 3.0% - 3.5% ] 3.33% | 10,388 | 53.1% |
[ 3.5% - 4.0% ] 3.97% | 1,964 | 46.9% |
[ 4.0% - 4.5% ] 4.35% | 115 | 54.5% |
[ 4.5% - 5.0% ] 4.62% | 822 | 66.3% |
[ 5.0% - 5.5% ] 5.24% | 420 | 24.7% |
[ 5.5% - 6.0% ] 5.62% | 1,762 | 52.3% |
[ 6.0% - 6.5% ] 6.21% | 177 | 60.4% |
[ 6.5% - 7.0% ] 6.91% | 564 | 68.2% |
[ 6.5% - 7.0% ] 6.94% | 2,146 | 54.1% |
[ 7.0% - 7.5% ] 7.50% | 40 | 52.5% |
[ 7.5% - 8.0% ] 7.80% | 1,257 | 41.1% |
[ 8.0% - 8.5% ] 8.22% | 146 | 15.4% |
[ 8.5% - 9.0% ] 9.00% | 6,691 | 59.2% |
[ 10.0% - 10.5% ] 10.13% | 2,902 | 51.3% |
[ 10.5% - 11.0% ] 10.70% | 29,933 | 49.8% |
[ 11.0% - 11.5% ] 11.00% | 32,108 | 49.4% |
[ 11.0% - 11.5% ] 11.18% | 13,913 | 50.2% |
[ 12.0% - 12.5% ] 12.26% | 18,041 | 51.8% |
[ 12.5% - 13.0% ] 12.66% | 8,647 | 43.5% |
[ 15.0% - 15.5% ] 15.26% | 2,169 | 44.3% |
[ 15.5% - 16.0% ] 15.92% | 1,727 | 47.6% |
[ 21.0% - 21.5% ] 21.23% | 4,267 | 47.5% |
[ 22.5% - 23.0% ] 22.55% | 1,073 | 37.3% |
[ 23.5% - 24.0% ] 23.53% | 85 | 48.2% |
[ 29.5% - 30.0% ] 29.96% | 1,128 | 46.6% |
[ 35.0% - 35.5% ] 35.09% | 57 | 22.8% |
[ 36.5% - 37.0% ] 36.59% | 82 | 75.0% |
[ 44.5% - 45.0% ] 44.78% | 920 | 46.1% |
[ 49.0% - 49.5% ] 49.33% | 1,792 | 36.8% |
[ 51.0% - 51.5% ] 51.24% | 804 | 42.2% |
[ 67.5% - 68.0% ] 67.59% | 361 | 26.2% |
[ 69.0% - 69.5% ] 69.41% | 1,602 | 47.7% |
[ 74.5% - 75.0% ] 74.63% | 67 | 35.0% |
[ 76.5% - 77.0% ] 76.85% | 838 | 34.7% |