Immigrants from Iran 3 or more Vehicles in Household
COMPARE
Immigrants from Iran
Select to Compare
3 or more Vehicles in Household
Immigrants from Iran 3 or more Vehicles in Household
20.0%
3+ VEHICLES AVAILABLE
80.9/ 100
METRIC RATING
149th/ 347
METRIC RANK
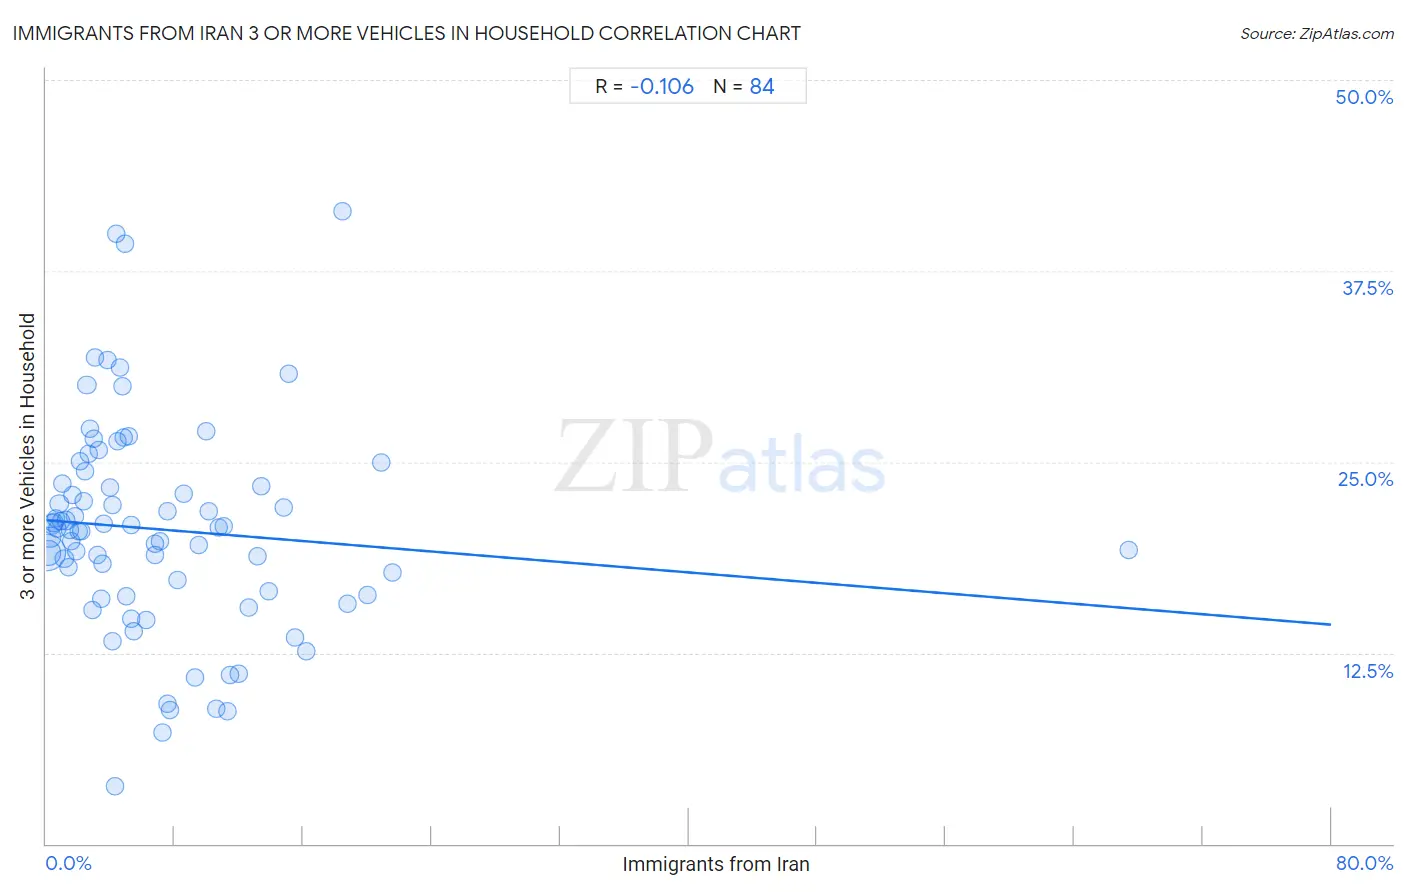
Immigrants from Iran 3 or more Vehicles in Household Correlation Chart
The statistical analysis conducted on geographies consisting of 279,780,113 people shows a poor negative correlation between the proportion of Immigrants from Iran and percentage of households with 3 or more vehicles available in the United States with a correlation coefficient (R) of -0.106 and weighted average of 20.0%. On average, for every 1% (one percent) increase in Immigrants from Iran within a typical geography, there is a decrease of 0.086% in percentage of households with 3 or more vehicles available.
It is essential to understand that the correlation between the percentage of Immigrants from Iran and percentage of households with 3 or more vehicles available does not imply a direct cause-and-effect relationship. It remains uncertain whether the presence of Immigrants from Iran influences an upward or downward trend in the level of percentage of households with 3 or more vehicles available within an area, or if Immigrants from Iran simply ended up residing in those areas with higher or lower levels of percentage of households with 3 or more vehicles available due to other factors.
Demographics Similar to Immigrants from Iran by 3 or more Vehicles in Household
In terms of 3 or more vehicles in household, the demographic groups most similar to Immigrants from Iran are Immigrants (20.0%, a difference of 0.020%), Taiwanese (20.0%, a difference of 0.030%), Lebanese (20.0%, a difference of 0.13%), Guatemalan (20.1%, a difference of 0.20%), and Slovak (20.1%, a difference of 0.26%).
| Demographics | Rating | Rank | 3 or more Vehicles in Household |
| Jordanians | 84.4 /100 | #142 | Excellent 20.1% |
| Lithuanians | 84.4 /100 | #143 | Excellent 20.1% |
| Iranians | 84.0 /100 | #144 | Excellent 20.1% |
| Palestinians | 83.9 /100 | #145 | Excellent 20.1% |
| Australians | 83.6 /100 | #146 | Excellent 20.1% |
| Slovaks | 83.0 /100 | #147 | Excellent 20.1% |
| Guatemalans | 82.6 /100 | #148 | Excellent 20.1% |
| Immigrants from Iran | 80.9 /100 | #149 | Excellent 20.0% |
| Immigrants | 80.8 /100 | #150 | Excellent 20.0% |
| Taiwanese | 80.6 /100 | #151 | Excellent 20.0% |
| Lebanese | 79.8 /100 | #152 | Good 20.0% |
| Yuman | 75.6 /100 | #153 | Good 19.9% |
| Immigrants from Jordan | 75.0 /100 | #154 | Good 19.9% |
| Tlingit-Haida | 73.4 /100 | #155 | Good 19.9% |
| Thais | 71.1 /100 | #156 | Good 19.8% |
Immigrants from Iran 3 or more Vehicles in Household Correlation Summary
| Measurement | Immigrants from Iran Data | 3 or more Vehicles in Household Data |
| Minimum | 0.052% | 3.8% |
| Maximum | 67.4% | 41.4% |
| Range | 67.3% | 37.6% |
| Mean | 7.1% | 20.6% |
| Median | 4.7% | 20.6% |
| Interquartile 25% (IQ1) | 2.3% | 16.4% |
| Interquartile 75% (IQ3) | 10.0% | 23.5% |
| Interquartile Range (IQR) | 7.8% | 7.1% |
| Standard Deviation (Sample) | 8.6% | 6.9% |
| Standard Deviation (Population) | 8.5% | 6.9% |
Correlation Details
| Immigrants from Iran Percentile | Sample Size | 3 or more Vehicles in Household |
[ 0.0% - 0.5% ] 0.052% | 151,540,129 | 19.0% |
[ 0.0% - 0.5% ] 0.15% | 53,230,327 | 19.0% |
[ 0.0% - 0.5% ] 0.26% | 24,746,642 | 20.1% |
[ 0.0% - 0.5% ] 0.37% | 13,225,254 | 20.9% |
[ 0.0% - 0.5% ] 0.49% | 9,940,763 | 21.0% |
[ 0.5% - 1.0% ] 0.58% | 4,733,555 | 21.3% |
[ 0.5% - 1.0% ] 0.70% | 3,095,474 | 20.6% |
[ 0.5% - 1.0% ] 0.81% | 2,005,626 | 22.2% |
[ 0.5% - 1.0% ] 0.91% | 2,347,521 | 21.1% |
[ 1.0% - 1.5% ] 1.01% | 2,211,397 | 23.6% |
[ 1.0% - 1.5% ] 1.12% | 665,605 | 18.7% |
[ 1.0% - 1.5% ] 1.24% | 1,340,432 | 21.2% |
[ 1.0% - 1.5% ] 1.37% | 4,528,779 | 18.1% |
[ 1.0% - 1.5% ] 1.46% | 539,120 | 20.5% |
[ 1.5% - 2.0% ] 1.56% | 813,324 | 19.8% |
[ 1.5% - 2.0% ] 1.66% | 386,820 | 22.8% |
[ 1.5% - 2.0% ] 1.78% | 326,063 | 21.4% |
[ 1.5% - 2.0% ] 1.89% | 263,874 | 19.2% |
[ 1.5% - 2.0% ] 1.99% | 139,534 | 20.4% |
[ 2.0% - 2.5% ] 2.10% | 174,310 | 25.1% |
[ 2.0% - 2.5% ] 2.19% | 196,829 | 20.4% |
[ 2.0% - 2.5% ] 2.31% | 193,289 | 22.4% |
[ 2.0% - 2.5% ] 2.44% | 87,748 | 24.4% |
[ 2.5% - 3.0% ] 2.53% | 168,842 | 30.0% |
[ 2.5% - 3.0% ] 2.65% | 62,121 | 25.5% |
[ 2.5% - 3.0% ] 2.74% | 237,161 | 27.2% |
[ 2.5% - 3.0% ] 2.90% | 37,654 | 15.3% |
[ 2.5% - 3.0% ] 2.97% | 168,262 | 26.5% |
[ 3.0% - 3.5% ] 3.06% | 96,787 | 31.8% |
[ 3.0% - 3.5% ] 3.17% | 366,071 | 18.9% |
[ 3.0% - 3.5% ] 3.28% | 205,431 | 25.8% |
[ 3.0% - 3.5% ] 3.42% | 106,622 | 16.0% |
[ 3.5% - 4.0% ] 3.54% | 104,647 | 18.3% |
[ 3.5% - 4.0% ] 3.59% | 31,657 | 20.9% |
[ 3.5% - 4.0% ] 3.82% | 33,868 | 31.7% |
[ 3.5% - 4.0% ] 3.95% | 24,177 | 23.3% |
[ 4.0% - 4.5% ] 4.09% | 6,915 | 22.1% |
[ 4.0% - 4.5% ] 4.10% | 29,744 | 13.3% |
[ 4.0% - 4.5% ] 4.28% | 20,411 | 3.8% |
[ 4.0% - 4.5% ] 4.33% | 4,410 | 39.9% |
[ 4.0% - 4.5% ] 4.46% | 133,954 | 26.3% |
[ 4.5% - 5.0% ] 4.62% | 21,080 | 31.2% |
[ 4.5% - 5.0% ] 4.72% | 36,842 | 30.0% |
[ 4.5% - 5.0% ] 4.79% | 2,318 | 26.6% |
[ 4.5% - 5.0% ] 4.88% | 38,003 | 39.3% |
[ 4.5% - 5.0% ] 4.96% | 29,544 | 16.2% |
[ 5.0% - 5.5% ] 5.12% | 31,381 | 26.7% |
[ 5.0% - 5.5% ] 5.26% | 35,819 | 14.7% |
[ 5.0% - 5.5% ] 5.30% | 73,595 | 20.9% |
[ 5.0% - 5.5% ] 5.43% | 54,074 | 13.9% |
[ 6.0% - 6.5% ] 6.19% | 28,792 | 14.7% |
[ 6.5% - 7.0% ] 6.74% | 30,549 | 18.9% |
[ 6.5% - 7.0% ] 6.80% | 30,599 | 19.6% |
[ 7.0% - 7.5% ] 7.05% | 2,936 | 19.8% |
[ 7.0% - 7.5% ] 7.22% | 44,429 | 7.3% |
[ 7.5% - 8.0% ] 7.51% | 7,509 | 9.2% |
[ 7.5% - 8.0% ] 7.58% | 28,765 | 21.8% |
[ 7.5% - 8.0% ] 7.72% | 50,392 | 8.7% |
[ 8.0% - 8.5% ] 8.15% | 44,862 | 17.3% |
[ 8.5% - 9.0% ] 8.58% | 16,246 | 22.9% |
[ 9.0% - 9.5% ] 9.23% | 38,408 | 10.9% |
[ 9.5% - 10.0% ] 9.51% | 17,076 | 19.5% |
[ 9.5% - 10.0% ] 9.95% | 16,190 | 27.0% |
[ 10.0% - 10.5% ] 10.11% | 49,408 | 21.7% |
[ 10.5% - 11.0% ] 10.60% | 11,060 | 8.9% |
[ 10.5% - 11.0% ] 10.73% | 1,445 | 20.7% |
[ 11.0% - 11.5% ] 11.04% | 462 | 20.8% |
[ 11.0% - 11.5% ] 11.26% | 23,193 | 8.7% |
[ 11.0% - 11.5% ] 11.42% | 18,445 | 11.0% |
[ 12.0% - 12.5% ] 12.01% | 9,699 | 11.2% |
[ 12.5% - 13.0% ] 12.57% | 18,951 | 15.5% |
[ 13.0% - 13.5% ] 13.18% | 59,525 | 18.9% |
[ 13.0% - 13.5% ] 13.42% | 9,105 | 23.4% |
[ 13.5% - 14.0% ] 13.81% | 195,069 | 16.5% |
[ 14.5% - 15.0% ] 14.76% | 51,474 | 22.0% |
[ 15.0% - 15.5% ] 15.07% | 5,593 | 30.8% |
[ 15.0% - 15.5% ] 15.45% | 1,139 | 13.5% |
[ 16.0% - 16.5% ] 16.21% | 16,679 | 12.6% |
[ 18.0% - 18.5% ] 18.45% | 233 | 41.4% |
[ 18.5% - 19.0% ] 18.76% | 23,473 | 15.7% |
[ 20.0% - 20.5% ] 20.01% | 22,163 | 16.3% |
[ 20.5% - 21.0% ] 20.87% | 11,091 | 25.0% |
[ 21.5% - 22.0% ] 21.54% | 1,207 | 17.7% |
[ 67.0% - 67.5% ] 67.38% | 141 | 19.2% |