Brazilian 3 or more Vehicles in Household
COMPARE
Brazilian
Select to Compare
3 or more Vehicles in Household
Brazilian 3 or more Vehicles in Household
17.4%
3+ VEHICLES AVAILABLE
0.4/ 100
METRIC RATING
277th/ 347
METRIC RANK
Brazilian 3 or more Vehicles in Household Correlation Chart
The statistical analysis conducted on geographies consisting of 323,603,230 people shows a weak positive correlation between the proportion of Brazilians and percentage of households with 3 or more vehicles available in the United States with a correlation coefficient (R) of 0.278 and weighted average of 17.4%. On average, for every 1% (one percent) increase in Brazilians within a typical geography, there is an increase of 0.36% in percentage of households with 3 or more vehicles available.
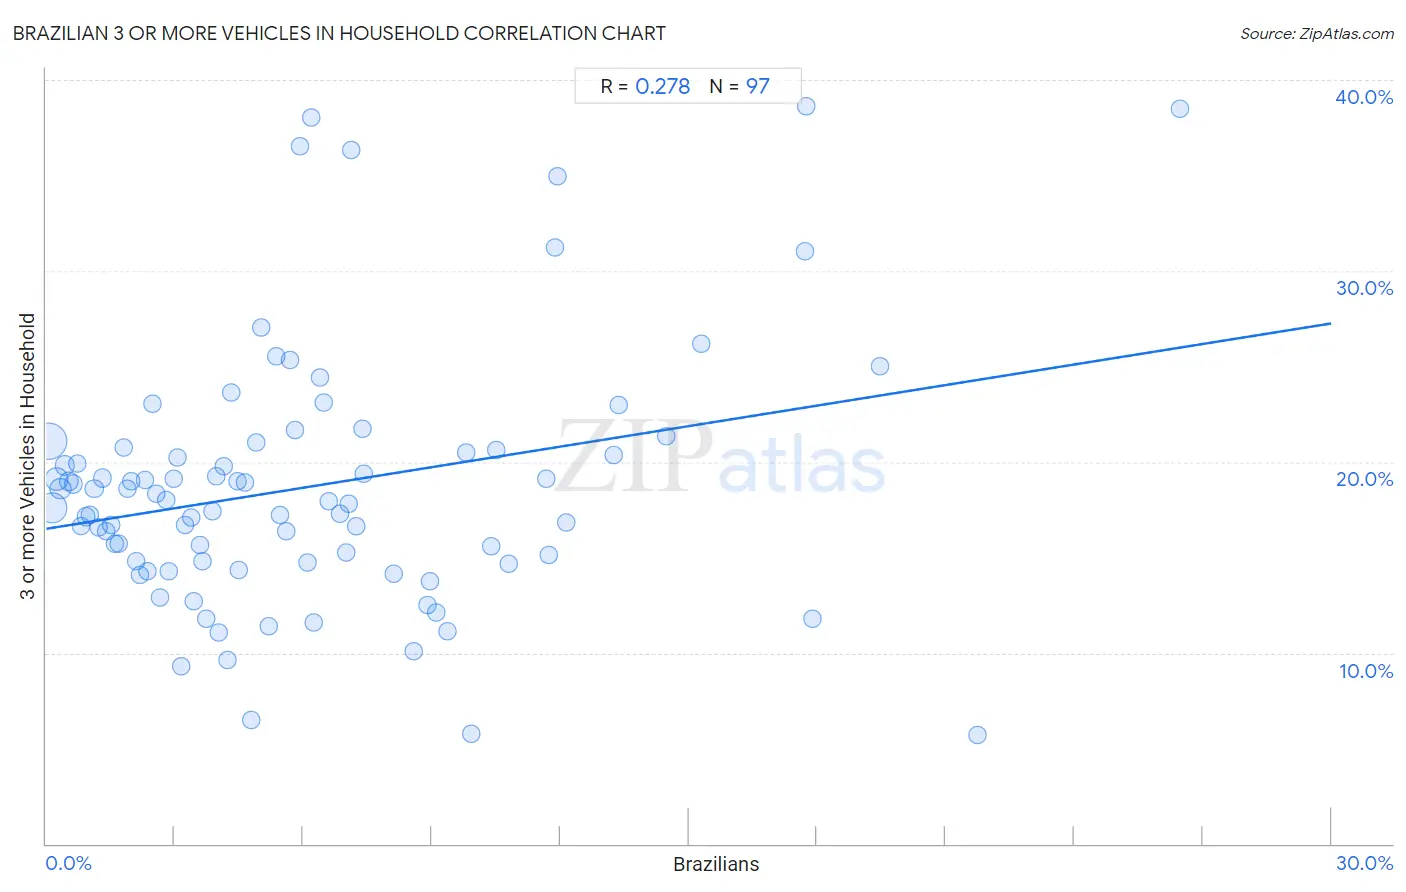
It is essential to understand that the correlation between the percentage of Brazilians and percentage of households with 3 or more vehicles available does not imply a direct cause-and-effect relationship. It remains uncertain whether the presence of Brazilians influences an upward or downward trend in the level of percentage of households with 3 or more vehicles available within an area, or if Brazilians simply ended up residing in those areas with higher or lower levels of percentage of households with 3 or more vehicles available due to other factors.
Demographics Similar to Brazilians by 3 or more Vehicles in Household
In terms of 3 or more vehicles in household, the demographic groups most similar to Brazilians are Immigrants from Bahamas (17.4%, a difference of 0.090%), Immigrants from Kazakhstan (17.4%, a difference of 0.10%), Okinawan (17.4%, a difference of 0.14%), Immigrants from Eastern Europe (17.4%, a difference of 0.14%), and Immigrants from Latvia (17.4%, a difference of 0.19%).
| Demographics | Rating | Rank | 3 or more Vehicles in Household |
| Immigrants from Nepal | 0.6 /100 | #270 | Tragic 17.6% |
| South Americans | 0.6 /100 | #271 | Tragic 17.6% |
| Immigrants from Africa | 0.5 /100 | #272 | Tragic 17.6% |
| Immigrants from Sudan | 0.5 /100 | #273 | Tragic 17.6% |
| Immigrants from Bosnia and Herzegovina | 0.5 /100 | #274 | Tragic 17.5% |
| Immigrants from Ukraine | 0.4 /100 | #275 | Tragic 17.5% |
| Okinawans | 0.4 /100 | #276 | Tragic 17.4% |
| Brazilians | 0.4 /100 | #277 | Tragic 17.4% |
| Immigrants from Bahamas | 0.3 /100 | #278 | Tragic 17.4% |
| Immigrants from Kazakhstan | 0.3 /100 | #279 | Tragic 17.4% |
| Immigrants from Eastern Europe | 0.3 /100 | #280 | Tragic 17.4% |
| Immigrants from Latvia | 0.3 /100 | #281 | Tragic 17.4% |
| Immigrants from Ireland | 0.3 /100 | #282 | Tragic 17.3% |
| Blacks/African Americans | 0.3 /100 | #283 | Tragic 17.3% |
| Immigrants from Colombia | 0.3 /100 | #284 | Tragic 17.3% |
Brazilian 3 or more Vehicles in Household Correlation Summary
| Measurement | Brazilian Data | 3 or more Vehicles in Household Data |
| Minimum | 0.046% | 5.7% |
| Maximum | 26.5% | 38.6% |
| Range | 26.4% | 32.9% |
| Mean | 6.1% | 18.7% |
| Median | 4.8% | 17.9% |
| Interquartile 25% (IQ1) | 2.3% | 14.8% |
| Interquartile 75% (IQ3) | 8.7% | 20.7% |
| Interquartile Range (IQR) | 6.4% | 6.0% |
| Standard Deviation (Sample) | 5.2% | 6.7% |
| Standard Deviation (Population) | 5.2% | 6.7% |
Correlation Details
| Brazilian Percentile | Sample Size | 3 or more Vehicles in Household |
[ 0.0% - 0.5% ] 0.046% | 136,970,034 | 21.1% |
[ 0.0% - 0.5% ] 0.14% | 85,354,648 | 17.6% |
[ 0.0% - 0.5% ] 0.24% | 31,707,788 | 19.1% |
[ 0.0% - 0.5% ] 0.33% | 19,800,969 | 18.6% |
[ 0.0% - 0.5% ] 0.43% | 12,126,103 | 19.8% |
[ 0.5% - 1.0% ] 0.53% | 7,578,037 | 19.0% |
[ 0.5% - 1.0% ] 0.63% | 5,680,019 | 18.8% |
[ 0.5% - 1.0% ] 0.73% | 2,614,309 | 19.9% |
[ 0.5% - 1.0% ] 0.81% | 3,083,345 | 16.6% |
[ 0.5% - 1.0% ] 0.92% | 2,545,129 | 17.1% |
[ 1.0% - 1.5% ] 1.02% | 2,022,608 | 17.2% |
[ 1.0% - 1.5% ] 1.12% | 1,602,341 | 18.6% |
[ 1.0% - 1.5% ] 1.21% | 1,432,636 | 16.6% |
[ 1.0% - 1.5% ] 1.31% | 957,568 | 19.2% |
[ 1.0% - 1.5% ] 1.41% | 812,700 | 16.3% |
[ 1.5% - 2.0% ] 1.50% | 801,833 | 16.7% |
[ 1.5% - 2.0% ] 1.60% | 581,737 | 15.7% |
[ 1.5% - 2.0% ] 1.69% | 1,006,548 | 15.7% |
[ 1.5% - 2.0% ] 1.81% | 243,556 | 20.8% |
[ 1.5% - 2.0% ] 1.90% | 486,593 | 18.6% |
[ 1.5% - 2.0% ] 1.97% | 150,919 | 19.0% |
[ 2.0% - 2.5% ] 2.11% | 735,276 | 14.8% |
[ 2.0% - 2.5% ] 2.18% | 440,427 | 14.1% |
[ 2.0% - 2.5% ] 2.30% | 368,846 | 19.0% |
[ 2.0% - 2.5% ] 2.37% | 296,770 | 14.3% |
[ 2.0% - 2.5% ] 2.47% | 143,659 | 23.0% |
[ 2.5% - 3.0% ] 2.56% | 198,265 | 18.3% |
[ 2.5% - 3.0% ] 2.67% | 121,638 | 12.9% |
[ 2.5% - 3.0% ] 2.79% | 60,644 | 18.0% |
[ 2.5% - 3.0% ] 2.87% | 167,682 | 14.3% |
[ 2.5% - 3.0% ] 2.98% | 183,241 | 19.1% |
[ 3.0% - 3.5% ] 3.06% | 65,423 | 20.2% |
[ 3.0% - 3.5% ] 3.16% | 61,094 | 9.3% |
[ 3.0% - 3.5% ] 3.25% | 154 | 16.7% |
[ 3.0% - 3.5% ] 3.37% | 107,926 | 17.1% |
[ 3.0% - 3.5% ] 3.45% | 240,705 | 12.7% |
[ 3.5% - 4.0% ] 3.58% | 255,318 | 15.6% |
[ 3.5% - 4.0% ] 3.65% | 143,358 | 14.8% |
[ 3.5% - 4.0% ] 3.74% | 174,154 | 11.8% |
[ 3.5% - 4.0% ] 3.87% | 32,655 | 17.4% |
[ 3.5% - 4.0% ] 3.96% | 97,412 | 19.2% |
[ 4.0% - 4.5% ] 4.03% | 151,720 | 11.0% |
[ 4.0% - 4.5% ] 4.13% | 29,781 | 19.7% |
[ 4.0% - 4.5% ] 4.25% | 7,419 | 9.6% |
[ 4.0% - 4.5% ] 4.32% | 63,170 | 23.7% |
[ 4.0% - 4.5% ] 4.47% | 42,045 | 19.0% |
[ 4.0% - 4.5% ] 4.50% | 122,618 | 14.3% |
[ 4.5% - 5.0% ] 4.64% | 12,532 | 18.9% |
[ 4.5% - 5.0% ] 4.79% | 321,508 | 6.5% |
[ 4.5% - 5.0% ] 4.90% | 9,246 | 21.0% |
[ 5.0% - 5.5% ] 5.02% | 5,799 | 27.1% |
[ 5.0% - 5.5% ] 5.18% | 29,576 | 11.4% |
[ 5.0% - 5.5% ] 5.37% | 670 | 25.5% |
[ 5.0% - 5.5% ] 5.46% | 1,924 | 17.2% |
[ 5.5% - 6.0% ] 5.61% | 144,030 | 16.4% |
[ 5.5% - 6.0% ] 5.70% | 20,668 | 25.4% |
[ 5.5% - 6.0% ] 5.81% | 3,957 | 21.7% |
[ 5.5% - 6.0% ] 5.93% | 843 | 36.5% |
[ 6.0% - 6.5% ] 6.09% | 10,623 | 14.7% |
[ 6.0% - 6.5% ] 6.20% | 742 | 38.0% |
[ 6.0% - 6.5% ] 6.25% | 9,051 | 11.6% |
[ 6.0% - 6.5% ] 6.40% | 5,003 | 24.4% |
[ 6.0% - 6.5% ] 6.48% | 48,922 | 23.1% |
[ 6.5% - 7.0% ] 6.59% | 56,891 | 17.9% |
[ 6.5% - 7.0% ] 6.85% | 70,451 | 17.3% |
[ 6.5% - 7.0% ] 7.00% | 46,938 | 15.2% |
[ 7.0% - 7.5% ] 7.07% | 948 | 17.8% |
[ 7.0% - 7.5% ] 7.12% | 2,330 | 36.4% |
[ 7.0% - 7.5% ] 7.25% | 33,691 | 16.7% |
[ 7.0% - 7.5% ] 7.37% | 17,214 | 21.8% |
[ 7.0% - 7.5% ] 7.42% | 58,698 | 19.4% |
[ 8.0% - 8.5% ] 8.10% | 51,318 | 14.1% |
[ 8.5% - 9.0% ] 8.59% | 32,076 | 10.1% |
[ 8.5% - 9.0% ] 8.89% | 118,546 | 12.5% |
[ 8.5% - 9.0% ] 8.96% | 31,932 | 13.8% |
[ 9.0% - 9.5% ] 9.11% | 2,570 | 12.1% |
[ 9.0% - 9.5% ] 9.37% | 98,856 | 11.1% |
[ 9.5% - 10.0% ] 9.81% | 11,653 | 20.5% |
[ 9.5% - 10.0% ] 9.91% | 13,154 | 5.8% |
[ 10.0% - 10.5% ] 10.38% | 60,009 | 15.6% |
[ 10.5% - 11.0% ] 10.51% | 1,580 | 20.6% |
[ 10.5% - 11.0% ] 10.79% | 82,782 | 14.6% |
[ 11.5% - 12.0% ] 11.68% | 50,112 | 19.1% |
[ 11.5% - 12.0% ] 11.74% | 71,805 | 15.1% |
[ 11.5% - 12.0% ] 11.86% | 59 | 31.2% |
[ 11.5% - 12.0% ] 11.93% | 3,848 | 35.0% |
[ 12.0% - 12.5% ] 12.14% | 17,178 | 16.8% |
[ 13.0% - 13.5% ] 13.26% | 181 | 20.4% |
[ 13.0% - 13.5% ] 13.38% | 30,411 | 23.0% |
[ 14.0% - 14.5% ] 14.48% | 27,569 | 21.3% |
[ 15.0% - 15.5% ] 15.29% | 8,547 | 26.2% |
[ 17.5% - 18.0% ] 17.72% | 1,016 | 31.0% |
[ 17.5% - 18.0% ] 17.75% | 1,183 | 38.6% |
[ 17.5% - 18.0% ] 17.87% | 38,898 | 11.8% |
[ 19.0% - 19.5% ] 19.48% | 2,367 | 25.0% |
[ 21.5% - 22.0% ] 21.74% | 61,855 | 5.7% |
[ 26.0% - 26.5% ] 26.46% | 650 | 38.5% |