Slovak 3 or more Vehicles in Household
COMPARE
Slovak
Select to Compare
3 or more Vehicles in Household
Slovak 3 or more Vehicles in Household
20.1%
3+ VEHICLES AVAILABLE
83.0/ 100
METRIC RATING
147th/ 347
METRIC RANK
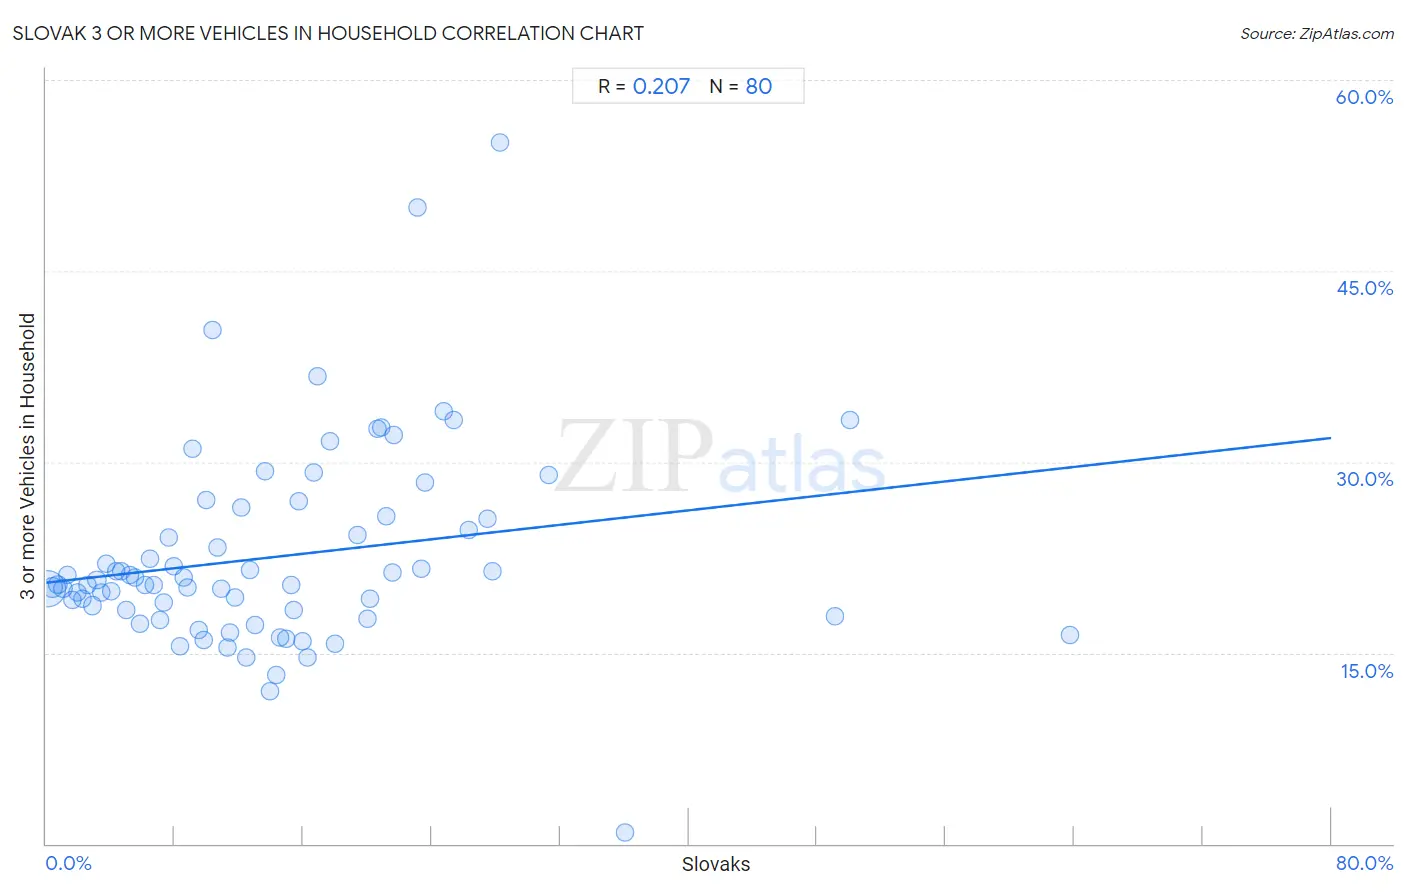
Slovak 3 or more Vehicles in Household Correlation Chart
The statistical analysis conducted on geographies consisting of 397,587,914 people shows a weak positive correlation between the proportion of Slovaks and percentage of households with 3 or more vehicles available in the United States with a correlation coefficient (R) of 0.207 and weighted average of 20.1%. On average, for every 1% (one percent) increase in Slovaks within a typical geography, there is an increase of 0.14% in percentage of households with 3 or more vehicles available.
It is essential to understand that the correlation between the percentage of Slovaks and percentage of households with 3 or more vehicles available does not imply a direct cause-and-effect relationship. It remains uncertain whether the presence of Slovaks influences an upward or downward trend in the level of percentage of households with 3 or more vehicles available within an area, or if Slovaks simply ended up residing in those areas with higher or lower levels of percentage of households with 3 or more vehicles available due to other factors.
Demographics Similar to Slovaks by 3 or more Vehicles in Household
In terms of 3 or more vehicles in household, the demographic groups most similar to Slovaks are Guatemalan (20.1%, a difference of 0.060%), Australian (20.1%, a difference of 0.080%), Palestinian (20.1%, a difference of 0.12%), Iranian (20.1%, a difference of 0.13%), and Jordanian (20.1%, a difference of 0.19%).
| Demographics | Rating | Rank | 3 or more Vehicles in Household |
| French American Indians | 85.3 /100 | #140 | Excellent 20.1% |
| Ottawa | 84.9 /100 | #141 | Excellent 20.1% |
| Jordanians | 84.4 /100 | #142 | Excellent 20.1% |
| Lithuanians | 84.4 /100 | #143 | Excellent 20.1% |
| Iranians | 84.0 /100 | #144 | Excellent 20.1% |
| Palestinians | 83.9 /100 | #145 | Excellent 20.1% |
| Australians | 83.6 /100 | #146 | Excellent 20.1% |
| Slovaks | 83.0 /100 | #147 | Excellent 20.1% |
| Guatemalans | 82.6 /100 | #148 | Excellent 20.1% |
| Immigrants from Iran | 80.9 /100 | #149 | Excellent 20.0% |
| Immigrants | 80.8 /100 | #150 | Excellent 20.0% |
| Taiwanese | 80.6 /100 | #151 | Excellent 20.0% |
| Lebanese | 79.8 /100 | #152 | Good 20.0% |
| Yuman | 75.6 /100 | #153 | Good 19.9% |
| Immigrants from Jordan | 75.0 /100 | #154 | Good 19.9% |
Slovak 3 or more Vehicles in Household Correlation Summary
| Measurement | Slovak Data | 3 or more Vehicles in Household Data |
| Minimum | 0.10% | 0.89% |
| Maximum | 63.7% | 55.1% |
| Range | 63.6% | 54.2% |
| Mean | 14.2% | 22.5% |
| Median | 12.0% | 20.4% |
| Interquartile 25% (IQ1) | 6.0% | 18.1% |
| Interquartile 75% (IQ3) | 20.1% | 25.7% |
| Interquartile Range (IQR) | 14.1% | 7.5% |
| Standard Deviation (Sample) | 11.5% | 7.9% |
| Standard Deviation (Population) | 11.5% | 7.9% |
Correlation Details
| Slovak Percentile | Sample Size | 3 or more Vehicles in Household |
[ 0.0% - 0.5% ] 0.10% | 322,285,214 | 20.0% |
[ 0.0% - 0.5% ] 0.41% | 42,141,022 | 20.1% |
[ 0.5% - 1.0% ] 0.72% | 12,558,958 | 20.4% |
[ 1.0% - 1.5% ] 1.04% | 5,567,127 | 20.0% |
[ 1.0% - 1.5% ] 1.34% | 3,156,364 | 21.1% |
[ 1.5% - 2.0% ] 1.66% | 2,401,568 | 19.2% |
[ 1.5% - 2.0% ] 1.94% | 1,550,353 | 19.8% |
[ 2.0% - 2.5% ] 2.27% | 1,592,059 | 19.2% |
[ 2.5% - 3.0% ] 2.54% | 860,255 | 20.4% |
[ 2.5% - 3.0% ] 2.85% | 903,420 | 18.7% |
[ 3.0% - 3.5% ] 3.15% | 681,261 | 20.7% |
[ 3.0% - 3.5% ] 3.43% | 712,832 | 19.8% |
[ 3.5% - 4.0% ] 3.74% | 478,761 | 22.0% |
[ 4.0% - 4.5% ] 4.06% | 460,876 | 19.8% |
[ 4.0% - 4.5% ] 4.34% | 330,090 | 21.4% |
[ 4.5% - 5.0% ] 4.66% | 213,999 | 21.4% |
[ 4.5% - 5.0% ] 4.96% | 258,732 | 18.4% |
[ 5.0% - 5.5% ] 5.20% | 202,255 | 21.1% |
[ 5.5% - 6.0% ] 5.55% | 102,899 | 20.9% |
[ 5.5% - 6.0% ] 5.87% | 210,385 | 17.2% |
[ 6.0% - 6.5% ] 6.14% | 122,364 | 20.4% |
[ 6.0% - 6.5% ] 6.47% | 101,206 | 22.4% |
[ 6.5% - 7.0% ] 6.71% | 170,716 | 20.4% |
[ 7.0% - 7.5% ] 7.08% | 35,202 | 17.6% |
[ 7.0% - 7.5% ] 7.33% | 41,568 | 18.9% |
[ 7.5% - 8.0% ] 7.64% | 81,898 | 24.1% |
[ 7.5% - 8.0% ] 7.91% | 32,790 | 21.8% |
[ 8.0% - 8.5% ] 8.29% | 66,689 | 15.5% |
[ 8.5% - 9.0% ] 8.54% | 51,635 | 20.9% |
[ 8.5% - 9.0% ] 8.81% | 27,729 | 20.1% |
[ 9.0% - 9.5% ] 9.13% | 17,284 | 31.0% |
[ 9.0% - 9.5% ] 9.47% | 9,473 | 16.8% |
[ 9.5% - 10.0% ] 9.77% | 42,014 | 16.0% |
[ 9.5% - 10.0% ] 9.94% | 3,461 | 27.0% |
[ 10.0% - 10.5% ] 10.38% | 3,286 | 40.4% |
[ 10.5% - 11.0% ] 10.62% | 16,369 | 23.3% |
[ 10.5% - 11.0% ] 10.87% | 3,669 | 20.0% |
[ 11.0% - 11.5% ] 11.27% | 1,340 | 15.4% |
[ 11.0% - 11.5% ] 11.46% | 39,166 | 16.6% |
[ 11.5% - 12.0% ] 11.79% | 1,663 | 19.3% |
[ 12.0% - 12.5% ] 12.16% | 2,640 | 26.4% |
[ 12.0% - 12.5% ] 12.42% | 1,208 | 14.6% |
[ 12.5% - 13.0% ] 12.66% | 5,465 | 21.5% |
[ 12.5% - 13.0% ] 12.96% | 7,216 | 17.2% |
[ 13.5% - 14.0% ] 13.64% | 3,799 | 29.2% |
[ 13.5% - 14.0% ] 13.92% | 2,162 | 11.9% |
[ 14.0% - 14.5% ] 14.29% | 336 | 13.3% |
[ 14.5% - 15.0% ] 14.58% | 1,715 | 16.2% |
[ 14.5% - 15.0% ] 14.94% | 3,306 | 16.1% |
[ 15.0% - 15.5% ] 15.25% | 885 | 20.3% |
[ 15.0% - 15.5% ] 15.41% | 2,259 | 18.4% |
[ 15.5% - 16.0% ] 15.73% | 1,233 | 27.0% |
[ 15.5% - 16.0% ] 15.96% | 639 | 15.9% |
[ 16.0% - 16.5% ] 16.29% | 528 | 14.7% |
[ 16.5% - 17.0% ] 16.64% | 2,151 | 29.2% |
[ 16.5% - 17.0% ] 16.92% | 3,699 | 36.7% |
[ 17.5% - 18.0% ] 17.65% | 119 | 31.6% |
[ 17.5% - 18.0% ] 17.99% | 378 | 15.7% |
[ 19.0% - 19.5% ] 19.40% | 1,139 | 24.2% |
[ 20.0% - 20.5% ] 20.00% | 70 | 17.6% |
[ 20.0% - 20.5% ] 20.17% | 476 | 19.3% |
[ 20.5% - 21.0% ] 20.59% | 816 | 32.6% |
[ 20.5% - 21.0% ] 20.83% | 336 | 32.7% |
[ 21.0% - 21.5% ] 21.19% | 840 | 25.8% |
[ 21.5% - 22.0% ] 21.58% | 505 | 21.3% |
[ 21.5% - 22.0% ] 21.62% | 851 | 32.1% |
[ 23.0% - 23.5% ] 23.08% | 13 | 50.0% |
[ 23.0% - 23.5% ] 23.35% | 1,730 | 21.6% |
[ 23.5% - 24.0% ] 23.60% | 161 | 28.4% |
[ 24.5% - 25.0% ] 24.71% | 348 | 33.9% |
[ 25.0% - 25.5% ] 25.37% | 339 | 33.3% |
[ 26.0% - 26.5% ] 26.32% | 1,345 | 24.7% |
[ 27.0% - 27.5% ] 27.50% | 240 | 25.5% |
[ 27.5% - 28.0% ] 27.78% | 18 | 21.4% |
[ 28.0% - 28.5% ] 28.26% | 138 | 55.1% |
[ 31.0% - 31.5% ] 31.27% | 291 | 29.0% |
[ 36.0% - 36.5% ] 36.00% | 150 | 0.89% |
[ 49.0% - 49.5% ] 49.11% | 112 | 17.9% |
[ 50.0% - 50.5% ] 50.00% | 124 | 33.3% |
[ 63.5% - 64.0% ] 63.74% | 182 | 16.4% |