Yugoslavian 3 or more Vehicles in Household
COMPARE
Yugoslavian
Select to Compare
3 or more Vehicles in Household
Yugoslavian 3 or more Vehicles in Household
19.7%
3+ VEHICLES AVAILABLE
62.9/ 100
METRIC RATING
164th/ 347
METRIC RANK
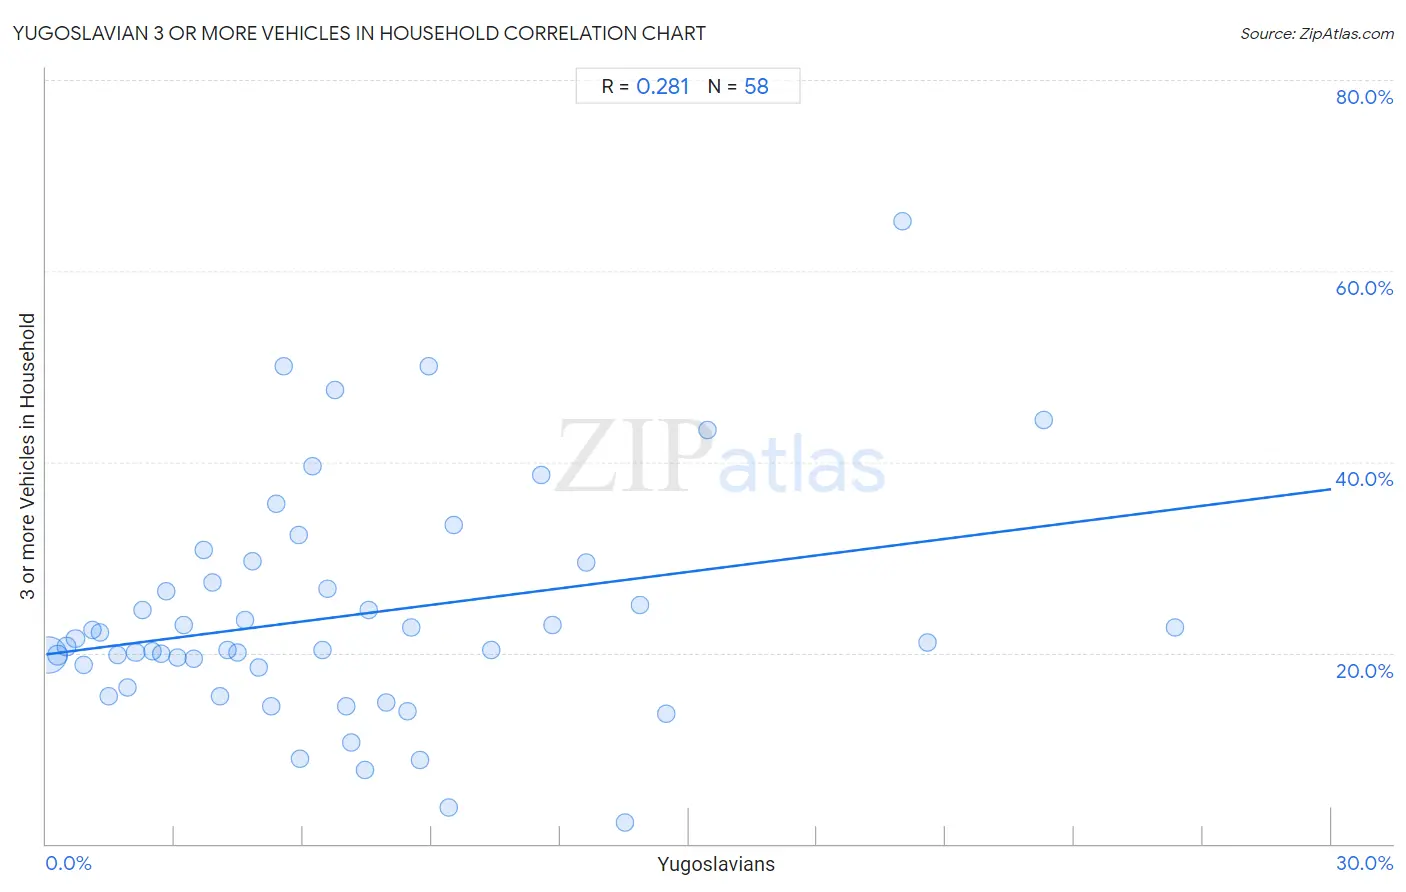
Yugoslavian 3 or more Vehicles in Household Correlation Chart
The statistical analysis conducted on geographies consisting of 285,615,615 people shows a weak positive correlation between the proportion of Yugoslavians and percentage of households with 3 or more vehicles available in the United States with a correlation coefficient (R) of 0.281 and weighted average of 19.7%. On average, for every 1% (one percent) increase in Yugoslavians within a typical geography, there is an increase of 0.58% in percentage of households with 3 or more vehicles available.
It is essential to understand that the correlation between the percentage of Yugoslavians and percentage of households with 3 or more vehicles available does not imply a direct cause-and-effect relationship. It remains uncertain whether the presence of Yugoslavians influences an upward or downward trend in the level of percentage of households with 3 or more vehicles available within an area, or if Yugoslavians simply ended up residing in those areas with higher or lower levels of percentage of households with 3 or more vehicles available due to other factors.
Demographics Similar to Yugoslavians by 3 or more Vehicles in Household
In terms of 3 or more vehicles in household, the demographic groups most similar to Yugoslavians are Chilean (19.7%, a difference of 0.010%), Estonian (19.7%, a difference of 0.030%), Immigrants from Costa Rica (19.7%, a difference of 0.080%), Immigrants from Cameroon (19.7%, a difference of 0.16%), and Immigrants from Guatemala (19.7%, a difference of 0.22%).
| Demographics | Rating | Rank | 3 or more Vehicles in Household |
| Hungarians | 70.5 /100 | #157 | Good 19.8% |
| Armenians | 68.8 /100 | #158 | Good 19.8% |
| Immigrants from Pakistan | 68.2 /100 | #159 | Good 19.8% |
| Immigrants from Lebanon | 67.6 /100 | #160 | Good 19.8% |
| Immigrants from Guatemala | 65.6 /100 | #161 | Good 19.7% |
| Estonians | 63.2 /100 | #162 | Good 19.7% |
| Chileans | 63.0 /100 | #163 | Good 19.7% |
| Yugoslavians | 62.9 /100 | #164 | Good 19.7% |
| Immigrants from Costa Rica | 61.9 /100 | #165 | Good 19.7% |
| Immigrants from Cameroon | 60.9 /100 | #166 | Good 19.7% |
| Ukrainians | 58.9 /100 | #167 | Average 19.6% |
| Peruvians | 58.8 /100 | #168 | Average 19.6% |
| Immigrants from Denmark | 57.6 /100 | #169 | Average 19.6% |
| Iraqis | 56.0 /100 | #170 | Average 19.6% |
| Immigrants from Western Europe | 53.2 /100 | #171 | Average 19.5% |
Yugoslavian 3 or more Vehicles in Household Correlation Summary
| Measurement | Yugoslavian Data | 3 or more Vehicles in Household Data |
| Minimum | 0.060% | 2.3% |
| Maximum | 26.3% | 65.2% |
| Range | 26.3% | 62.9% |
| Mean | 7.0% | 23.9% |
| Median | 5.7% | 20.9% |
| Interquartile 25% (IQ1) | 2.8% | 18.4% |
| Interquartile 75% (IQ3) | 8.9% | 27.3% |
| Interquartile Range (IQR) | 6.1% | 8.9% |
| Standard Deviation (Sample) | 5.8% | 11.9% |
| Standard Deviation (Population) | 5.7% | 11.8% |
Correlation Details
| Yugoslavian Percentile | Sample Size | 3 or more Vehicles in Household |
[ 0.0% - 0.5% ] 0.060% | 238,995,250 | 19.7% |
[ 0.0% - 0.5% ] 0.28% | 27,857,409 | 19.7% |
[ 0.0% - 0.5% ] 0.48% | 8,632,858 | 20.7% |
[ 0.5% - 1.0% ] 0.69% | 3,570,912 | 21.5% |
[ 0.5% - 1.0% ] 0.87% | 2,189,377 | 18.7% |
[ 1.0% - 1.5% ] 1.08% | 1,093,165 | 22.4% |
[ 1.0% - 1.5% ] 1.26% | 751,260 | 22.1% |
[ 1.0% - 1.5% ] 1.47% | 391,529 | 15.5% |
[ 1.5% - 2.0% ] 1.66% | 389,348 | 19.7% |
[ 1.5% - 2.0% ] 1.89% | 374,211 | 16.4% |
[ 2.0% - 2.5% ] 2.09% | 269,208 | 20.1% |
[ 2.0% - 2.5% ] 2.24% | 195,748 | 24.5% |
[ 2.0% - 2.5% ] 2.47% | 115,538 | 20.1% |
[ 2.5% - 3.0% ] 2.68% | 164,492 | 19.9% |
[ 2.5% - 3.0% ] 2.79% | 44,297 | 26.4% |
[ 3.0% - 3.5% ] 3.06% | 28,373 | 19.5% |
[ 3.0% - 3.5% ] 3.22% | 51,003 | 23.0% |
[ 3.0% - 3.5% ] 3.45% | 84,293 | 19.4% |
[ 3.5% - 4.0% ] 3.67% | 5,070 | 30.8% |
[ 3.5% - 4.0% ] 3.88% | 8,180 | 27.3% |
[ 4.0% - 4.5% ] 4.05% | 11,563 | 15.5% |
[ 4.0% - 4.5% ] 4.22% | 32,592 | 20.3% |
[ 4.0% - 4.5% ] 4.47% | 12,261 | 20.1% |
[ 4.5% - 5.0% ] 4.63% | 6,609 | 23.5% |
[ 4.5% - 5.0% ] 4.83% | 10,943 | 29.6% |
[ 4.5% - 5.0% ] 4.97% | 71,284 | 18.4% |
[ 5.0% - 5.5% ] 5.26% | 22,286 | 14.4% |
[ 5.0% - 5.5% ] 5.37% | 1,508 | 35.7% |
[ 5.5% - 6.0% ] 5.56% | 72 | 50.0% |
[ 5.5% - 6.0% ] 5.89% | 950 | 32.4% |
[ 5.5% - 6.0% ] 5.92% | 64,728 | 8.9% |
[ 6.0% - 6.5% ] 6.23% | 835 | 39.5% |
[ 6.0% - 6.5% ] 6.46% | 19,969 | 20.3% |
[ 6.5% - 7.0% ] 6.58% | 3,665 | 26.7% |
[ 6.5% - 7.0% ] 6.75% | 1,022 | 47.5% |
[ 7.0% - 7.5% ] 7.01% | 16,211 | 14.4% |
[ 7.0% - 7.5% ] 7.12% | 4,947 | 10.5% |
[ 7.0% - 7.5% ] 7.43% | 4,873 | 7.8% |
[ 7.5% - 8.0% ] 7.53% | 332 | 24.5% |
[ 7.5% - 8.0% ] 7.93% | 29,089 | 14.9% |
[ 8.0% - 8.5% ] 8.43% | 36,359 | 13.9% |
[ 8.5% - 9.0% ] 8.52% | 622 | 22.7% |
[ 8.5% - 9.0% ] 8.74% | 40,152 | 8.8% |
[ 8.5% - 9.0% ] 8.93% | 56 | 50.0% |
[ 9.0% - 9.5% ] 9.39% | 2,280 | 3.7% |
[ 9.5% - 10.0% ] 9.52% | 105 | 33.3% |
[ 10.0% - 10.5% ] 10.40% | 846 | 20.3% |
[ 11.5% - 12.0% ] 11.55% | 502 | 38.6% |
[ 11.5% - 12.0% ] 11.80% | 881 | 23.0% |
[ 12.5% - 13.0% ] 12.61% | 238 | 29.4% |
[ 13.5% - 14.0% ] 13.51% | 74 | 2.3% |
[ 13.5% - 14.0% ] 13.87% | 137 | 25.0% |
[ 14.0% - 14.5% ] 14.48% | 3,812 | 13.6% |
[ 15.0% - 15.5% ] 15.44% | 136 | 43.4% |
[ 20.0% - 20.5% ] 20.00% | 105 | 65.2% |
[ 20.5% - 21.0% ] 20.59% | 102 | 21.1% |
[ 23.0% - 23.5% ] 23.29% | 73 | 44.4% |
[ 26.0% - 26.5% ] 26.35% | 1,875 | 22.6% |