Tlingit-Haida Disability Age 65 to 74

COMPARE

Tlingit-Haida
Race
Ancestry
AfghanAfricanAlaska NativeAlaskan AthabascanAlbanianAleutAlsatianAmericanApacheArabArapahoArgentineanArmenianAssyrian/Chaldean/SyriacAustralianAustrianBahamianBangladeshiBarbadianBasqueBelgianBelizeanBermudanBhutaneseBlackfeetBolivianBrazilianBritishBritish West IndianBulgarianBurmeseCajunCambodianCanadianCape VerdeanCarpatho RusynCelticCentral AmericanCentral American IndianCherokeeCheyenneChickasawChileanChineseChippewaChoctawColombianColvilleComancheCosta RicanCreeCreekCroatianCrowCubanCypriotCzechCzechoslovakianDanishDelawareDominicanDutchDutch West IndianEastern EuropeanEcuadorianEgyptianEnglishEstonianEthiopianEuropeanFijianFilipinoFinnishFrenchFrench American IndianFrench CanadianGermanGerman RussianGhanaianGreekGuamanian/ChamorroGuatemalanGuyaneseHaitianHmongHonduranHopiHoumaHungarianIcelanderIndian (Asian)IndonesianInupiatIranianIraqiIrishIroquoisIsraeliItalianJamaicanJapaneseJordanianKenyanKiowaKoreanLaotianLatvianLebaneseLiberianLithuanianLumbeeLuxembourgerMacedonianMalaysianMalteseMarshalleseMenomineeMexicanMexican American IndianMongolianMoroccanNative HawaiianNavajoNepaleseNew ZealanderNicaraguanNigerianNorthern EuropeanNorwegianOkinawanOsageOttawaPaiutePakistaniPalestinianPanamanianParaguayanPennsylvania GermanPeruvianPimaPolishPortuguesePotawatomiPuebloPuerto RicanPuget Sound SalishRomanianRussianSalvadoranSamoanScandinavianScotch-IrishScottishSeminoleSenegaleseSerbianShoshoneSierra LeoneanSiouxSlavicSlovakSloveneSomaliSouth AfricanSouth AmericanSouth American IndianSoviet UnionSpaniardSpanishSpanish AmericanSpanish American IndianSri LankanSubsaharan AfricanSudaneseSwedishSwissSyrianTaiwaneseThaiTlingit-HaidaTohono O'OdhamTonganTrinidadian and TobagonianTsimshianTurkishU.S. Virgin IslanderUgandanUkrainianUruguayanUteVenezuelanVietnameseWelshWest IndianYakamaYaquiYugoslavianYumanYup'ikZimbabwean
Immigration
NonimmigrantsImmigrantsAfghanistanAfricaAlbaniaArgentinaArmeniaAsiaAustraliaAustriaBahamasBangladeshBarbadosBelarusBelgiumBelizeBoliviaBosnia and HerzegovinaBrazilBulgariaBurma/MyanmarCabo VerdeCambodiaCameroonCanadaCaribbeanCentral AmericaChileChinaColombiaCongoCosta RicaCroatiaCubaCzechoslovakiaDenmarkDominicaDominican RepublicEastern AfricaEastern AsiaEastern EuropeEcuadorEgyptEl SalvadorEnglandEritreaEthiopiaEuropeFijiFranceGermanyGhanaGreeceGrenadaGuatemalaGuyanaHaitiHondurasHong KongHungaryIndiaIndonesiaIranIraqIrelandIsraelItalyJamaicaJapanJordanKazakhstanKenyaKoreaKuwaitLaosLatin AmericaLatviaLebanonLiberiaLithuaniaMalaysiaMexicoMicronesiaMiddle AfricaMoldovaMoroccoNepalNetherlandsNicaraguaNigeriaNorth AmericaNorth MacedoniaNorthern AfricaNorthern EuropeNorwayOceaniaPakistanPanamaPeruPhilippinesPolandPortugalRomaniaRussiaSaudi ArabiaScotlandSenegalSerbiaSierra LeoneSingaporeSomaliaSouth AfricaSouth AmericaSouth Central AsiaSouth Eastern AsiaSouthern EuropeSpainSri LankaSt. Vincent and the GrenadinesSudanSwedenSwitzerlandSyriaTaiwanThailandTrinidad and TobagoTurkeyUgandaUkraineUruguayUzbekistanVenezuelaVietnamWest IndiesWestern AfricaWestern AsiaWestern EuropeYemenZaireZimbabweAzores
Select to Compare
Race
Ancestry
AfghanAfricanAlaska NativeAlaskan AthabascanAlbanianAleutAlsatianAmericanApacheArabArapahoArgentineanArmenianAssyrian/Chaldean/SyriacAustralianAustrianBahamianBangladeshiBarbadianBasqueBelgianBelizeanBermudanBhutaneseBlackfeetBolivianBrazilianBritishBritish West IndianBulgarianBurmeseCajunCambodianCanadianCape VerdeanCarpatho RusynCelticCentral AmericanCentral American IndianCherokeeCheyenneChickasawChileanChineseChippewaChoctawColombianColvilleComancheCosta RicanCreeCreekCroatianCrowCubanCypriotCzechCzechoslovakianDanishDelawareDominicanDutchDutch West IndianEastern EuropeanEcuadorianEgyptianEnglishEstonianEthiopianEuropeanFijianFilipinoFinnishFrenchFrench American IndianFrench CanadianGermanGerman RussianGhanaianGreekGuamanian/ChamorroGuatemalanGuyaneseHaitianHmongHonduranHopiHoumaHungarianIcelanderIndian (Asian)IndonesianInupiatIranianIraqiIrishIroquoisIsraeliItalianJamaicanJapaneseJordanianKenyanKiowaKoreanLaotianLatvianLebaneseLiberianLithuanianLumbeeLuxembourgerMacedonianMalaysianMalteseMarshalleseMenomineeMexicanMexican American IndianMongolianMoroccanNative HawaiianNavajoNepaleseNew ZealanderNicaraguanNigerianNorthern EuropeanNorwegianOkinawanOsageOttawaPaiutePakistaniPalestinianPanamanianParaguayanPennsylvania GermanPeruvianPimaPolishPortuguesePotawatomiPuebloPuerto RicanPuget Sound SalishRomanianRussianSalvadoranSamoanScandinavianScotch-IrishScottishSeminoleSenegaleseSerbianShoshoneSierra LeoneanSiouxSlavicSlovakSloveneSomaliSouth AfricanSouth AmericanSouth American IndianSoviet UnionSpaniardSpanishSpanish AmericanSpanish American IndianSri LankanSubsaharan AfricanSudaneseSwedishSwissSyrianTaiwaneseThaiTohono O'OdhamTonganTrinidadian and TobagonianTsimshianTurkishU.S. Virgin IslanderUgandanUkrainianUruguayanUteVenezuelanVietnameseWelshWest IndianYakamaYaquiYugoslavianYumanYup'ikZimbabwean
Immigration
NonimmigrantsImmigrantsAfghanistanAfricaAlbaniaArgentinaArmeniaAsiaAustraliaAustriaBahamasBangladeshBarbadosBelarusBelgiumBelizeBoliviaBosnia and HerzegovinaBrazilBulgariaBurma/MyanmarCabo VerdeCambodiaCameroonCanadaCaribbeanCentral AmericaChileChinaColombiaCongoCosta RicaCroatiaCubaCzechoslovakiaDenmarkDominicaDominican RepublicEastern AfricaEastern AsiaEastern EuropeEcuadorEgyptEl SalvadorEnglandEritreaEthiopiaEuropeFijiFranceGermanyGhanaGreeceGrenadaGuatemalaGuyanaHaitiHondurasHong KongHungaryIndiaIndonesiaIranIraqIrelandIsraelItalyJamaicaJapanJordanKazakhstanKenyaKoreaKuwaitLaosLatin AmericaLatviaLebanonLiberiaLithuaniaMalaysiaMexicoMicronesiaMiddle AfricaMoldovaMoroccoNepalNetherlandsNicaraguaNigeriaNorth AmericaNorth MacedoniaNorthern AfricaNorthern EuropeNorwayOceaniaPakistanPanamaPeruPhilippinesPolandPortugalRomaniaRussiaSaudi ArabiaScotlandSenegalSerbiaSierra LeoneSingaporeSomaliaSouth AfricaSouth AmericaSouth Central AsiaSouth Eastern AsiaSouthern EuropeSpainSri LankaSt. Vincent and the GrenadinesSudanSwedenSwitzerlandSyriaTaiwanThailandTrinidad and TobagoTurkeyUgandaUkraineUruguayUzbekistanVenezuelaVietnamWest IndiesWestern AfricaWestern AsiaWestern EuropeYemenZaireZimbabweAzores
Disability Age 65 to 74
Income
Poverty
Unemployment
Labor Participation
Family Structure
Vehicle Availability
Education Level
Disability

Tlingit-Haida Disability Age 65 to 74
Tragic

27.1%
DISABILITY | AGE 65 TO 74
0.0/ 100
METRIC RATING
303rd/ 347
METRIC RANK

Tlingit-Haida Disability Age 65 to 74 Correlation Chart

The statistical analysis conducted on geographies consisting of 60,808,898 people shows a substantial positive correlation between the proportion of Tlingit-Haida and percentage of population with a disability between the ages 65 and 75 in the United States with a correlation coefficient (R) of 0.567 and weighted average of 27.1%. On average, for every 1% (one percent) increase in Tlingit-Haida within a typical geography, there is an increase of 0.30% in percentage of population with a disability between the ages 65 and 75.
Tlingit-Haida Disability Age 65 to 74
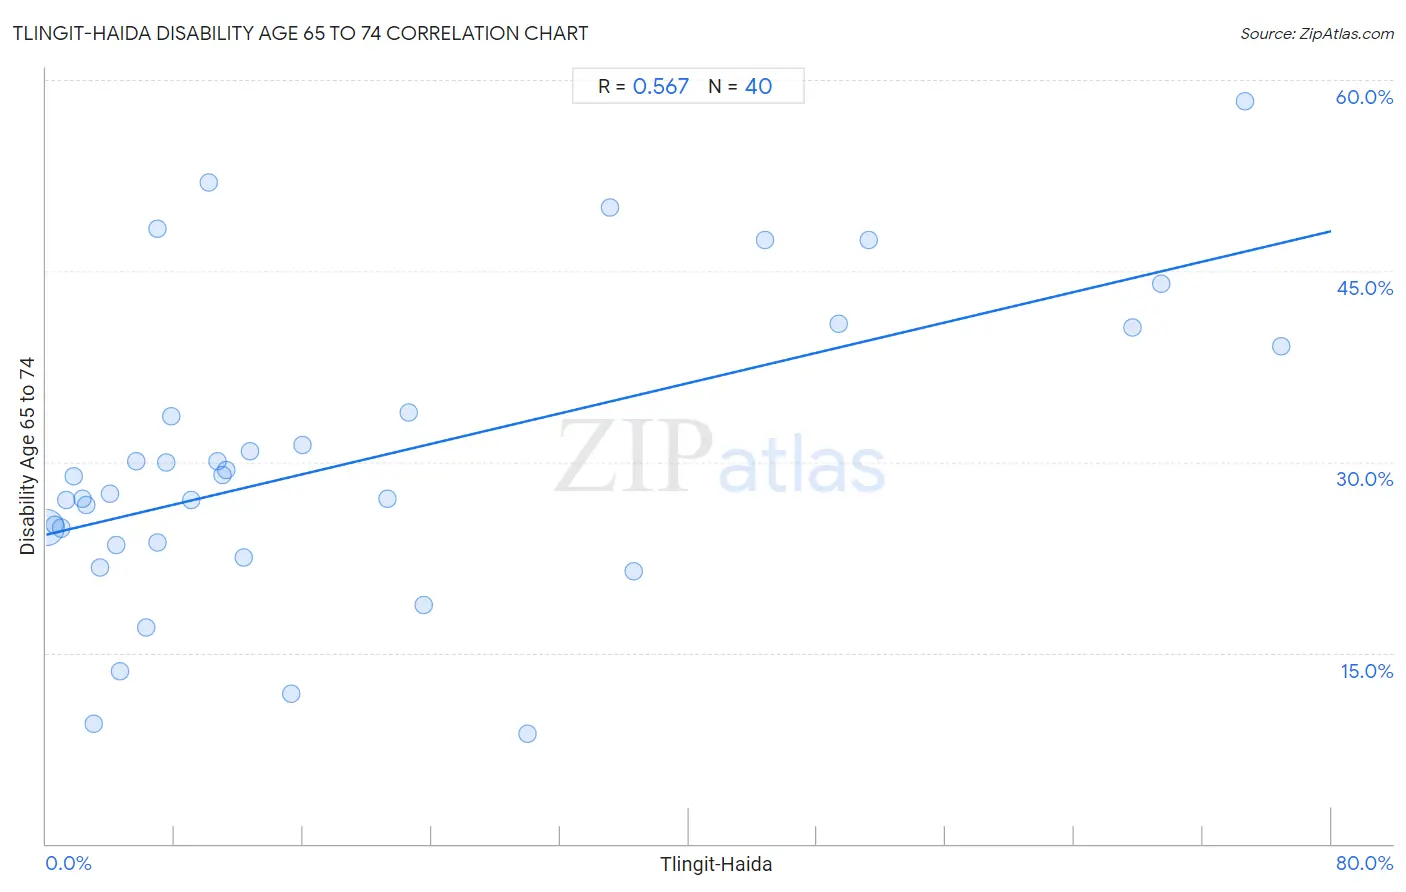
It is essential to understand that the correlation between the percentage of Tlingit-Haida and percentage of population with a disability between the ages 65 and 75 does not imply a direct cause-and-effect relationship. It remains uncertain whether the presence of Tlingit-Haida influences an upward or downward trend in the level of percentage of population with a disability between the ages 65 and 75 within an area, or if Tlingit-Haida simply ended up residing in those areas with higher or lower levels of percentage of population with a disability between the ages 65 and 75 due to other factors.

Demographics Similar to Tlingit-Haida by Disability Age 65 to 74

In terms of disability age 65 to 74, the demographic groups most similar to Tlingit-Haida are Central American Indian (27.1%, a difference of 0.060%), Immigrants from Mexico (27.1%, a difference of 0.070%), Puget Sound Salish (27.2%, a difference of 0.12%), Mexican (27.2%, a difference of 0.22%), and Immigrants from Dominican Republic (27.0%, a difference of 0.39%).
DemographicsRating | RankDisability Age 65 to 74
Bangladeshis
0.0
/100
|
#296
Tragic
26.8%
Fijians
0.0
/100
|
#297
Tragic
27.0%
Immigrants from Yemen
0.0
/100
|
#298
Tragic
27.0%
Potawatomi
0.0
/100
|
#299
Tragic
27.0%
Immigrants from Dominican Republic
0.0
/100
|
#300
Tragic
27.0%
Immigrants from Mexico
0.0
/100
|
#301
Tragic
27.1%
Central American Indians
0.0
/100
|
#302
Tragic
27.1%
Tlingit-Haida
0.0
/100
|
#303
Tragic
27.1%
Puget Sound Salish
0.0
/100
|
#304
Tragic
27.2%
Mexicans
0.0
/100
|
#305
Tragic
27.2%
Blacks/African Americans
0.0
/100
|
#306
Tragic
27.3%
Ute
0.0
/100
|
#307
Tragic
27.3%
Sioux
0.0
/100
|
#308
Tragic
27.3%
Yaqui
0.0
/100
|
#309
Tragic
27.4%
Shoshone
0.0
/100
|
#310
Tragic
27.4%

Tlingit-Haida Disability Age 65 to 74 Correlation Summary

MeasurementTlingit-Haida DataDisability Age 65 to 74 Data
Minimum0.036%8.6%
Maximum76.8%58.3%
Range76.8%49.7%
Mean19.5%30.1%
Median10.4%28.2%
Interquartile 25% (IQ1)4.2%23.5%
Interquartile 75% (IQ3)26.7%36.5%
Interquartile Range (IQR)22.6%12.9%
Standard Deviation (Sample)22.3%11.7%
Standard Deviation (Population)22.0%11.6%

Correlation Details

Tlingit-Haida PercentileSample SizeDisability Age 65 to 74
[
0.0%
-
0.5%
]
0.036%
58,981,56524.8%
[
0.5%
-
1.0%
]
0.54%
1,305,59925.1%
[
0.5%
-
1.0%
]
0.91%
244,24424.8%
[
1.0%
-
1.5%
]
1.24%
85,03027.0%
[
1.5%
-
2.0%
]
1.71%
25,68528.9%
[
2.0%
-
2.5%
]
2.28%
8,44727.1%
[
2.0%
-
2.5%
]
2.46%
3,65526.7%
[
2.5%
-
3.0%
]
2.92%
6,2319.4%
[
3.0%
-
3.5%
]
3.33%
10,38821.7%
[
3.5%
-
4.0%
]
3.97%
1,96427.5%
[
4.0%
-
4.5%
]
4.35%
11523.4%
[
4.5%
-
5.0%
]
4.62%
82213.5%
[
5.5%
-
6.0%
]
5.62%
1,76230.0%
[
6.0%
-
6.5%
]
6.21%
17717.0%
[
6.5%
-
7.0%
]
6.91%
56448.3%
[
6.5%
-
7.0%
]
6.94%
2,14623.6%
[
7.0%
-
7.5%
]
7.50%
4030.0%
[
7.5%
-
8.0%
]
7.80%
1,25733.6%
[
8.5%
-
9.0%
]
9.00%
6,69127.0%
[
10.0%
-
10.5%
]
10.13%
2,90251.9%
[
10.5%
-
11.0%
]
10.70%
29,93330.1%
[
11.0%
-
11.5%
]
11.00%
32,10829.0%
[
11.0%
-
11.5%
]
11.18%
13,91329.3%
[
12.0%
-
12.5%
]
12.26%
18,04122.5%
[
12.5%
-
13.0%
]
12.66%
8,64730.9%
[
15.0%
-
15.5%
]
15.26%
2,16911.8%
[
15.5%
-
16.0%
]
15.92%
1,72731.3%
[
21.0%
-
21.5%
]
21.23%
4,26727.1%
[
22.5%
-
23.0%
]
22.55%
1,07333.9%
[
23.5%
-
24.0%
]
23.53%
8518.8%
[
29.5%
-
30.0%
]
29.96%
1,1288.6%
[
35.0%
-
35.5%
]
35.09%
5750.0%
[
36.5%
-
37.0%
]
36.59%
8221.4%
[
44.5%
-
45.0%
]
44.78%
92047.5%
[
49.0%
-
49.5%
]
49.33%
1,79240.8%
[
51.0%
-
51.5%
]
51.24%
80447.5%
[
67.5%
-
68.0%
]
67.59%
36140.5%
[
69.0%
-
69.5%
]
69.41%
1,60244.0%
[
74.5%
-
75.0%
]
74.63%
6758.3%
[
76.5%
-
77.0%
]
76.85%
83839.1%